Molecular architecture of the human tRNA ligase complex
- Department of Biochemistry, University of Zurich, Switzerland
- Max Perutz Labs, Vienna BioCenter (VBC), Austria
- Department of Biology, Institute of Molecular Systems Biology, ETH Zurich, Switzerland
Figures
Figure 1 with 1 supplement
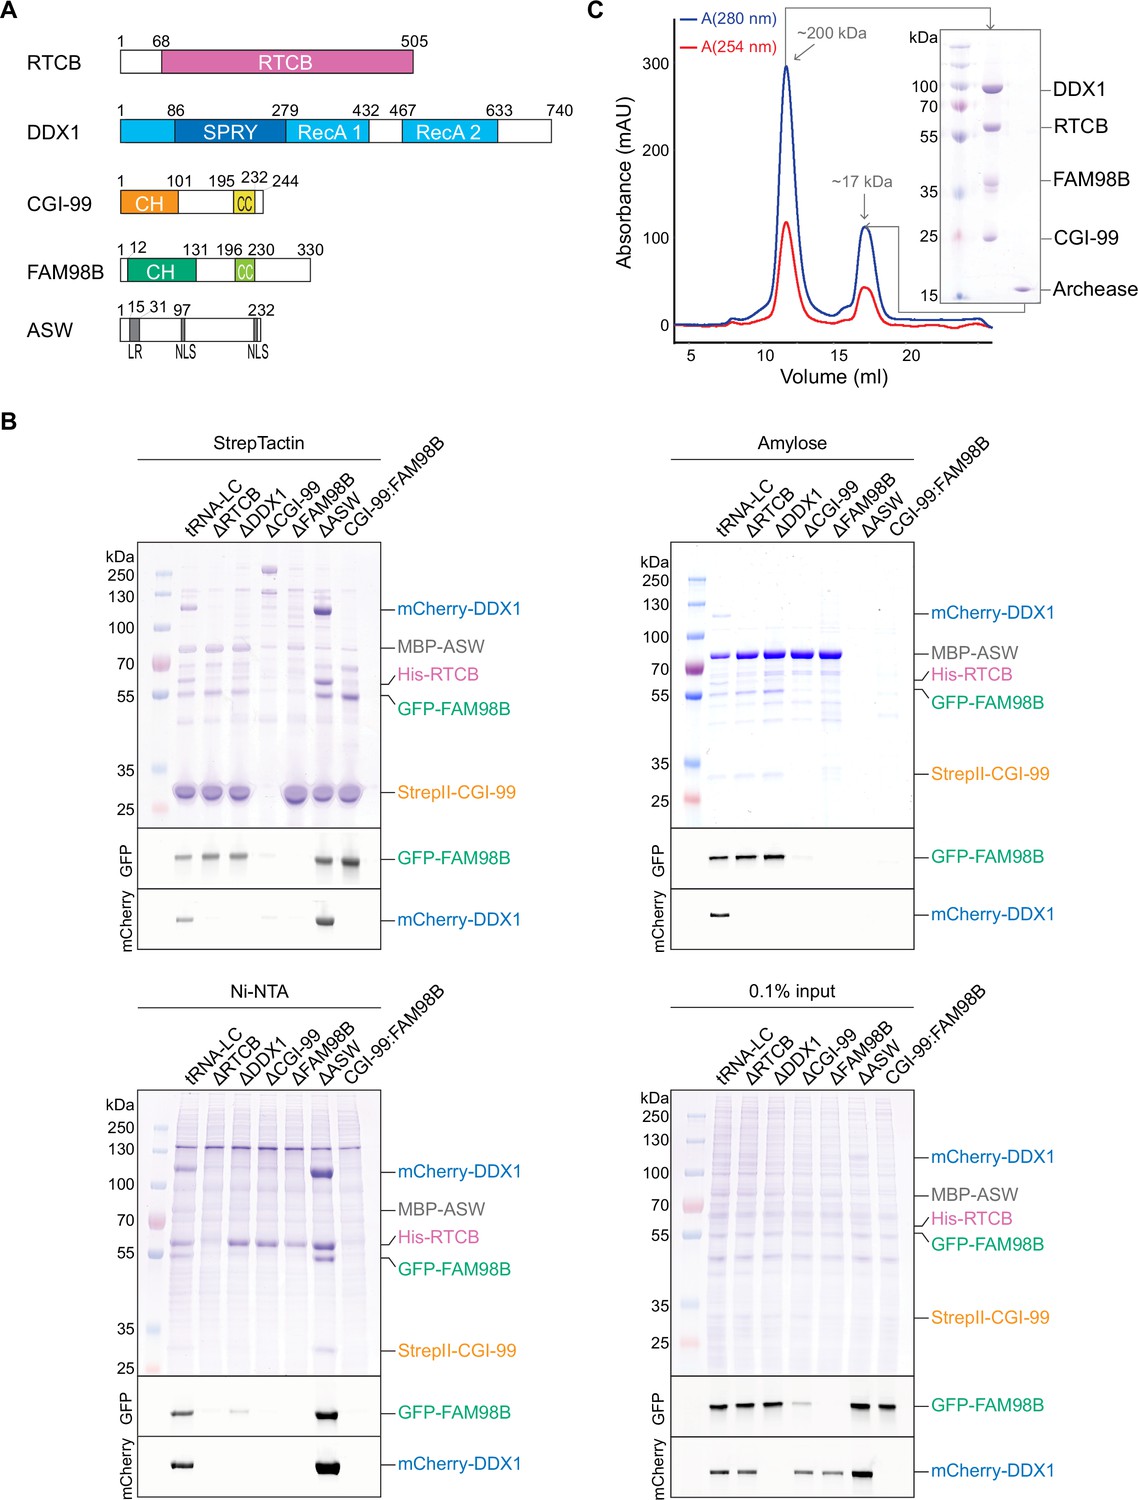
The core tRNA ligase complex consists of RTCB, DDX1, FAM98B, and CGI-99.
(A) Domain composition of tRNA-LC subunits. RecA, RecA-like domain; CH, calponin homology-like domain; CC, coiled coil; LR, leucine-rich region; NLS, nuclear localization signal. (B) Deletion analysis of tRNA-LC subunits. StrepTactin (upper left), Amylose (upper right), and Ni-NTA (bottom left) affinity pull-down assays using lysates of Sf9 cells expressing full-length tRNA-LC subunits (affinity tags as indicated in the figure). The input (bottom right) and bound fractions were analyzed by SDS-PAGE and visualized by in-gel GFP (middle gel) or mCherry (bottom gel) fluorescence followed by Coomassie Blue staining (upper gel). tRNA-LC = RTCB:DDX1:FAM98B:CGI-99:ASW, omitted subunits in the deletion constructs are indicated (Δ). (C) Size-exclusion chromatography interaction analysis of the core tRNA-LC (RTCB:DDX1:FAM98B:CGI-99) and Archease. SDS-PAGE analysis of the elution peak components is shown in the inset. The estimated molecular weights of the peaks based on their elution volumes are indicated.
Figure 1—figure supplement 1
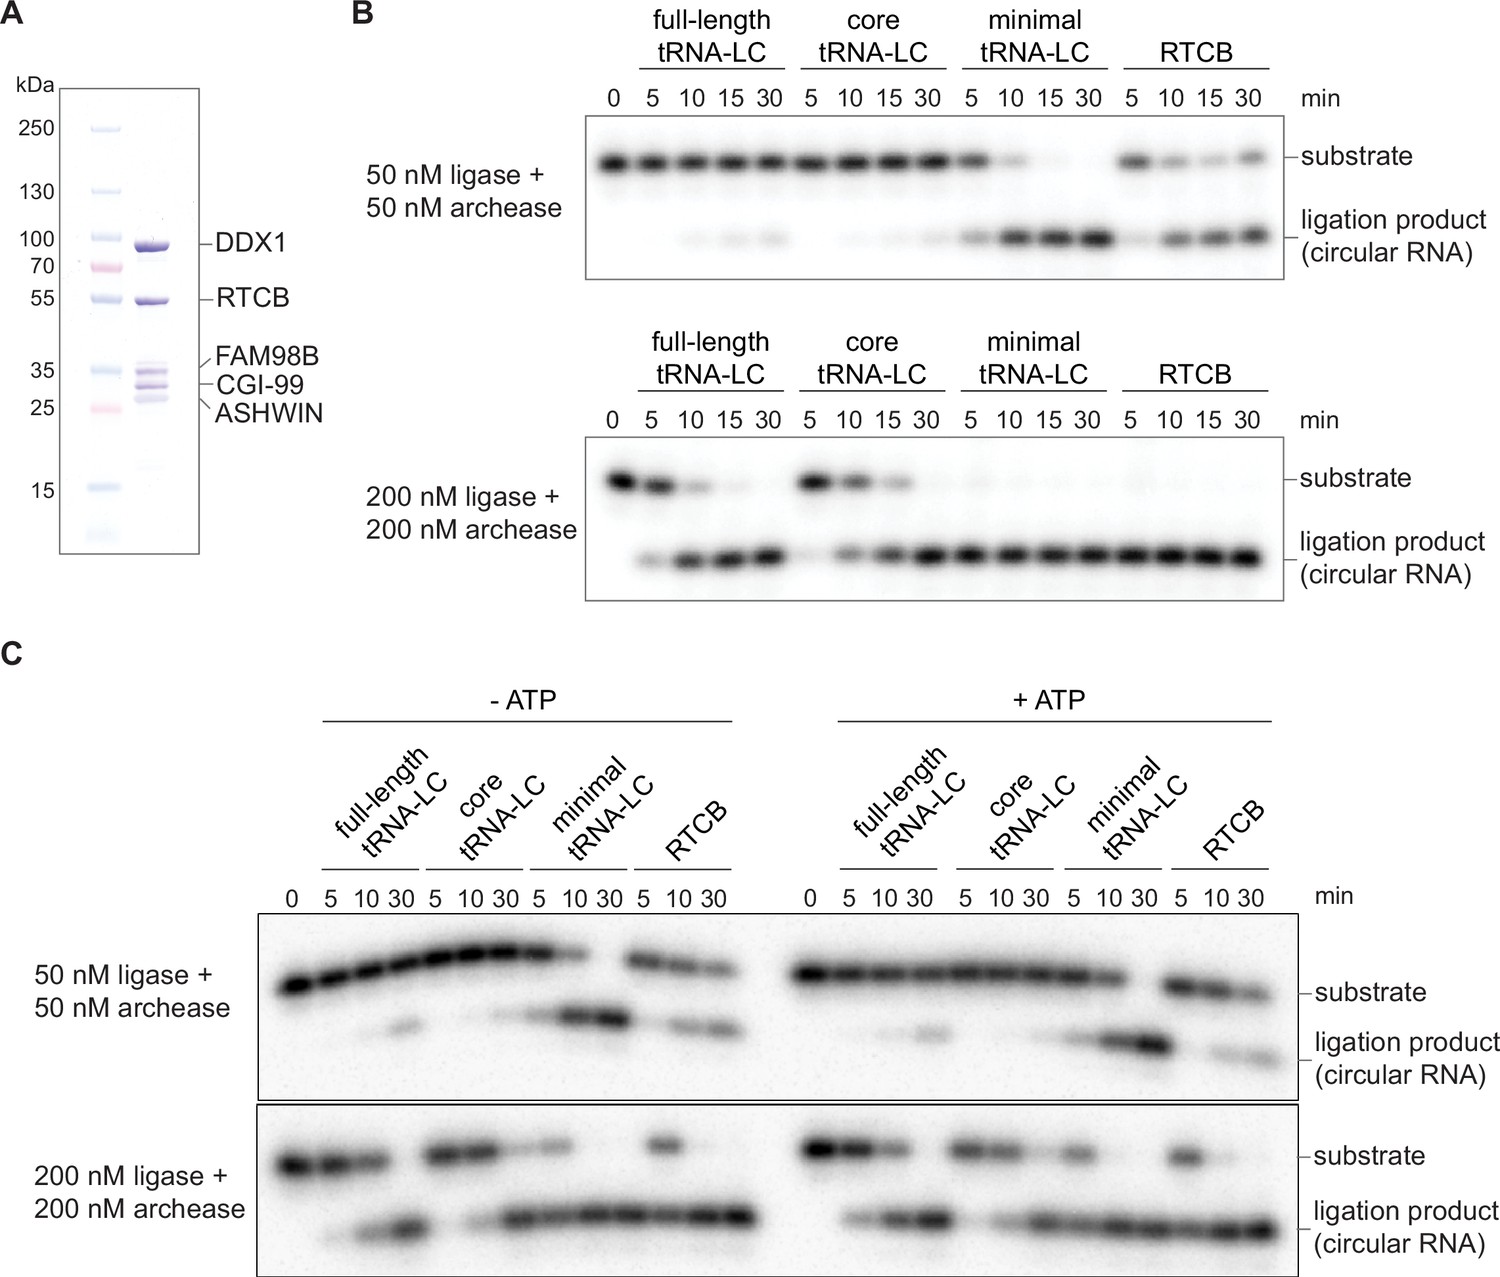
The recombinantly expressed tRNA-LC is catalytically active.
(A) SDS-PAGE analysis of the purified human tRNA-LC containing RTCB, DDX1, FAM98B, CGI-99, and ASHWIN. (B) In vitro RNA circularization ligation assay. Recombinant full-length tRNA-LC (RTCB:DDX1:FAM98B:CGI-99:ASHWIN), core tRNA-LC (RTCB:DDX1:FAM98B:CGI-99), minimal tRNA-LC (RTCB:DDX1(696-740):FAM98B(200-239):CGI-99(102-244)), and RTCB were incubated with radiolabeled 21-nt single-stranded RNA in the presence of Archease. RNA circularization was analyzed by denaturing PAGE and visualized by autoradiography. (C) In vitro RNA circularization ligation assay as in (B) with or without ATP.
Figure 2 with 1 supplement
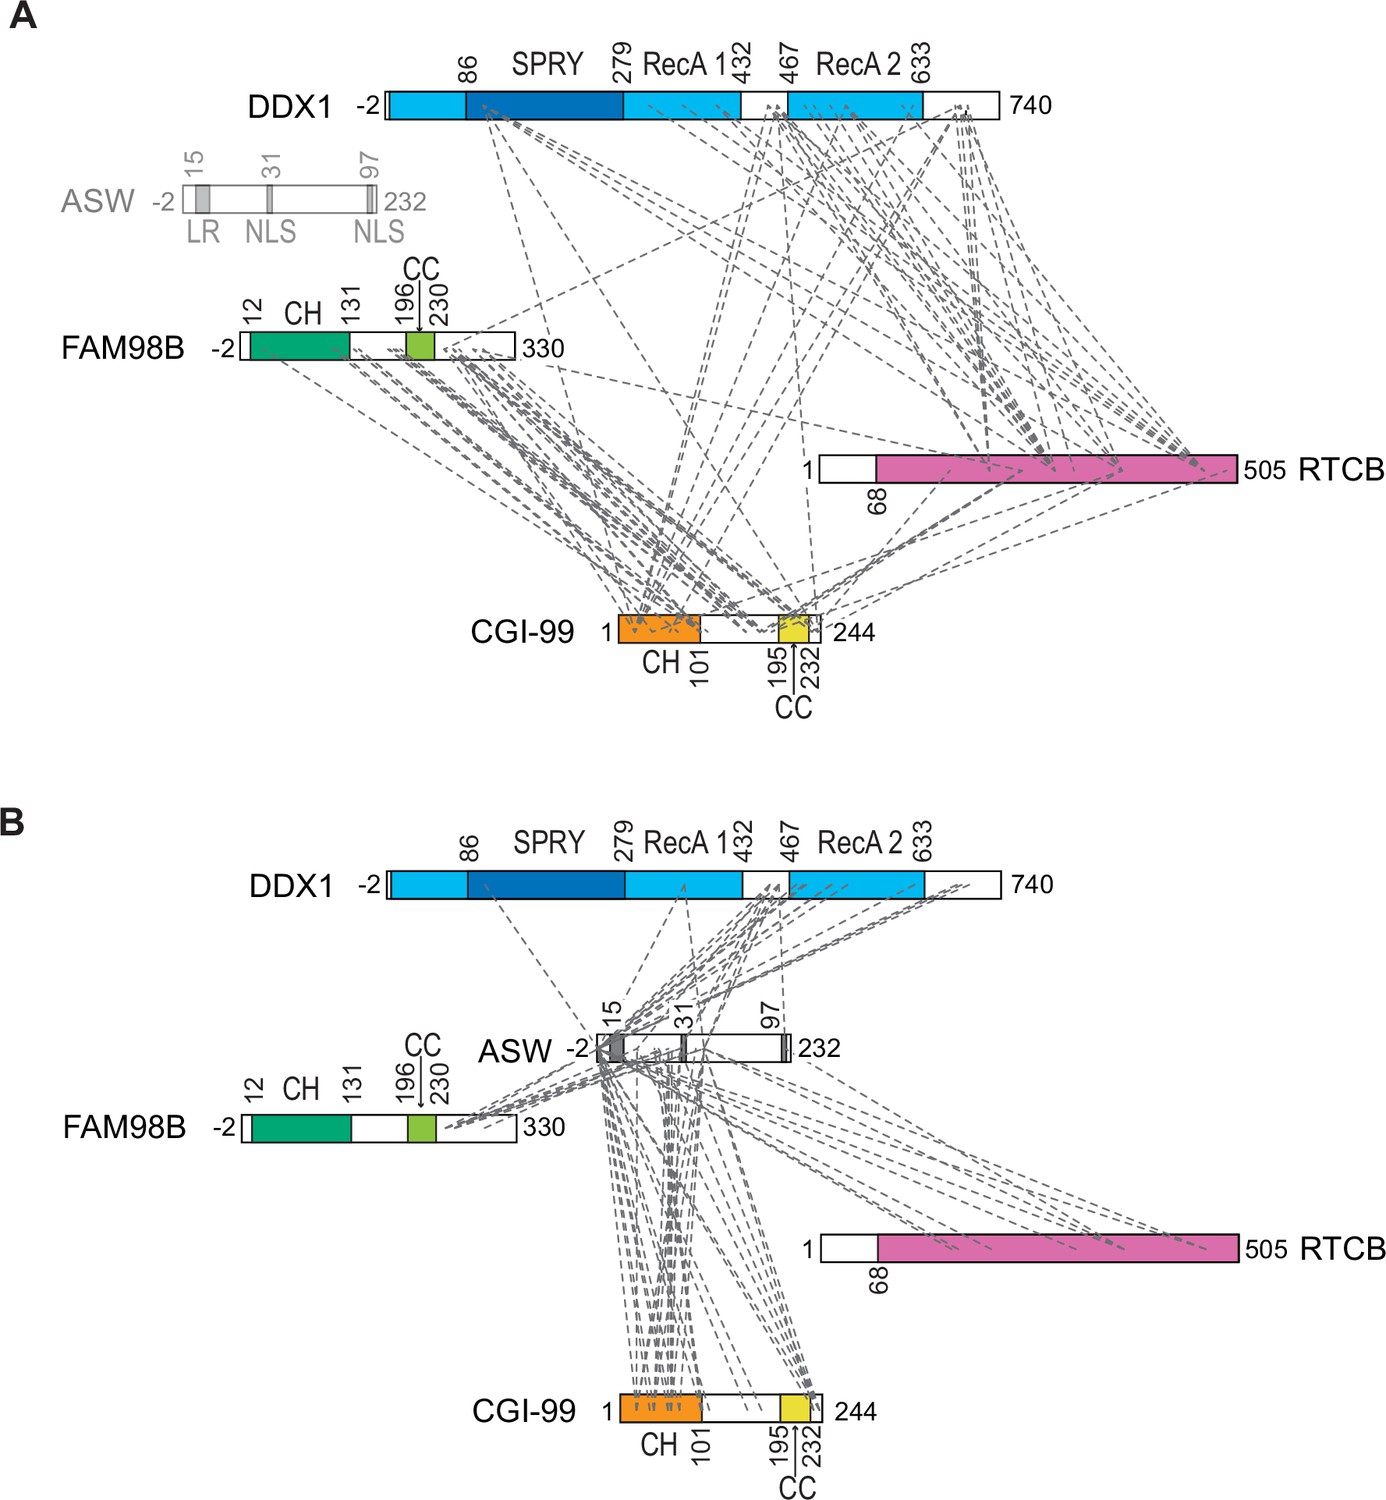
Cross-linking mass spectrometry analysis of the inter-subunit interactions within the five-subunit tRNA-LC (RTCB:DDX1:FAM98B:CGI-99:ASW).
(A) Inter-subunit cross-links between RTCB, DDX1, CGI-99, and FAM98B subunits within the five-subunit full tRNA-LC are shown as dashed lines. (B) Inter-subunit cross-links between ASW and the remaining subunits of the full tRNA-LC. Domain schematic as in Figure 1A. The dashed lines indicate cross-links observed at least once in two replicates.
-
Figure 2—source data 1
Cross-links identified in the cross-linking and mass spectrometric (XL-MS) analysis of the full tRNA-LC.
- https://cdn.elifesciences.org/articles/71656/elife-71656-fig2-data1-v2.xlsx
-
Figure 2—source data 2
Cross-links identified in the cross-linking and mass spectrometric (XL-MS) analysis of the core tRNA-LC.
- https://cdn.elifesciences.org/articles/71656/elife-71656-fig2-data2-v2.xlsx
Figure 2—figure supplement 1
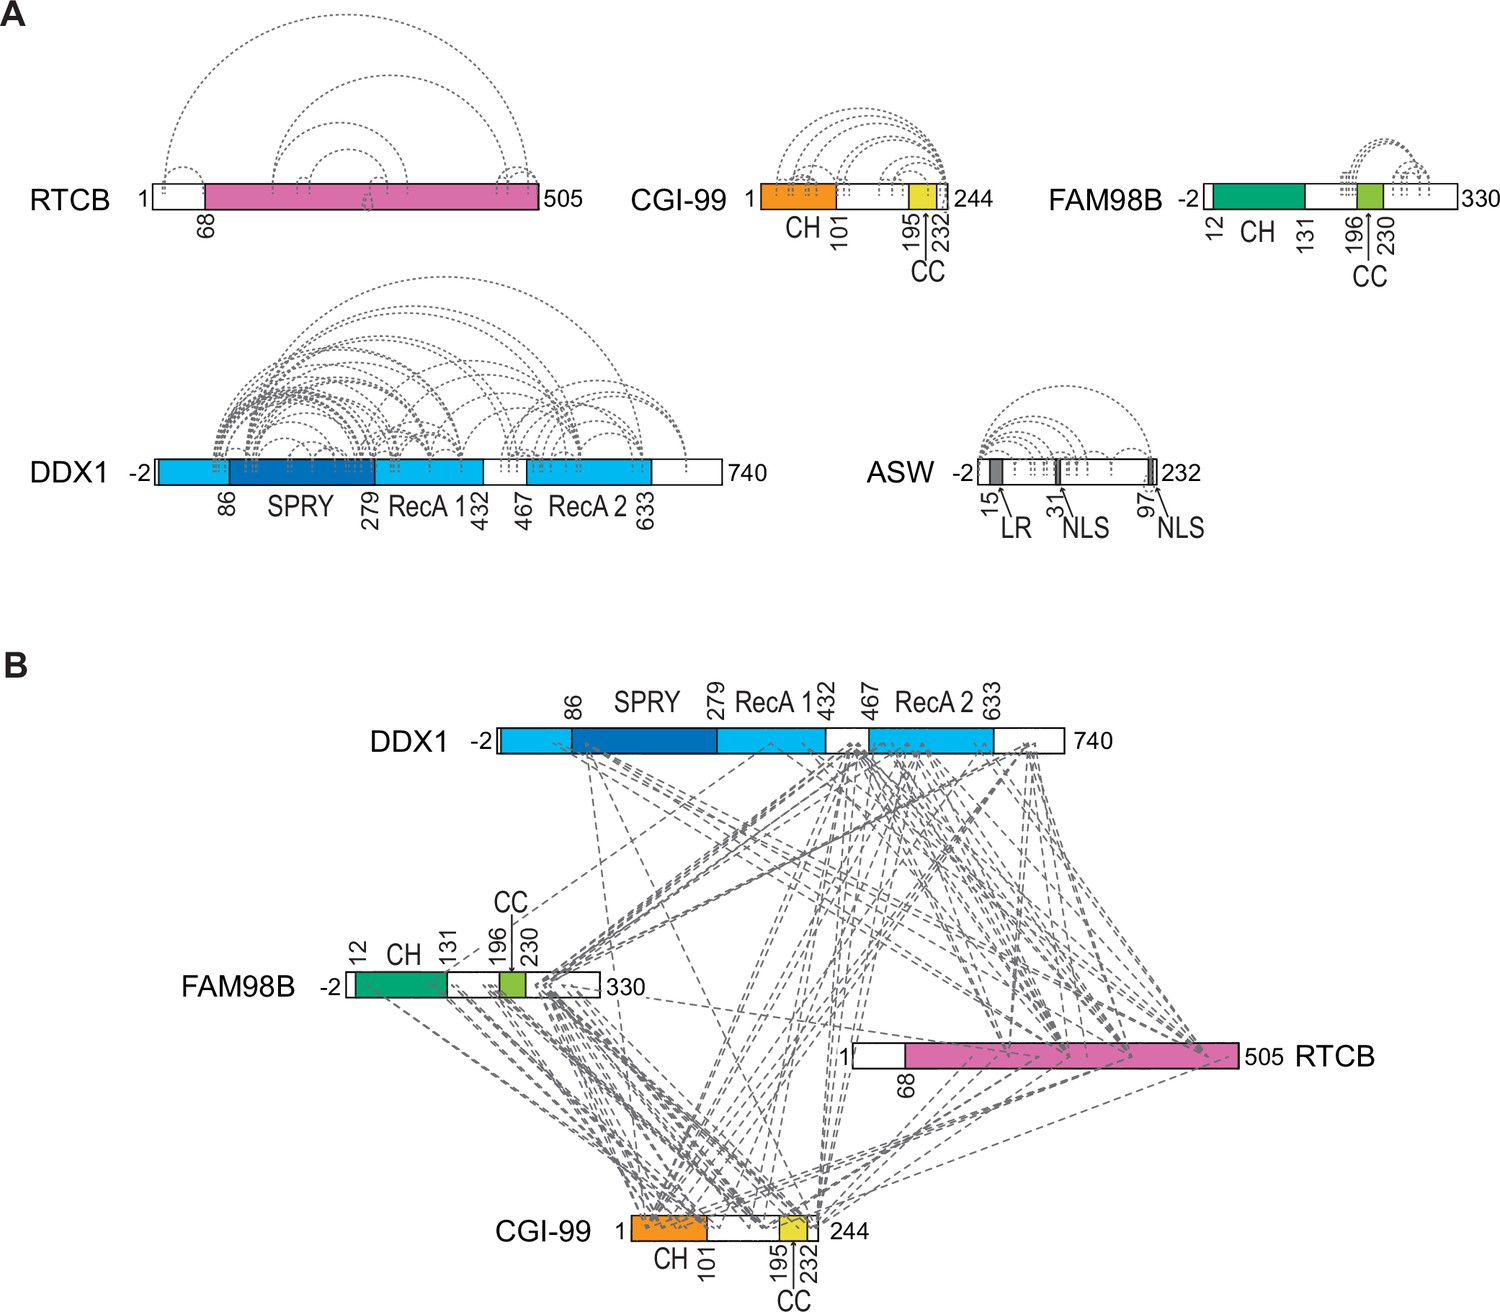
Cross-linking mass spectrometry analysis of tRNA-LC.
(A) Intra-molecular cross-links identified in the five-subunit tRNA-LC sample are shown as dashed lines. (B) Inter-molecular cross-links identified in the four-subunit core tRNA-LC containing RTCB, DDX1, FAM98B, and CGI-99 subunits. Domain composition is indicated as in Figure 1A. The dashed lines indicate cross-links observed at least once in two replicates.
Figure 3 with 1 supplement
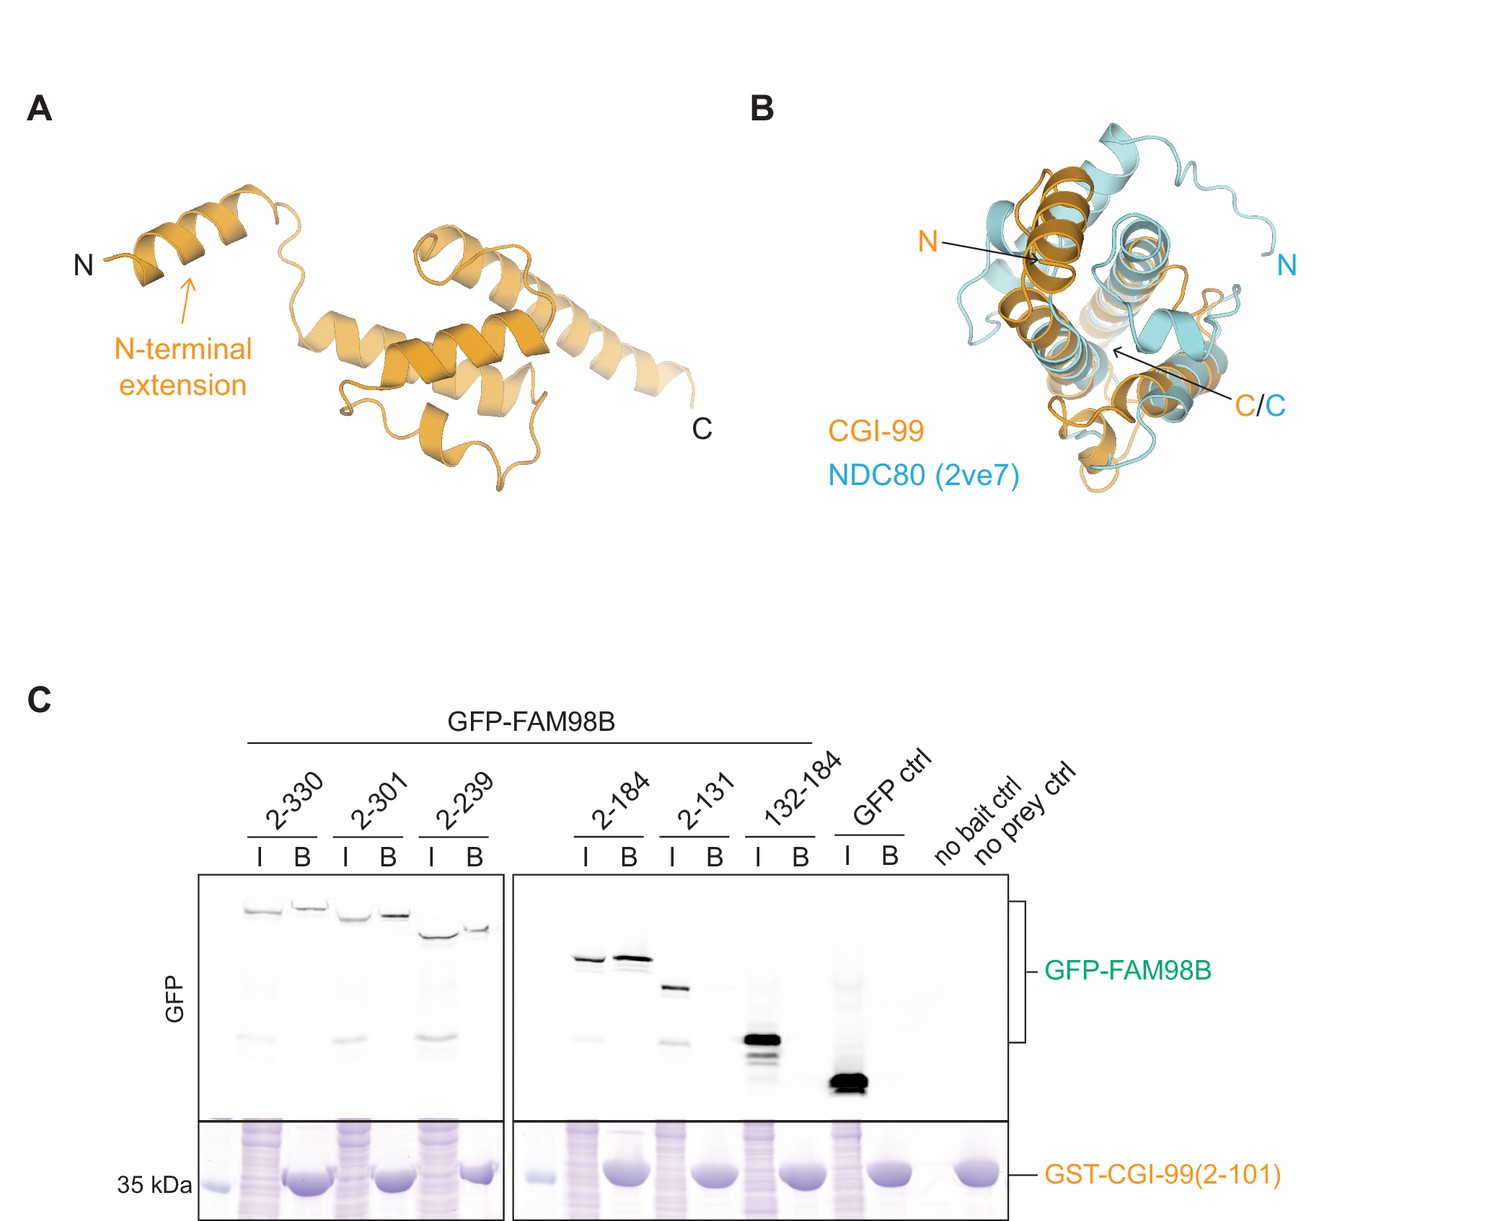
The interaction of CGI-99 and FAM98B is mediated via their N-terminal regions.
(A) Crystal structure of the N-terminal region of human CGI-99 (residues 2–101). The N- and C-termini, as well as the N-terminal extension of CGI-99 (residues 2–18), are indicated. (B) DALI pairwise alignment of CGI-99(2-101) (yellow) with human NDC80 (blue, PDB ID: 2ve7). (C) Pull-down assays using pre-immobilized GST-CGI-99(2-101) with lysates from HEK293T cells transiently overexpressing HA-(StrepII)2-GFP-FAM98B constructs. The input (I) and bound (B) fractions were analyzed by SDS-PAGE and visualized by in-gel GFP fluorescence (upper panel) followed by Coomassie Blue staining (lower panel). The ‘no bait’ control contained HEK293T lysate incubated with GSH resin in the absence of GST-CGI-99, ‘no prey ctrl’ contained GSH resin incubated with GST-CGI-99(2-101).
Figure 3—figure supplement 1
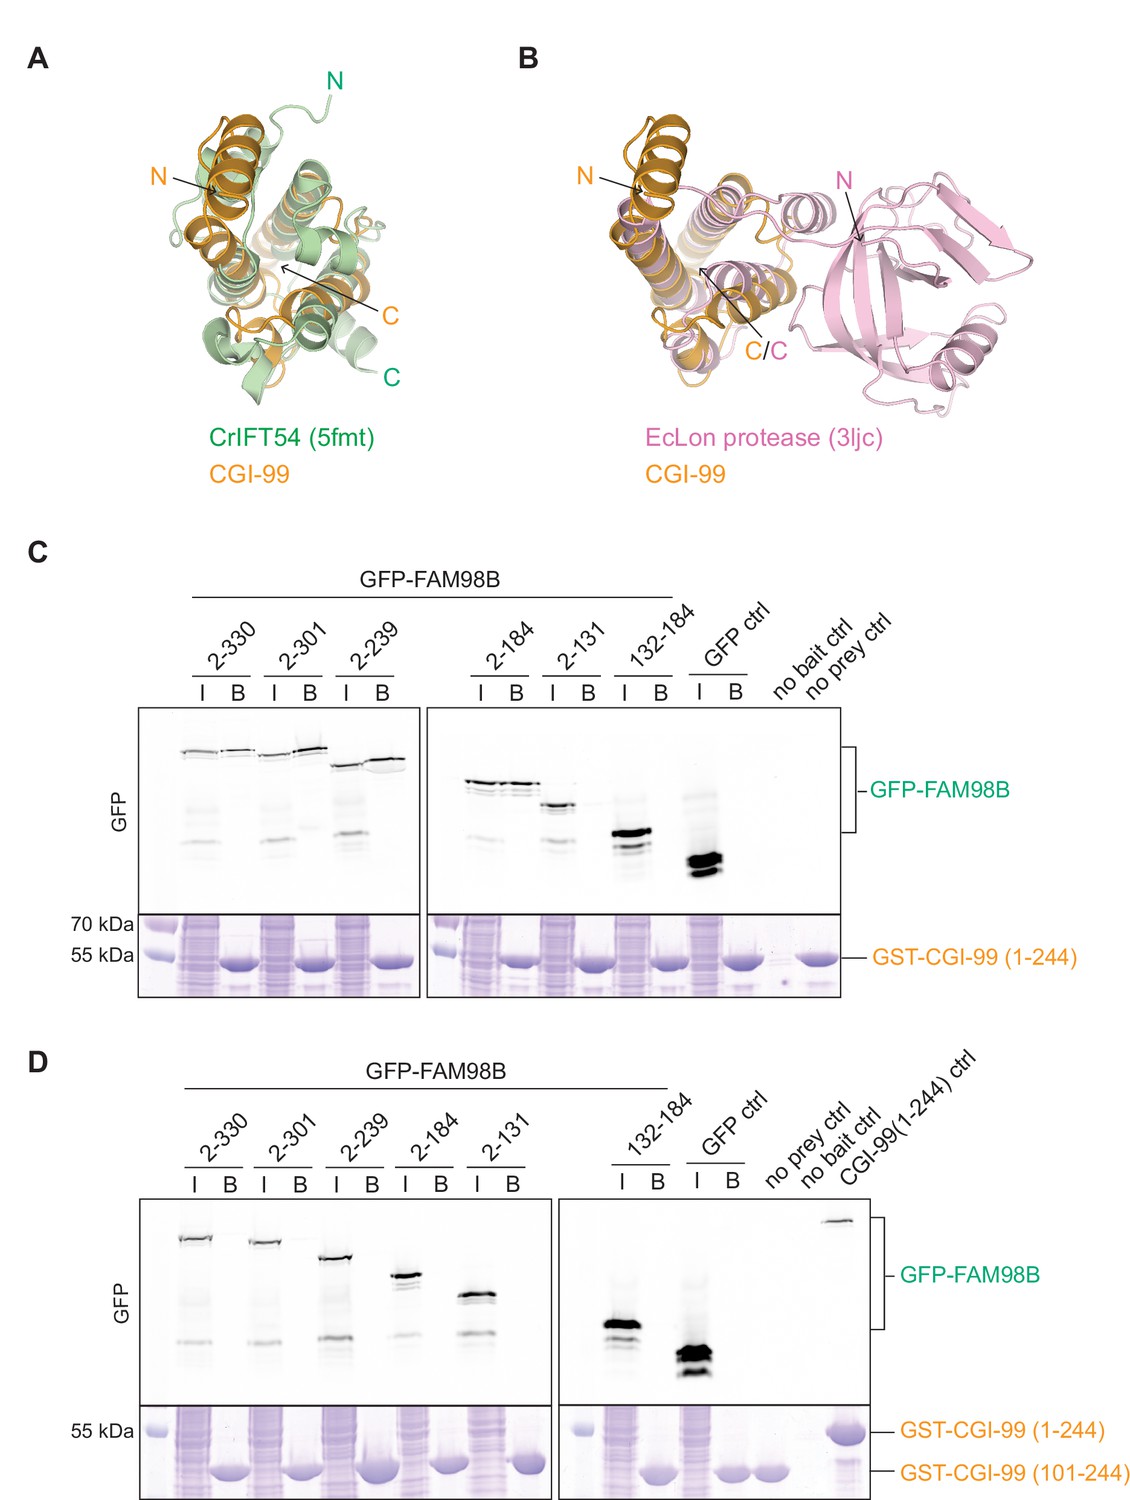
Analysis of the N-terminal domain of CGI-99 and the CGI-99:FAM98B interaction.
(A, B) DALI structural alignment of the N-terminal domain of CGI-99 (yellow) with (A) Chlamydomonas reinhardtii IFT54 (green, PDB ID: 5fmt) and (B) Escherichia coli Lon protease (pink, PDB ID: 3ljc). N- and C-termini are indicated. (C, D) Pull-down assays of immobilized (C) GST-CGI-99(1-244) or (D) GST-CGI-99(101-244) with lysates of HEK293T cells transiently overexpressing HA-(StrepII)2-GFP-FAM98B constructs. The input (I) and bound (B) fractions were analyzed by SDS-PAGE and visualized by in-gel GFP fluorescence (upper panel) followed by Coomassie Blue staining (lower panel). The ‘no bait’ control contained HEK293T lysate incubated with GSH resin in the absence of GST-CGI-99, ‘no prey ctrl’ contained GSH resin incubated with one of the GST-CGI-99 constructs, and ‘CGI-99(1-244) control’ is the bound fraction of GSH-immobilized GST-CGI-99(1-244) incubated with HEK293T cell lysate expressing HA-(StrepII)2-GFP-FAM98B(2-301).
Figure 4 with 1 supplement
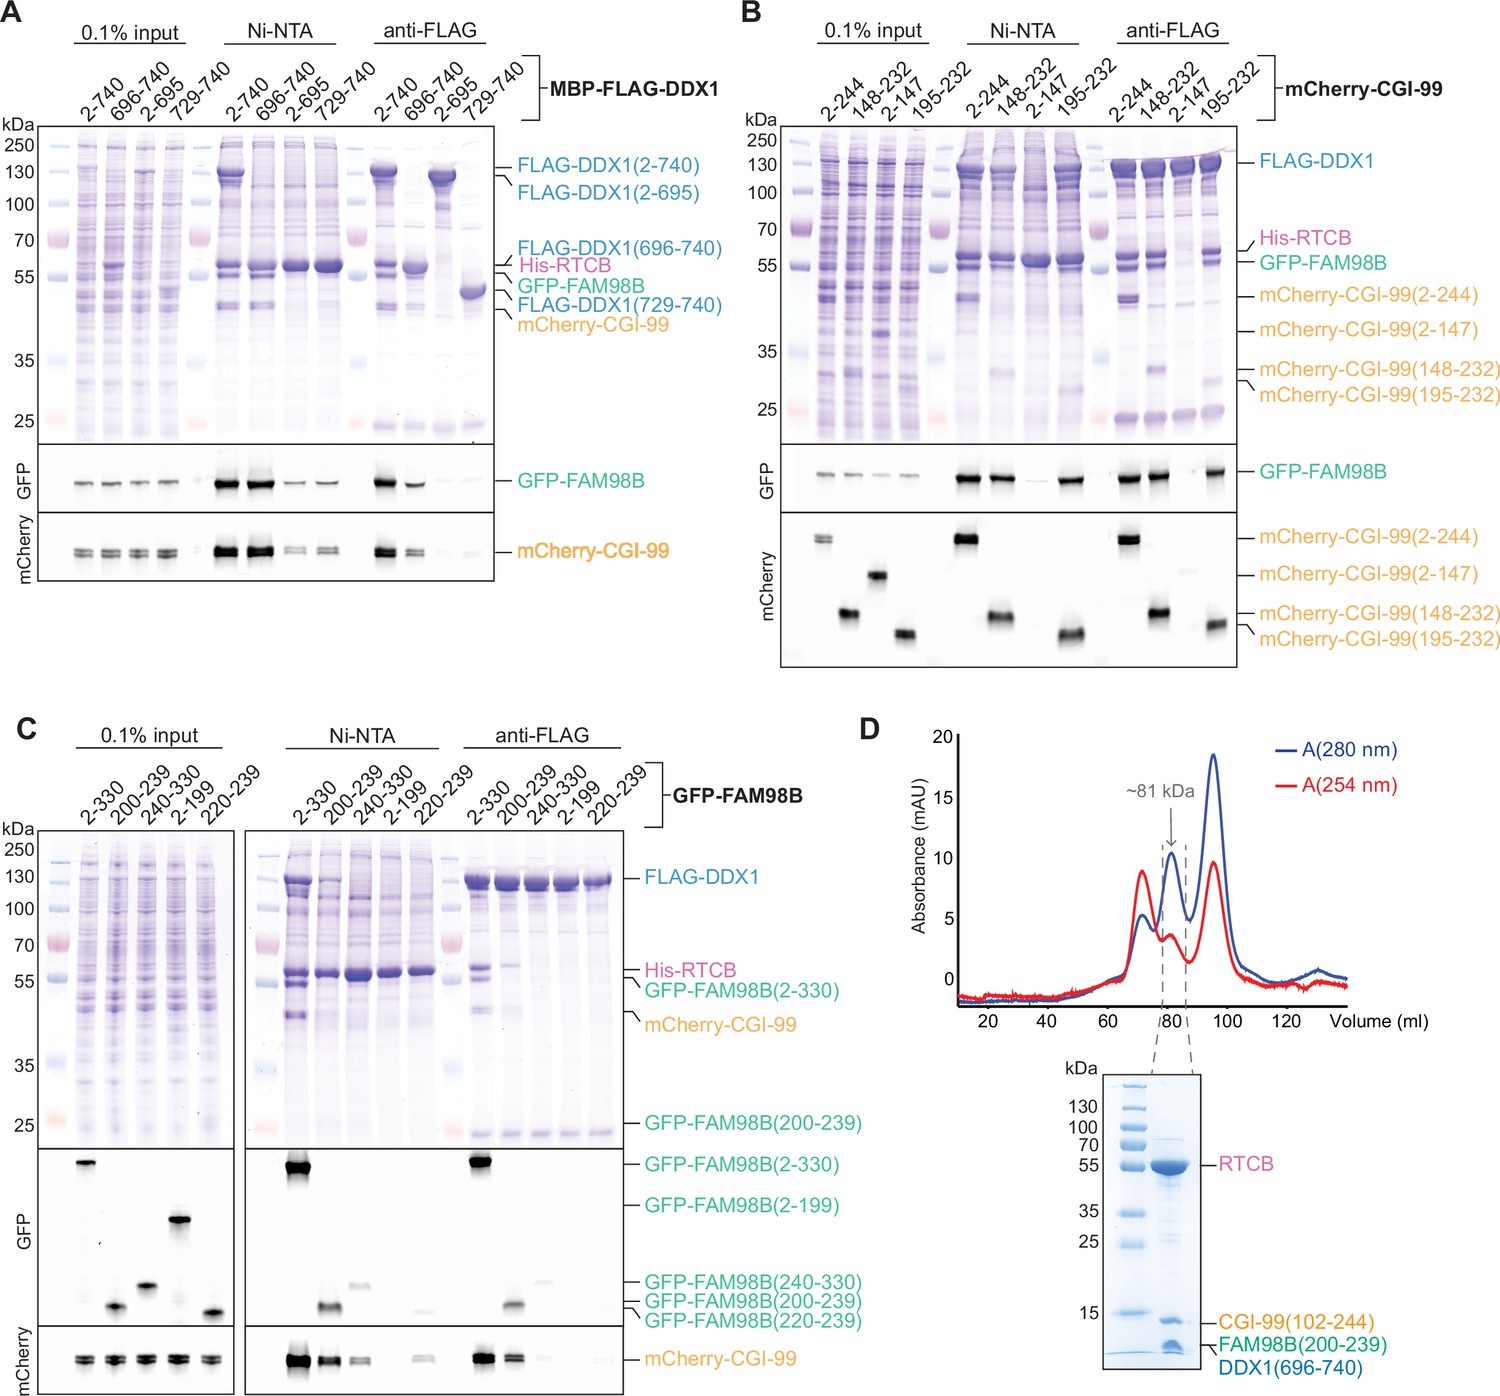
The C-terminal regions of DDX1, CGI-99, and FAM98B facilitate the formation of the core tRNA ligase complex.
(A–C) Truncation analysis of the core tRNA-LC (RTCB:DDX1:FAM98B:CGI-99). Pull-down assays on lysates of Sf9 cells expressing constructs of the core tRNA-LC with truncated DDX1 (A), CGI-99 (B), or FAM98B (C). The input and bound fractions were analyzed by SDS-PAGE and visualized by in-gel GFP (middle panel) or mCherry (bottom panel) fluorescence followed by Coomassie Blue staining (upper panel). (D) Top: size-exclusion chromatography purification of the minimal tRNA-LC, RTCB:DDX1(696-740):FAM98B(200-239):CGI-99(102-244). The estimated molecular weight of the peak according to its elution volume is indicated. Bottom: SDS-PAGE analysis of the final sample. The collected fractions are indicated by gray dashed lines.
-
Figure 4—source data 1
Mass spectrometry analysis of protein fragments resulting from limited proteolysis of RTCB:DDX1(436-740):FAM98B:CGI-99.
- https://cdn.elifesciences.org/articles/71656/elife-71656-fig4-data1-v2.xlsx
Figure 4—figure supplement 1

Mass spectrometry analysis of RTCB:DDX1(436-740):FAM98B:CGI-99 subjected to limited proteolysis.
(A) Size-exclusion chromatogram of the complex before (blue) and after (orange) limited proteolysis. Elution fractions from SEC were resolved by SDS-PAGE and stained with Coomassie Blue (right and lower panels). Unidentified bands are indicated with an asterisk. (B) Masses identified by electrospray ionization mass spectrometry analysis of the RTCB:DDX1(436-740):FAM98B:CGI-99 (upper panel), peak A (middle panel) and peak B (bottom panel) from limited proteolysis of RTCB:DDX1(436-740):FAM98B:CGI-99.
Figure 5
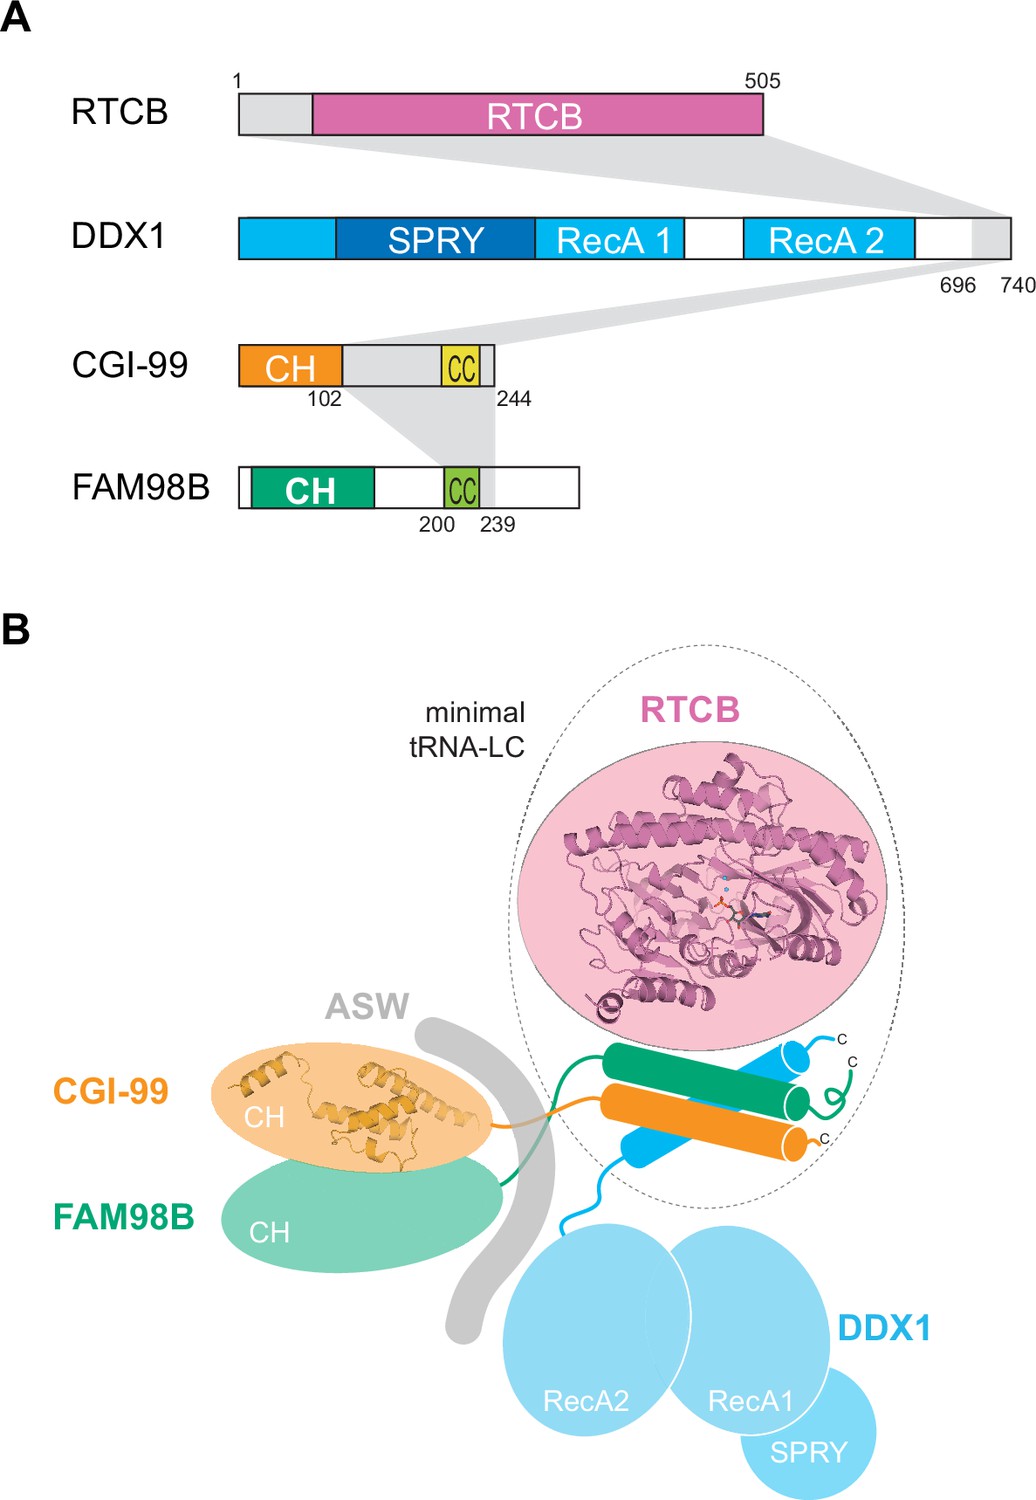
The architecture of the human tRNA ligase complex.
(A) Subunit regions required for the formation of the minimal tRNA-LC. Domain composition is shown as in Figure 1A, minimal regions are highlighted in gray. (B) Schematic representation of the molecular architecture of tRNA-LC.
Figure 6 with 2 supplements
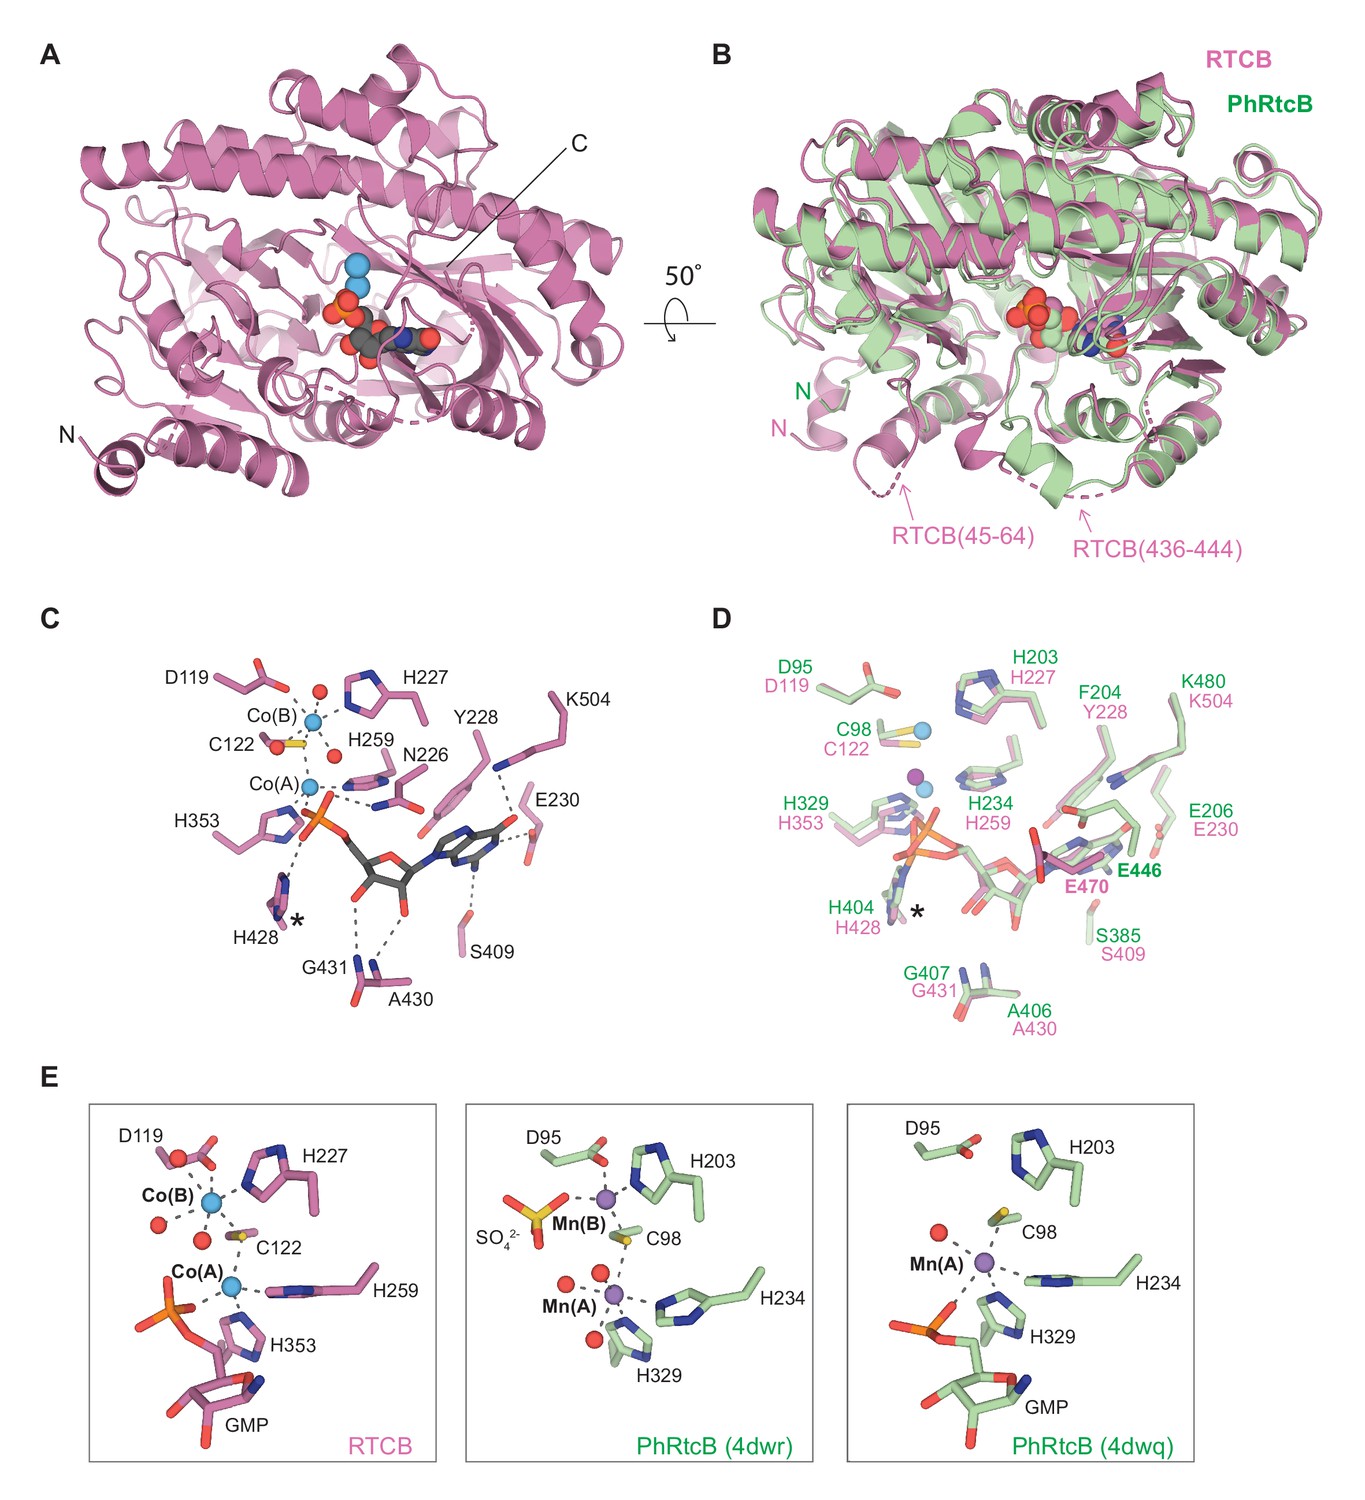
Crystal structure of human RTCB in complex with GMP and Co2+.
(A) Overall fold of RTCB. GMP is shown in space-fill representation, Co2+ ions are shown as blue spheres. The N- and C-termini are indicated. (B) DALI superposition of the GMP-bound RTCB (pink) and PhRtcB (green, PDB ID: 4dwq) structures. The nonconserved regions spanning residues Leu45-Pro64RTCB and Arg436-Asp444RTCB are indicated. (C) Detailed view of the active site RTCB residues (shown as pink sticks). GMP is shown as gray sticks, Co2+ ions as blue spheres and water molecules as red spheres. The hydrogen bonds and metal coordination bonds are shown as gray dashed lines. The histidine residue undergoing guanylation is labeled with an asterisk. (D) Detailed view of the active site of the superposed RTCB (pink) and PhRtcB (green, PDB ID: 4dwq). The Co2+ and Mn2+ ions are shown as blue and purple spheres, respectively. The histidine residues undergoing guanylation are labeled with an asterisk. (E) Detailed view of the metal coordination in the structures of GMP-bound RTCB (left panel), SO42--bound PhRtcB (PDB ID: 4dwr, middle panel), and guanylated PhRtcB (PDB ID: 4dwq, right panel). Color scheme as in panel (D).
Figure 6—figure supplement 1

Divalent metal selectivity of RTCB and tRNA-LC.
(A) Recombinant core tRNA-LC (RTCB:DDX1:FAM98B:CGI-99) and RTCB were incubated with radiolabeled single-stranded RNA substrate in the presence of Archease and divalent metal ions. Substrate RNA circularization was analyzed by denaturing PAGE and visualized by autoradiography. (B) Fraction of substrate conversion in (A) as measured by densitometric quantification of band intensities.
Figure 6—figure supplement 2
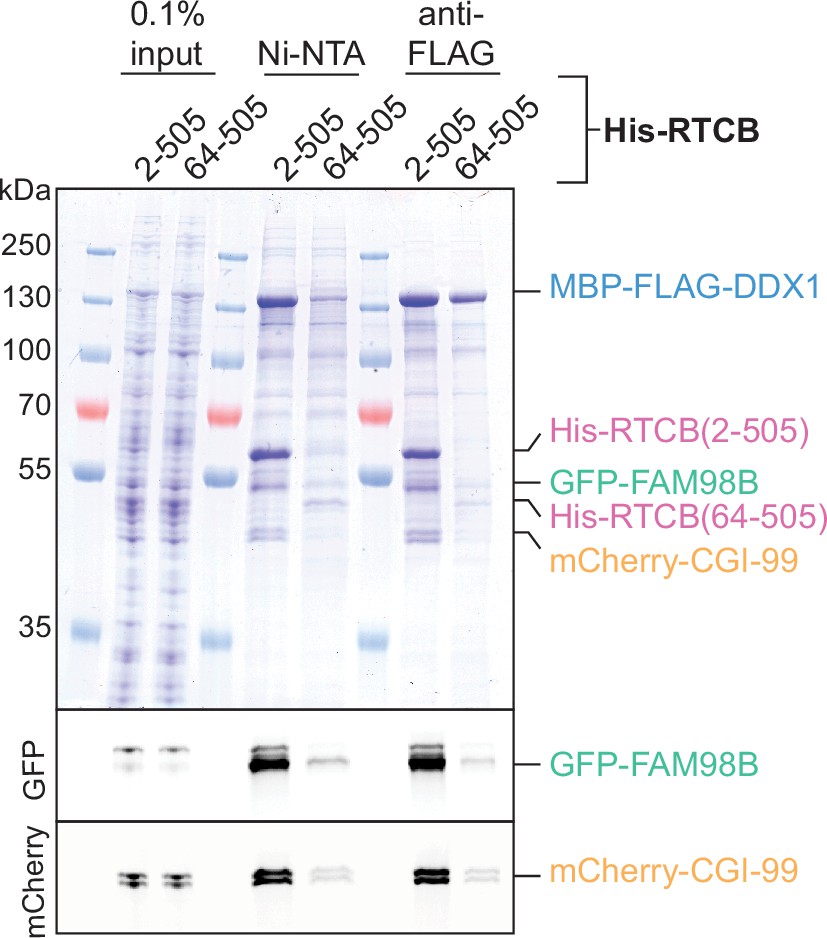
N-terminal loop of RTCB is not essential for the formation of the core tRNA-LC.
Affinity purifications from Sf9 cells expressing RTCB(64-505):DDX1:FAM98B:CGI-99. The input and bound fractions were analyzed by SDS-PAGE and visualized by in-gel GFP (middle panel) or mCherry (bottom panel) fluorescence followed by Coomassie Blue staining (upper panel).
Tables
Table 1
Crystallographic data collection and refinement statistics.
| RTCB-GMP product complex (PDB ID: 7P3B) | CGI-99 N-terminal domain (PDB ID: 7P3A) | ||
|---|---|---|---|
| Native | S-SAD | ||
| Data collection | |||
| Space group | P41212 | P61 | P61 |
| Cell dimensions | |||
| a, b, c (Å) | 96.91, 96.91, 227.14 | 91.71, 91.71, 52.94 | 91.83, 91.83, 53.01 |
| α, β, γ (o) | 90, 90, 90 | 90, 90, 120 | 90, 90, 120 |
| Wavelength (Å) | 1.0000 | 1.0084 | 2.0173 |
| Resolution (Å) | 48.99–2.30 (2.38–2.30) | 45.86–2.00 (2.07–2.00) | 44.11–2.24 (2.32–2.24) |
| Total reflections | 1287302 (123,580) | 349,085 (33,359) | 808,522 (11,139) |
| Unique reflections | 48,937 (4769) | 17,246 (1725) | 23,759 (1159) |
| Rmerge (%) | 34.2 (325.7) | 14.2 (153.2) | 53.9 (71.8) |
| Rpim (%) | 6.8 (64.8) | 3.2 (35.4) | 8.5 (31.0) |
| I/σI | 11.5 (1.1) | 18.6 (1.90) | 25.6 (2.5) |
| Cc(1/2) | 0.997 (0.548) | 0.999 (0.74) | 0.999 (0.684) |
| Completeness (%) | 99.9 (99.4) | 99.9 (99.9) | 99.5 (95.7) |
| Redundancy | 26.3 (25.9) | 20.2 (19.3) | 34.0 (9.6) |
| Refinement | |||
| Resolution (Å) | 48.99–2.30 | 45.86–2.00 | |
| No. of reflections | 48,912 | 17,235 | |
| Rwork/Rfree | 0.192/0.220 | 0.197/0.224 | |
| No. of non-hydrogen atoms | |||
| Protein | 7492 | 1688 | |
| Ligand/ion | 78 | 42 | |
| Water | 297 | 128 | |
| B-factors (Å2) | |||
| Protein | 45.2 | 39.4 | |
| Ligand/ion | 42.9 | 50.7 | |
| Water | 44.3 | 42.8 | |
| R.m.s. deviations | |||
| Bond lengths (Å) | 0.023 | 0.012 | |
| Bond angles (°) | 1.68 | 1.11 | |
| Ramachandran plot | |||
| % favored | 97.64 | 98.96 | |
| % allowed | 2.36 | 1.04 | |
| % outliers | 0 | 0 | |
-
Each dataset was collected from a single crystal. Values in parentheses are for highest-resolution shell.
Table 2
Metal coordination geometries found in RtcB structures.
| Species | PDB ID | Chain | Metal | Ligand | Metal coordination geometry | |
|---|---|---|---|---|---|---|
| Position A | Position B | |||||
| Homo sapiens | 7P3B | A, B | Co2+ | GMP | Tetrahedral | Octahedral |
| Pyrococcus horikoshii | 4DWQ | A, B | Mn2+ | GMP* | Trigonal bipyramidal | − |
| 4IT0 | A | Mn2+ | GMP* | Tetrahedral | Trigonal pyramidal | |
| B | Mn2+ | − | Tetrahedral | Tetrahedral | ||
| 4ISZ | A | Mn2+ | GTPαS | Tetrahedral | Tetrahedral | |
| B | Mn2+ | GTPαS | Trigonal bipyramidal | Tetrahedral | ||
| 4DWR | A, B, C | Mn2+ | SO42- | Octahedral | Tetrahedral | |
| 4ISJ | A, B | Mn2+ | − | Tetrahedral | − | |
-
*
Denotes a GMP ligand covalently bound to the His404 of PhRtcB.
Additional files
Download links
A two-part list of links to download the article, or parts of the article, in various formats.
Downloads (link to download the article as PDF)
Open citations (links to open the citations from this article in various online reference manager services)
Cite this article (links to download the citations from this article in formats compatible with various reference manager tools)
Molecular architecture of the human tRNA ligase complex
eLife 10:e71656.
https://doi.org/10.7554/eLife.71656


