A recombinant protein containing influenza viral conserved epitopes and superantigen induces broad-spectrum protection
- Institute of Applied Ecology, Chinese Academy of Sciences, China
- University of Chinese Academy of Sciences, China
- Key Laboratory of Superantigen Research, Shenyang Bureau of Science and Technology, China
- Chengda Biotechnology Co. Ltd, China
Figures
Figure 1
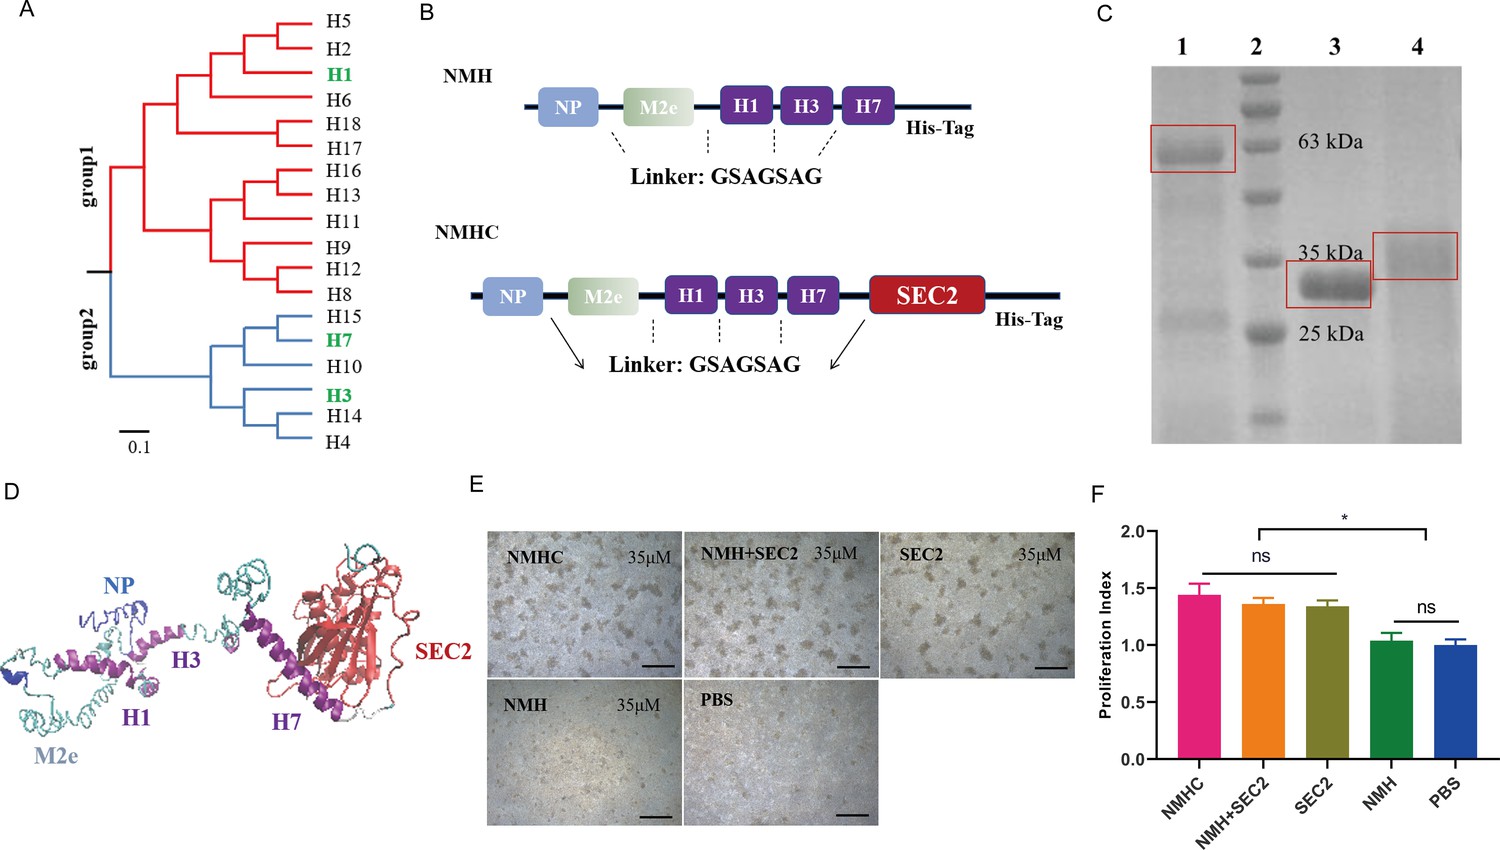
Design, purification, renaturation, and verification of the recombinant protein NMHC.
(A) Phylogenetic tree of the 18 hemagglutinin subtypes of influenza A viruses based on amino acid sequences. Group 1 and group 2 subtypes are listed in red and blue, respectively, and the HAs used in recombinant protein NMHC are listed in green. The amino acid distance scale bar denotes a distance of 0.1. (B) NMH consists of the conserved gene segments of NP, M2e, and HA2, which are connected by linker (GSAGSAG). NMHC consists of NMH and linker followed by SEC2. (C) NMHC, SEC2, and NMH purified and renatured from BL21(DE3) lysate. Lane 1: renatured NMHC; lane 2: marker; lane 3: purified SEC2; lane 4: renatured NMH. (D) The structure of the recombinant protein NMHC about homology modeling. The light blue, light green, and purple portions are NP, M2e, and HA2(H1, H3, H7) fragments, respectively, and red portion fragment is SEC2 domain. (E) Murine splenocytes proliferation induced by NMHC, NMH + SEC2, SEC2, NMH, and PBS were observed at 72 hr. (F) Proliferation index was quantified by MTS assay. Scale bar = 200 μm. Data are represented as mean ± SD (n = 3). *p<0.05, ns, not significant. Source files of the gel used for the qualitative analyses are available in Figure 1—source data 1.
-
Figure 1—source data 1
Source file for the gel data used for the qualitative analyses of NMHC, SEC2, and NMH purified and renatured from BL21(DE3) lysate shown in Figure 1.
This folder contains the original files of the full raw unedited gel (named original gel) and the relevant bands clearly labeled gel (named labeled gel). The information can be found in Figure 1 legend, as well as in Methods.
- https://cdn.elifesciences.org/articles/71725/elife-71725-fig1-data1-v2.zip
Figure 2

The expressions of co-stimulatory molecules CD80, CD86, and MHC II induced by recombinant proteins on BMDCs that inducted CD4+ T cell differentiation in vitro.
(A) BMDCs were treated with NMHC, NMH + SEC2, SEC2, NMH, and PBS as control for 48 hr. Then BMDCs were stained with antibodies to MHC II, CD80, CD86, and analyzed with flow cytometry. (B) Recombinant proteins-treated BMDCs (104) were co-cultured with CD4+ T cells (105) for 96 hr, and CD4+ T cells differentiations were analyzed with flow cytometry. The results were showed with gated percentage. Data are represented as mean ± SD (n = 3). *p<0.05, **p<0.01, ns, not significant.
Figure 3
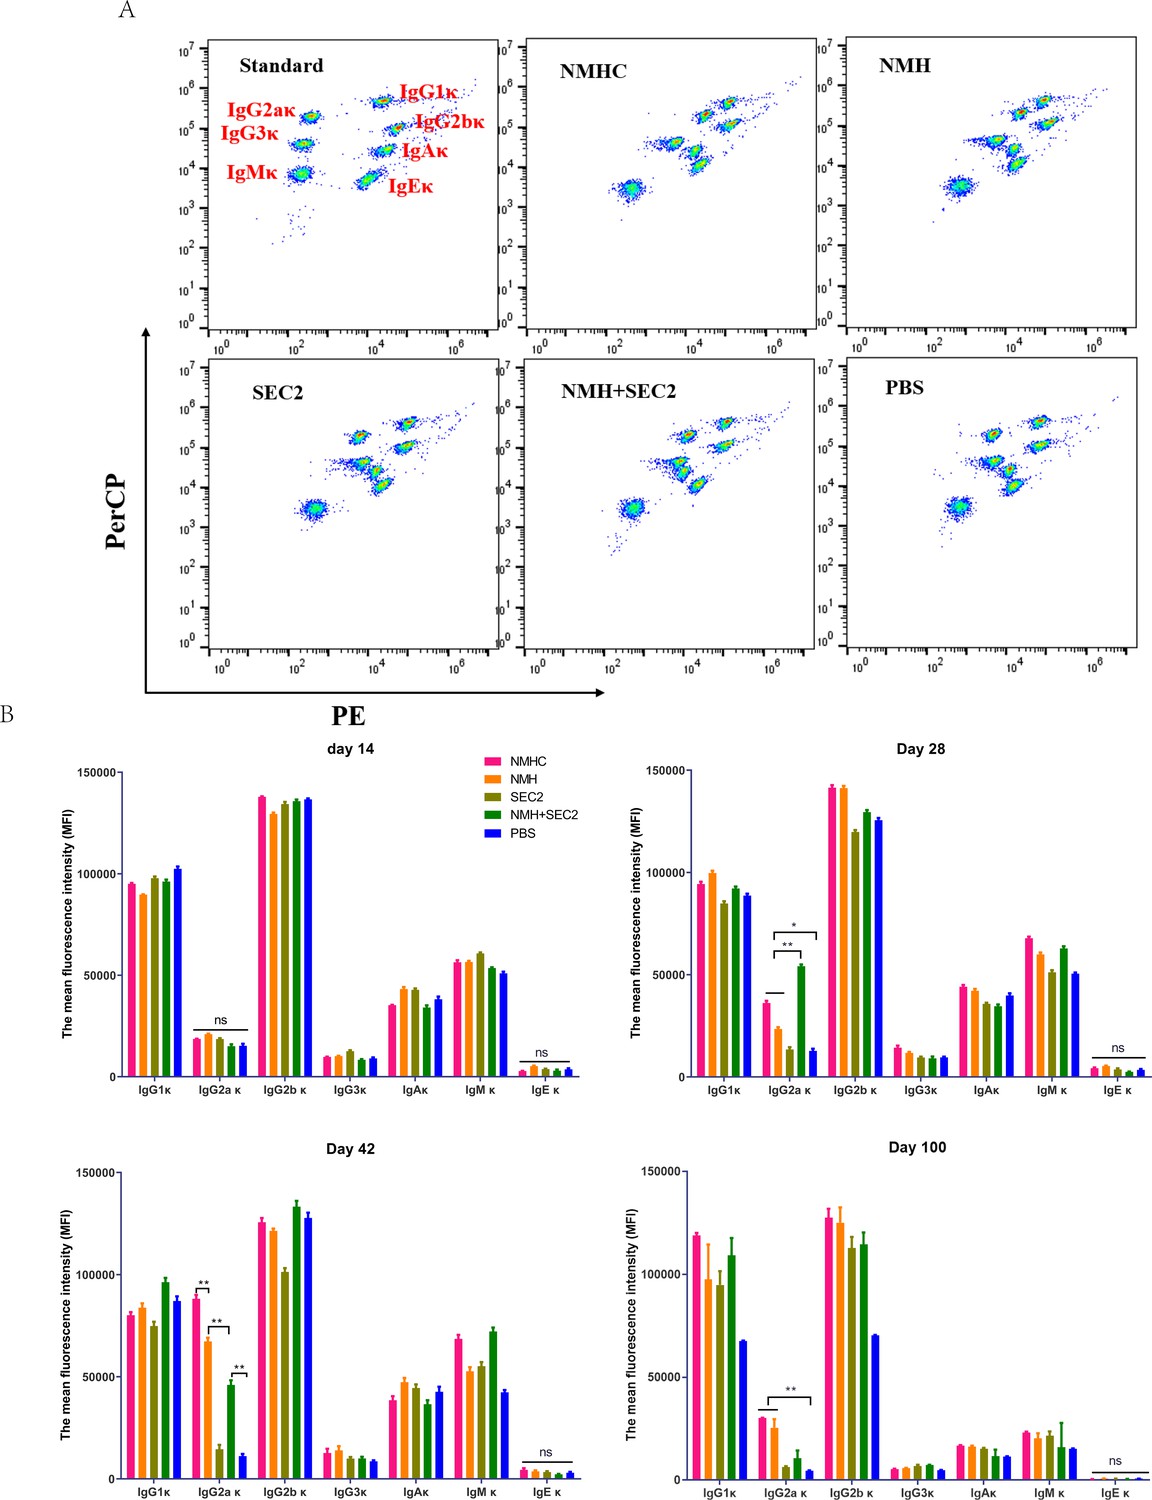
Murine serum immunoglobulin isotyping elicited by recombinant proteins.
Sera were taken from immunized mice on days 14, 28, 42, and 100 after immunization, and immunoglobulins were examined by Cytometric Bead Array. (A) Seven clusters of beads represented the immunoglobulins of IgG1κ, IgG2aκ, IgG2bκ, IgG3κ, IgAκ, IgMκ, and IgEκ from top to bottom when detected in FL2 (PE) and FL3 channels (PerCP). (B) The contents of immunoglobulins in different time points were represented by median fluorescence intensity. Data are represented as mean ± SD (n = 3). *p<0.05, **p<0.01, ns, not significant.
Figure 4
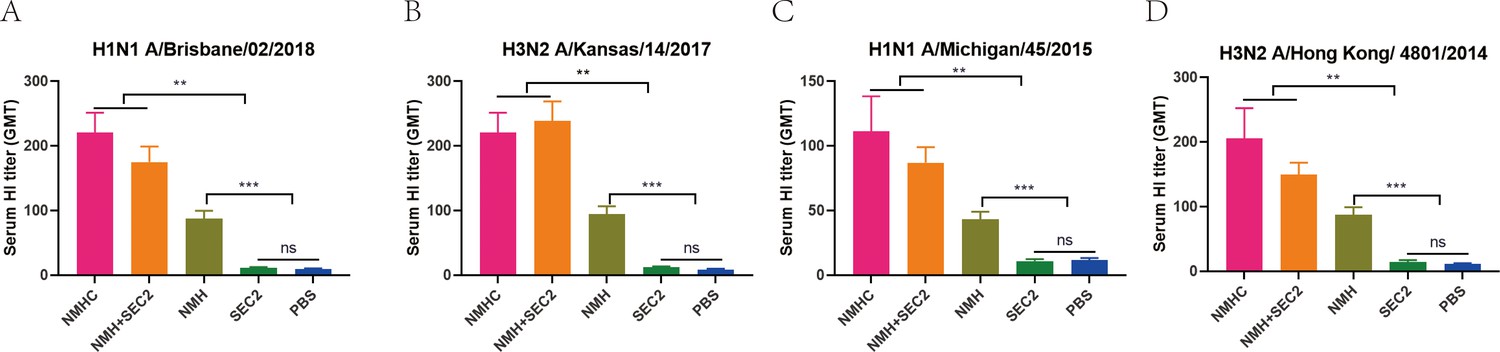
Recombinant proteins elicit broadly cross-reactive bnAbs in mice.
Sera were taken from immunized mice on day 42 after immunization, and the neutralization assays were performed against Bris/02(H1) (A), Kan/14(H3) (B), MI/45(H1) (C), and HK/4801(H3) (D) influenza viruses. The titers of each serum sample were defined as the reciprocal of the highest dilution. GMT, geometric mean titer. *p<0.05, **p<0.01, ***p<0.001, ns, not significant.
Figure 5
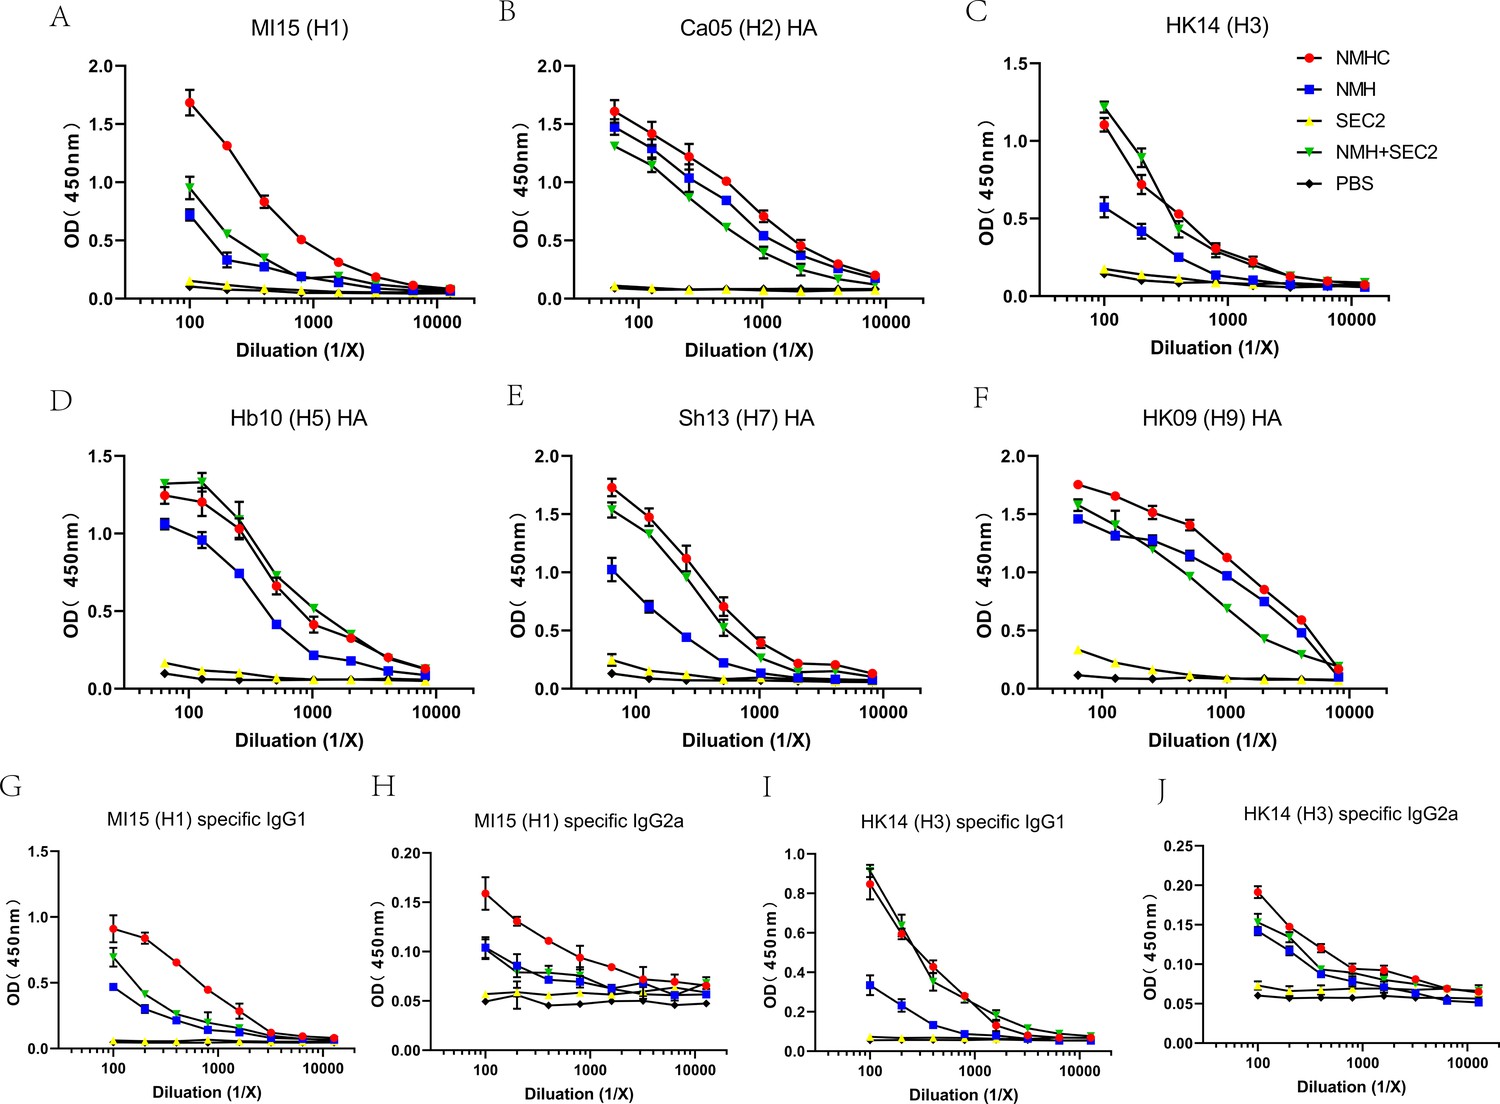
Breadth of the antibody response elicited by the recombinant protein was determined by ELISA of the pooled antisera against purified rHA proteins or split virion.
(A–F) Total IgG against (A) H1N1 A/Michigan/45/2015, (B) H2N2 A/Canada/720/2005, (C) H3N2 A/Hong Kong/4801/2014, (D) H5N1 A/Hubei/1/2010, (E) H7N9 A/Shanghai/2/2013, (F) H9N7 A/Hong Kong/35820/2009. (G–J) IgG1 or IgG2a specific against split virion of influenza viruses. (G) IgG1 specific against H1N1 A/Michigan/45/2015, (H) IgG2a specific against H1N1 A/Michigan/45/2015, (I) IgG1 specific against H3N2 A/Hong Kong/4801/2014, and (J) IgG2a specific against H3N2 A/Hong Kong/4801/2014.
Figure 6 with 1 supplement
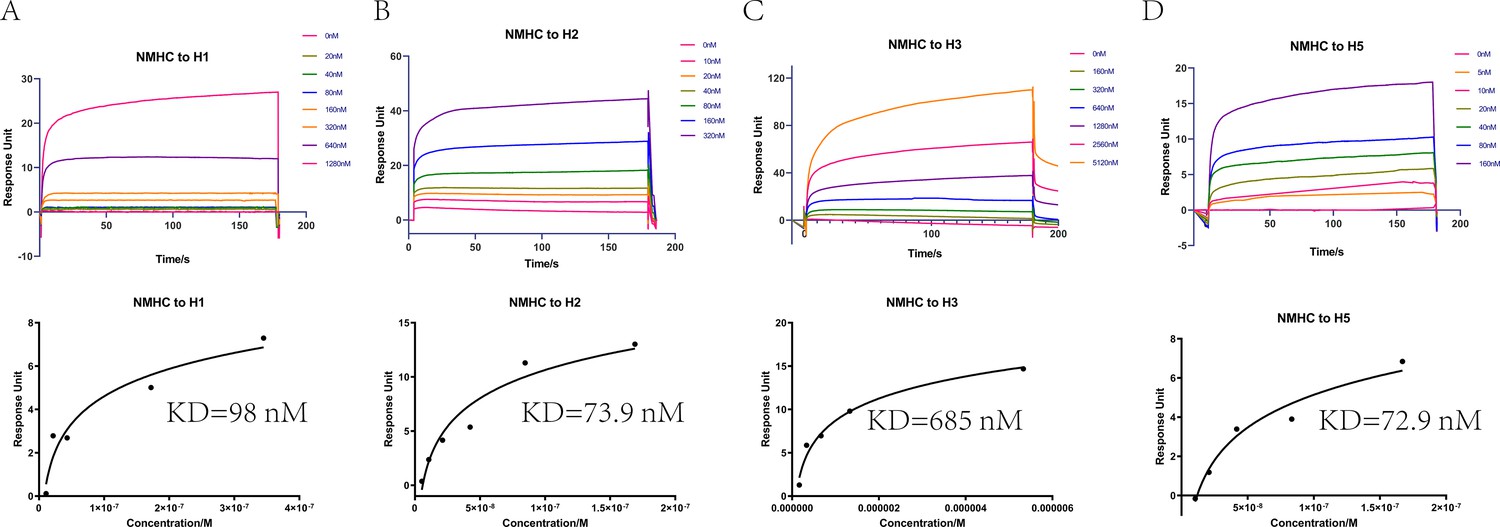
Affinities of HAs to antibodies purified from anti-NMHC sera.
The overlays of binding kinetics of the HAs at different concentrations and the affinity of KD values determined with Biacore were shown. (A) Split virion of H1N1 A/Michigan/45/2015, (B) H2N2 A/Canada/720/2005, (C) split virion of H3N2 A/Hong Kong/4801/2014, and (D) H5N1 A/Hubei/1/2010. The KD values were calculated using a steady affinity state model by the Biacore T200 evaluation software (version 3.1). Source files of the overlays of binding kinetics used for the affinity analyses are available in Figure 6—source data 1.
-
Figure 6—source data 1
Source file for affinities data shown in Figure 6.
This folder contains the overlays of binding kinetics of antibodies to HAs (HA of H1, H2, H3, and H5) at different concentrations were detected with Biacore (individual files are named ‘the binding kinetics of antibodies to H1.txt,’ ‘the binding kinetics of antibodies to H2.txt,’ ‘the binding kinetics of antibodies to H3.txt,’ ‘the binding kinetics of antibodies to H5.txt’). The detection processes are contained in Methods.
- https://cdn.elifesciences.org/articles/71725/elife-71725-fig6-data1-v2.zip
Figure 6—figure supplement 1
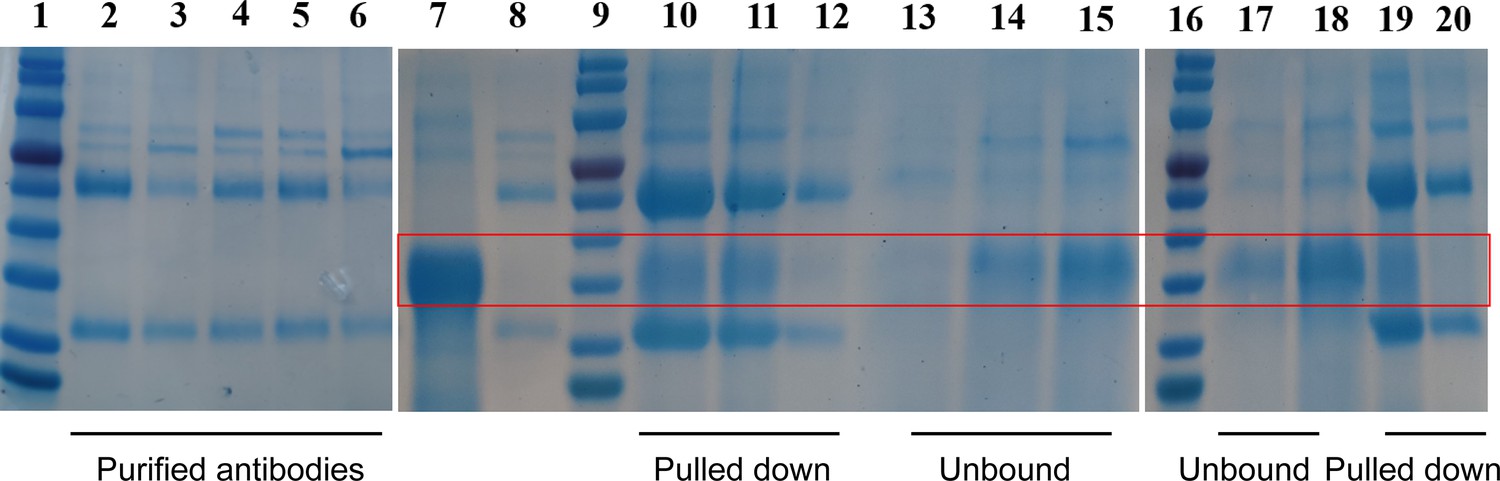
NMH forms a stable complex with the purified antibodies from serum of immunized mice.
NMH and antibodies were mixed together at 2:1 molar ratio and incubated for 2 hr at 4°C. Protein A/G beads specific for the murine IgG could pull down the antigen-antibody (Ag-Ab) complex. The antibodies binding NMH or not were eluted (elution fraction) with 100 mM glycine-HCl (pH 3). Lanes 1, 9, and 16: protein markers. Lanes 2–6: the purified antibodies of anti-NMHC, NMH, SEC2, NMH + SEC2, and PBS serum. Lane 7: NMH antigen. Lane 8: the purified antibody. Lanes 10–12, 19, and 20: elution fractions (complexes of NMH antigen and purified antibodies from serum of mice immunized with NMHC, NMH, PBS, NMH + SEC2, and SEC2, respectively). Lanes 13–15, 17, and 18: NMH antigens unbound by purified antibodies from serum of mice immunized with NMHC, NMH, PBS, NMH + SEC2, and SEC2, respectively. All of the samples were analyzed on a denaturing SDS/PAGE. Source files of the gels used for the qualitative analyses are available in Figure 6—figure supplement 1—source data 1.
-
Figure 6—figure supplement 1—source data 1
Source file for pull-down assay shown in Figure 6—figure supplement 1.
This folder contains the original files of the full raw unedited gel (individual files are named ‘original gel (Line1-6)’, ‘original gel (Line7-15)’, ‘original gel (Line16-20)’), and the relevant bands clearly labeled gel (individual files are named ‘labelled gel (Line1-6)’, ‘labelled gel (Line7-15)’, ‘labelled gel (Line16-20)’). The information can be found in Figure 6—figure supplement 1 legends, as well as in Methods.
- https://cdn.elifesciences.org/articles/71725/elife-71725-fig6-figsupp1-data1-v2.zip
Figure 7
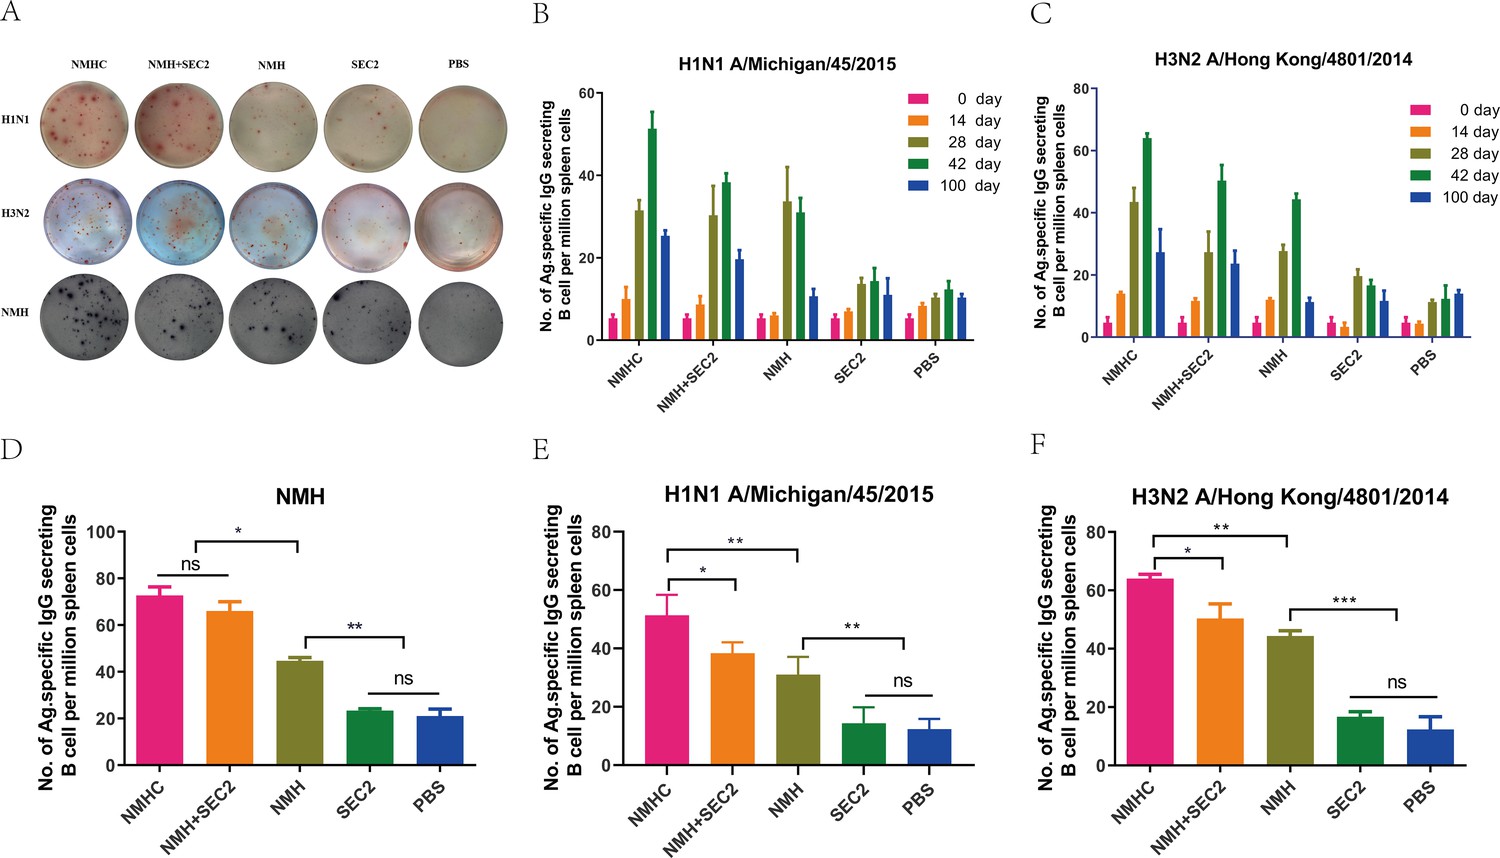
The specific antibody-secreting cells’ (ASC) response to H1N1, H3N2, and NMH was measured with ELISpot assay.
Splenocytes were isolated and collected from immunized mice on days 14, 28, 42, and 100. The cells were added in ELISpot wells, which coated with the NHM proteins, H1N1 or H3N2 influenza viruses. (A) Each spot in the well represents an ASC. (B, C) The frequency of H1N1 and H3N2-specific ASC on days 0, 14, 28, 42, and 100. (D–F) Specific ASCs’ response to NMH, H1N1, and H3N2 influenza viruses the frequency of NMH-, H1N1-, and H3N2-specific ASC on day 42. Data are represented as mean ± SD (n = 3). *p<0.05, **p<0.01, ***p<0.001, ns, not significant.
Figure 8

Recombinant proteins induced CD4+ T cell responses.
(A) Splenocytes isolated from immunized mice in each group on days 42 were plated in ELISpot wells to detected IFN-γ and IL-4 cytokine-producing cells. (B) The mRNA levels of IFN-γ, IL-4, T-bet, and GATA3 were measured by qPCR. (C) IL-4 and IFN-γ produced by splenocytes treated with NMH and SEC2 respectively in vitro were detected by ELISA. PBS was served as CK. Results are expressed as the mean value ± SD (n = 3). *p<0.05, **p<0.01, ns, not significant.
Figure 9
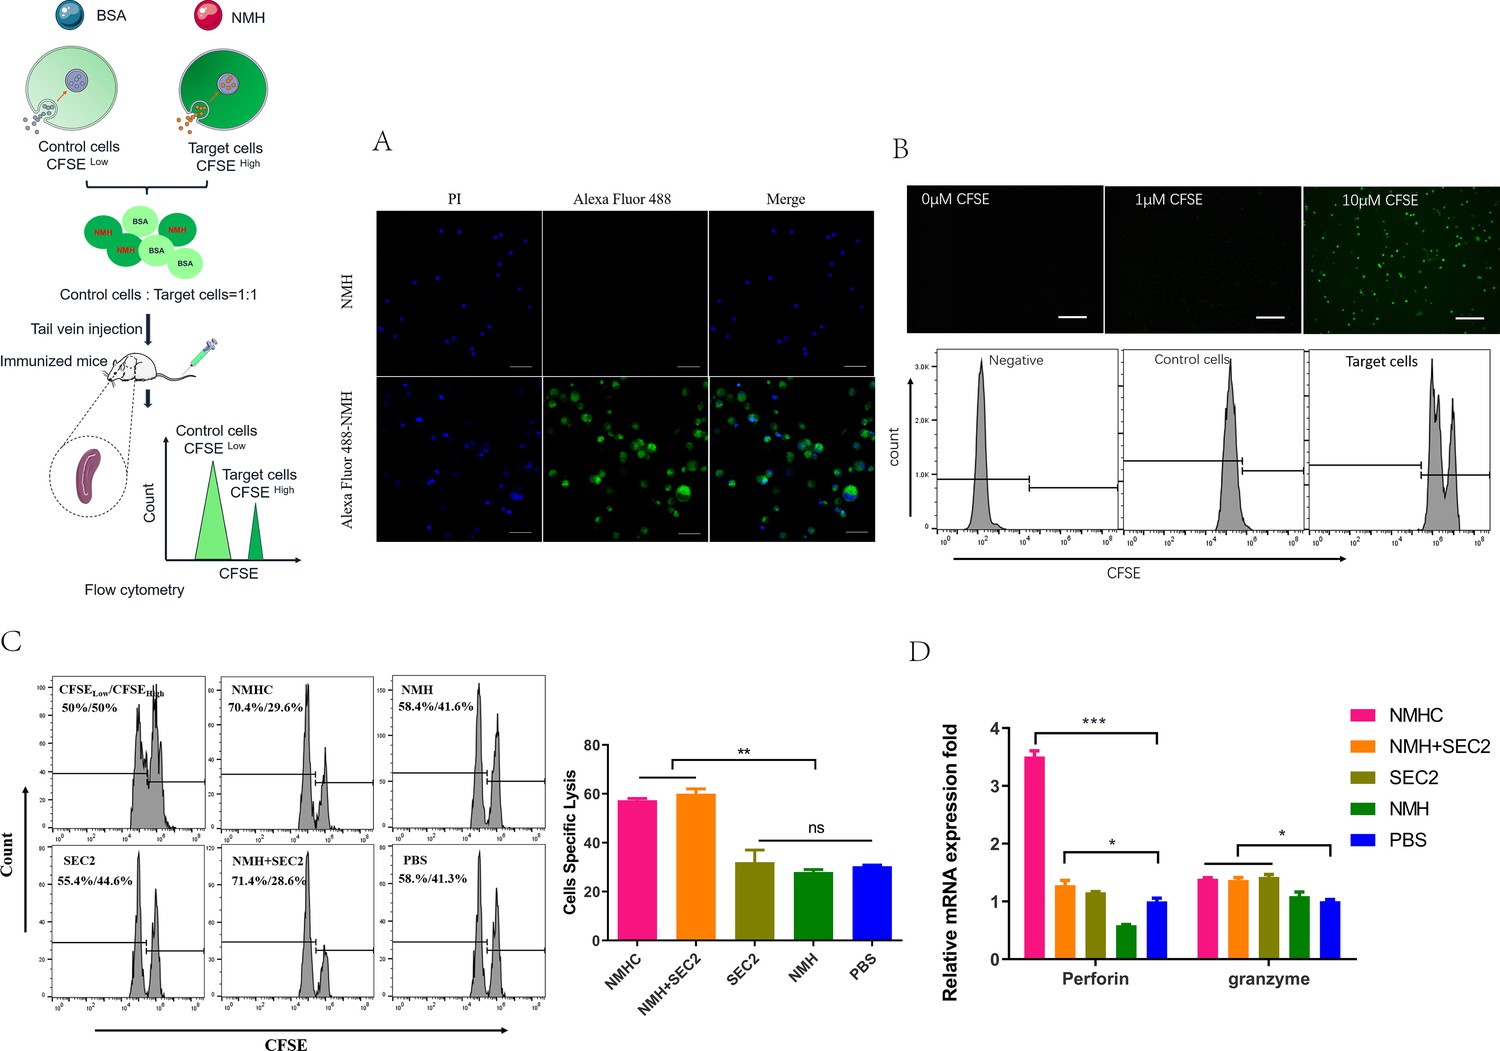
Effects of the recombinant protein NMHC on CD8+ T cell responses.
(A) To verify that NMH antigens can be effectively internalized into splenocytes, splenocytes from naïve BALB/c mice were co-cultured with Alexa Fluor 488-labeled NMH or NMH alone and detected by fluorescent inverted microscope. (B) Then, fresh isolated naïve splenocytes were divided into two parts. One part was pulsed with 5 μg/mL NMH, labeled with 10 μM of CFSE and termed as CFSE high target cells, the other part was loaded with BSA, labeled with 1 μM of CFSE and termed as CFSE low control cells, both of them detected by fluorescent inverted microscope and flow cytometry. (C) The equal number of two parts cells was mixed and injected into recipient mice. 12 hr later, the splenocytes from these mice were collected to examine the antigen-specific cytolytic responses. (D) The mRNA levels of perforin and granzyme of recipient mice were examined by qPCR. Statistical analyses were performed using Student’s t-test and one-way ANOVA. *p<0.05, **p<0.01, ***p<0.001, ns, not significant.
Figure 10
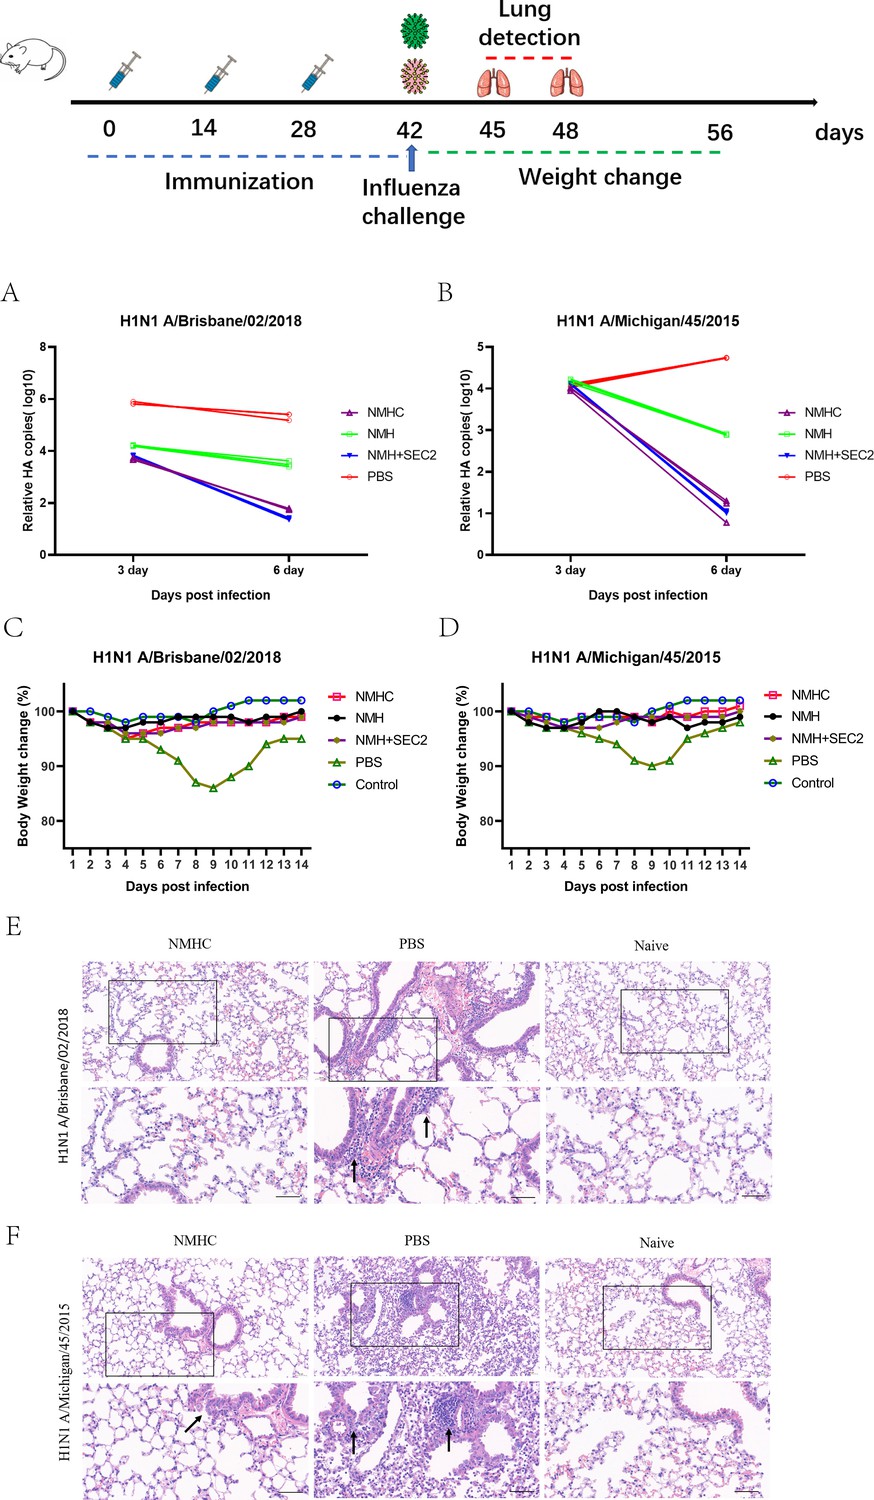
Challenge test in BALB/c mice.
Mice (n = 12 per group in two separate experiments) were infected intranasally with 103 TCID50 of Bris/02(H1) or MI/45(H1) influenza viruses after 14 days of the third Immunization. (A, B) Viral copy number of Bris/02(H1) and MI/45(H1) in the lungs at days 3 and 6 post-infection was determined using qPCR. (C, D) Weight changes (%) were monitored for 14 days post-challenge. (E, F) Histopathology in pulmonary tissue (scale bar = 50 μm). Naïve mice that were untreated and unchallenged were used as the control.
Figure 11

The profile analysis of lung-infiltrating leukocytes in lung frozen sections of infected mice treated with NMHC.
(A) Lung-infiltrating leukocytes were analyzed by IHC of CD45. (B, C) The quantification of the relative infiltration intensity of biomarkers by normalizing the positive signals of the treated groups to those of the naïve group. Error bars denote mean ± SD. **p<0.01. Scale bar = 50 μm.
Figure 12

Immunofluorescence analysis of lungs frozen sections at day 6 after infection.
(A) Distribution of influenza viruses (pink for NP), lung-infiltrating CD8+ T cells (red for CD8), and lung-infiltrating macrophages (green for F4/80). (B, C) The relative quantification of fluorescence intensity of NP, CD8, and F4/80. The relative fluorescence intensities were quantified by normalizing the fluorescent signals of the treated groups to those of the naïve group. Error bars denote mean ± SD. Scale bar = 200 μm, *p<0.05, **p<0.01, ***p<0.001.
Figure 13
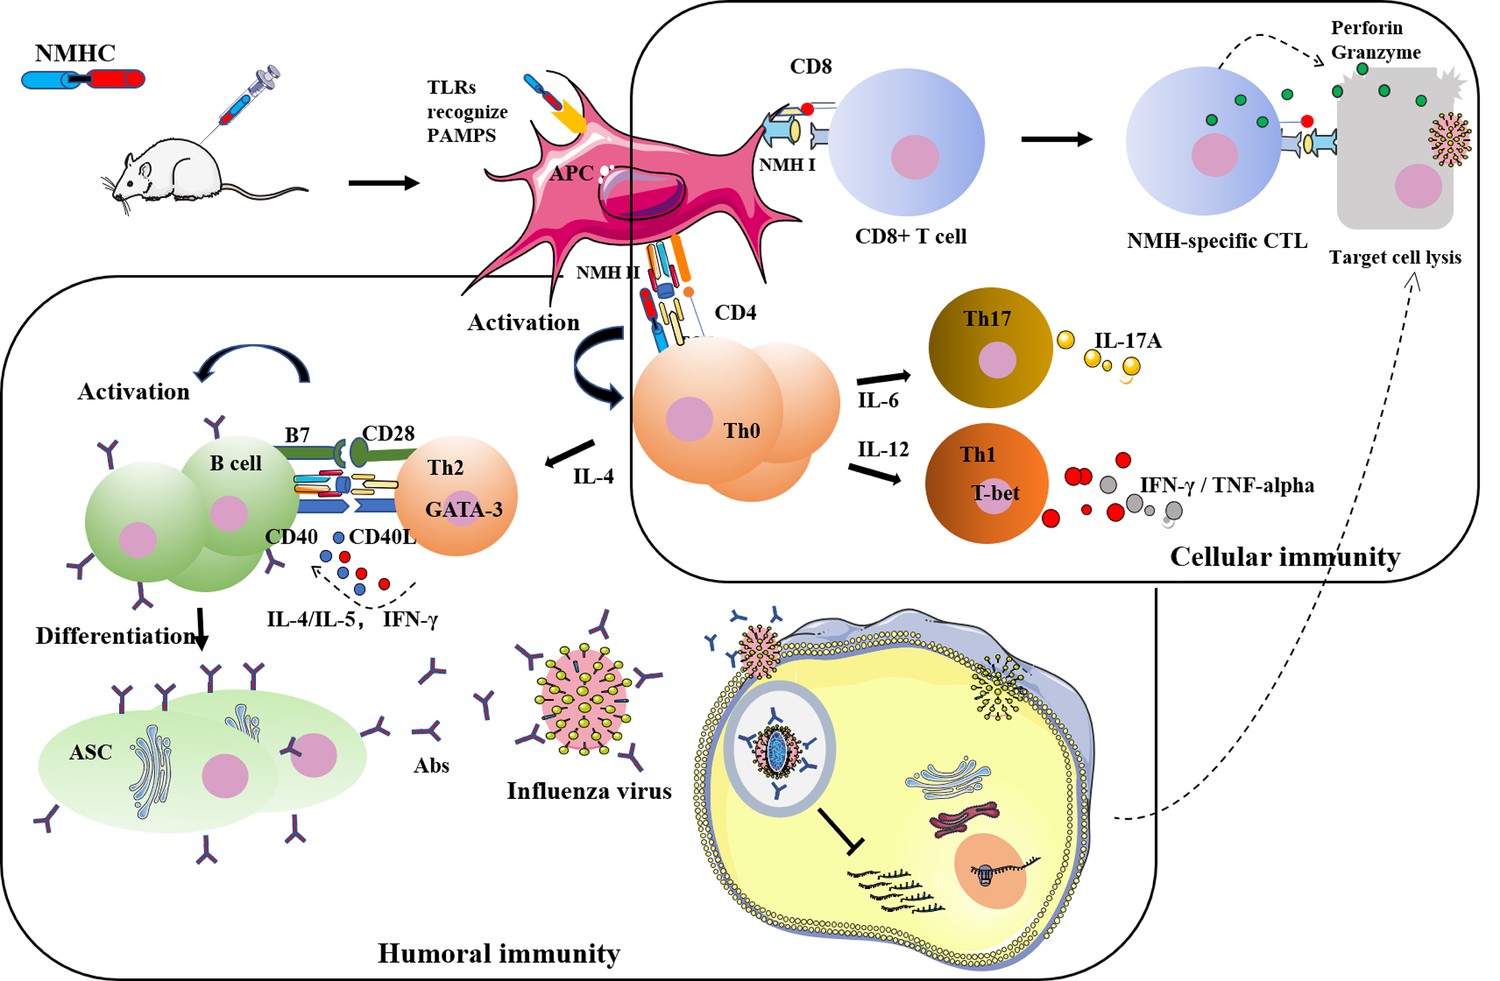
Detailed illustration of the anti-influenza mechanisms induced by NMHC.
Author response image 1
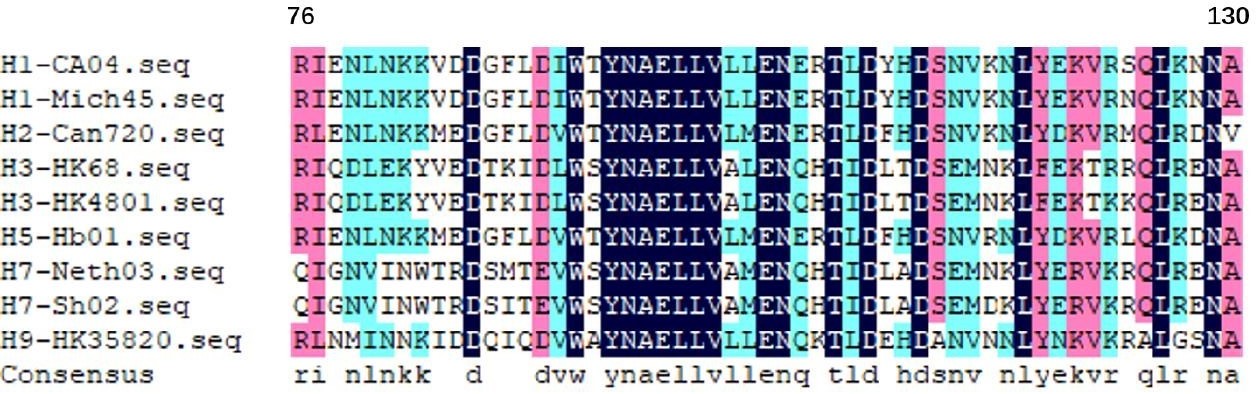
The long α-helix amino acids 76–130 from the HA2 of different hemagglutinin subtypes.
Author response image 2

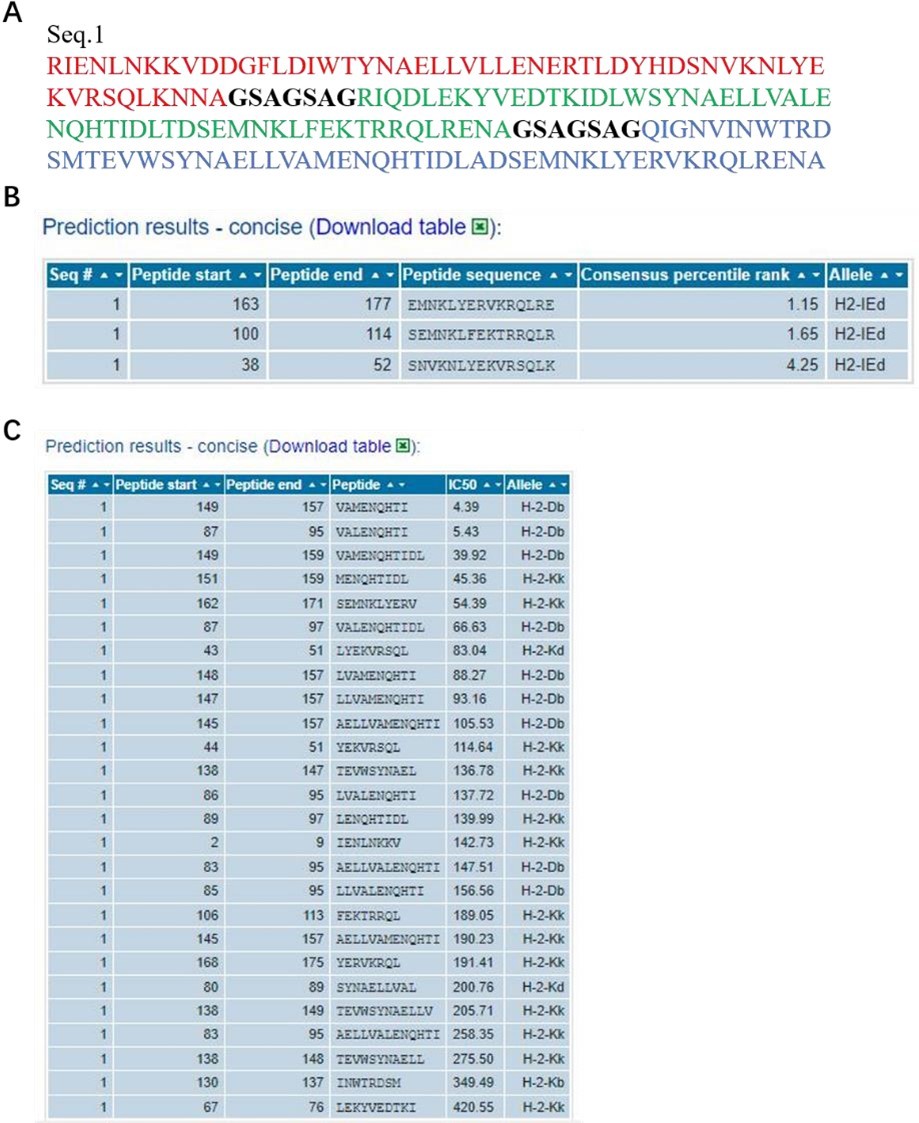
The information of predicted binding ability to MHC (class I or II) for the NP and M2 peptide sequences.
(A), the sequences that were used in the binding prediction. The amino acid residues 1 to 16 were NP335–350; 17 to 30 were NP380–393; 31 to 37 were linker; 38 to 83 were 2*M2e. (B) and (C), for MHC I and MHC II, the sequence number of the source protein, start and end coordinates of the peptide within the source protein, peptide sequence, allele, IC50, and Consensus percentile rank.
Author response image 3
The information of predicted binding ability to MHC (class I or II) for the HA2 peptide sequences.
(A), the sequences that were used in the binding prediction. The amino acid residues 1 to 55, 63 to 117, 125 to 179 respectively were HA2 of H1, H3 and H7; 56 to 62 and 118 to 124 were linker. (B) and (C), for MHC I and MHC II, the sequence number of the source protein, start and end coordinates of the peptide within the source protein, peptide sequence, allele, IC50, and Consensus percentile rank.
Author response image 4
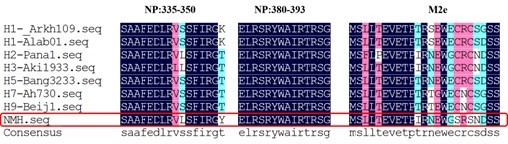
The conservation of NP and M2e sequence of different influenza virus subtypes.
The sequence of H1N1, H2N2, H3N2, H5N1, H7N9, H9N2 subtypes and NMH (red frame) are listed in single amino acid code from top to bottom. Observed replacement mutations are listed beneath by single amino acid code.
Tables
Key resources table
| Reagent type (species) or resource | Designation | Source or reference | Identifiers | Additional information |
|---|---|---|---|---|
| Strain, strain background (Escherichia coli) | BL21(DE3) | Abcam | Cat: 69450-3 | Competent cells |
| Strain, strain background (influenza virus) | H1N1 A/Michigan/45/2015 | Chengda Biotechnology | Released by the WHO | |
| Strain, strain background (influenza virus) | H1N1 A/Brisbane/02/2018 | Chengda Biotechnology | Released by the WHO | |
| Strain, strain background (influenza virus) | H3N2 A/Kansas/14/2017 | Chengda Biotechnology | Released by the WHO | |
| Strain, strain background (influenza virus) | H3N2 A/Hong Kong/4801/2014-like | Chengda Biotechnology | Released by the WHO | |
| Biological sample (influenza virus) | H3N2 A/Hong Kong/4801/2014 | Chengda Biotechnology | Released by the WHO | |
| Antibody | MHC II (rabbit monoclonal) | BioLegend | Clone: M5/114.15.2 | 1 μg/100 μL |
| Antibody | IFN-γ (rabbit monoclonal) | BioLegend | Clone: XMG1.2;cat: 505806 | 1 μg/100 μL |
| Antibody | CD80 (Armenian hamster monoclonal) | BD Biosciences | Clone: 16-10A1;cat: 553769 | 1 μg/100 μL |
| Antibody | CD86 (rabbit monoclonal) | BD Biosciences | Clone: GL1;cat: 561962 | 1 μg/100 μL |
| Antibody | IL-17A (rabbit monoclonal) | BioLegend | Clone: TC11-18H10.1;cat: 506907 | 1 μg/100 μL |
| Antibody | IL-10 (rabbit monoclonal) | BioLegend | Clone: JES5-16E3;cat: 505005 | 1 μg/100 μL |
| Antibody | IL-4 (rabbit monoclonal) | BD Biosciences | Clone: H129.19;cat: 553650 | 1 μg/100 μL |
| Antibody | CD11c (Armenian hamster monoclonal) | BD Biosciences | Clone: HL3;cat: 550261 | 1 μg/100 μL |
| Antibody | IgG(H + L) (goat polyclonal) | Immunoway | Cat: RS0007 | 1:10,000 |
| Antibody | NP (rabbit polyclonal) | Sino Biological | Cat: 11675-T62 | 1:500 |
| Peptide, recombinant protein | HA of H2N2A/Canada/720/2005 | Sino Biological | Cat: 11688-V08H | |
| Peptide, recombinant protein | HA of H5N1 A/Hubei/1/2010 | Sino Biological | Cat: 40015-V08H | |
| Peptide, recombinant protein | HA of H7N9A/Shanghai/2/2013 | Sino Biological | Cat: 40239-V08B | |
| Peptide, recombinant protein | HA of H9N2 497A/HongKong/35820/2009 | Sino Biological | Cat: 40174-V08B | |
| Commercial assay or kit | Beaver Beads Protein A/G antibody Purification Kit | Beaver | Cat: 20102-1 | |
| Commercial assay or kit | Cytometric Bead Array (CBA) Mouse Immunoglobulin Isotyping Kit | GE HealthCare | Cat: 550,026 | |
| Commercial assay or kit | Mouse IL-4 ELISpot PLUS (ALP) | MabTech | Cat: 3311-4APW-2 | |
| Commercial assay or kit | Mouse IFN-gamma ELISpot PLUS (ALP) | MabTech | Cat: 3321-4APT-2 | |
| Software | GraphPad Prism | GraphPad Prism (https://graphpad.com) | RRID:SCR_015807 | Version 8.0.0 |
| Software | ImageJ | ImageJ (http://imagej.nih.gov/ij/) | RRID:SCR_003070 | Version 2.0.0 |
| Software | FlowJo | FlowJo (https://www.flowjo.com/) | RRID:SCR_008520 | Version 10 |
| Other | Sensor Chip CM5 | GE HealthCare | Cat: BR100530 |
Table 1
Sequences for qPCR primers.
| Gene | F: forward primer (5′–3′), R: reverse primer (5′–3′) | Reference | |
|---|---|---|---|
| β-Actin | F: TGGAATCCTGTGGCATCCATGAAAC | Currier and Robinson, 2001 | |
| R: TAAAACGCAGCTCAGTAACAGTCCG | |||
| Perforin | F: GATGTGAACCCTAGGCCAGA | Currier and Robinson, 2001 | |
| R: AAAGAGGTGGCCATTTTGTG | |||
| Granzyme B | F: ACTTTCGATCAAGGATCAGCAR: GGCCCCCAAAGTGACATTTATT | Han et al., 2010 | |
| R: GGCCCCCAAAGTGACATTTATT | |||
| IFN-γ | F: AGACAATCAGGCCATCAGCA | Yao et al., 2018a | |
| R: TGGACCTGTGGGTTGTTGAC | |||
| IL-4 | F: GAGACTCTTTCGGGCTTTTCG | Chen et al., 2012 | |
| R: CAGGAAGTCTTTCAGTGATGTGG | |||
| T-bet | F: ATTGCCCGCGGGGTTG | Chen et al., 2012 | |
| R: GACAGGAATGGGAACATTCGC | |||
| GATA-3 | F: GGTCAAGGCAACCACGTC | Chen et al., 2012 | |
| R: CATCCAGCCAGGGCAGAG | |||
| H1(HA) | F: CAGATTYTGGCGATCTAYTC | ||
| R: GACCCATTAGARCACATCCAG | |||
Author response table 1
The antibody titers in preliminary experiment.
| Treatment groups(μg) | Serum antibody titer(H1N1) | Serum antibody titer(H3N2) | ||||
|---|---|---|---|---|---|---|
| 200 NMHC 3rd | >2048 | >2048 | >2048 | 1024 | 1024 | 1024 |
| 100 NMHC 3rd | 1024 | >2048 | 1024 | 256 | 256 | 256 |
| 200 NMHC 2nd | 1024 | 1024 | 1024 | 256 | 512 | 256 |
| 100 NMHC 2nd | 512 | 1024 | 512 | 256 | 128 | 128 |
Author response table 2
The absolute amount of IgG2bκ.
| NMHC | NMH | SEC2 | NMH+SEC2 | PBS | |
|---|---|---|---|---|---|
| day 100IgG2bκ (mg/ml) | 2.53±0.087 | 2.483±0.144 | 2.24±0.104 | 2.277±0.116 | 1.393±0.006 |
Additional files
-
Supplementary file 1
Breadth of the antibody response elicited by the recombinant proteins.
(a) Neutralizing antibody titers detected by standard HI. Sera were collected from immunized mice on day 42 after immunization, and the neutralization assays were performed against MI/45(H1), HK/4801(H3), Influenza Virus Infectious NYMC BX-35 (Victoria), B/Phuket/3073/2013-like virus (Yamagata) influenza viruses. The hemagglutination status of each well was visually determined. The titers of each serum sample were defined as the reciprocal of the highest dilution where no hemagglutination was observed. (b) ELISA endpoint titers of HAs or split virion. On day 42 after immunization, breadth of the antibody response elicited by the recombinant protein NMHC was determined by ELISA of the pooled antisera against purified rHA proteins or split virion. Titer was defined as the highest dilution of serum antibodies at which the mean OD450 value of the experiment group was no less than 2.1 times of the control.
- https://cdn.elifesciences.org/articles/71725/elife-71725-supp1-v2.docx
-
Transparent reporting form
- https://cdn.elifesciences.org/articles/71725/elife-71725-transrepform1-v2.pdf
Download links
A two-part list of links to download the article, or parts of the article, in various formats.
Downloads (link to download the article as PDF)
Open citations (links to open the citations from this article in various online reference manager services)
Cite this article (links to download the citations from this article in formats compatible with various reference manager tools)
A recombinant protein containing influenza viral conserved epitopes and superantigen induces broad-spectrum protection
eLife 10:e71725.
https://doi.org/10.7554/eLife.71725


