Epigenetic scores for the circulating proteome as tools for disease prediction
- Centre for Genomic and Experimental Medicine, Institute of Genetics and Cancer, University of Edinburgh, United Kingdom
- Department of Physiology and Biophysics, Weill Cornell Medicine-Qatar, Education City, Qatar
- Computer Engineering Department, Virginia Tech, United States
- Department of Psychology, University of Edinburgh, United Kingdom
- Lothian Birth Cohorts, University of Edinburgh, United Kingdom
- Centre for Clinical Brain Sciences, Chancellor’s Building, University of Edinburgh, United Kingdom
- Department of Psychiatry, University of Oxford, United Kingdom
- Department of Psychology, The University of Texas at Austin, United States
- Population Research Center, The University of Texas at Austin, United States
- Research Unit Molecular Epidemiology, Helmholtz Zentrum München, German Research Center for Environmental Health, Germany
- Institute of Epidemiology, Helmholtz Zentrum München, German Research Center for Environmental Health, Germany
- German Center for Cardiovascular Research (DZHK), partner site Munich Heart Alliance, Germany
- German Center for Diabetes Research (DZD), Germany
- Scientific Service Group Biomolecular Mass Spectrometry, Max Planck Institute for Heart and Lung Research, W.G. Kerckhoff Institute, Germany
- German Centre for Cardiovascular Research (DZHK), Partner Site Rhine-Main, Max Planck Institute of Heart and Lung Research, Germany
- Institute for Molecular Bioscience, University of Queensland, Australia
- Medical Research Council Human Genetics Unit, Institute of Genetics and Cancer, University of Edinburgh, United Kingdom
- Division of Psychiatry, University of Edinburgh, Royal Edinburgh Hospital, United Kingdom
Figures
Figure 1
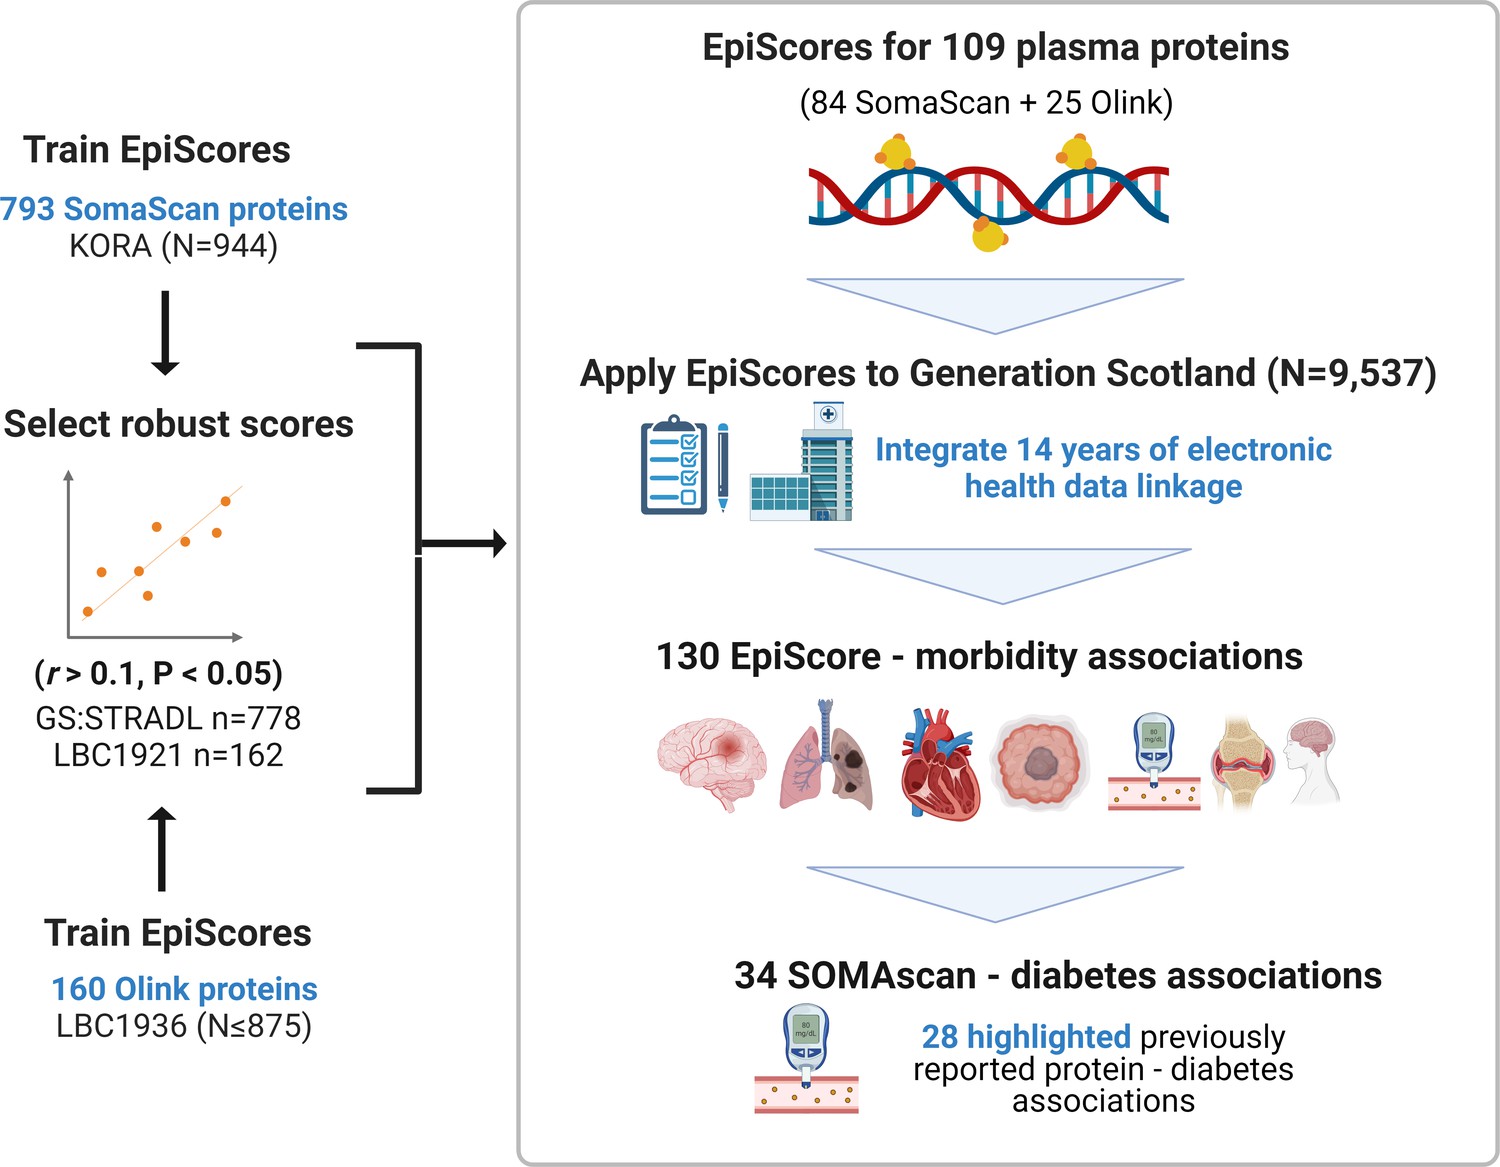
EpiScores for plasma proteins as tools for disease prediction study design.
DNA methylation scores were trained on 953 circulating plasma protein levels in the KORA and LBC1936 cohorts. There were 109 EpiScores selected based on performance (r > 0.1, p < 0.05) in independent test sets. The selected EpiScores were projected into Generation Scotland, a cohort that has extensive data linkage to GP and hospital records. We tested whether levels of each EpiScore at baseline could predict the onset of 12 leading causes of morbidity, over a follow-up period of up to 14 years; 130 EpiScore-disease associations were identified, for 10 morbidities. We then assessed whether EpiScore associations reflected protein associations for diabetes, which is a trait that has been well characterised using SOMAscan protein measurements. Of the 34 SOMAscan-derived EpiScore-diabetes associations, 28 highlighted previously reported protein-diabetes associations.
Figure 2 with 2 supplements
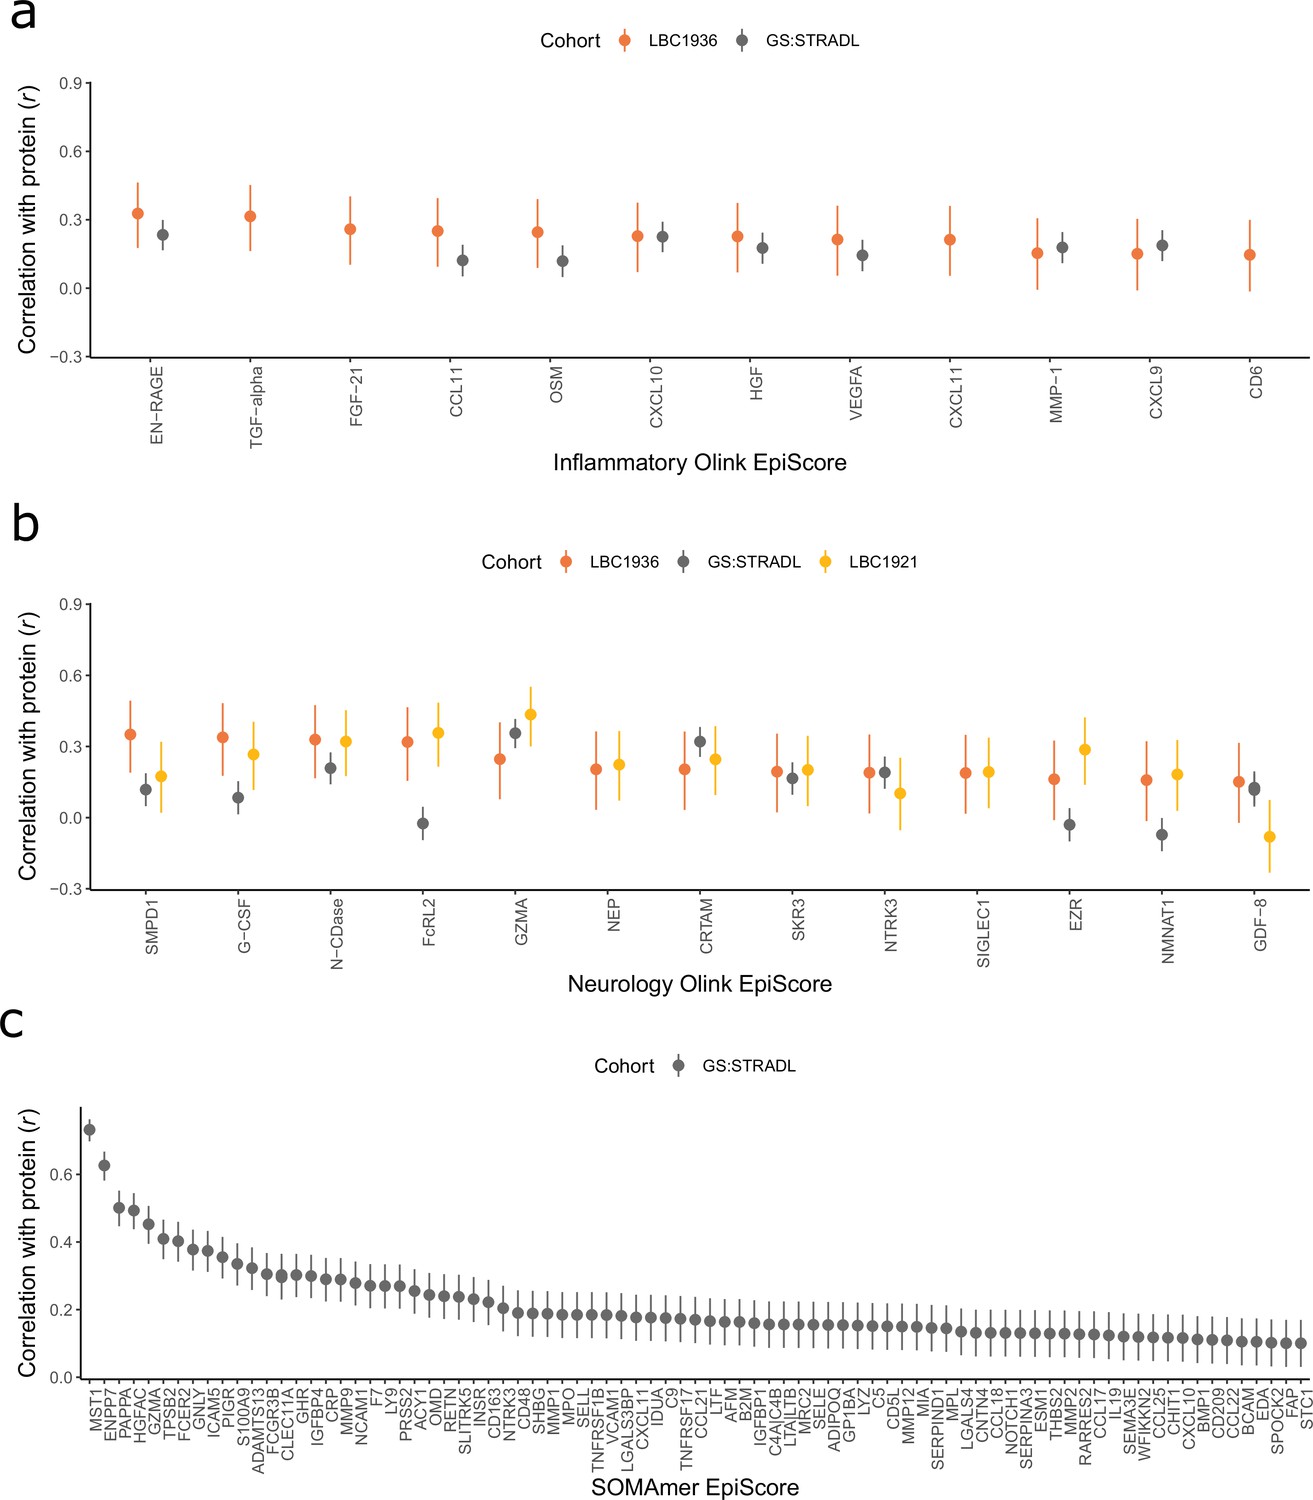
Test performance for the 109 selected protein EpiScores.
Test set correlation coefficients for associations between protein EpiScores for (a) inflammatory Olink, (b) neurology Olink, and (c) SOMAmer protein panel EpiScores and measured protein levels are plotted. 95% confidence intervals are shown for each correlation. The 109 protein EpiScores shown had r > 0.1 and p < 0.05 in either one or both of the GS:STRADL (n = 778) and LBC1921 (n = 162) test sets, wherever protein data was available for comparison. Data shown corresponds to the results included in Supplementary file 1B-C. Correlation heatmaps between the 109 EpiScore measures (Figure 2—figure supplement 1) are provided, along with a summary of the most enriched functional pathways for the genes of the 109 proteins used to train EpiScores (Figure 2—figure supplement 2).
Figure 2—figure supplement 1
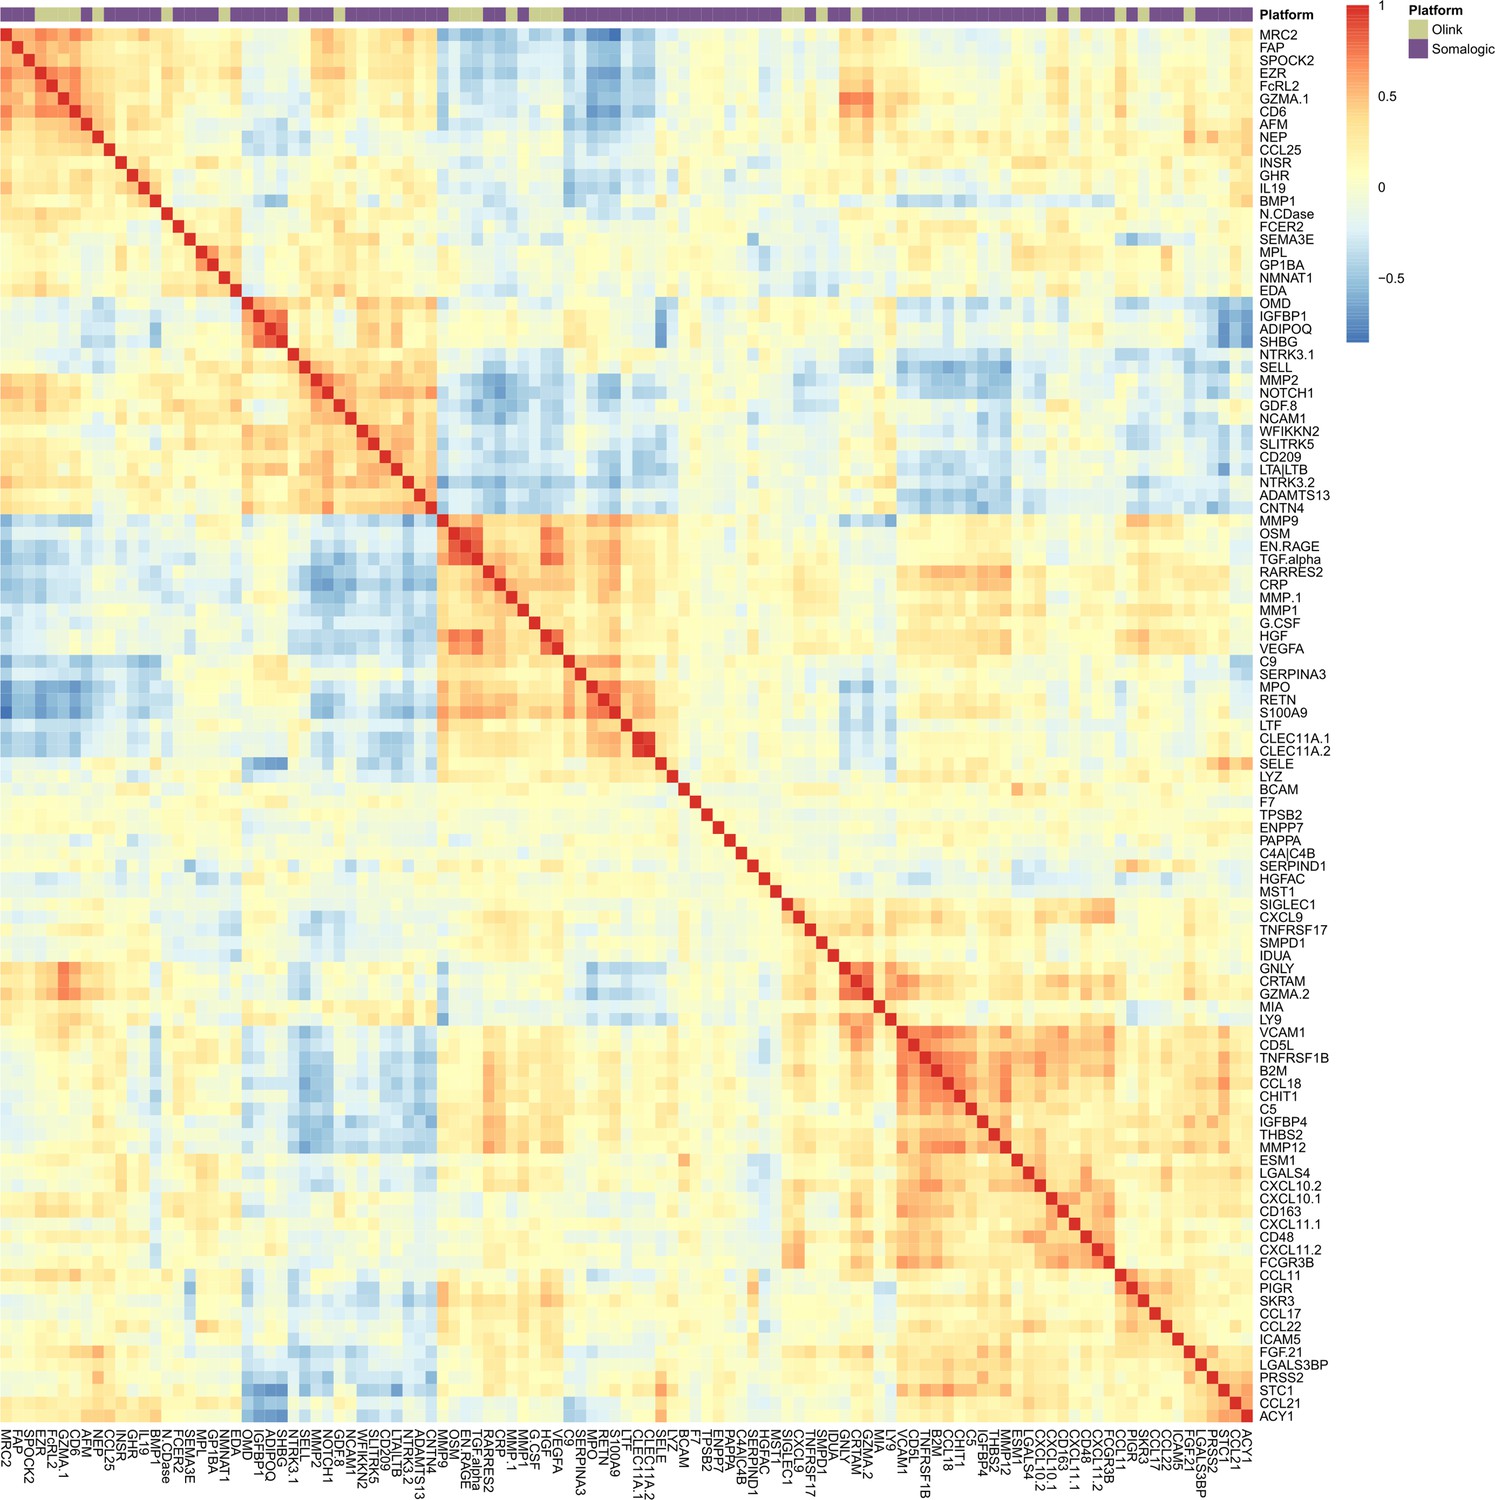
Correlation heatmap for protein EpiScore measures in Generation Scotland.
Correlation heatmap for EpiScore measures projected into Generation Scotland (N = 9537) for the 109 protein EpiScores selected in the test sample (r > 0.1, p < 0.05). At the top of the heatmap, an annotation bar is displayed. Olink proteins are shown in pale green and Somalogic proteins are shown in purple.
Figure 2—figure supplement 2
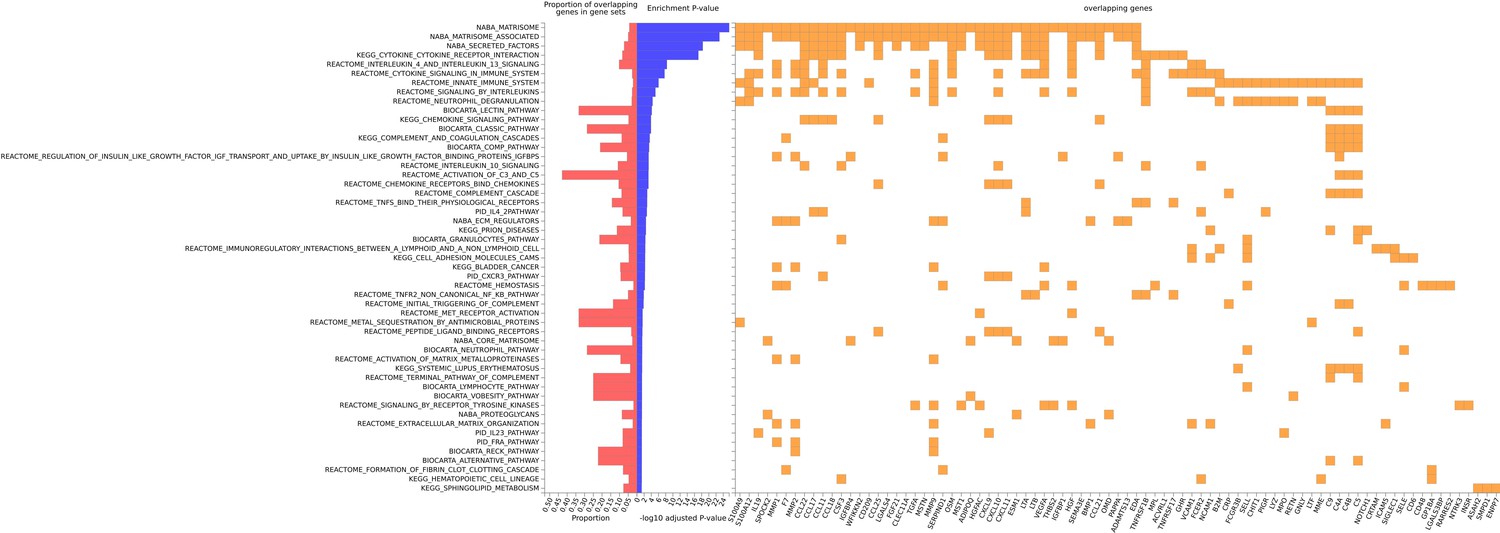
GeneSet enrichment of canonical pathways common to the genes encoding proteins that were used to train the 109 selected EpiScores.
Genes selected for pathway enrichment (false discovery rate [FDR]-adjusted p < 0.05) are summarised, with the proportion of overlapping genes enriched in the gene-set also shown. The corresponding data for this figure can be accessed in full in Supplementary file 1H.
Figure 3 with 1 supplement
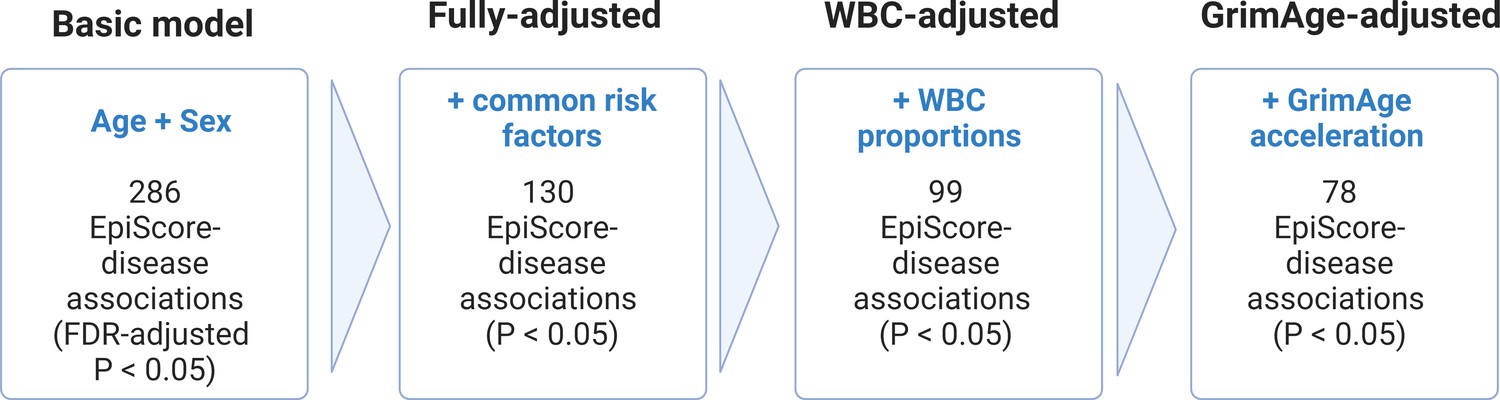
Nested Cox proportional hazards assessment of protein EpiScore-disease prediction.
Mixed effects Cox proportional hazards analyses in Generation Scotland (n = 9537) tested the relationships between each of the 109 selected EpiScores and the incidence of 12 leading causes of morbidity (Supplementary file 1I-J). The basic model was adjusted for age and sex and yielded 286 associations between EpiScores and disease diagnoses, with false discovery rate (FDR)-adjusted p < 0.05. In the fully adjusted model, which included common risk factors as additional covariates (smoking, deprivation, educational attainment, body mass index (BMI), and alcohol consumption), 130 of the basic model associations remained significant with p < 0.05. In a sensitivity analysis, the addition of estimated white blood cells (WBCs) to the fully adjusted models led to the attenuation of 31 of the 130 associations. In a further sensitivity analysis, 78 associations remained after adjustment for both immune cell proportions and GrimAge acceleration.
Figure 3—figure supplement 1
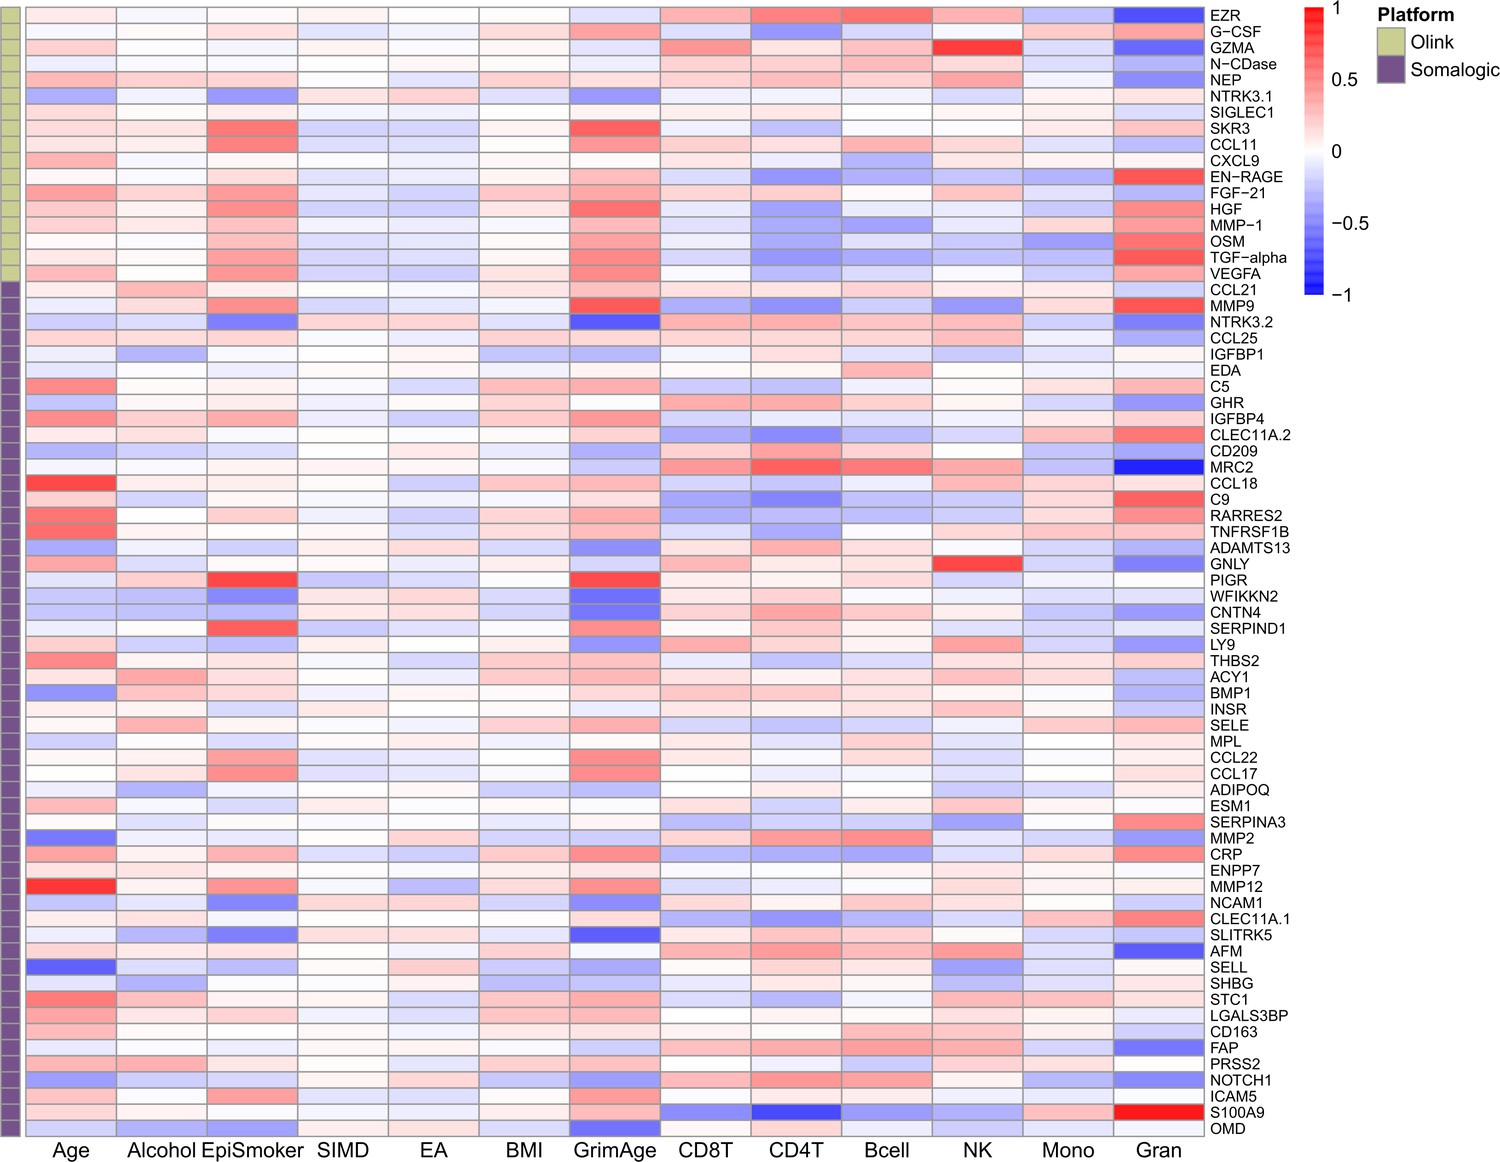
Phenotypic trait and estimated white blood cell proportion correlations with EpiScores.
Heatmap of Pearson's correlations (r) between the 70 protein EpiScore measures that were associated with incident disease (with p < 0.05 in the fully adjusted Cox mixed effects proportional hazards models) and continuous phenotypic/lifestyle trait variables and Houseman-estimated white blood cell proportions in Generation Scotland (total N = 9537). Protein measurements used to train the predictors were adjusted for age and sex. The maximum sample size available was used for each correlation. GrimAge: GrimAge acceleration. Units: weekly units of alcohol. EpiSmoker: DNAm-derived score for smoking. SIMD: Scottish Index of Multiple Deprivation. EA: educational attainment. Mono: monocytes. Gran: granulocytes. NK: natural killer cells.
Figure 4
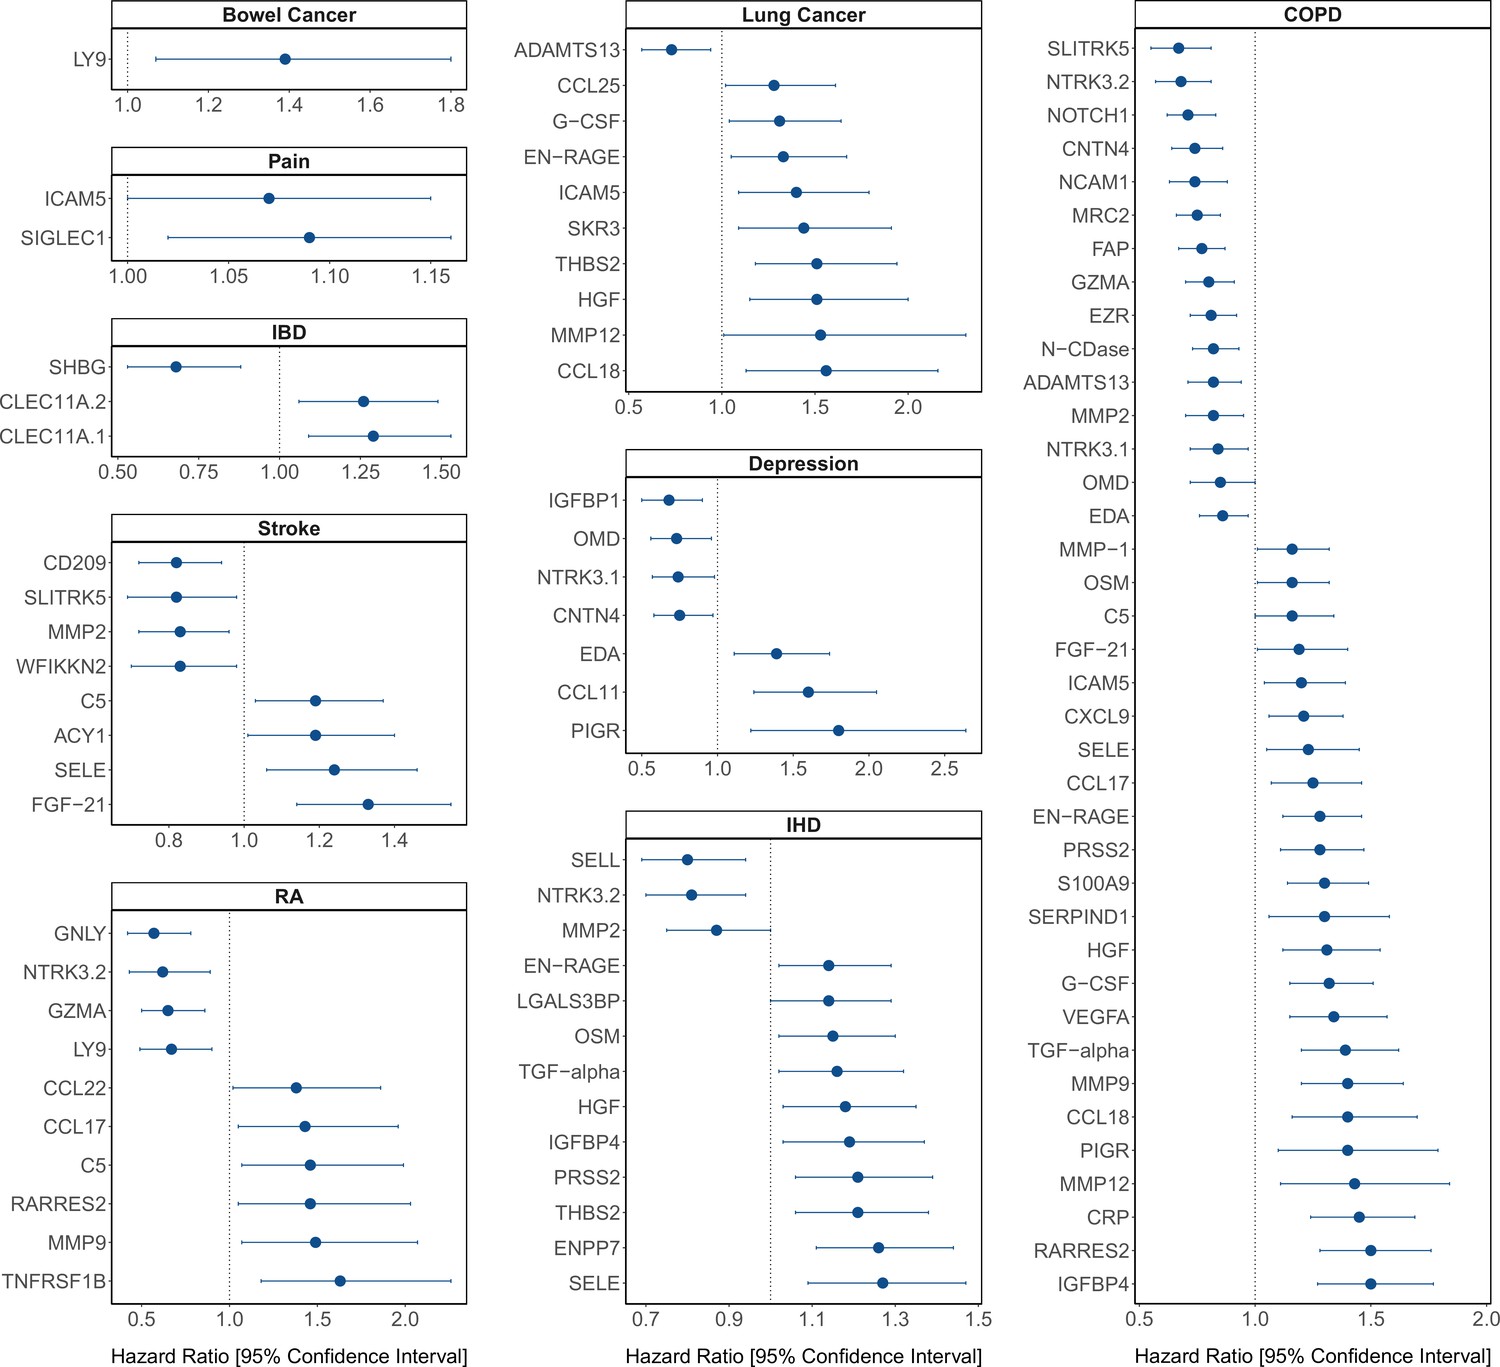
Protein EpiScore associations with incident disease.
EpiScore-disease associations for 9 of the 11 morbidities with associations where p < 0.05 in the fully adjusted mixed effects Cox proportional hazards models in Generation Scotland (n = 9537). Hazard ratios are presented with confidence intervals for 92 of the 130 EpiScore-incident disease associations reported. Models were adjusted for age, sex, and common risk factors (smoking, body mass index (BMI), alcohol consumption, deprivation, and educational attainment). IBD: inflammatory bowel disease. IHD: ischaemic heart disease. COPD: chronic obstructive pulmonary disease. For EpiScore-diabetes associations, see Figure 6. Data shown corresponds to the results included in Supplementary file 1J.
Figure 5
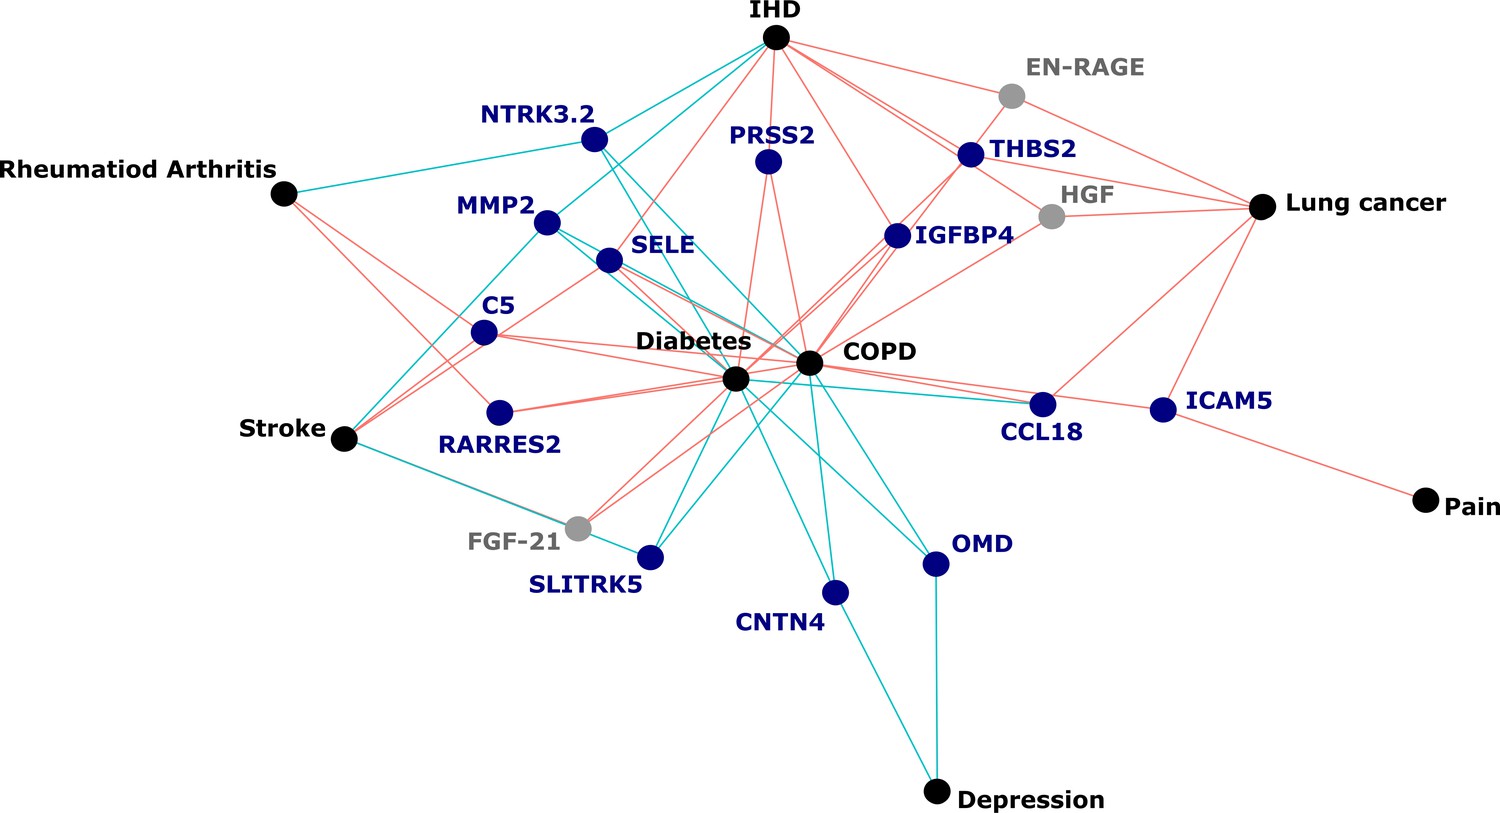
Protein EpiScores that associated with the greatest number of morbidities.
EpiScores with a minimum of three relationships with incident morbidities in the fully adjusted Cox models. The network includes 16 EpiScores as dark blue (SOMAscan) and grey (Olink) nodes, with disease outcomes in black. EpiScore-disease associations with hazard ratios < 1 are shown as blue connections, whereas hazard ratios > 1 are shown in red. COPD: chronic obstructive pulmonary disease. IHD: ischaemic heart disease. Data shown corresponds to the results included in Supplementary file 1J.
Figure 6
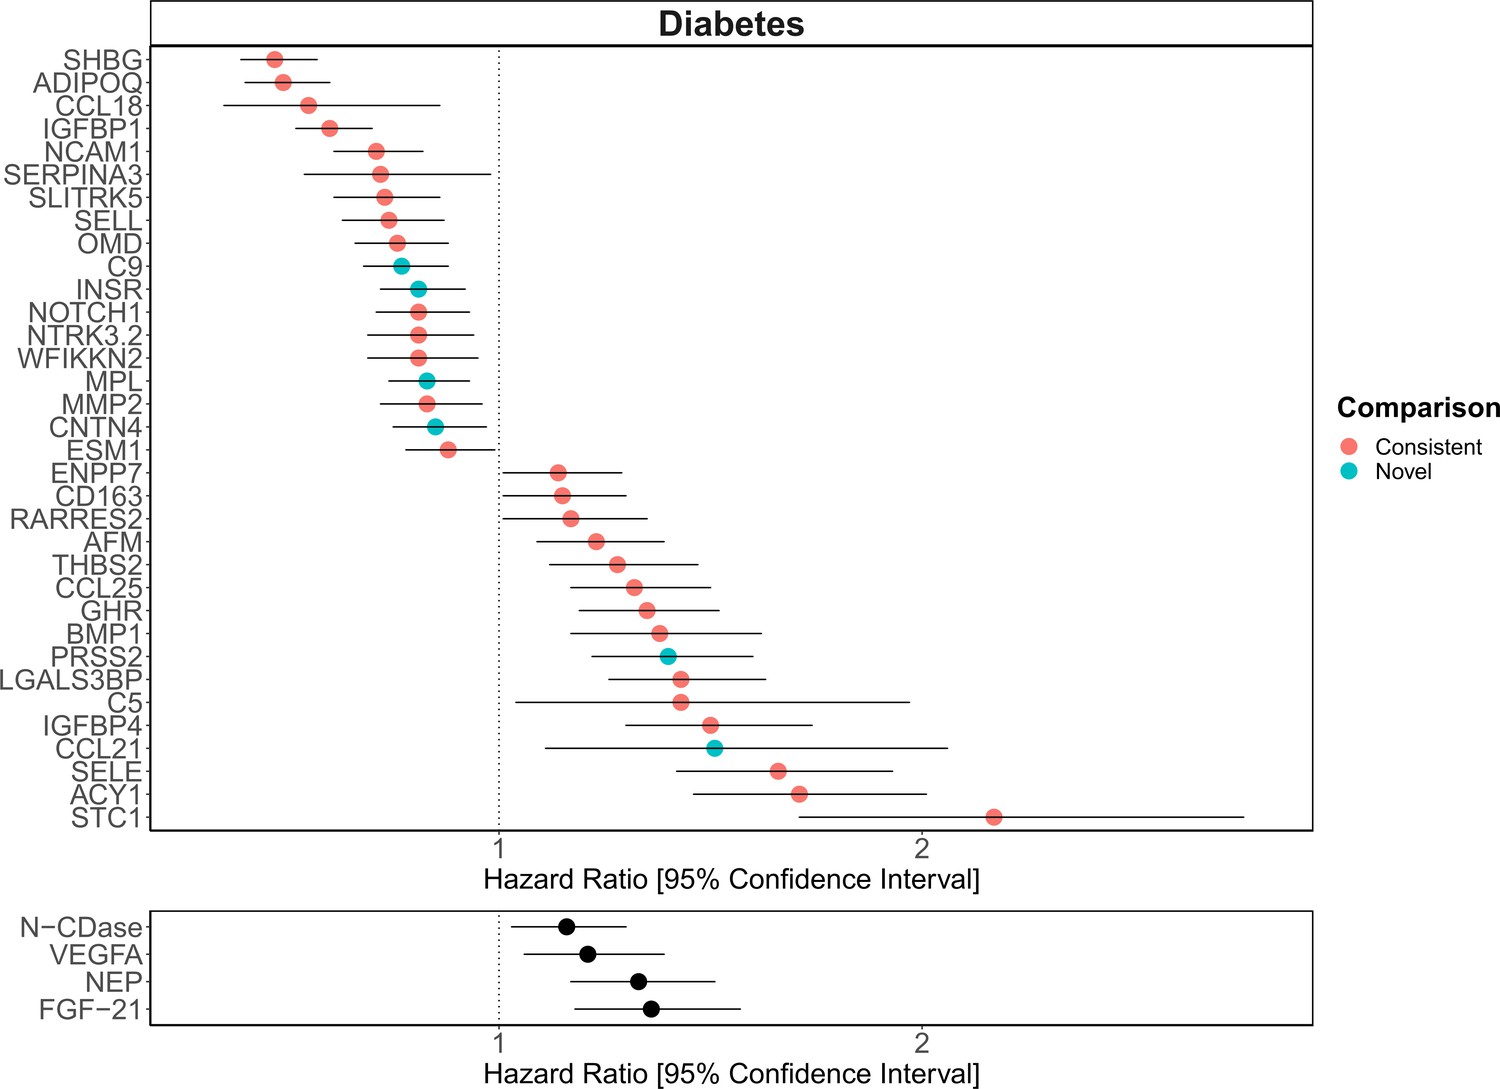
Replication of known protein-diabetes associations with protein EpiScores.
EpiScore-incident diabetes associations in Generation Scotland (n = 9537). The 34 SOMAscan (top panel) and four Olink (bottom panel) associations shown with p < 0.05 in fully adjusted mixed effects Cox proportional hazards models. Of the 34 SOMAscan-derived EpiScores, 28 associations were consistent with protein-diabetes associations (pink) in one or more of the comparison studies that used SOMAscan protein levels. Six associations were novel (blue). Data shown corresponds to the results included in Supplementary files 1J and M.
Author response image 1
Tables
Table 1
Incident morbidities in the Generation Scotland cohort.
Counts are provided for the number of cases and controls for each incident trait in the basic and fully adjusted Cox models run in the Generation Scotland cohort (n = 9537). Mean time-to-event is summarised in years for each phenotype. Alzheimer’s dementia cases and controls were restricted to those older than 65 years. Breast cancer cases and controls were restricted to females.
| Basic model | Fully adjusted model | |||||
|---|---|---|---|---|---|---|
| Morbidity | N cases | N controls | Years to event (mean, SD) | N cases | N controls | Years to event (mean, SD) |
| Rheumatoid arthritis | 63 | 9289 | 5.6 (3.5) | 52 | 7742 | 6.1 (3.3) |
| Alzheimer’s dementia | 69 | 3764 | 7.7 (3) | 52 | 3137 | 7.6 (3.1) |
| Bowel cancer | 78 | 9398 | 6.4 (3.2) | 66 | 7817 | 6.5 (3.2) |
| Depression | 95 | 8317 | 4 (3.2) | 75 | 6984 | 3.8 (3.2) |
| Lung cancer | 100 | 9433 | 5.6 (3.2) | 78 | 7850 | 5.6 (3.1) |
| Breast cancer | 131 | 5356 | 6.1 (3.4) | 111 | 4402 | 5.9 (3.4) |
| Inflammatory bowel disease | 194 | 9114 | 5 (3.6) | 155 | 7592 | 4.8 (3.6) |
| Stroke | 313 | 9026 | 6.4 (3.4) | 246 | 7547 | 6.3 (3.5) |
| COPD | 322 | 8960 | 5.5 (3.4) | 253 | 7476 | 5.5 (3.5) |
| Ischaemic heart disease | 385 | 8649 | 5.6 (3.4) | 302 | 7251 | 5.7 (3.4) |
| Diabetes | 429 | 8757 | 5.6 (3.4) | 322 | 7332 | 5.5 (3.4) |
| Pain | 1329 | 5480 | 4.8 (3.5) | 1081 | 4593 | 4.9 (3.5) |
-
COPD: chronic obstructive pulmonary disease.
Additional files
-
Supplementary file 1
Demographic information and supplementary datasets.
(A) Demographic and array information for the cohorts and samples used in the study. (B) SomaScan panel EpiScore performance in the Stratifying Resilience and Depression Longitudinally (STRADL) test set. (C) Performance of Olink panel EpiScores in holdout, STRADL, and LBC1921 test sets. (D) Annotations for the proteins corresponding to the 109 selected EpiScores. (E) Predictor weights for the 109 EpiScores from Olink and SomaScan panels which passed testing in independent cohorts. (F) CpG feature counts for the 109 selected EpiScores. (G) Frequency of CpG sites selected for EpiScores with EWAS catalog annotations to phenotypic traits. (H) FUMA canonical pathway Gene set enrichment for the genes encoding the 109 proteins EpiScores were trained on. (I) Basic Cox proportional hazards model results in Generation Scotland. (J) Fully adjusted and sensitivity analyses results for Cox proportional hazards models in Generation Scotland. (K) Schoenfeld residual Cox sensitivity analyses. (L) Schoenfeld residual Cox sensitivity analyses split by year of follow-up. (M) SOMAscan-EpiScore diabetes association lookup against three large-scale plasma protein-diabetes studies. (N) White blood cell sensitivity analyses. (O) GrimAge sensitivity analyses. (P) COVID-19 analyses. Q-1B1 Primary and secondary diagnosis codes for each of the 12 morbidities in this study that were used to assign case/control status of participants.
- https://cdn.elifesciences.org/articles/71802/elife-71802-supp1-v3.xlsx
-
Transparent reporting form
- https://cdn.elifesciences.org/articles/71802/elife-71802-transrepform1-v3.pdf
Download links
A two-part list of links to download the article, or parts of the article, in various formats.
Downloads (link to download the article as PDF)
Open citations (links to open the citations from this article in various online reference manager services)
Cite this article (links to download the citations from this article in formats compatible with various reference manager tools)
Epigenetic scores for the circulating proteome as tools for disease prediction
eLife 11:e71802.
https://doi.org/10.7554/eLife.71802


