An entropic safety catch controls hepatitis C virus entry and antibody resistance
- Institute of Immunity and Transplantation, Division of Infection and Immunity, University College London, United Kingdom
- Institute of Structural and Molecular Biology, Birkbeck College, United Kingdom
- MRC-University of Glasgow Centre for Virus Research, United Kingdom
- Shared Research Facilities, The Institute of Cancer Research, United Kingdom
- Division of Infection and Immunity, University College London, United Kingdom
- International Agency for Research on Cancer, World Health Organization, France
- The Pirbright Institute, United Kingdom
- Division of Medicine, Institute for Liver and Digestive Health, University College London, United Kingdom
- Department of Genetics, University of Cambridge, United Kingdom
- Institut für Biologische Physik, Universität zu Köln, Germany
- MRC Biostatistics Unit, University of Cambridge, United Kingdom
Figures
Figure 1 with 2 supplements
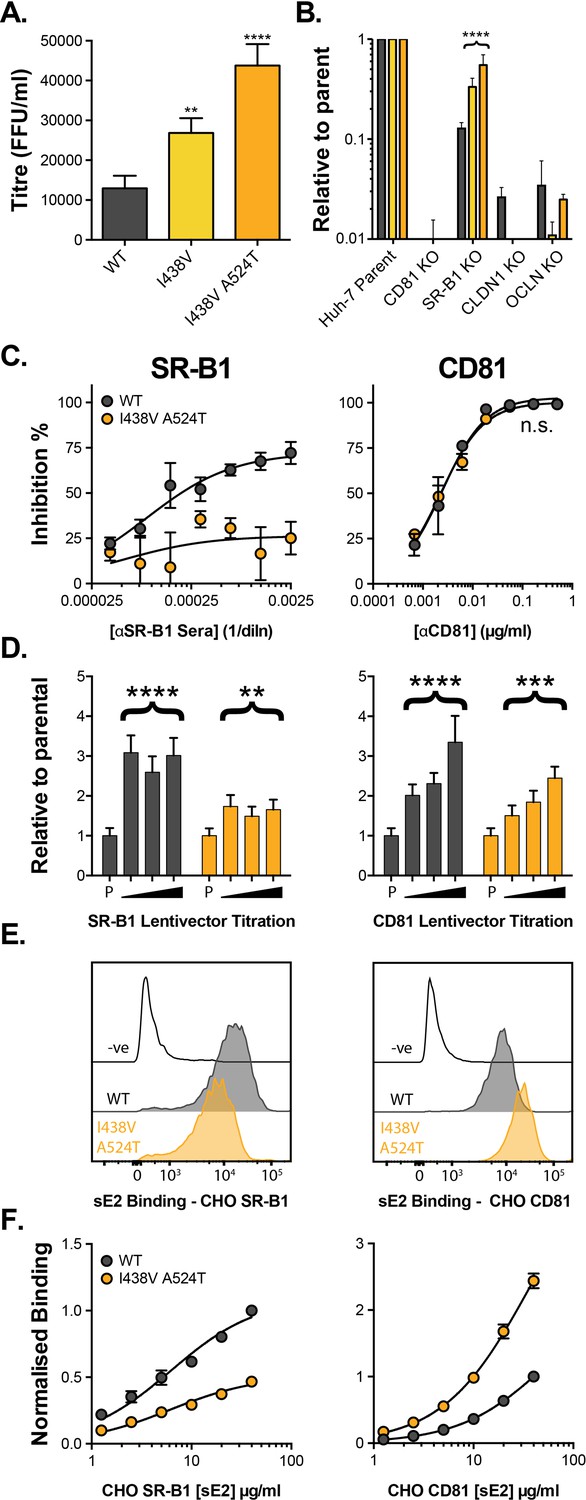
HCV evolves to optimise entry through altered receptor dependency.
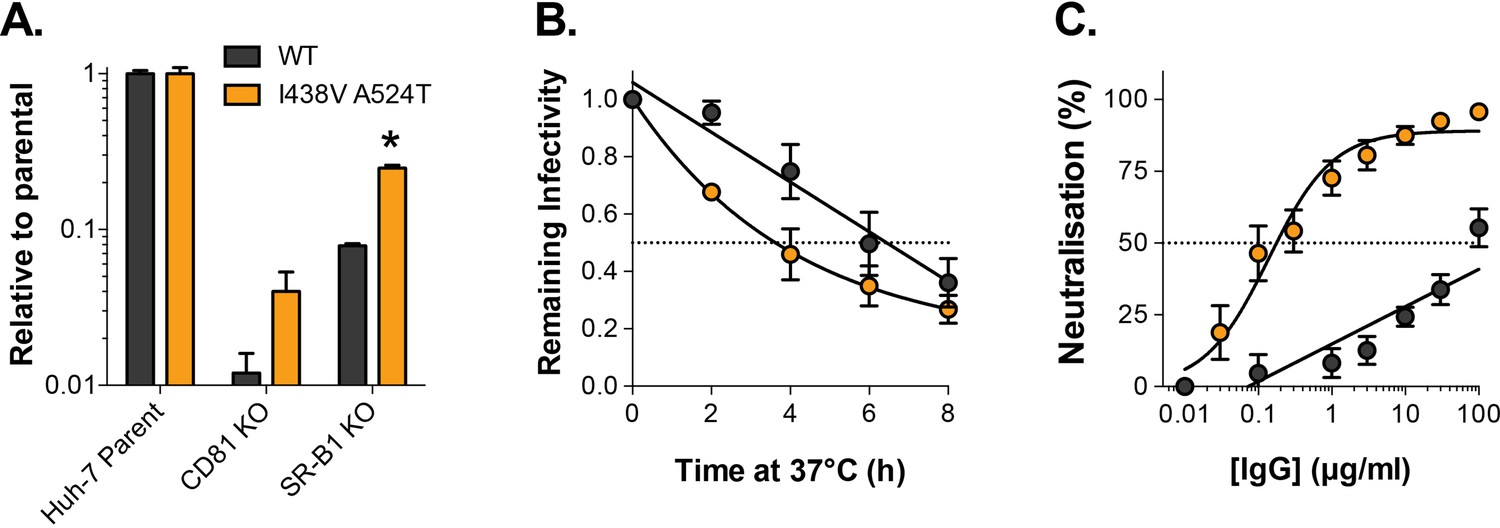
J6/JFH HCVcc mutants were isolated following continuous propagation in Huh-7.5 cells. (A) Infectivity of WT, I438V and I438V A524T HCVcc, expressed as foci forming units per ml. Values were normalised for input particle numbers. (B) WT and mutant HCV infection of parental Huh-7 cells and those CRISPR/Cas9 engineered to knock out the stated HCV entry factor. To aid direct comparison of each mutant, infection values have been expressed relative to that observed in parental Huh-7 cells. Values represent the mean of three independent experiments. Colour-coding as denoted in A. (C) Huh-7.5 cells were treated with anti-SR-B1 serum (left) or anti-CD81 mAb (right) to limit receptor availability. Infection by WT and I438V A524T HCVcc is expressed as % inhibition relative to infection of untreated cells. Data points represent the mean of three independent experiments. (D) To increase receptor availability, Huh-7.5 cells were transduced with a serial dilution of lentiviral vectors encoding either SR-B1 (left) or CD81 (right). Infection by WT and I438V A524T HCVcc is expressed relative to their respective infection of parental cells (P). Example data from one representative transduction is shown. (E. & F) CHO cells were transduced to express exogenous human SR-B1 (left) or CD81 (right), to which WT and mutant sE2 binding was assessed by flow cytometry. Upper plots (E). provide representative cytometry histograms of sE2 binding to transduced or parental (-ve) CHO cells. Lower plots (F). display quantification of sE2 binding, with values normalised to WT binding at 40 µg/ml. Data points represent the mean of three independent experiments. In all plots, error bars indicate standard error of the mean, asterisks denote statistical significance (ANOVA, GraphPad Prism). Curve fitting (C. and F.) performed with a hyperbola function and the curves compared to confirm significance difference (F-test, p<0.0001, GraphPad Prism); n.s. denotes the lack of significant difference.
Figure 1—figure supplement 1
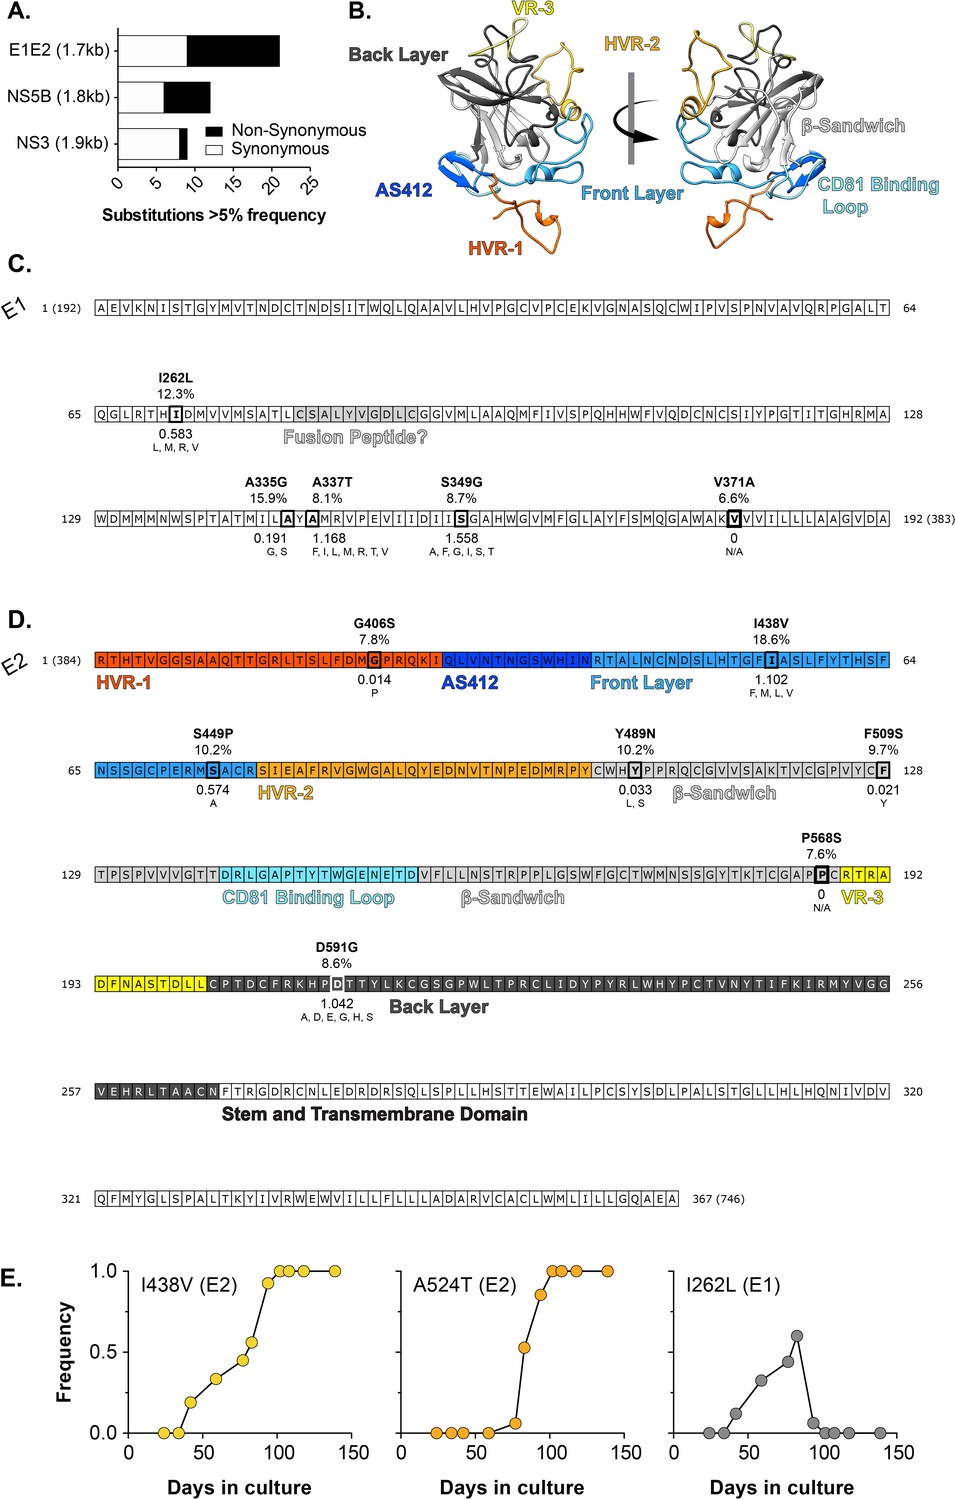
In vitro evolution of HCV.
J6/JFH HCVcc was continuously propagated in Huh-7.5 cells for 20 weeks with viral evolution monitored by NGS. (A) The proportion of synonymous (white) and non-synonymous (black) substitutions occurring at >5% frequency at day 42 in three coding regions of comparable length: E1E2 (entry glycoproteins), NS5B (polymerase), NS3 (protease). (B) Molecular model of J6 E2 colour-coded by antigenic/functional region (C. & D). Non synonymous substitutions mapped onto linear representations of the E1 (C) and E2 (D). protein sequences. Functional and structural features are highlighted (e.g. the putative fusion peptide). The E2 sequence is colour-coded by region, as denoted in B. Each substitution is annotated with: (i) the observed mutation, (ii) the frequency in the experimental population at day 42 (%), (iii) the shannon entropy calculated from patient derived sequences, with low values denoting high conservation (iv) substitutions that naturally occur at these positions in patient derived sequences; N/A (not applicable) indicates the lack of natural variants. (E) Emergence and fixation/loss of substitutions at position 438 (Front layer), 524 (CD81 Binding Loop), and 262 (E1). By 100 days, all viruses possessed the I438V A524T double mutation. Note that residue numbering is relative to the start of the HCV polyprotein and corresponds to the position in the H77 reference clone, as is convention within the HCV field.
Figure 1—figure supplement 2

Inhibition of HCVcc infection by BLT-4.
Huh-7.5 cells, treated with a serial dilution of a small molecule inhibitor of SR-B1 (BLT-4), were infected with WT and mutant HCVcc. Infection is expressed as % inhibition relative to untreated cells. Data points represent the mean of three independent experiments. The data was fitted with a hyperbola function and the curves were determined to be statistically significant (F-test, p<0.0001, GraphPad Prism), error bars indicate standard error of the mean.
Figure 2 with 1 supplement

HCV I438V A524T is hyper-reactive.
(A) WT and I438V A524T HCVcc were incubated for 0–8 hr at 37 °C before infection of Huh-7.5 cells. Remaining infectivity is expressed relative to t=0 time point. Data points represent the mean of two independent experiments, data was fitted using an exponential decay function. (B) Mathematical modelling was used to predict the entry characteristics of WT and I438V A524T HCVcc (also see Figure 2—figure supplement 1). Heat maps display the probability of virus entry (as denoted in the key), for any given virus particle, upon varying availability of SR-B1 or CD81. Receptor availability is scaled relative to parental Huh-7.5 cells (C) Kinetics of WT and mutant HCVcc entry, as predicted by mathematical modelling. The data is normalised to maximum entry. T represents uncalibrated time and, therefore, cannot be converted to real time, but relative differences can be estimated. Comparison of time to 50% entry suggests that I438V A524T HCVcc completes entry ~3 times faster than WT. (D) Kinetics of WT and mutant HCV entry were experimentally measured by synchronised infection of Huh-7.5 cells by HCVpp, followed by chase with a saturating inhibitory concentration of anti-CD81 mAb. Mutant HCVpp escaped the inhibitory effects of anti-CD81 ~3.5 times faster than WT. Data points represent the mean of three independent experiments, the data is normalised to entry in the absence of anti-CD81 mAb. The data was fitted with a sigmoid function. In all plots, error bars indicate standard error of the mean, fitted curves were confirmed to be significantly different (F-test, p<0.001, GraphPad Prism).
Figure 2—figure supplement 1
Mathematical modelling of HCV entry.
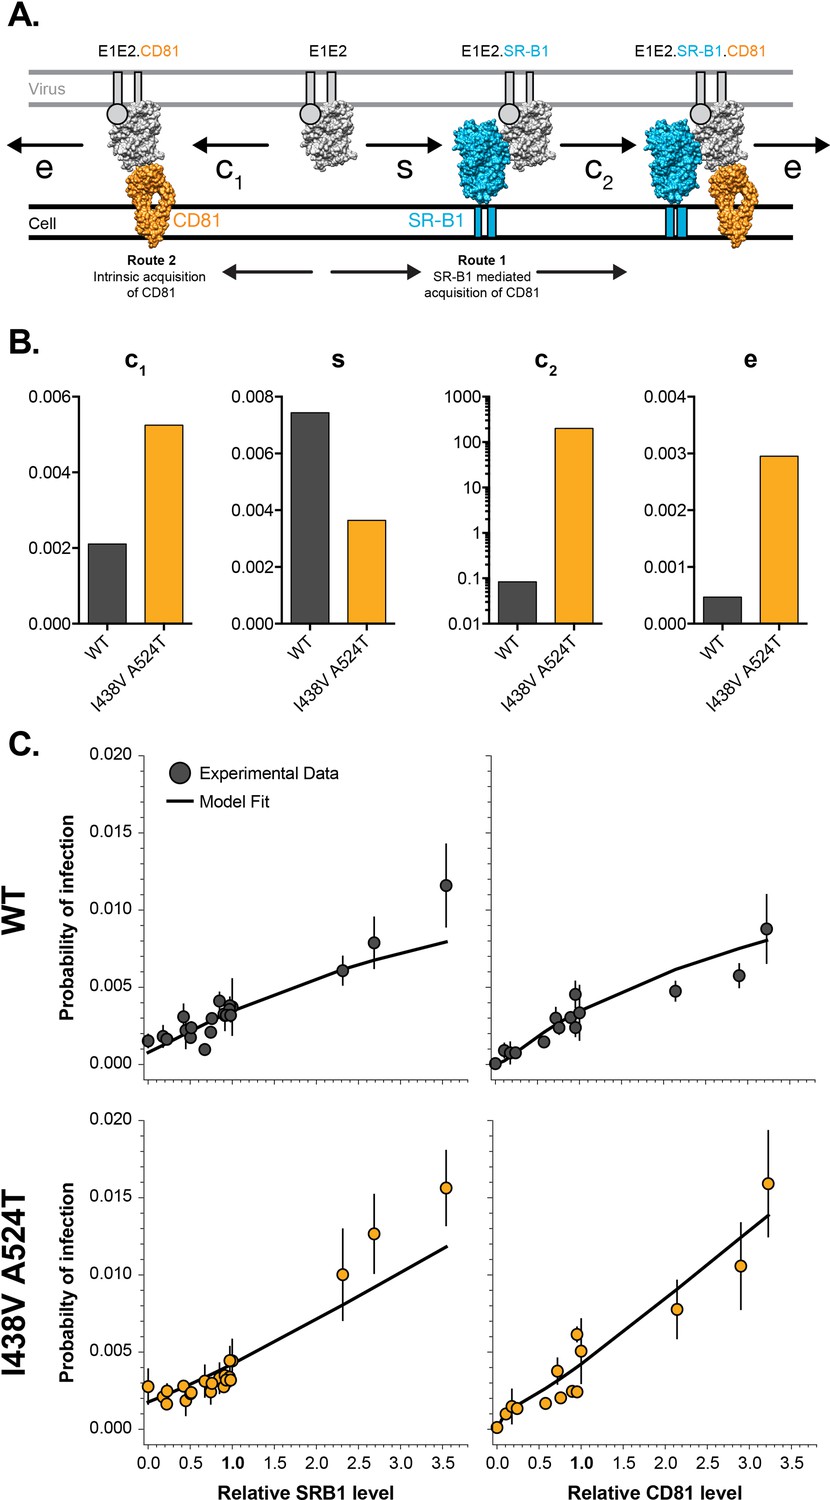
We previously developed a mathematical model to explore HCV receptor engagement and entry (Kalemera et al., 2019). Receptor dependency data from WT and I43V A524T HCVcc (Figures 1 and 2) was integrated into the mathematical model (as described in the methods), allowing estimation of the entry efficiency of either virus (A) E1E2-receptor interactions at the cell surface, as recreated in our model. To achieve entry E1E2 must acquire CD81, this can occur via two routes. Route 1 SR-B1 mediated: prior binding to SR-B1 (at rate s), primes E1E2 for interaction with CD81 (at rate c2). Route 2 intrinsic binding: E1E2 interact with CD81 without prior engagement of SR-B1 (at rate c1). Once sufficient molecules of CD81 have been acquired the virus particle proceeds along the entry pathway (including endocytosis and fusion) at rate (e). Molecular cartoons are based on previously published structures and are drawn to scale, E1 is represented as a circle due to a paucity of structural information. (B) Plots display estimated values of each rate constant for WT (grey) and I438V A524T (orange); all values are unitless, hence the absence of labels on the y-axes. C. Experimental data and mathematical model fit under varying availability of SR-B1 and CD81 for WT and I438V A524T HCV. Note, receptor availability was modulated by antibody blockade or over-expression. Infection probabilities were calculated by integrating the input number of virus particles, number of infected foci and total number of cells.
Figure 3 with 3 supplements
Hyper-reactive HCV is acutely sensitive to all neutralising antibodies.
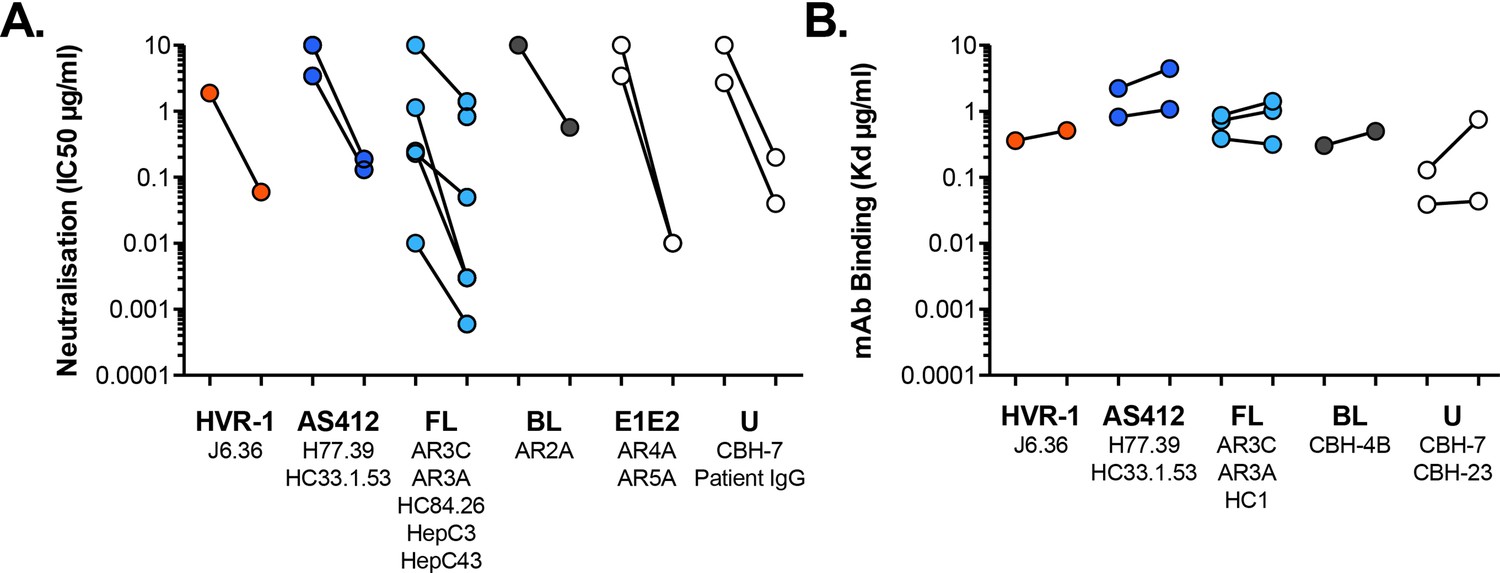
(A) Neutralisation of WT and I438V A524T HCVcc by a serial dilution of HCV patient IgG. (B) Molecular cartoon of major antigenic sites targeted by nAbs. (C) Neutralisation curves for three representative mAbs targeting distinct sites, the mAb name and specificity are provided and colour coded to match B. (D) 50% inhibitory concentrations of 14 mAbs, data points are colour coded according to their antigenic target, asterisks indicate statistical significance (T-test, GraphPad Prism). (E) Binding of mAbs to WT and I438V A524T E2 assessed by ELISA; mAbs matched to neutralisation data. (F) Estimated dissociation constants for 9 mabs, data points colour coded as above, there is no significant difference between WT and mutant (T-test, GraphPad Prism). (G) HCVcc neutralisation by soluble CD81 EC2. For all neutralisation curves, data points represent the mean of n=2 or 3 independent experiments. I438V A524T data were best fitted by a hyperbola function (GraphPad Prism), WT data were best fitted by a semi-log function (except for H77.39). For ELISA data, one representative experiment is shown, with data fitted with a hyperbola function. All neutralisation curves determined to be statistically significant (F-test, p<0.0001, Graphpad prism), there were no significant differences in the binding curves. In all plots, error bars indicate standard error of the mean. Estimates of IC50s and Kd were obtained from the fitted curves.
Figure 3—figure supplement 1
Antibody sensitivity and antigenicity of WT and I438V A524T HCV.
(A) 50% inhibitory concentrations of mAbs (as provided in Figure 3D) separated according to antigenic targets. mAb names are provided for each target. FL and BL refer to Front Layer and Back Layer. E1E2 mAbs bind to a discontinuous epitope comprising elements of both E1 and E2. U represents poorly defined epitopes. (B) Dissociation constants determined by ELISA (as provided in Figure 3F), separated according to antigenic targets.
Figure 3—figure supplement 2
Hyper-reactive phenotype is recapitulated in HCV pseudoparticles.
We characterised WT and I438V A524T E1E2 in the context of HCV pseudoparticles. (A) HCVpp infection of parental or receptor knockout Huh-7, data is expressed relative to parental cells. (B) Stability of HCVpp at 37 °C, data points represent the mean of three independent experiments, I438V A524T data was best fitted using an exponential decay function, WT data was best fitted by linear regression. (C) Neutralisation of HCVpp by patient IgG, data points represent the mean of three independent experiments. Data was fitted with a hyperbola function (I438V A524T) or semilog function (WT). In each plot error bars indicate standard error of the mean; asterisks denote statistical significance (ANOVA, Graphpad prism); all curves determined to be statistically significant (F-test, p<0.0001, Graphpad prism).
Figure 3—figure supplement 3
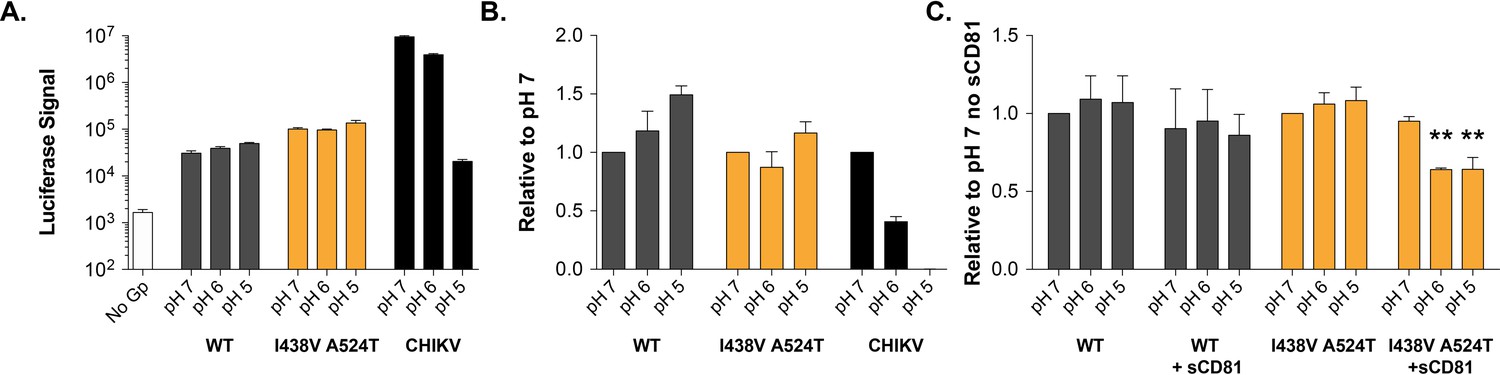
pH sensitivity of HCV or Chikungunya (CHIKV) E1E2 pseudovirus .
Virus particles were immobilised and incubated in PBS at pH 7, 6 or 5 prior to addition of Huh-7.5 target cells, infections were read after 72hr. (A) Example raw data demonstrating luciferase signals of acid treated HCVpp and CHIKV. pH 7 treated no glycoprotein pseudovirus acts as a background control. (B) Data normalised to the respective pH 7 treated virus, mean of three independent repeats. (C) The experiment was repeated with and without the addition of 1 µg/ml sCD81, data normalised to pH 7 treated virus without sCD81 for either virus, mean of three independent repeats. In each plot, error bars indicate standard error of the mean; asterisks denote statistical significance (ANOVA, Graphpad prism).
Figure 4 with 5 supplements
Hyper-reactive HCV exhibits stabilisation of HVR-1.
The conformational dynamics of WT and I438V A524T E2 ectodomain were explored by five independent 1µs MD simulations. (A) Images summarising two representative simulations; superimposed snapshots of HVR-1 are colour coded according to time (as shown in key), the remainder of E2 is shown in grey for the earliest frame only. (B) Root mean square deviation (RMSD) of HVR-1 for the simulations shown in A. (C) Average root mean square fluctuation (RMSF) for WT and I438V A524T E2, from five independent experiments, error bars indicate standard error of the mean. X-axis denotes regions of E2. Inset provides a zoom of the data for HVR-1, RMSF values to the left of the dashed line reach statistical significance (ANOVA, GraphPad Prism). (D) Average RMSF values (as in C.) plotted on to molecular cartoons of E2, colour coded as shown in key. HVR-1 is labelled on the WT structure. Summaries of MD simulations are provided in Figure 4—figure supplements 2 and 3. (E) Estimation of unordered protein content, by circular dichroism spectroscopy, for WT, I438V A524T and ΔHVR-1 sE2. Data represent the mean of three independent measurements. (F) Intrinsic fluorescence ratio (330 nm over 350 nm), measured by nano differential scanning fluorimetry, for WT, I438V A524T, and ΔHVR-1 sE2 at 37 °C. Data represent the mean of three independent measurements. Asterisks denote statistical significance (ANOVA, GraphPad Prism).
Figure 4—figure supplement 1
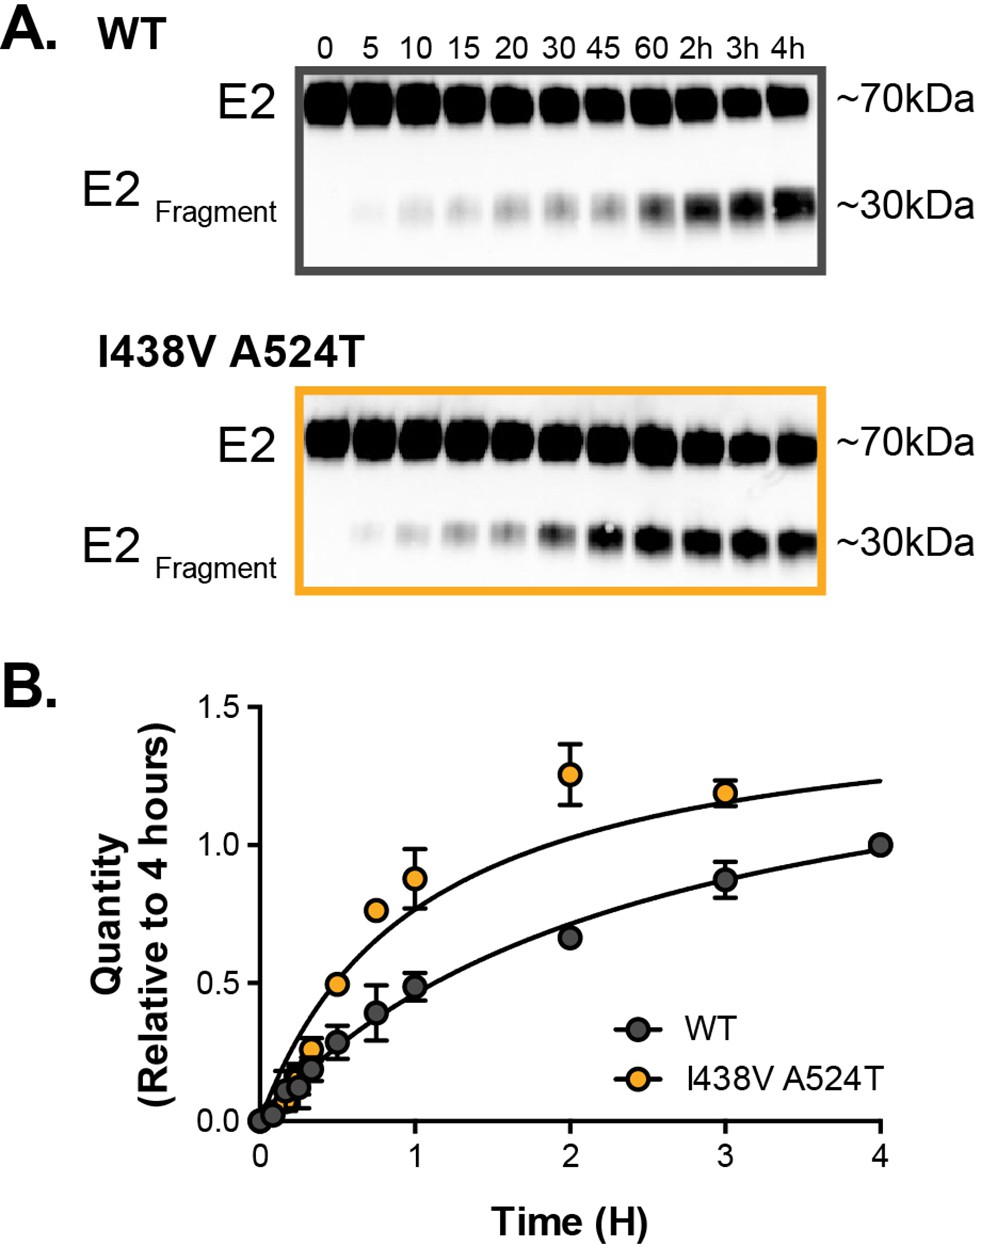
Limited proteolysis of soluble E2.
Soluble E2 (WT or I438V A524T) was incubated at 37 °C with endproteinase GluC for up to 4 hr. (A) Representative western blot images of digestion over time (minutes and hours as indicated); incubation with GluC gives rise to a~30 kda digest product (E2Fragment). (B) The kinetics of digestion was evaluation by measuring the quantity of E2Fragment; the data is expressed relative to the intensity of product at 4 hr, data points represent the mean of three independent experiments, error bars indicate standard error of the mean. Data were fitted with a hyperbola function and curves were compared to determine statistical significance (F-test, p<0.0001,GraphPad Prism).
-
Figure 4—figure supplement 1—source data 1
Raw unedited blot images (A & C) and annotated blots indicating band and sample identities (B & D) for WT (A & B) and I438V A524T E2 (C & D).
- https://cdn.elifesciences.org/articles/71854/elife-71854-fig4-figsupp1-data1-v2.zip
Figure 4—figure supplement 2

Five independent 1µs MD simulations of WT E2.
The conformational dynamics of WT E2 ectodomain were explored by MD simulations. E2 RMSF (left), images illustrating HVR-1 mobility (middle), and HVR-1 RMSD (right) are provided for each simulation.
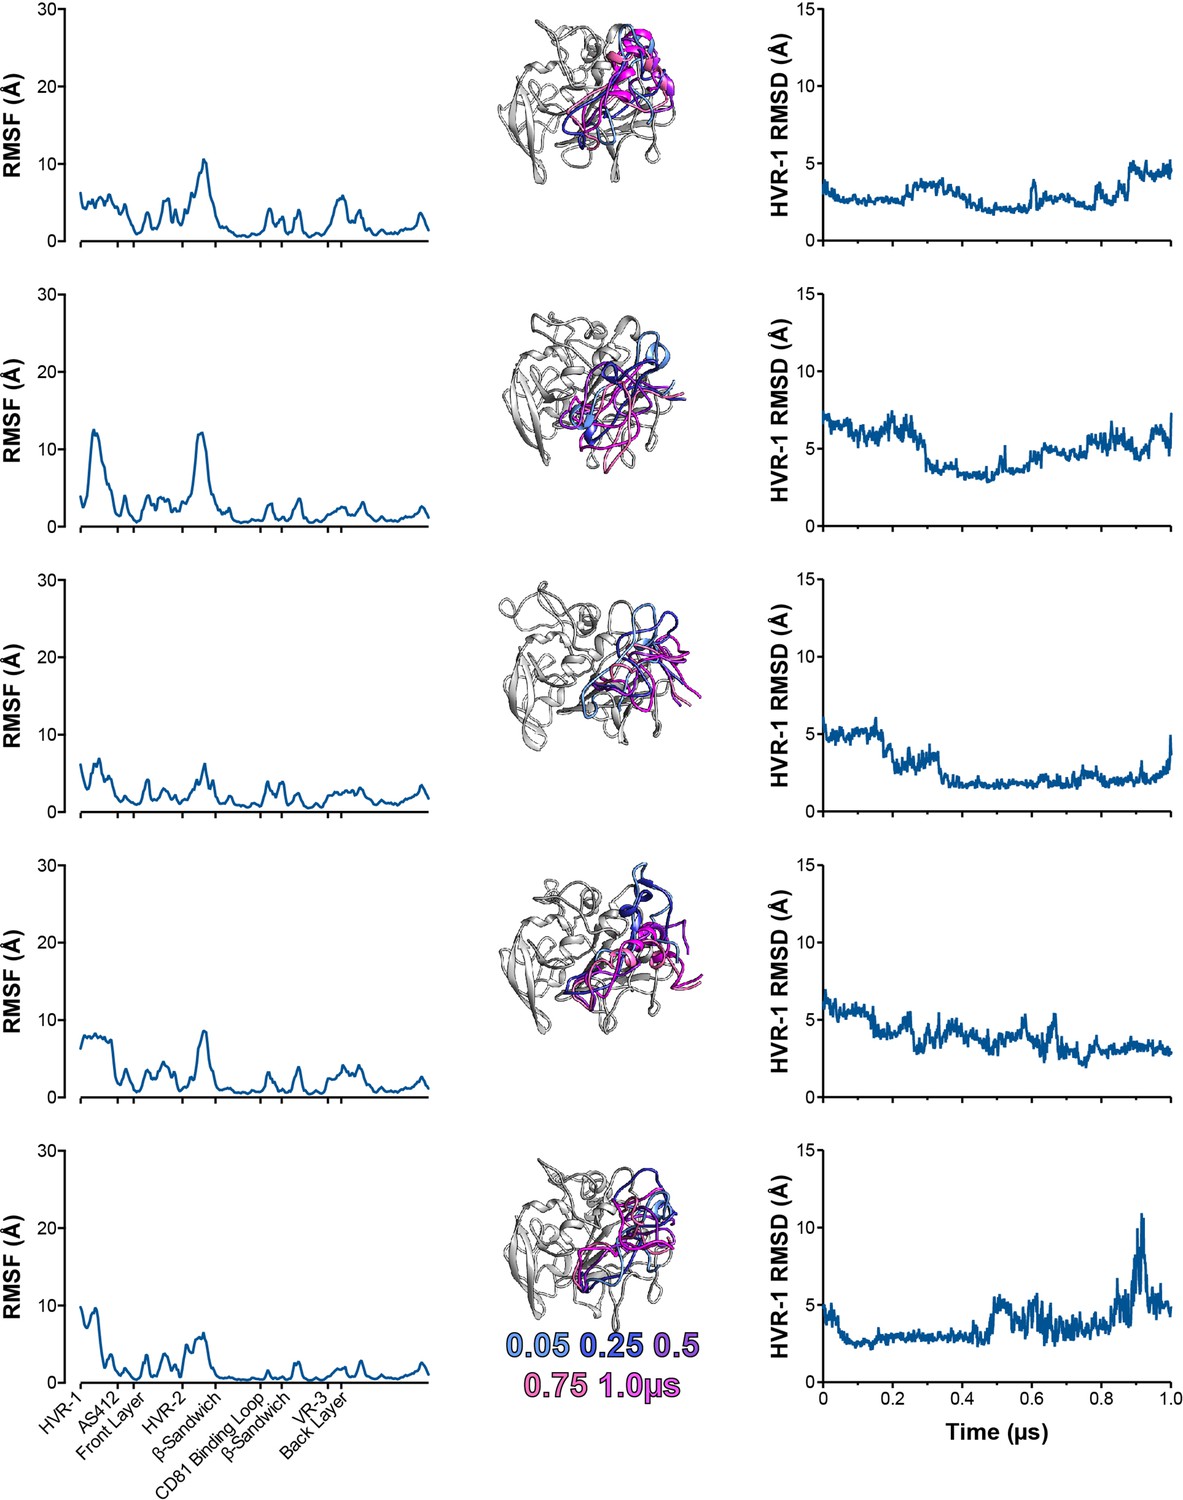
Figure 4—figure supplement 3
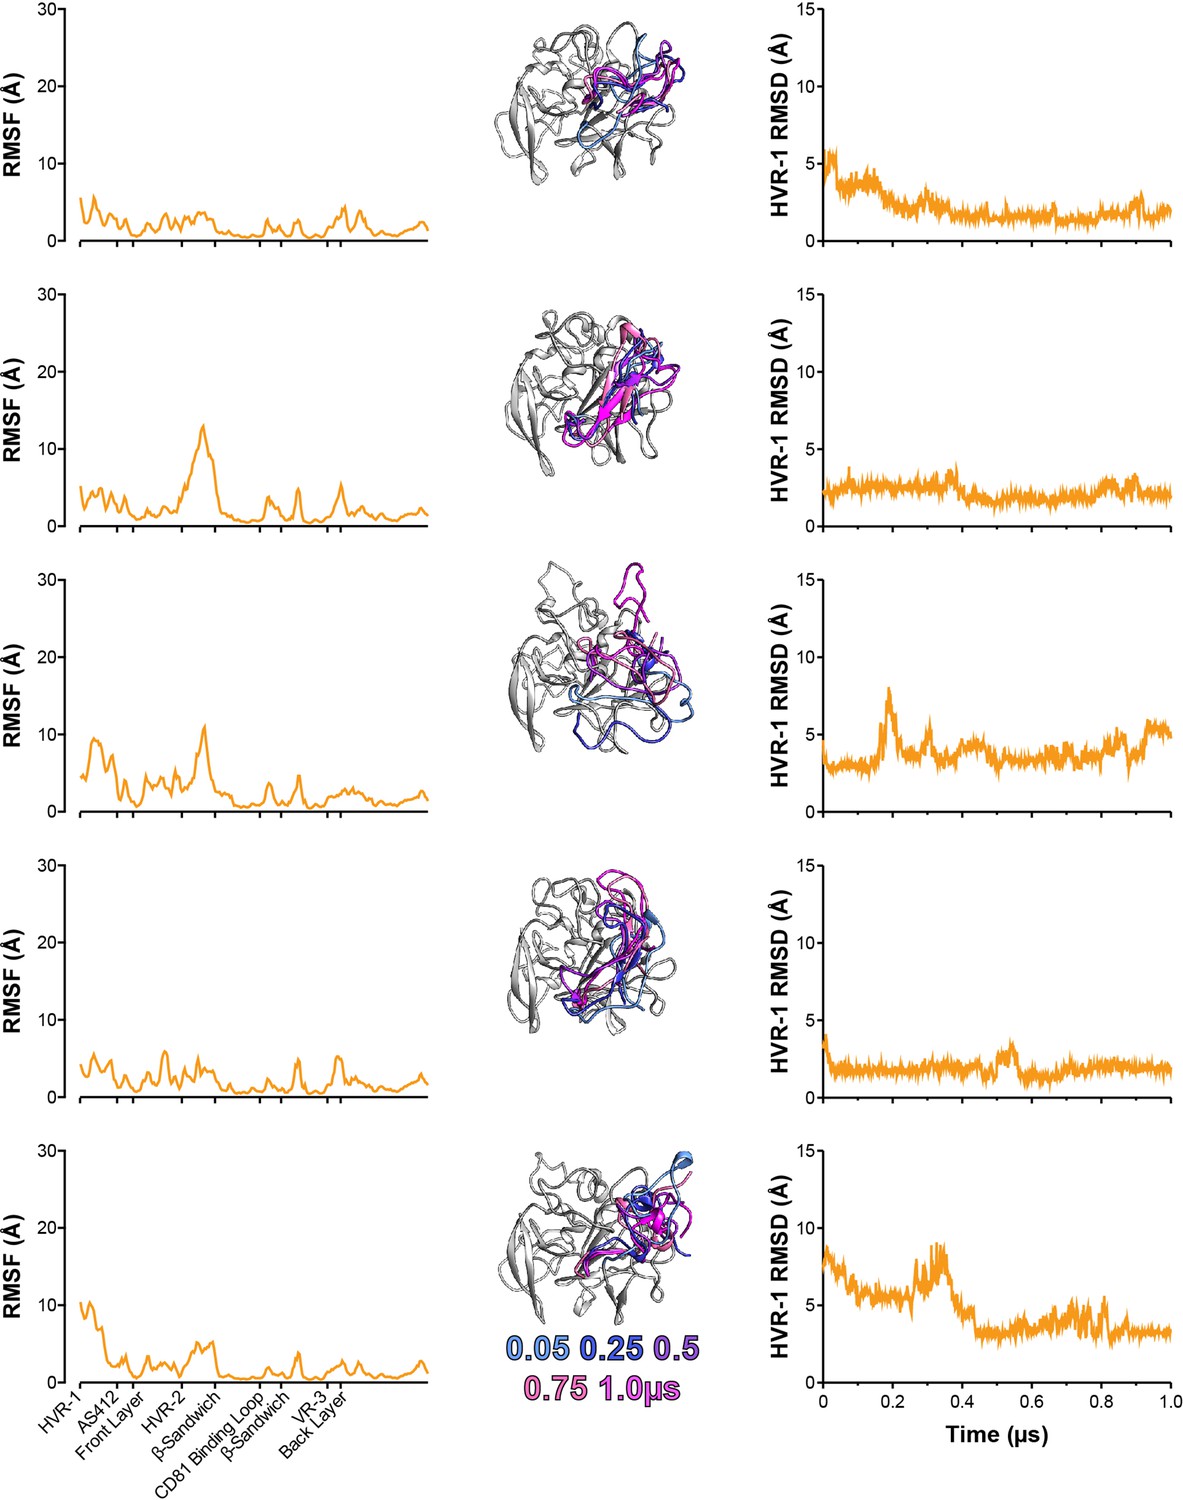
Five independent 1µs MD simulations of I438V A524T E2.
The conformational dynamics of I438V A524T E2 ectodomain were explored by MD. E2 RMSF (left), images illustrating HVR-1 mobility (middle), and HVR-1 RMSD (right) are provided for each simulation.
Figure 4—figure supplement 4
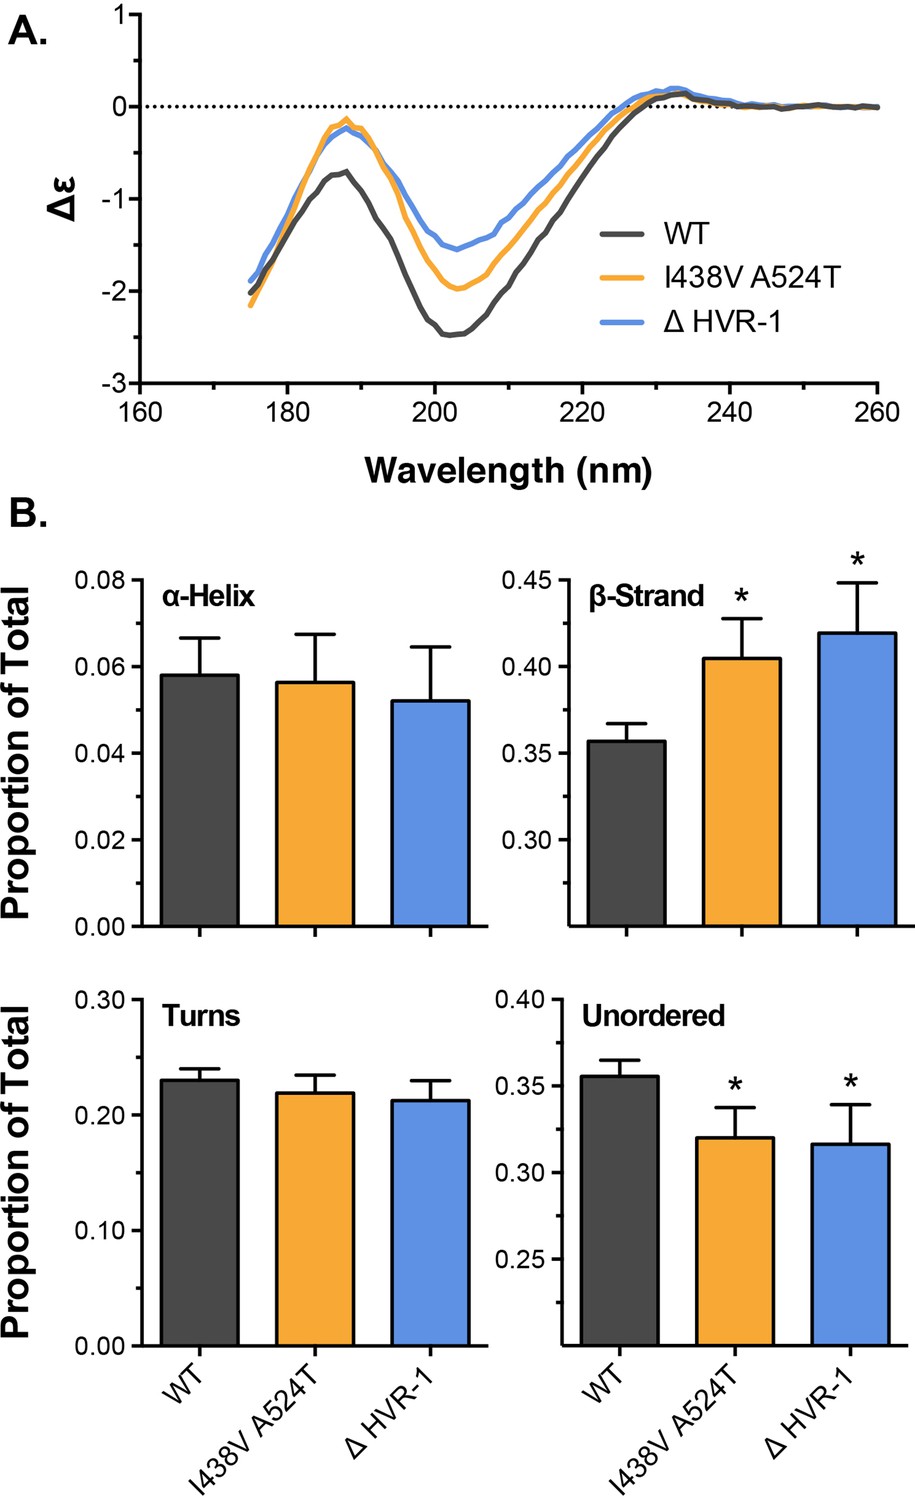
Biophysical analysis of E2 by circular dichroism spectroscopy.
(A) Circular dichroism spectra for WT, I438V A524T, and ΔHVR-1 soluble E2. (B) Estimates of the secondary structure content found in E2, data is expressed as a proportion of total. Asterisks indicate statistical significance (ANOVA, Graphpad, Prism).
Figure 4—figure supplement 5
Biophysical analysis of E2 by nano differential scanning fluorimetry.
(A) Intrinsic fluorescence ratio (330 nm over 350 nm) for WT, I438V A524T, and ΔHVR-1 soluble E2 at increasing temperatures. (B) First derivative transformation of fluorescence ratio; peak indicates melting temperature.
Figure 5
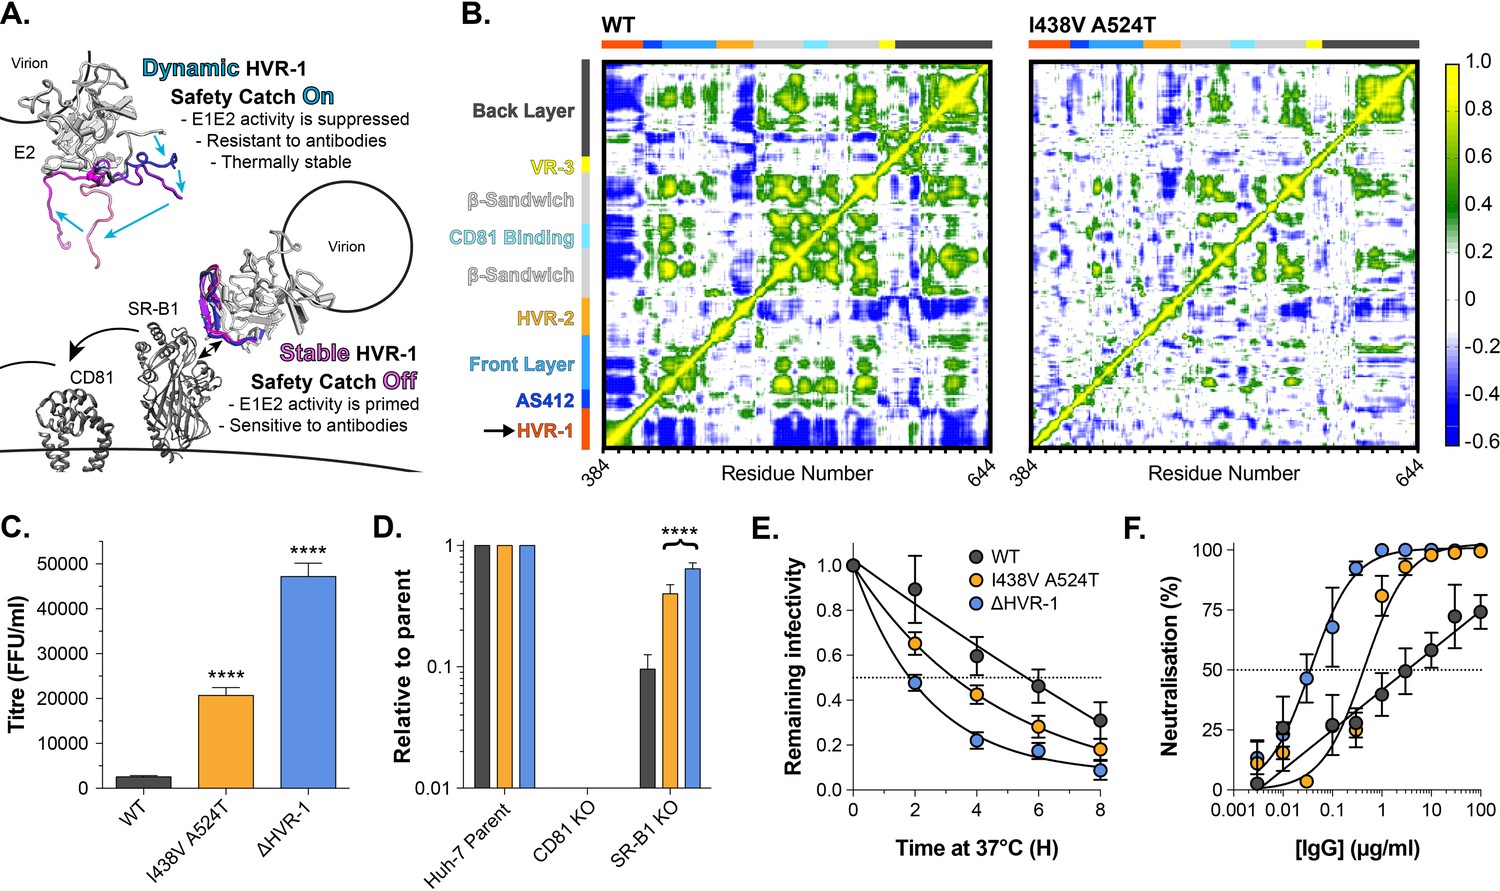
HVR-1 is an entropic safety catch.
(A) The entropic safety catch model. On free virions HVR-1 is dynamic and it acts as an autoinhibitory safety catch on E1E2 function. Interactions with SR-B1 at the cell surface stabilise HVR-1, turning off the safety catch and enabling virus entry. (B) Dynamic cross correlation provides a residue-by-residue pairwise comparison of motion in MD trajectories to reveal correlations/anti-correlations in protein movement. Average DCC matrices for WT and I438V A524T E2 MD simulations are provided. As depicted in the key, yellow/green indicate positive correlations; blue indicates negative correlations; white indicates lack of correlation. (C) Mean infectivities of WT, I438V A524T and ΔHVR-1 HCVcc; foci forming units are corrected for input particle numbers (D) HCVcc infection of parental Huh-7 cells or those CRISPR/Cas9 edited to prevent expression of CD81 or SR-B1. Data is expressed relative to parental cells, mean of three independent experiments. (E) Stability of HCVcc at 37 °C, data points represent the mean of three independent experiments, values normalised to infection at t=0, data was fitted using an exponential decay function. (F) Neutralisation of HCVcc by patient IgG, data points represent the mean of three independent experiments. Data was fitted with a hyperbola function (I438V A524T and ΔHVR-1) or semilog function (WT). In each plot, error bars indicate standard error of the mean; asterisks denote statistical significance (ANOVA, Graphpad prism); all curves determined to be statistically significant (F-test, p<0.0001, Graphpad prism).
Figure 6 with 1 supplement
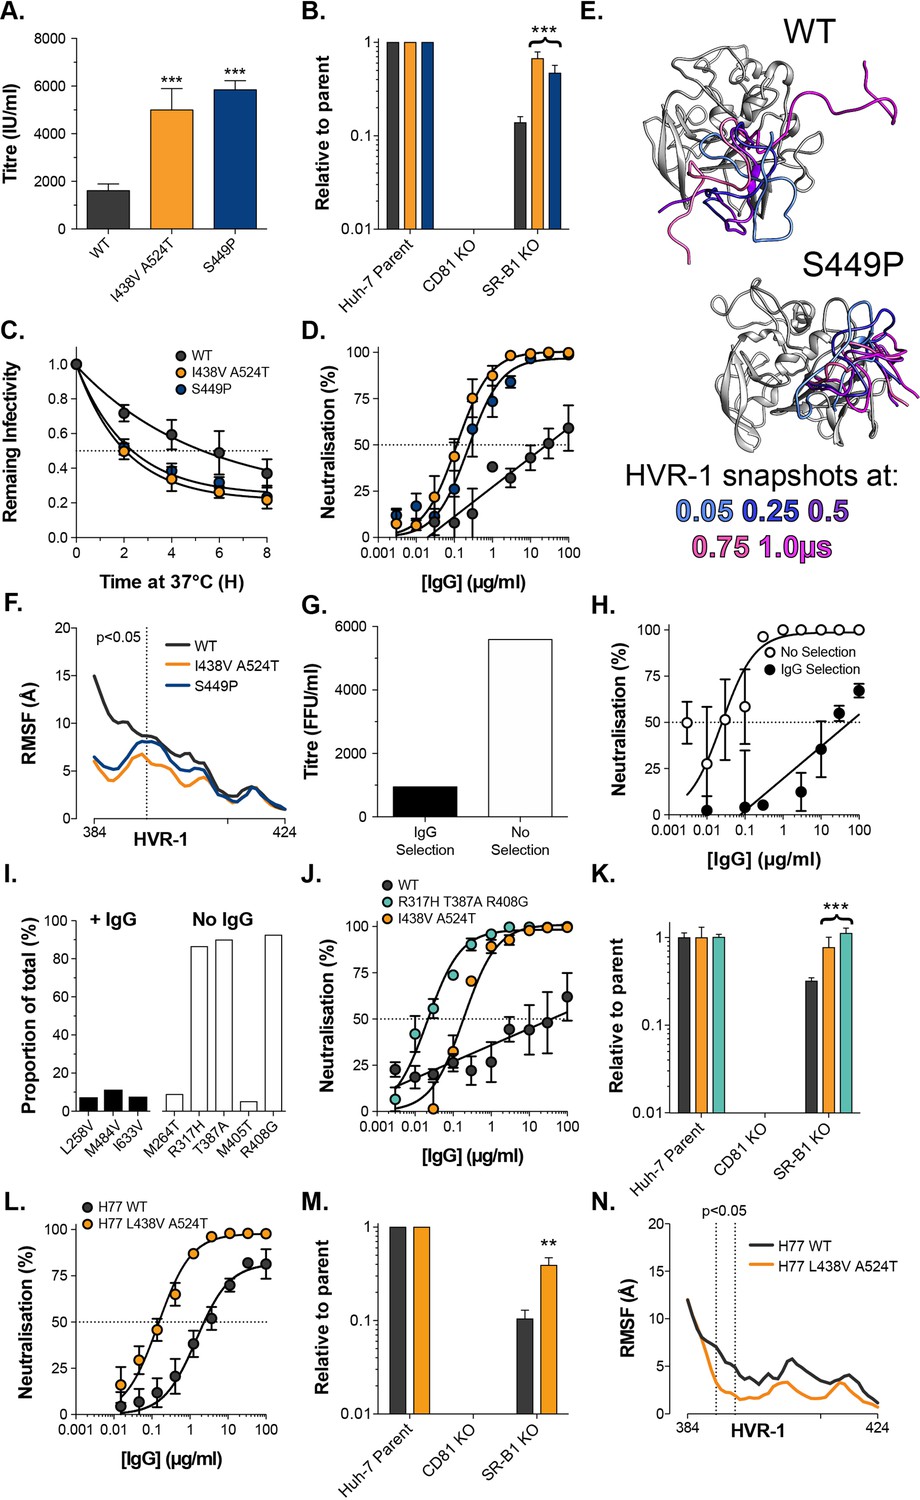
Consistent emergence of hyper-reactive mutants in the absence of antibody selection.
(A) Mean infectivities of WT, I438V A524T and S449P HCVcc; foci forming units are corrected for input particle numbers (B) HCVcc infection of parental Huh-7 cells or those CRISPR/Cas9 edited to prevent expression of CD81 or SR-B1. Data is expressed relative to parental cells, mean of three independent experiments, colour coding as in panel 6A. (C) Stability of HCVcc at 37 °C, data points represent the mean of three independent experiments, values normalised to infection at t=0, data was fitted using an exponential decay function. (D) Neutralisation of HCVcc by patient IgG, data points represent the mean of three independent experiments. Data was fitted with a hyperbola function (I438V A524T and S449P) or semilog function (WT), colour coding as in panel 6D. (E) Images summarising representative MD simulations of WT and S449P E2 ectodomain; superimposed snapshots of HVR-1 are colour coded by time, as denoted in the key, the remainder of E2 is shown in grey for the earliest time point only. (F) Average RMSF of WT, I438V A524T and S449P HVR-1; values to the left of the dashed line reach statistical significance for both mutants compared to WT (ANOVA, GraphPad Prism). (G) & (H) J6/JFH HCVcc was propagated in Huh-7.5 cells with and without antibody selection by HCV + patient IgG (see Methods). (G) Infectious titre of HCVcc after propagation with and without antibody selection. (H) HCV + patient IgG neutralisation of HCVcc cultured with and without antibody selection, data points represent the mean of three technical repeat, data was fitted with a hyperbola function (No selection) or semilog function (IgG selection). (I) NGS analysis of viral cultures; plots display identity and frequency of variants (>5%) in IgG selected (black bars) and unselected cultures (white bars). (J) Neutralisation sensitivity of HCVpp bearing WT, I438V A524T, or R317H T387A R408G E1E2, assessed as in panel 6D. (K) Receptor dependency of HCVpp, assessed as in panel 6B, colour coding as in panel 6J. (L) Neutralisation sensitivity of HCVpp bearing H77 clone WT or L438V A524T E1E2, assessed as in panel 6D (M) Receptor dependency of HCVpp, assessed as in panel 6B, colour coding as in panel 6L. (N) Average RMSF of H77 WT or L438V A524T E2 HVR-1 from five independent MD simulation; values within dashed lines reach statistical significance (ANOVA, GraphPad Prism). In each plot, error bars indicate standard error of the mean; asterisks denote statistical significance (ANOVA, Graphpad prism); all curves determined to be statistically significant (F-test, p<0.0001, Graphpad prism).
Figure 6—figure supplement 1
Five independent 1µs MD simulations of S449P E2.
The conformational dynamics of S449P E2 ectodomain were explored by MD. E2 RMSF (left), images illustrating HVR-1 mobility (middle), and HVR-1 RMSD (right) are provided for each simulation.
Author response image 1

HCV E1E2 fusion assay.
Two populations of Huh-7 cells expressing matched components of the split-GFP/luciferase system were co-seeded and transfected with the stated E1E2 expression plasmid (or pD603 empty plasmid). 48 hours later, cell fusion was triggered by 10 minute incubation in PBS adjusted to pH 5. Fusion was assessed after 24 hours by the measurement of reconstituted luciferase signal. CO = codon optimised plasmids.
Additional files
-
Transparent reporting form
- https://cdn.elifesciences.org/articles/71854/elife-71854-transrepform1-v2.pdf
-
Source data 1
All underlying data from each experimental measurement is included.
Large data sets from molecular dynamic experiments are excluded, however, full MD trajectories are available for download.
- https://cdn.elifesciences.org/articles/71854/elife-71854-data1-v2.xlsx
Download links
A two-part list of links to download the article, or parts of the article, in various formats.
Downloads (link to download the article as PDF)
Open citations (links to open the citations from this article in various online reference manager services)
Cite this article (links to download the citations from this article in formats compatible with various reference manager tools)
An entropic safety catch controls hepatitis C virus entry and antibody resistance
eLife 11:e71854.
https://doi.org/10.7554/eLife.71854


