Pan-genome analysis identifies intersecting roles for Pseudomonas specialized metabolites in potato pathogen inhibition
- Department of Molecular Microbiology, John Innes Centre, United Kingdom
- Department of Biochemistry and Metabolism, John Innes Centre, United Kingdom
- Department of Cell and Developmental Biology, John Innes Centre, United Kingdom
- Department of Computational and Systems Biology, John Innes Centre, United Kingdom
- VCS Potatoes, 2 Burnt Cottages, United Kingdom
- School of Biological Sciences, University of East Anglia, United Kingdom
Figures
Figure 1 with 1 supplement
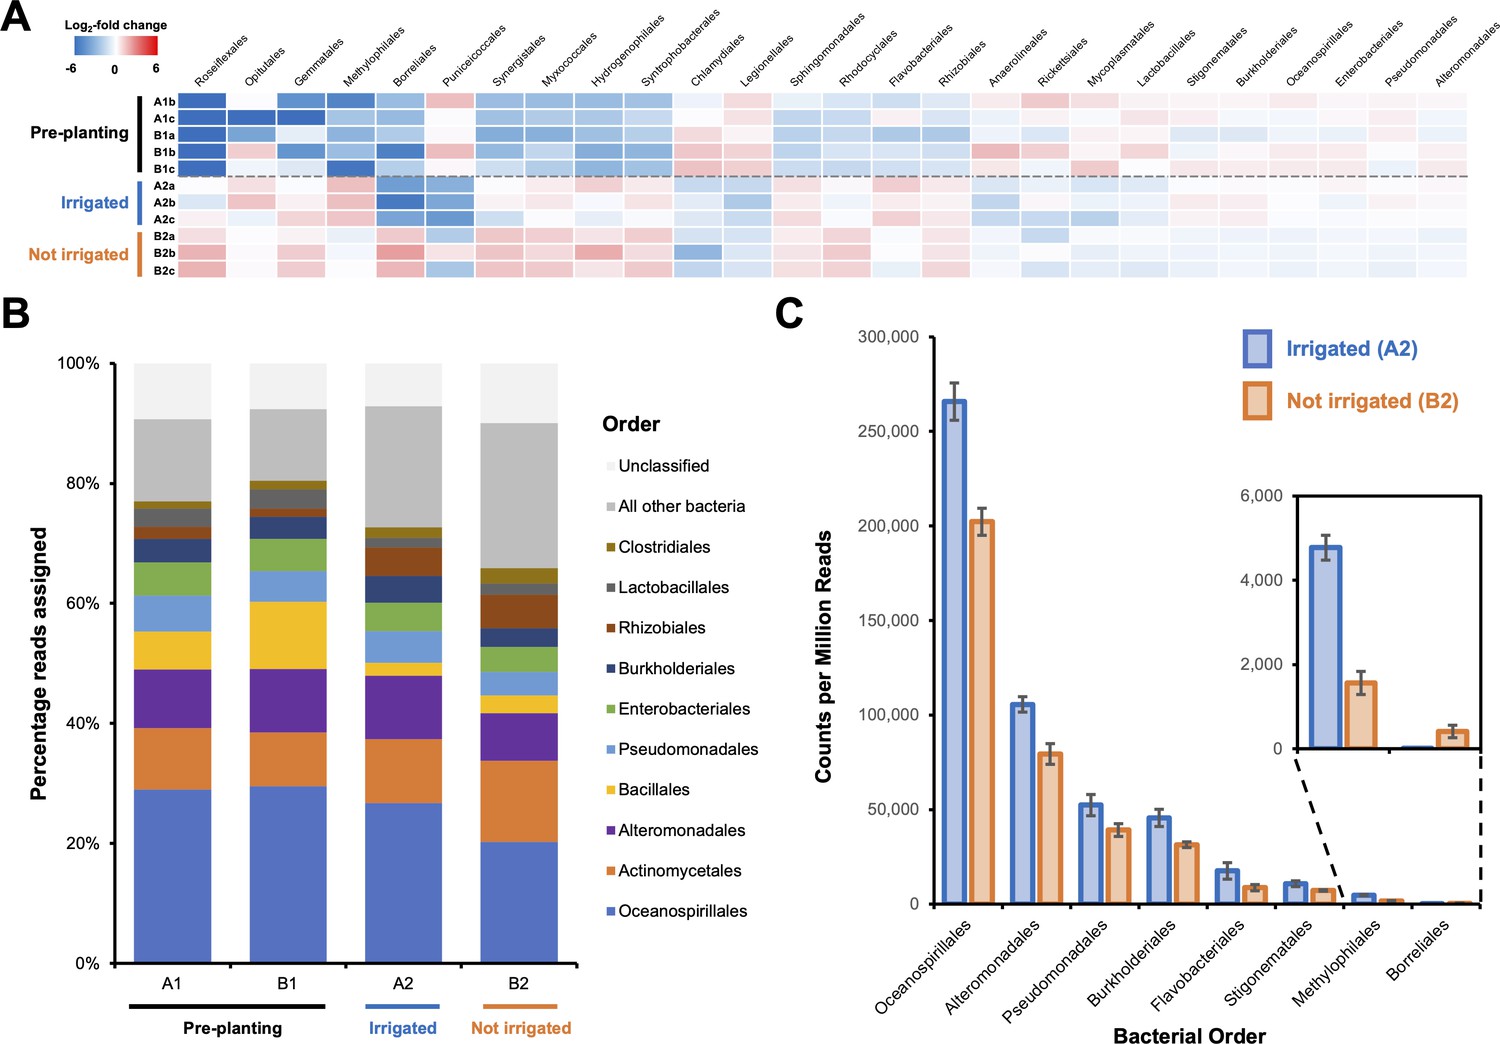
Effect of irrigation on the microbial population of a potato field.
(A) The 26 bacterial orders whose populations were determined to significantly differ across one or more sampling sites using voom with a false discovery rate of 0.05. Data are shown as a heatmap of the log2-fold change with respect to the overall average counts per million for a given order. Sample A1a was omitted from the analysis due to possible contamination leading to an atypical bacterial population (Figure 1—figure supplement 1). (B) Overall average population of each sample site showing the 10 most abundant bacterial orders across all sites. (C) The eight bacterial orders whose populations were determined to significantly differ between irrigated and nonirrigated sites, represented as counts per million reads. Error bars represent the standard deviation of triplicate data.
-
Figure 1—source data 1
Read counts for data reported in Figure 1.
- https://cdn.elifesciences.org/articles/71900/elife-71900-fig1-data1-v2.csv
Figure 1—figure supplement 1
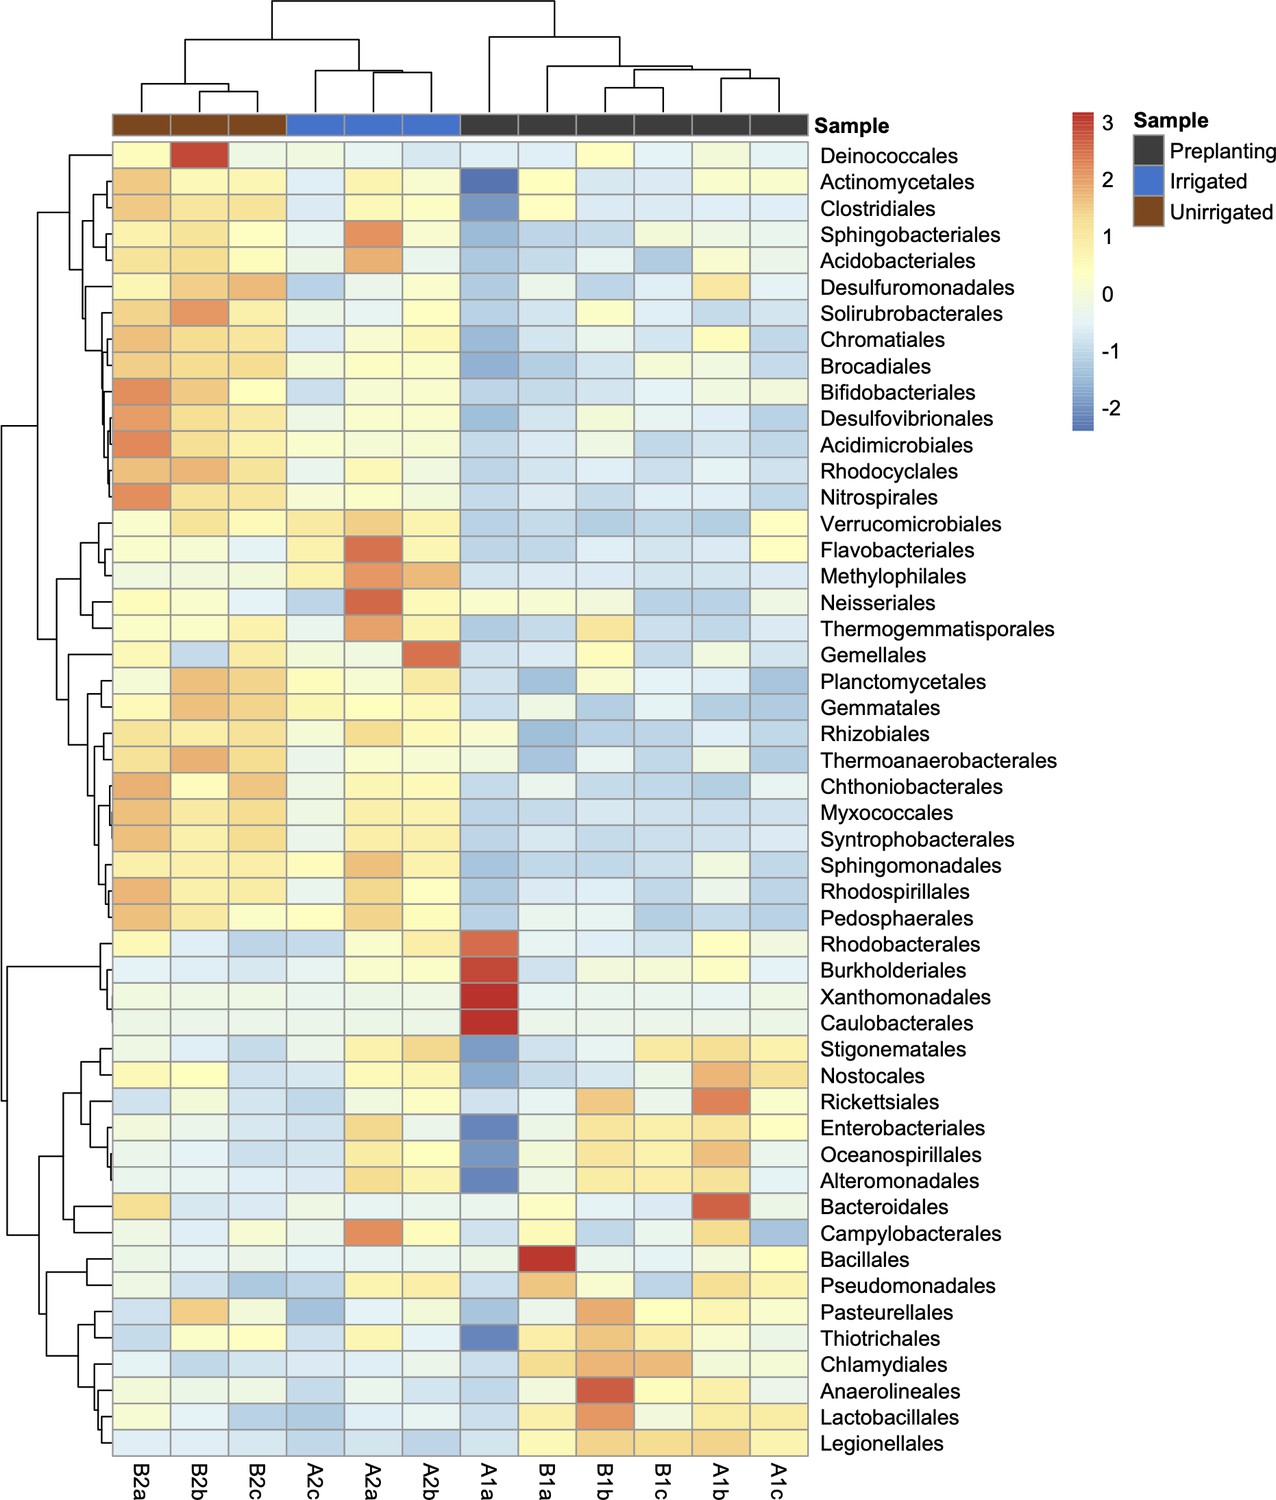
Heatmap of the 50 most abundant bacterial orders across all samples (unclassified reads were removed from this analysis).
The heatmap is scaled by z-score for each row, and samples (columns) and bacterial orders (rows) are clustered by Pearson correlation. The heatmap was generated using Pheatmap (https://CRAN.R-project.org/package=pheatmap) in R 3.5.1.
Figure 2 with 3 supplements
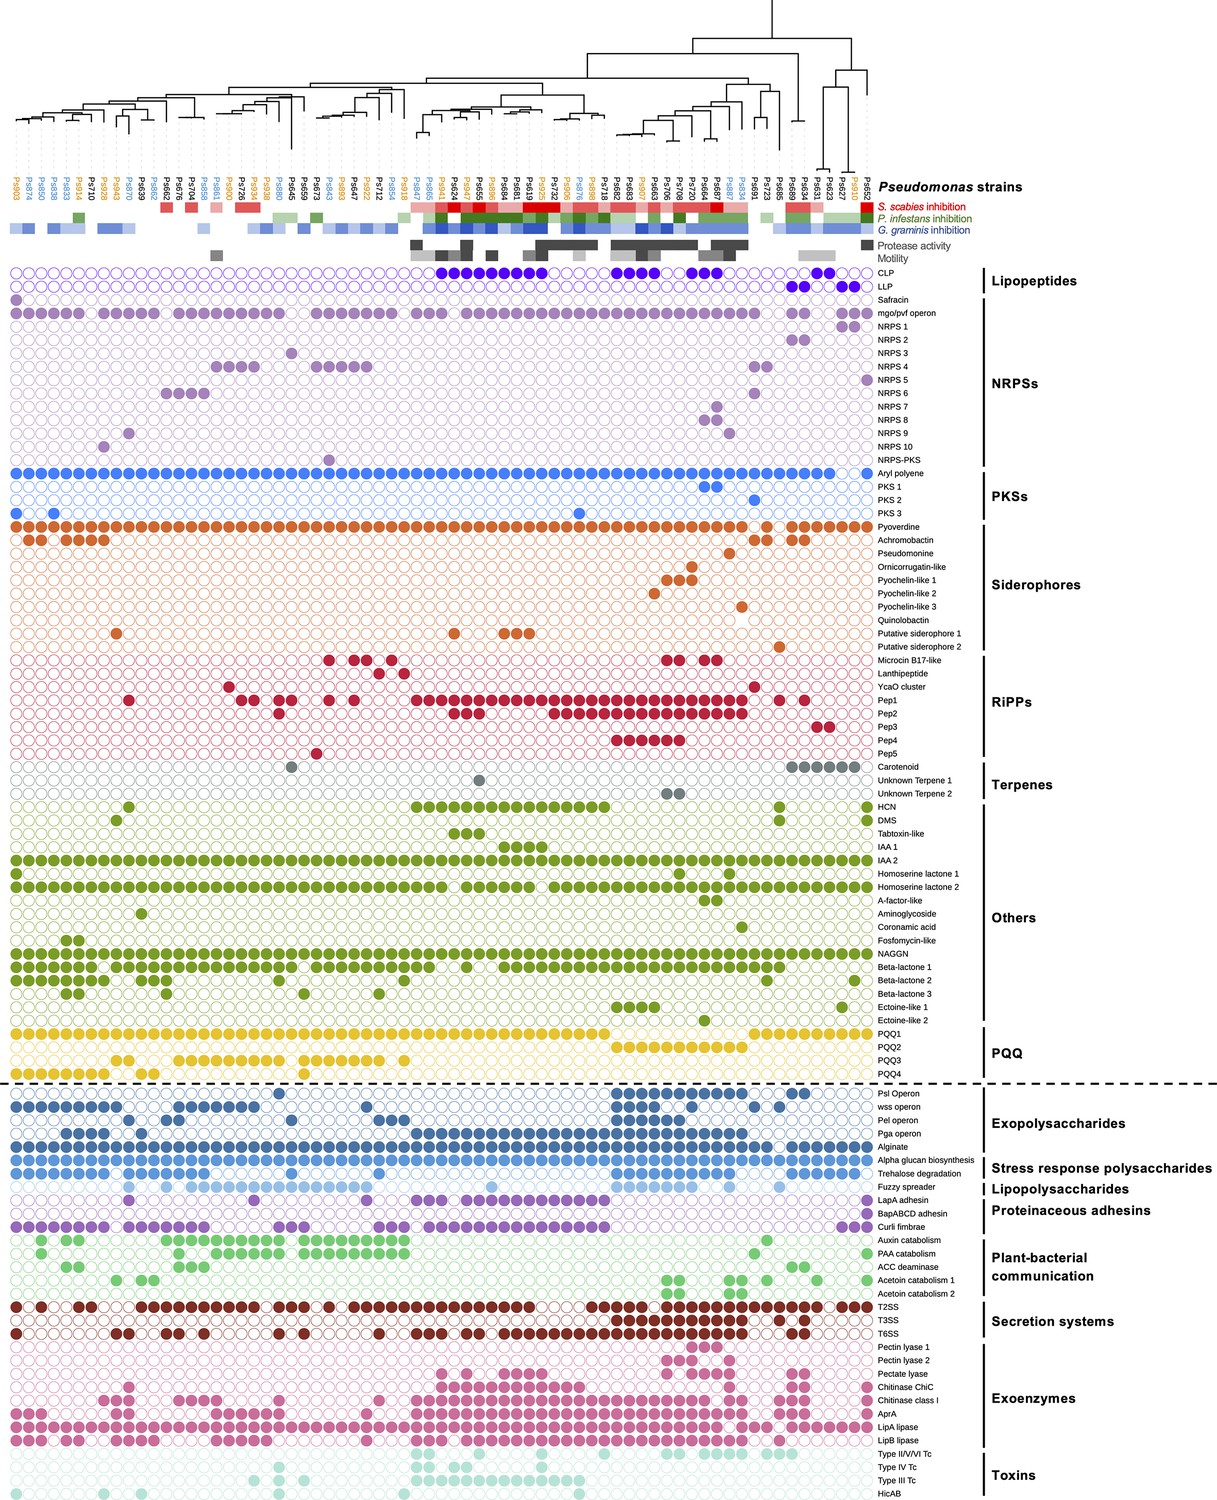
Comparison of phylogeny, S. scabies suppression (red color scales).
P. infestans suppression (green color scale), G. graminis pv. tritici (take-all) suppression (blue color scale), phenotypes (gray color scales), natural product biosynthetic gene clusters (filled circles = presence of a gene or gene cluster), and the accessory genome (separated from biosynthetic gene clusters [BGCs] by a dotted line). In the phylogenetic tree of Pseudomonas strains, blue strains were collected from irrigated plots while orange strains were collected from unirrigated plots. All other strains were collected from the pre-irrigation plots. Figure 2—figure supplement 3 shows the relationship between these strains and the Pseudomonas phylogenomic groups defined by Garrido-Sanz et al., 2016.
Figure 2—figure supplement 1
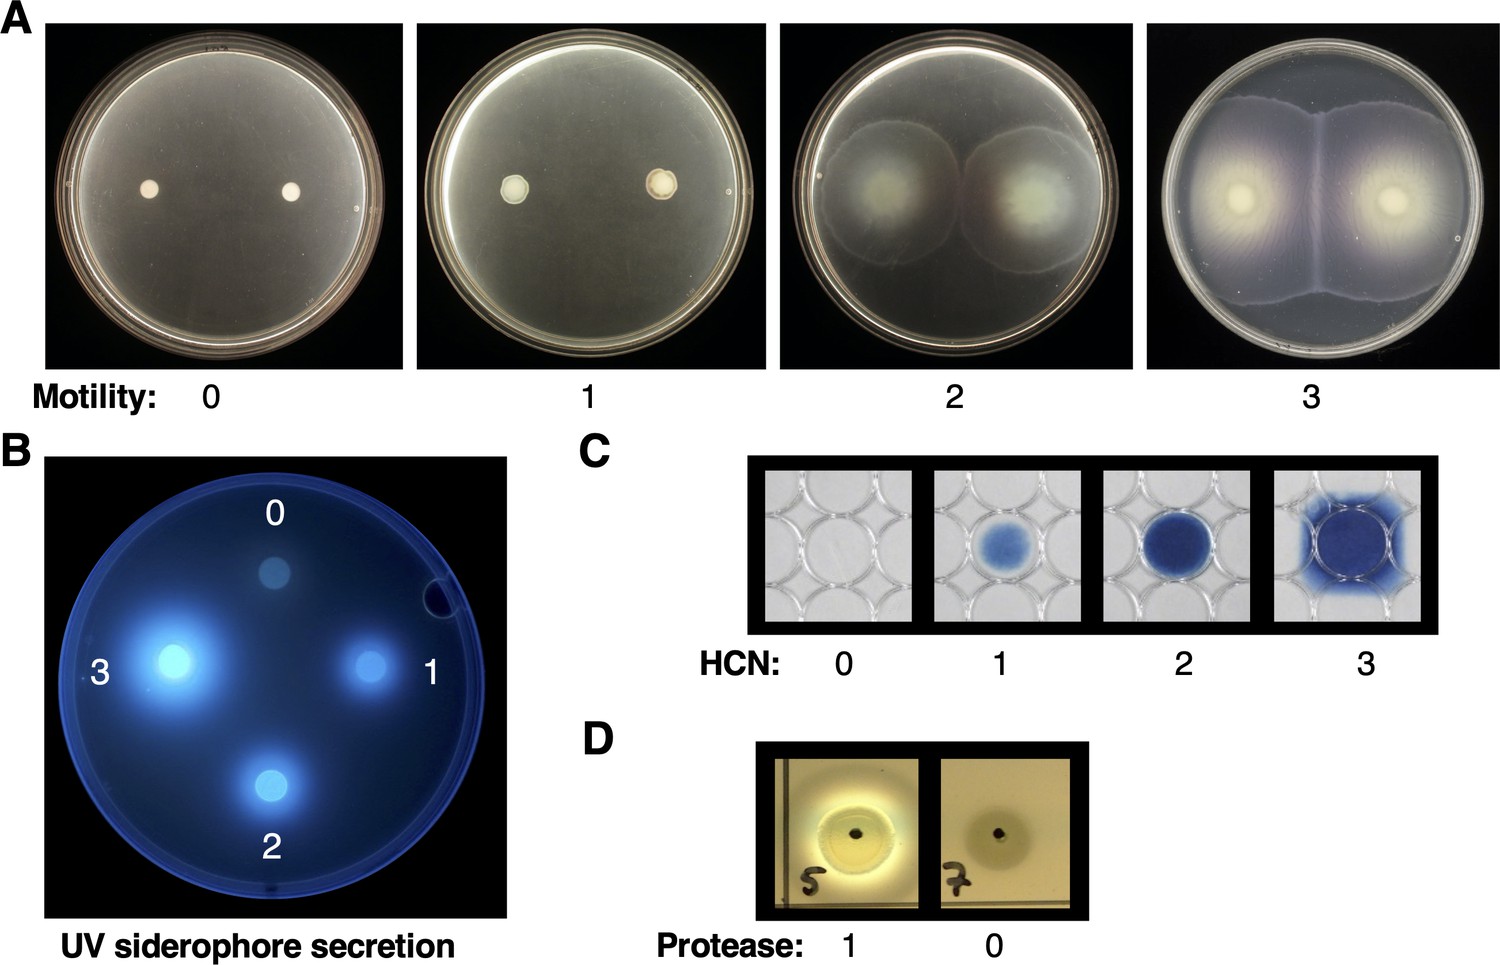
Representative images of Pseudomonas phenotypes.
(A) Motility; (B) UV siderophore secretion; (C) hydrogen cyanide (HCN) production; (D) protease production.
Figure 2—figure supplement 2
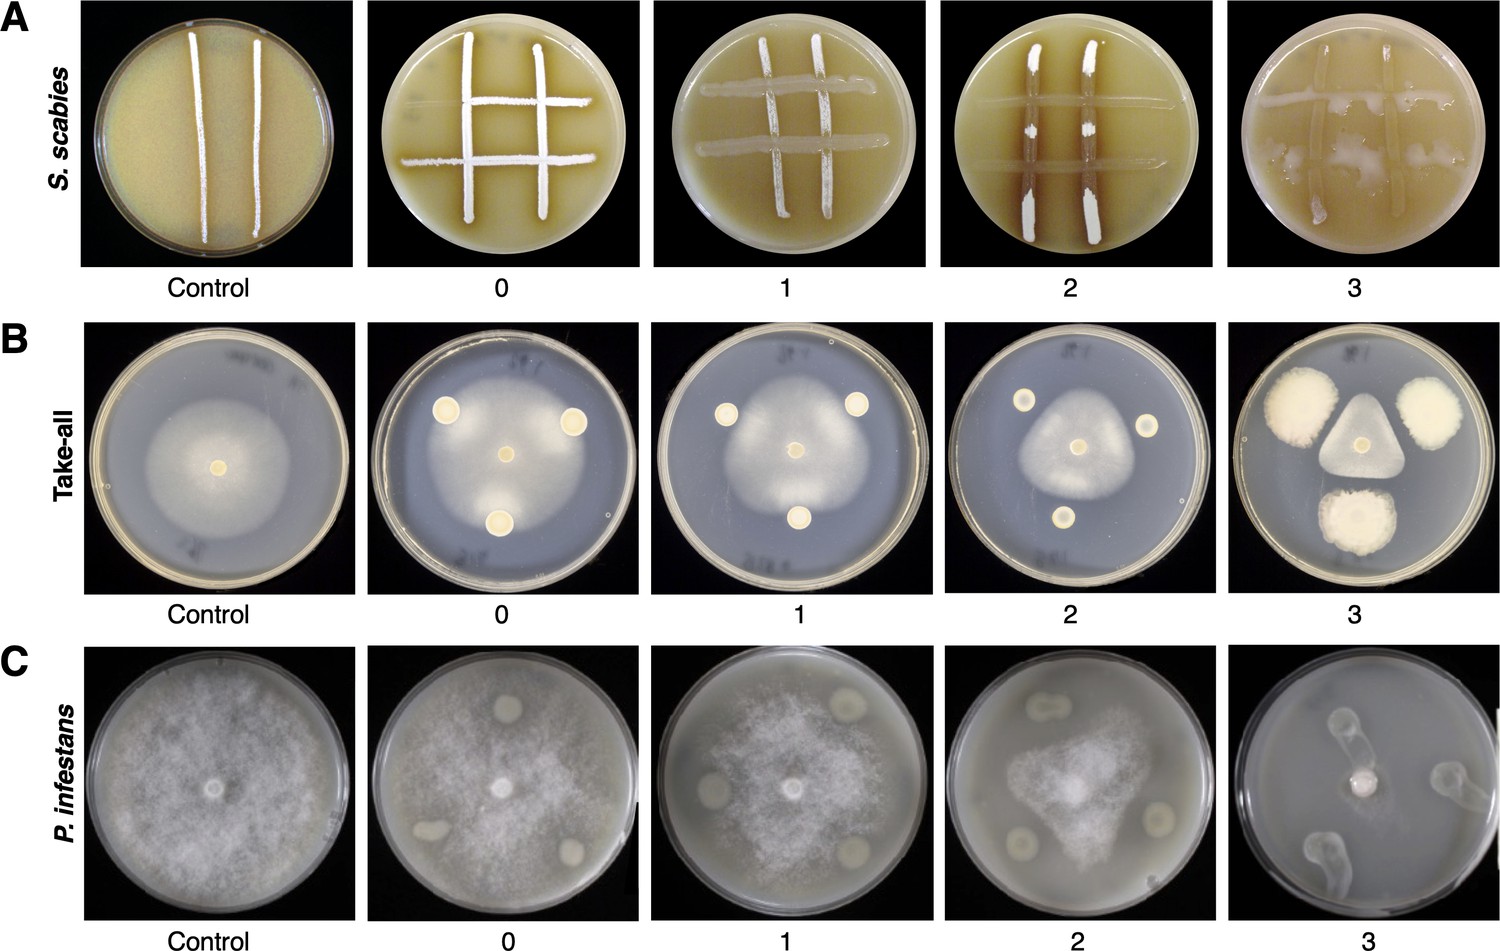
Representative images of on-plate suppressive activity of Pseudomonas isolates.
(A) Versus S. scabies; (B) versus Gaeumannomyces graminis pv. tritici (take-all); (C) versus P. infestans.
Figure 2—figure supplement 3
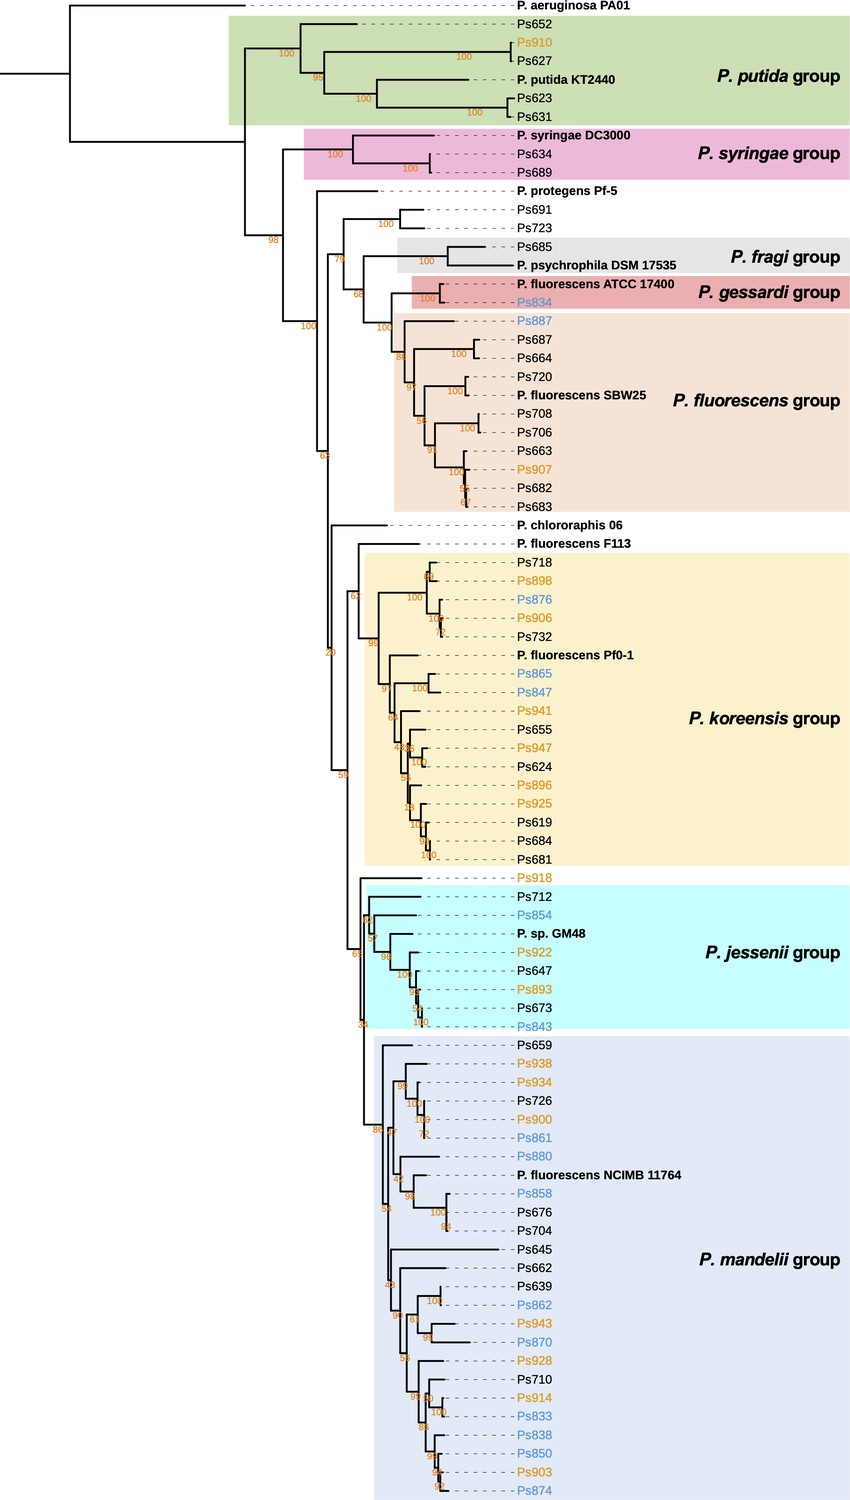
Maximum likelihood tree of full-length gyrB nucleotide sequences of Pseudomonas strains with representatives of the eight Pseudomonas phylogenomic groups defined by Garrido-Sanz et al., 2016.
Black names represent pre-planting isolates, blue names represent isolates from irrigated soil, and orange names indicate isolates from unirrigated soil. Bootstrap values are shown for each branch in orange text. Sequences were aligned with MUSCLE (Edgar, 2004) and the tree was inferred using RAxML (Stamatakis, 2014). The tree was visualized using iTOL (Letunic and Bork, 2016). An interactive version of the tree annotated with features shown in Figure 2 is available at: https://itol.embl.de/tree/902431818658671633339579.
Figure 3 with 1 supplement
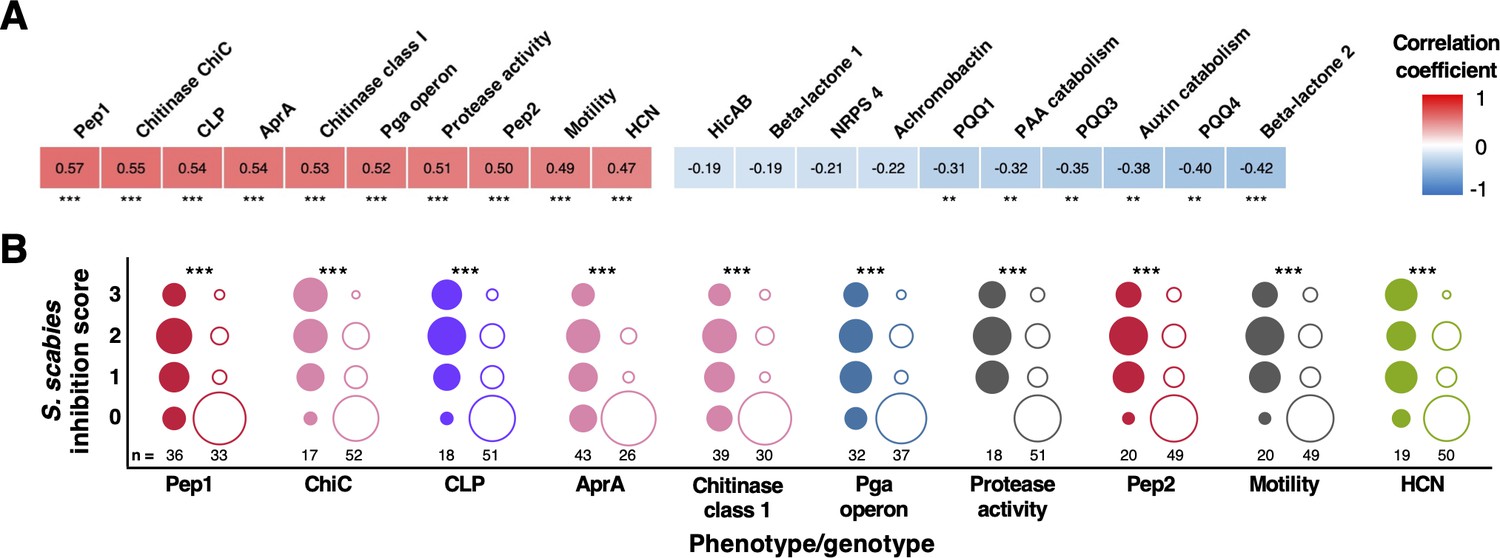
Correlation of biosynthetic gene clusters (BGCs) and accessory genome loci with S. scabies inhibition.
(A) Heatmap showing the 10 genotypes and phenotypes that correlated most strongly (positively and negatively) with on-plate suppression of S. scabies. Stars represent the statistical significance of a correlation using a two-tailed Mann–Whitney test (*p<0.05, **p<0.01, ***p<0.001). (B) Distributions of S. scabies suppressive activity for top 10 positive correlations. Circles are stacked from no (0) to high (3) inhibition, where filled and empty circles represent strains with and without a given genotype/phenotype, respectively. The number of strains (total = 69) in each class is listed, and the area of a circle specifies the proportion of strains with given suppressive activity.
Figure 3—figure supplement 1
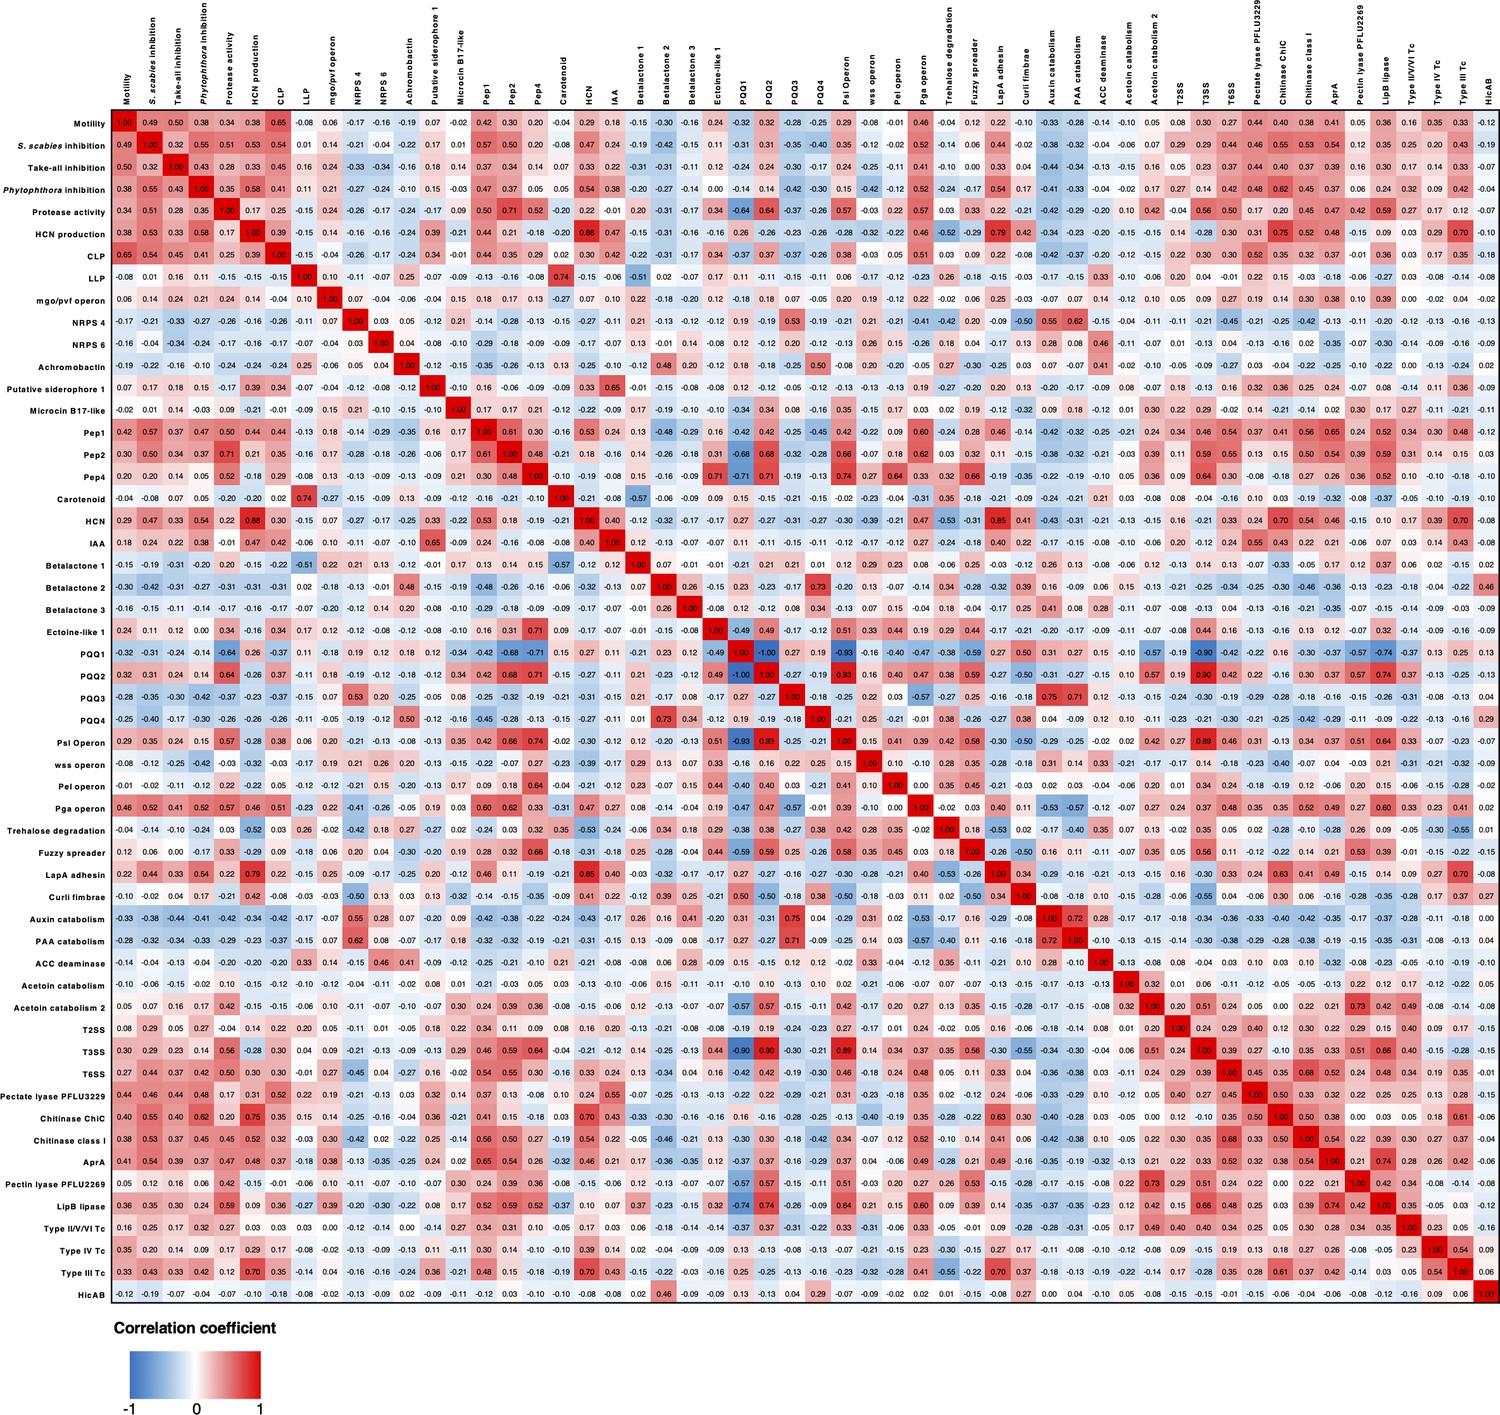
Heatmap showing Pearson correlation coefficients of phenotypes and genotypes across the sequenced Pseudomonas isolates.
For clarity, any phenotype or genotype that had fewer than 5 or greater than 65 representatives (total number of strains = 69) was removed from this analysis.
Figure 4 with 7 supplements
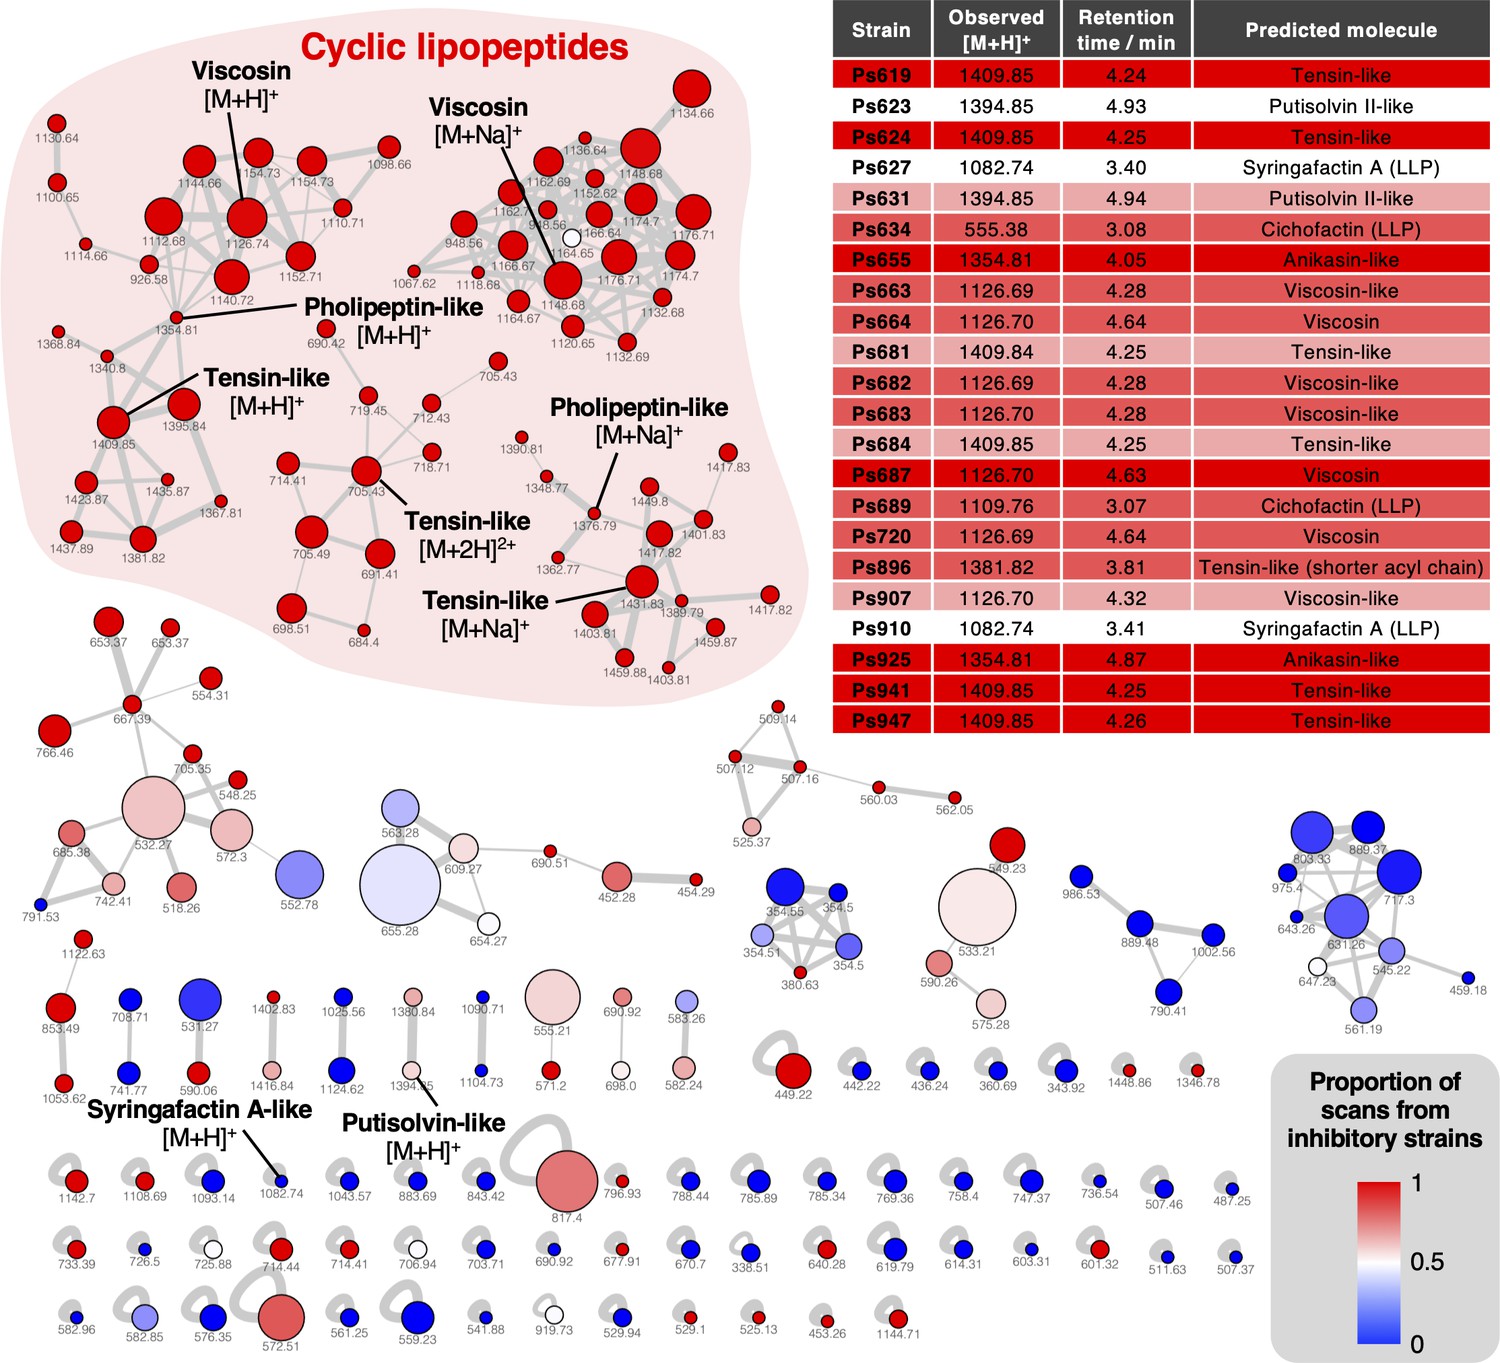
Mass spectral networking analysis of liquid chromatography–tandem mass spectrometry (LC-MS/MS) data from the Pseudomonas strains used in this study.
Node area is proportional to the number of distinct strains where MS/MS data were acquired for a given metabolite. Node color reflects the proportion of MS/MS scans for a given node that come from strains with a S. scabies inhibition score ≥1. Nodes are labeled with the corresponding parent masses and nodes that relate to lipopeptides are labeled (multiple networks arise from differential fragmentation of [M + H]+, [M + 2H]2+, and [M + Na]+ ions). Line thickness is proportional to the cosine similarity score calculated by Global Natural Product Social Molecular Networking (GNPS) (Aron et al., 2020). The table shows production of lipopeptides by strains containing lipopeptide biosynthetic gene clusters (BGCs). Color coding reflects level of S. scabies inhibition by each strain with same scale as Figure 2 (LLP: linear lipopeptide; all others are cyclic lipopeptides [CLPs]).
Figure 4—figure supplement 1
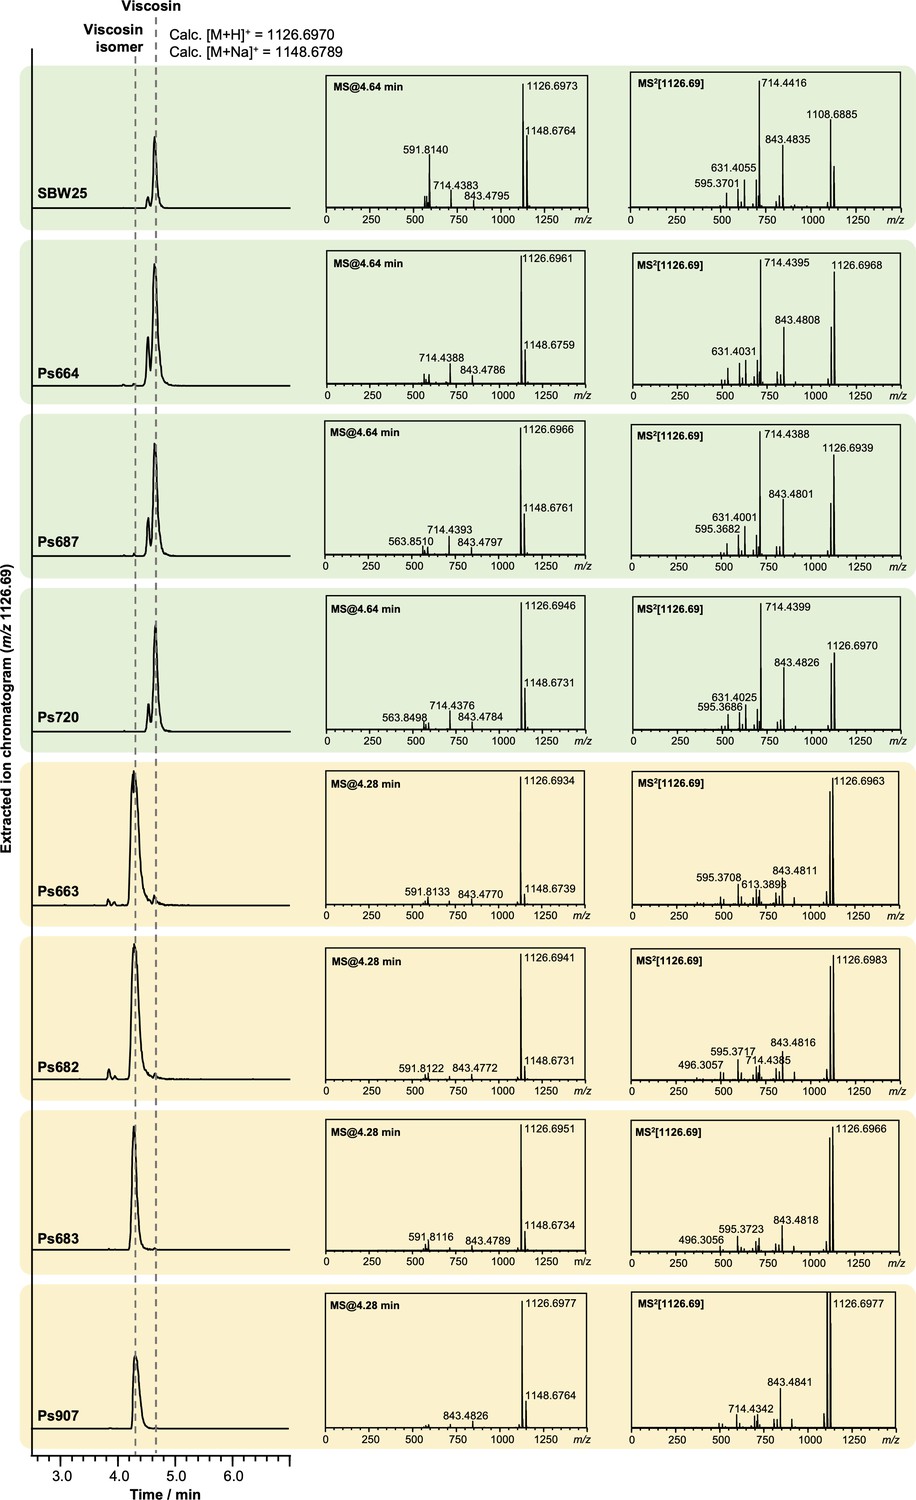
Liquid chromatography–tandem mass spectrometry (LC-MS/MS) spectra showing that some strains produce viscosin (identical retention time and MS/MS fragmentation to viscosin produced by P. fluorescens SBW25; green boxes) and some produce an isomer with a distinct retention time and MS/MS fragmentation pattern (yellow boxes).
Figure 4—figure supplement 2
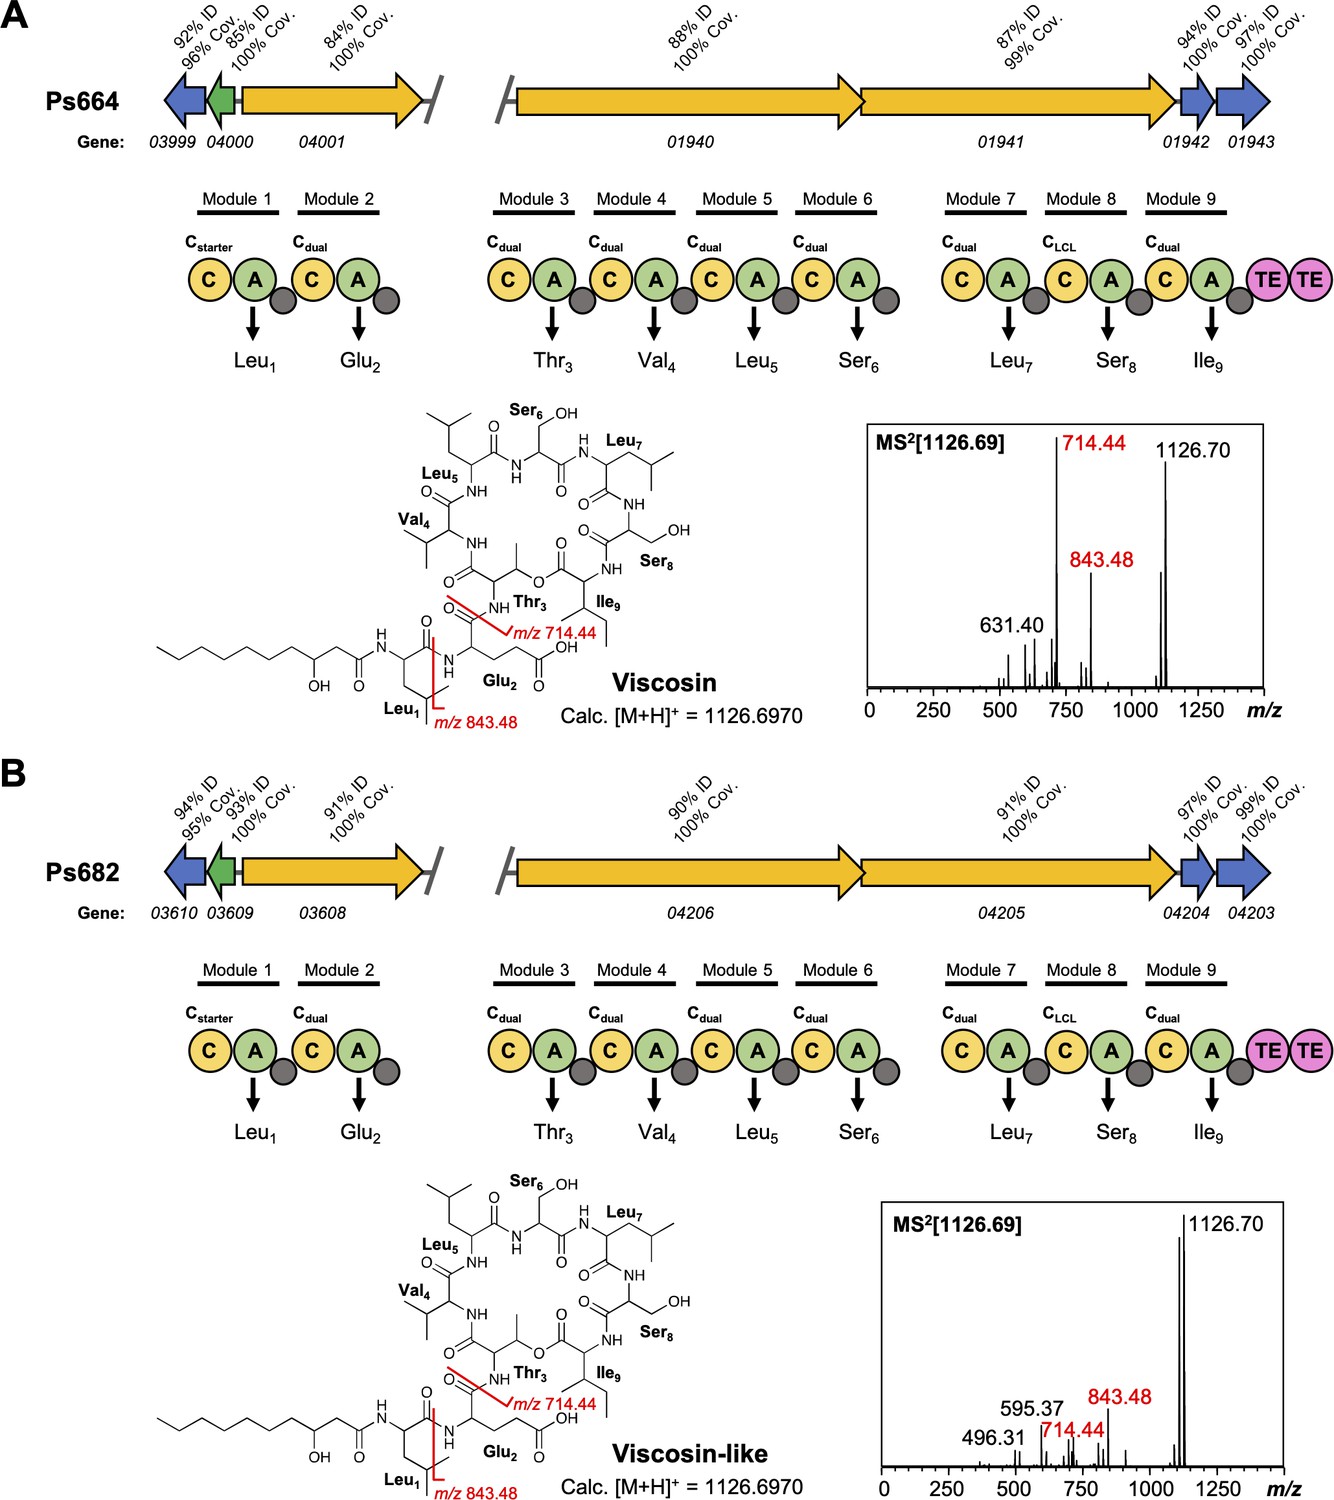
Comparison of viscosin (A) and viscosin-like (B) biosynthetic gene clusters (BGCs).
Genes encoding regulatory proteins are green, transporter genes are blue, and nonribosomal peptide synthetases (NRPS) genes are yellow. The break in the BGC indicates that the BGC is found in two distinct genomic loci. Homology to the Pseudomonas fluorescens SBW25 viscosin BGC is shown in both panels (A) and (B). The NRPS organization is displayed, where C = condensation domain, A = adenylation domain, TE = thioesterase, and small gray circles are peptidyl carrier protein domains. Amino acids incorporated by each module are displayed, along with predicted condensation domain specificity. MS/MS data showing characteristic viscosin fragmentation are also shown.
Figure 4—figure supplement 3
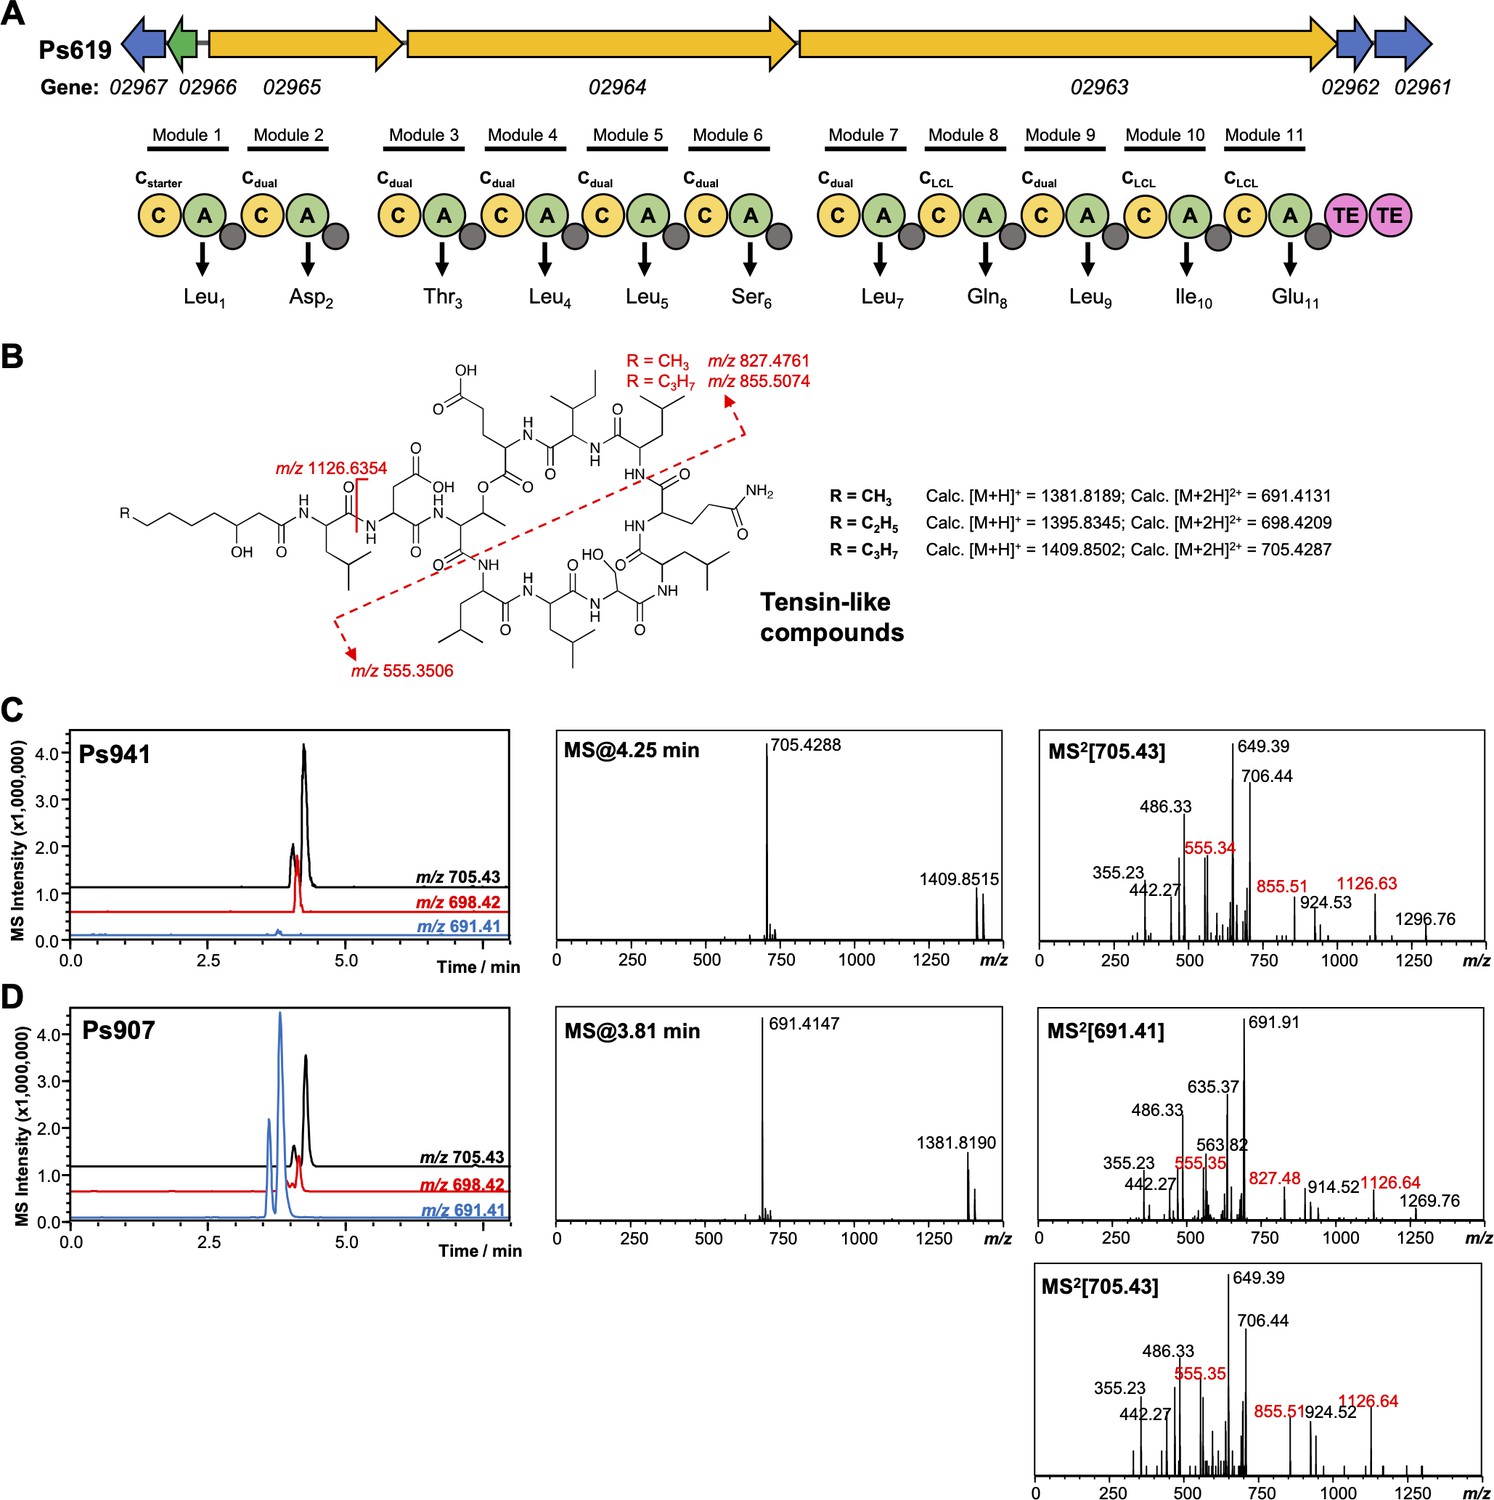
Genetic and liquid chromatography–tandem mass spectrometry (LC-MS/MS) analysis of tensin-like compounds.
(A) Organization of the cyclic lipopeptide (CLP) nonribosomal peptide synthetase (NRPS) biosynthetic gene cluster (BGC) from Ps619. Gene and NRPS domain colors are the equivalent to Figure 4—figure supplement 2. Amino acids predicted to be incorporated by each module are displayed, along with predicted condensation domain specificity. (B) Predicted structure, masses, and key MS/MS fragments for tensin-like compounds. (C) Representative LC-MS spectra for another producer of a tensin-like molecule, where the major product [M + 2H]2+ = 705.43. Extracted ion chromatograms are shown for m/z values relating to different acyl chain lengths. Characteristic MS/MS fragments are highlighted in red. (D) LC-MS spectra of tensin-like compounds produced by Ps907, where the major product [M + 2H]2+ = 691.41. The presence of characteristic MS/MS fragments, as well as a smaller amount of [M + 2H]2+ = 705.43, is consistent with a shorter acyl chain (see B).
Figure 4—figure supplement 4
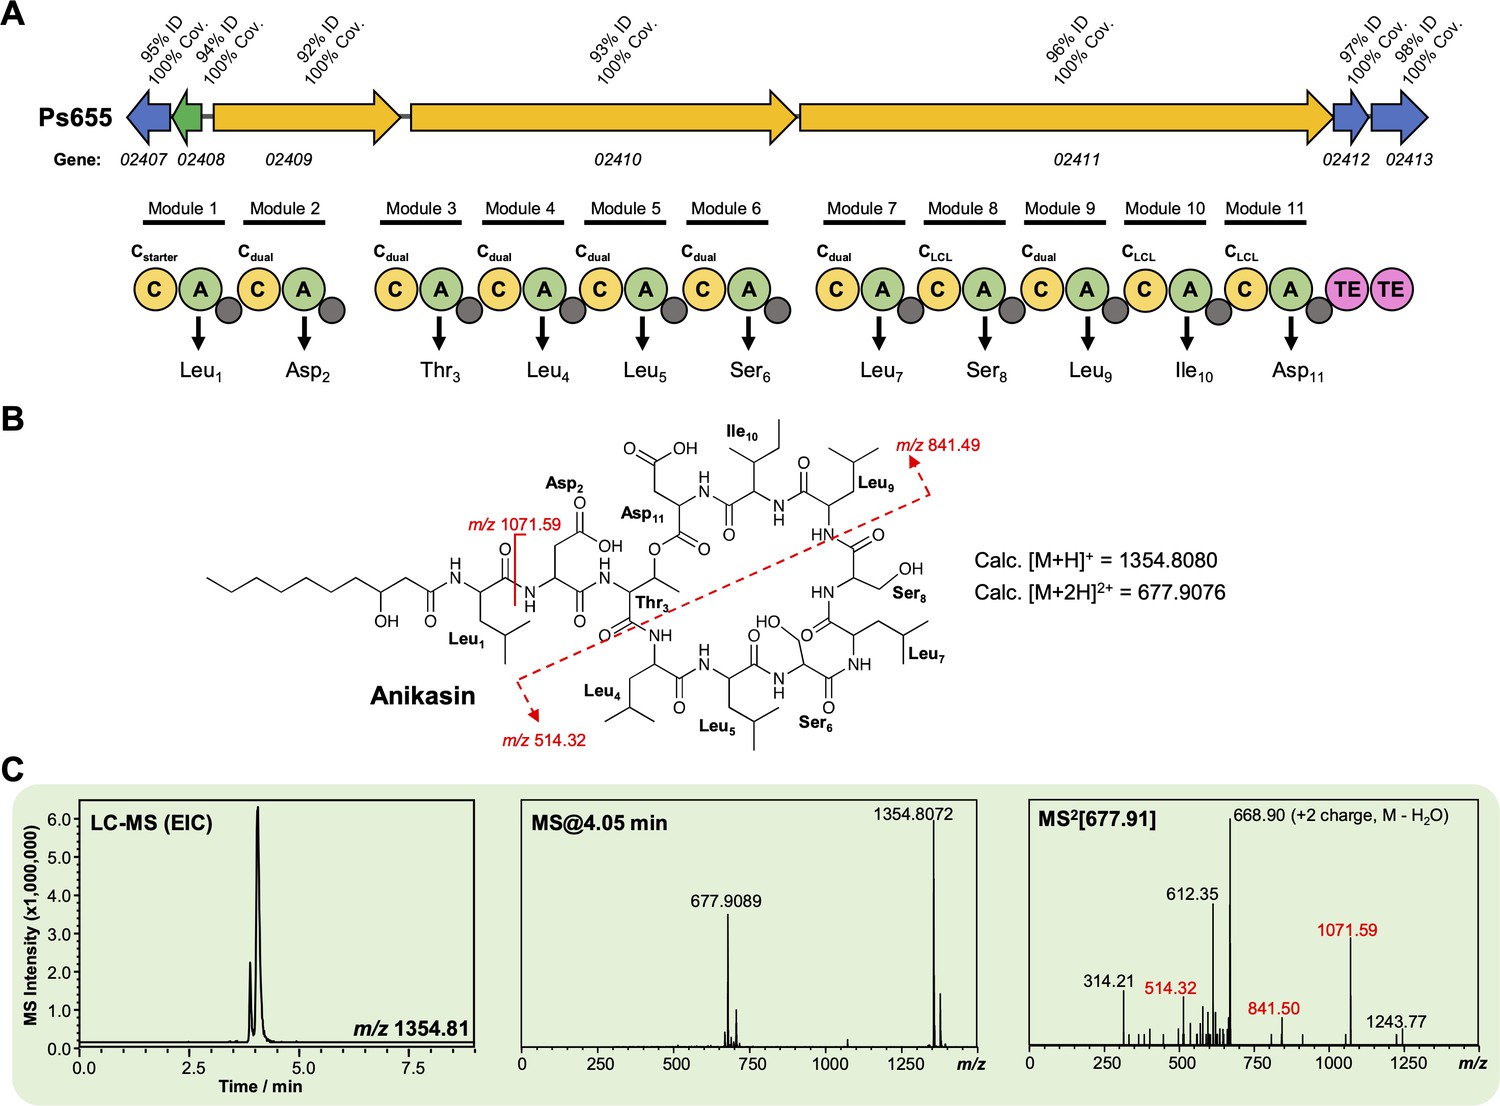
Characterization of an anikasin-like lipopeptide from strain Ps655.
(A) Gene cluster listing the homology to the Pseudomonas fluorescens HKI0770 anikasin biosynthetic gene cluster (BGC) (MiBIG BGC0001509). The nonribosomal peptide synthetase (NRPS) organization is displayed (color coding and nomenclature as in Figure 4—figure supplement 2) and amino acids incorporated by each module are displayed, along with predicted condensation domain specificity. (B) Structure of anikasin showing calculated masses for observed MS/MS fragmentation. (C) Liquid chromatography–tandem mass spectrometry (LC-MS) data showing production of an anikasin-like molecule by Ps655 (EIC, extracted ion chromatogram). Red MS/MS fragments relate to fragments shown in panel (B) and are equivalent to the tensin fragments shown in Figure 4—figure supplement 3. A variety of isomers of anikasin have been reported (Götze et al., 2017), such as arthrofactin and pholipeptin.
Figure 4—figure supplement 5
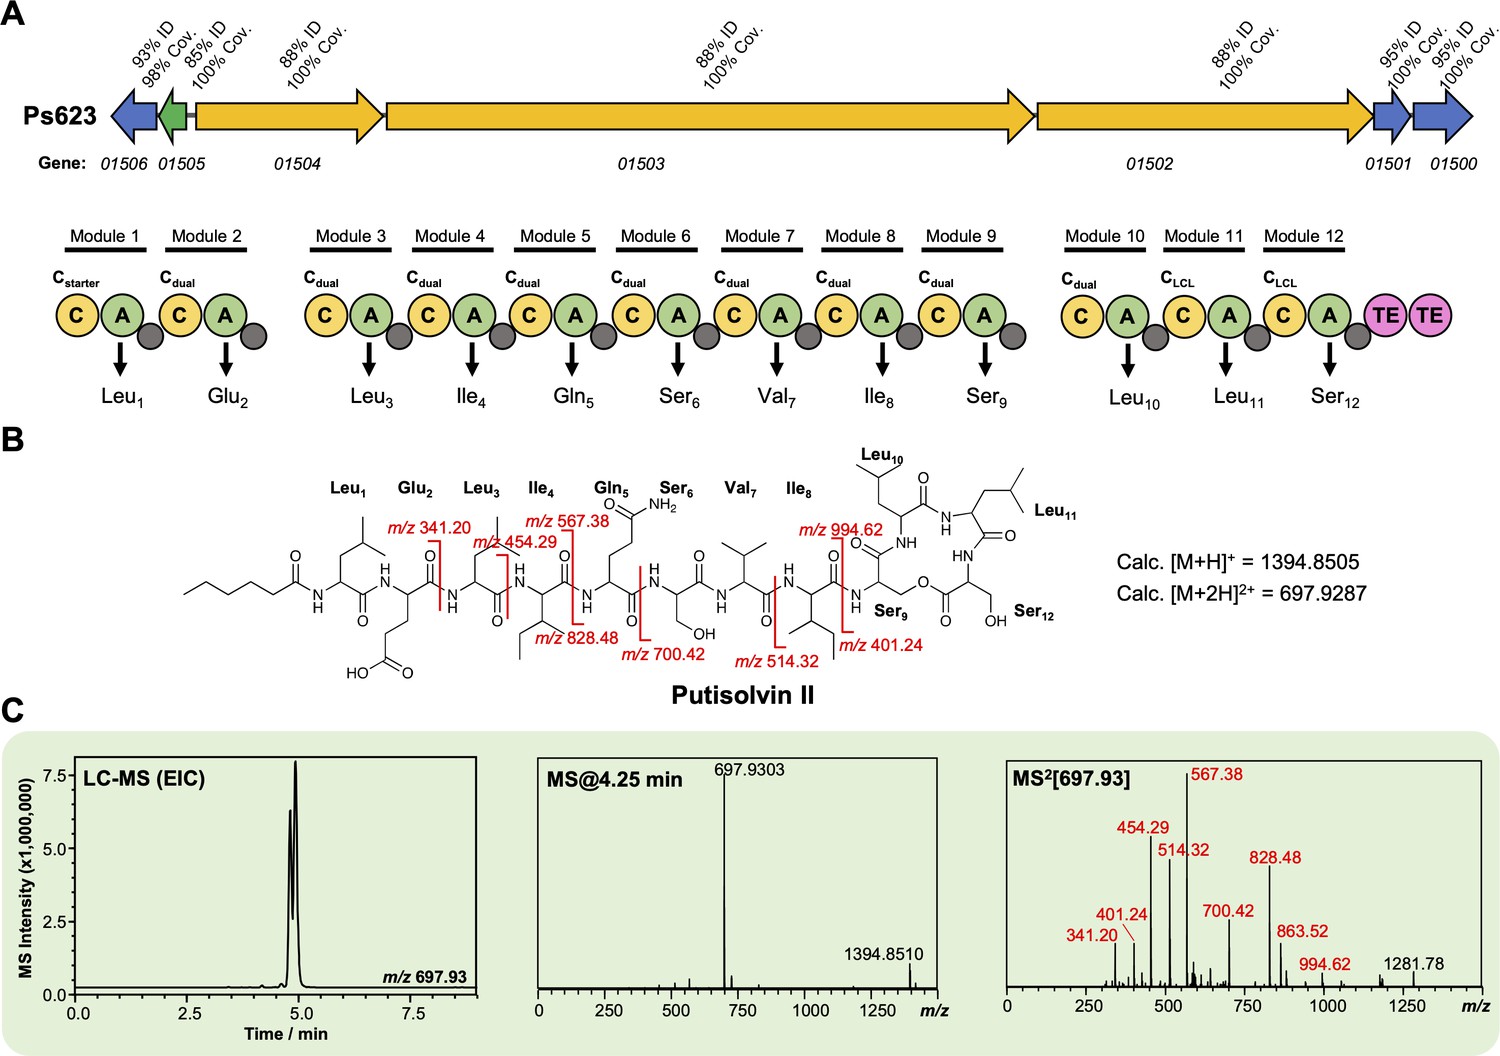
Characterization of a putisolvin II-like lipopeptide from strain Ps623.
(A) Gene cluster listing the homology to the Pseudomonas putida PCL1445 putisolvin biosynthetic gene cluster (BGC) (MiBIG BGC0000411). The nonribosomal peptide synthetase (NRPS) organization is displayed (color coding and nomenclature as in Figure 4—figure supplement 2) and amino acids incorporated by each module are displayed, along with predicted condensation domain specificity. (B) Structure of putisolvin II showing calculated masses for observed MS/MS fragmentation. (C) Liquid chromatography–tandem mass spectrometry (LC-MS) data showing production of a putisolvin II-like molecule by Ps623 (EIC, extracted ion chromatogram). Red MS/MS fragments relate to fragments shown in panel (B).
Figure 4—figure supplement 6
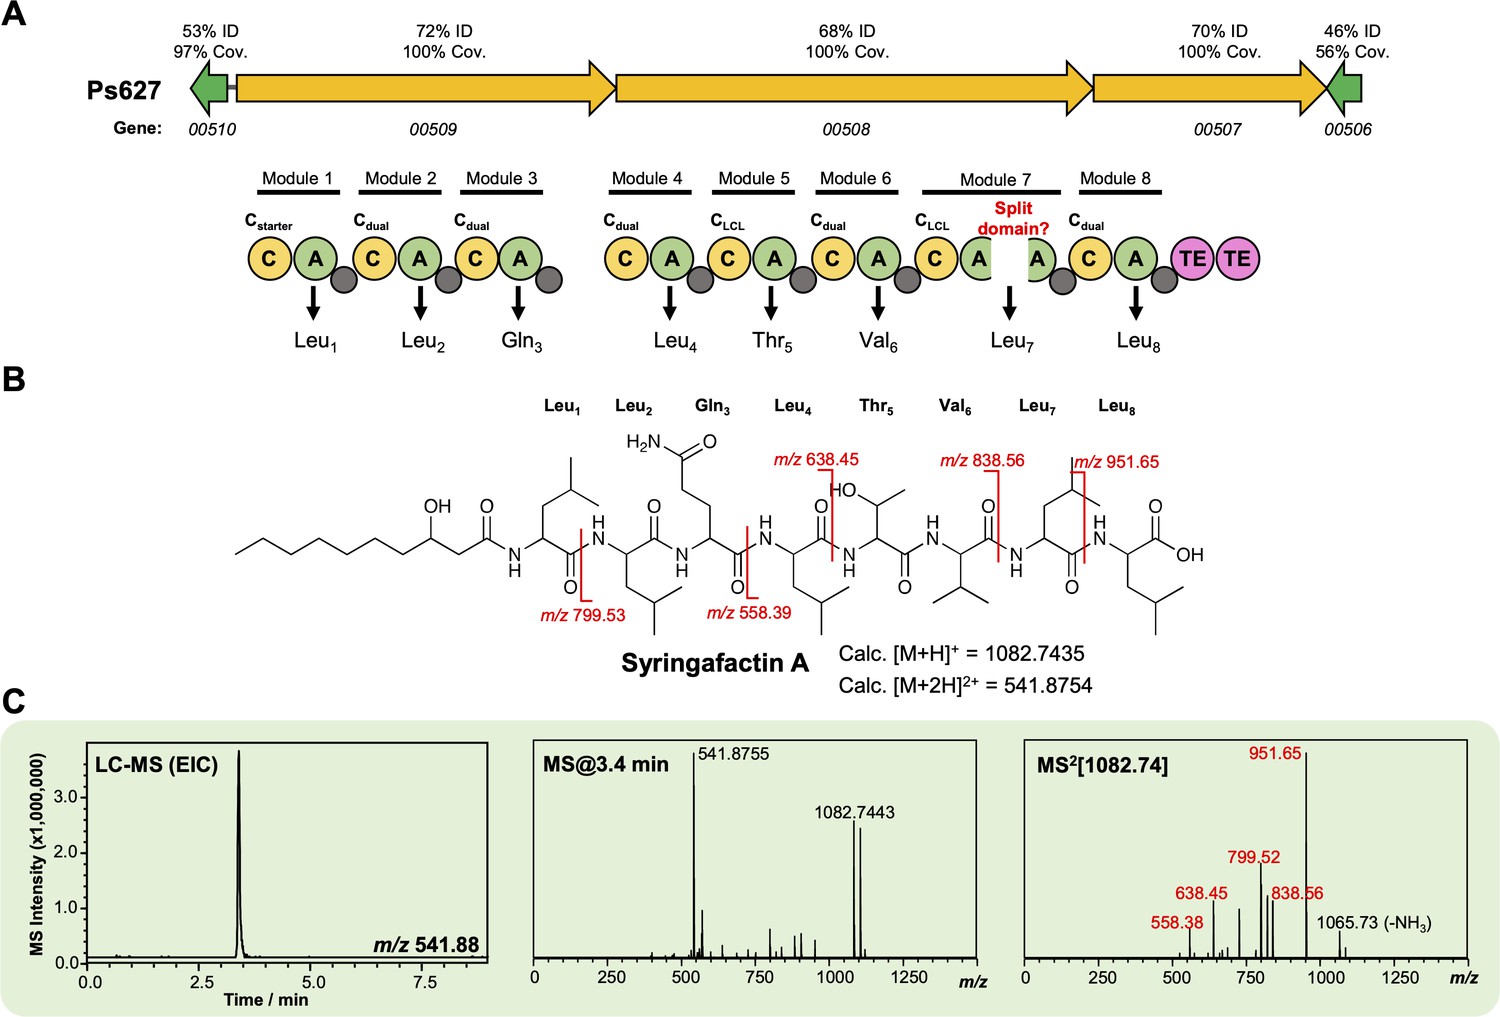
Characterization of a syringafactin-like lipopeptide from strain Ps627.
(A) Gene cluster listing the homology to the P. syringae DC3000 syringafactin biosynthetic gene cluster (BGC) (MiBIG BGC0000435). The nonribosomal peptide synthetase (NRPS) organization is displayed (color coding and nomenclature as in Figure 4—figure supplement 2) with an unexpected ‘split’ A domain. Further experiments are needed to determine whether this is real or a sequencing artifact. Amino acids incorporated by each module are displayed, along with predicted condensation domain specificity. (B) Structure of syringafactin A showing calculated masses for observed MS/MS fragmentation. (C) Liquid chromatography–tandem mass spectrometry (LC-MS) data showing production of a syringafactin-like molecule by Ps627 (EIC, extracted ion chromatogram). Red MS/MS fragments relate to calculated fragments shown in panel (B).
Figure 4—figure supplement 7
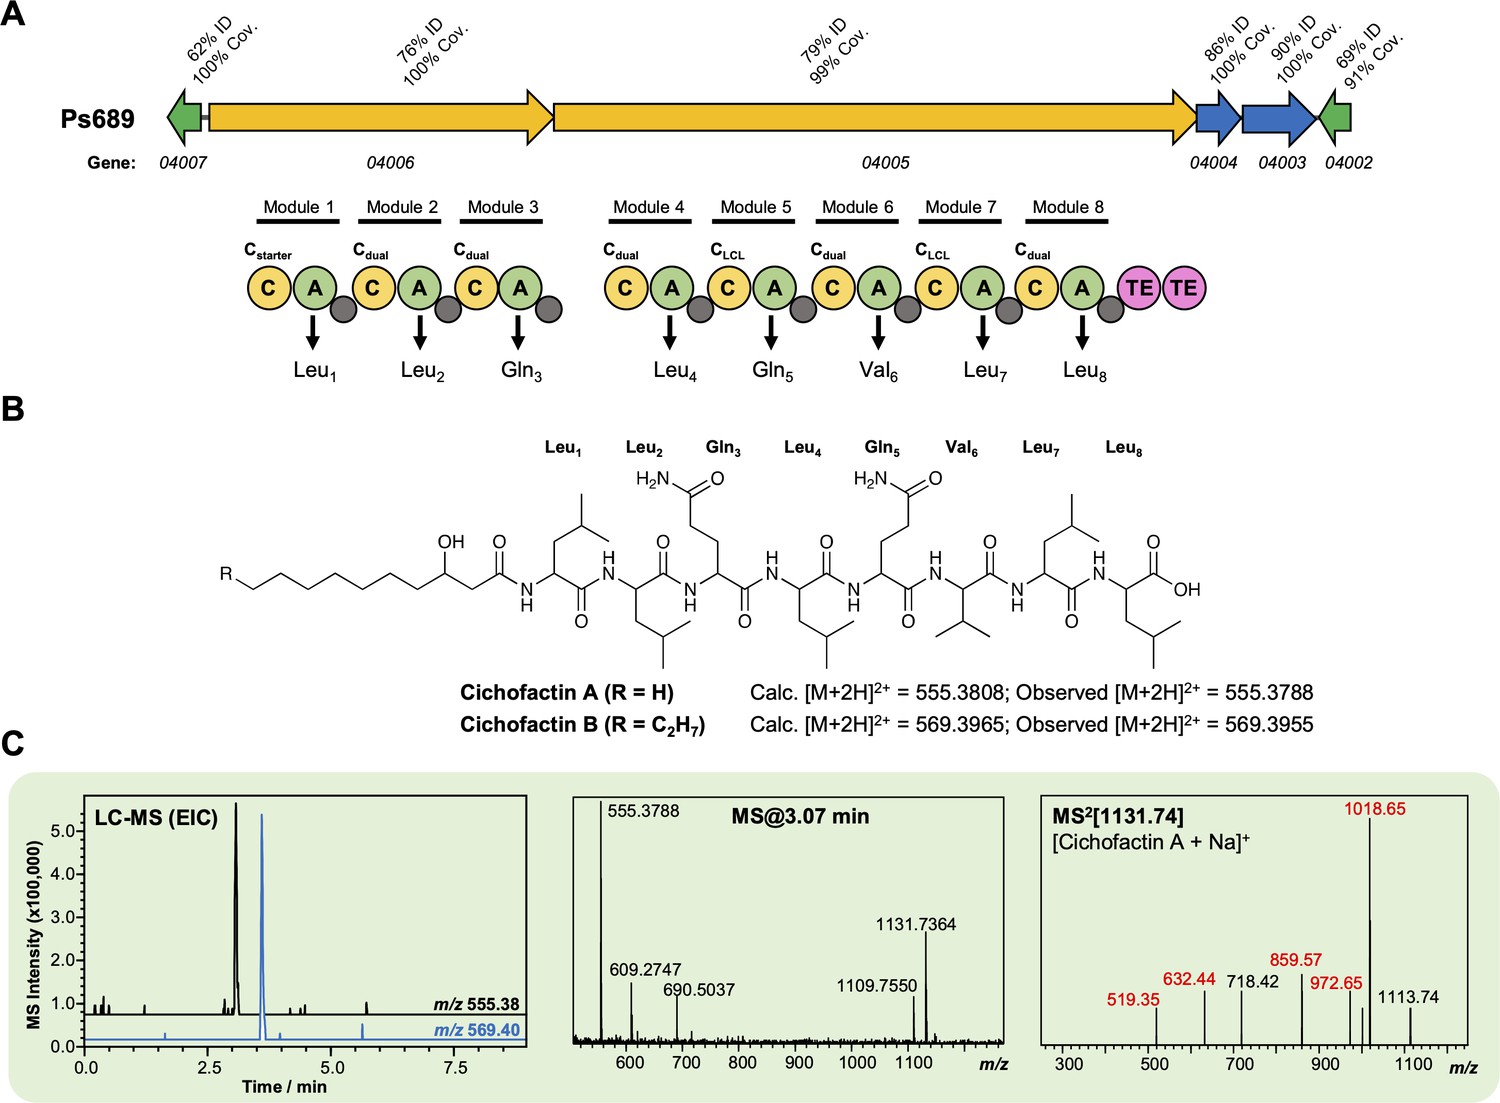
Characterization of a cichofactin-like lipopeptide from strain Ps689.
(A) Gene cluster listing the homology to the Pseudomonas cichorii cichofactin biosynthetic gene cluster (BGC) (MiBIG BGC0000323). The nonribosomal peptide synthetase (NRPS) organization is displayed (color coding and nomenclature as in Figure 4—figure supplement 2). Amino acids incorporated by each module are displayed, along with predicted condensation domain specificity. (B) Structure of cichofactins showing calculated and observed [M + 2H]2+ values. (C) Liquid chromatography–tandem mass spectrometry (LC-MS) data showing production of a cichofactin-like molecules by Ps689 (EIC, extracted ion chromatogram). Red MS/MS fragments relate to fragments reported for [cichofactin A + Na]+ in Pauwelyn et al., 2013.
Figure 5 with 14 supplements

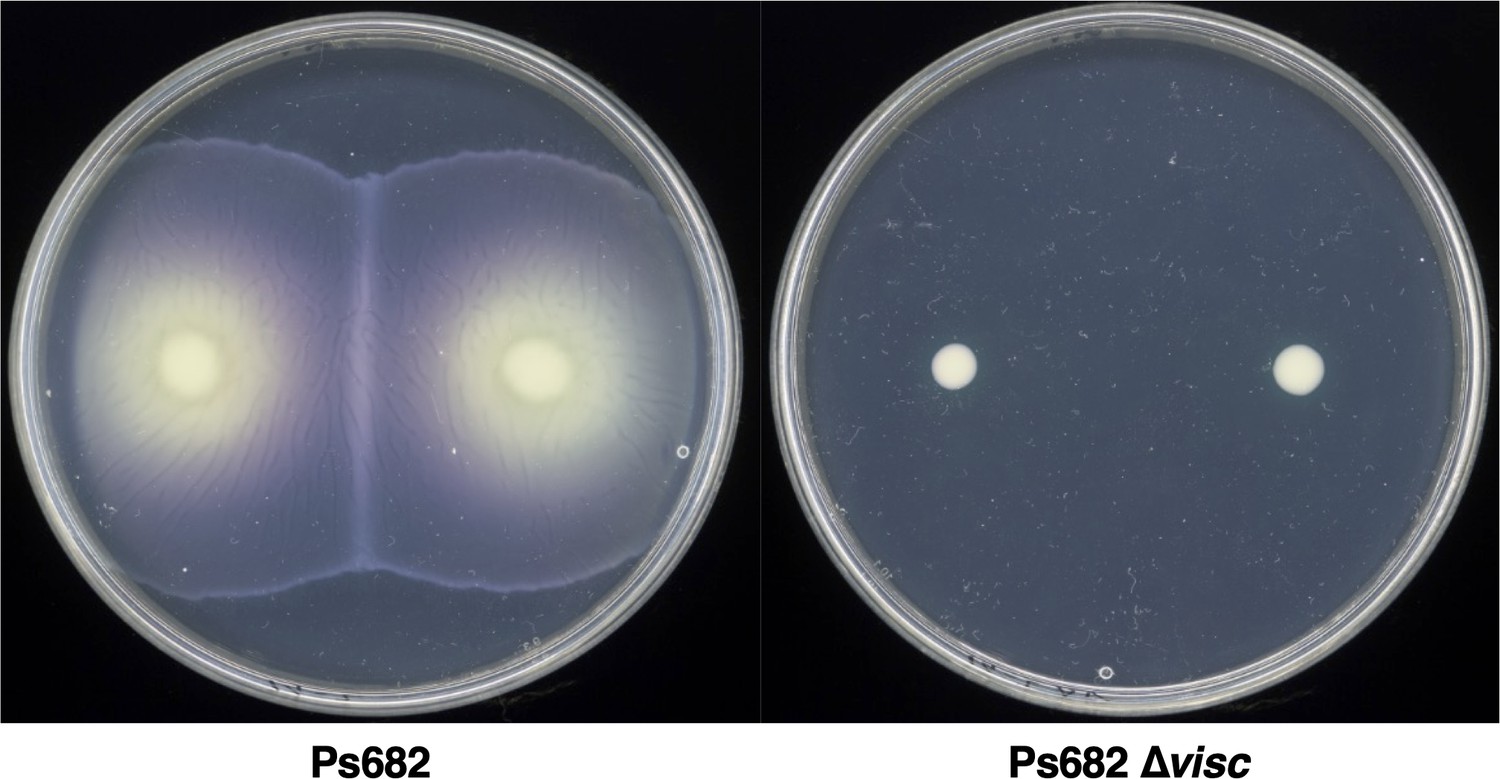
The role of the Ps682 cyclic lipopeptide (CLP) biosynthetic gene cluster (BGC) in S. scabies suppression.
(A) BGC displaying identity/coverage scores in comparison to the viscosin BGC in P. fluorescens SBW25. Genes encoding regulatory proteins are green, transporter genes are blue, and nonribosomal peptide synthetase (NRPS) genes are yellow. The NRPS organization is shown, where C = condensation domain, A = adenylation domain, TE = thioesterase domain, and gray circles are peptidyl carrier protein domains. Amino acids incorporated by each module are displayed, along with predicted condensation domain specificity. (B) Liquid chromatography–mass spectrometry (LC-MS) analysis of viscosin I production in the WT strain and a mutant (Ps682 ∆visc) with an in-frame deletion of NRPS gene 04206 (EIC = extracted ion chromatogram). Nuclear magnetic resonance (NMR) and MS/MS data for viscosin I are shown in Figure 5—figure supplements 2–13. (C) Disk diffusion assay of viscosin I against S. scabies. Concentrations are indicated (µg/mL), alongside a methanol control. (D) On-plate S. scabies suppression activity of Ps682 alongside Ps682 ∆visc shown as cross-streaks using strains with and without the lux operon. Bioluminescence was detected using a NightOWL camera (Berthold Technologies).
Figure 5—figure supplement 1
Swarming motility of wild-type Ps682 and Ps682 ∆visc.
Figure 5—figure supplement 2
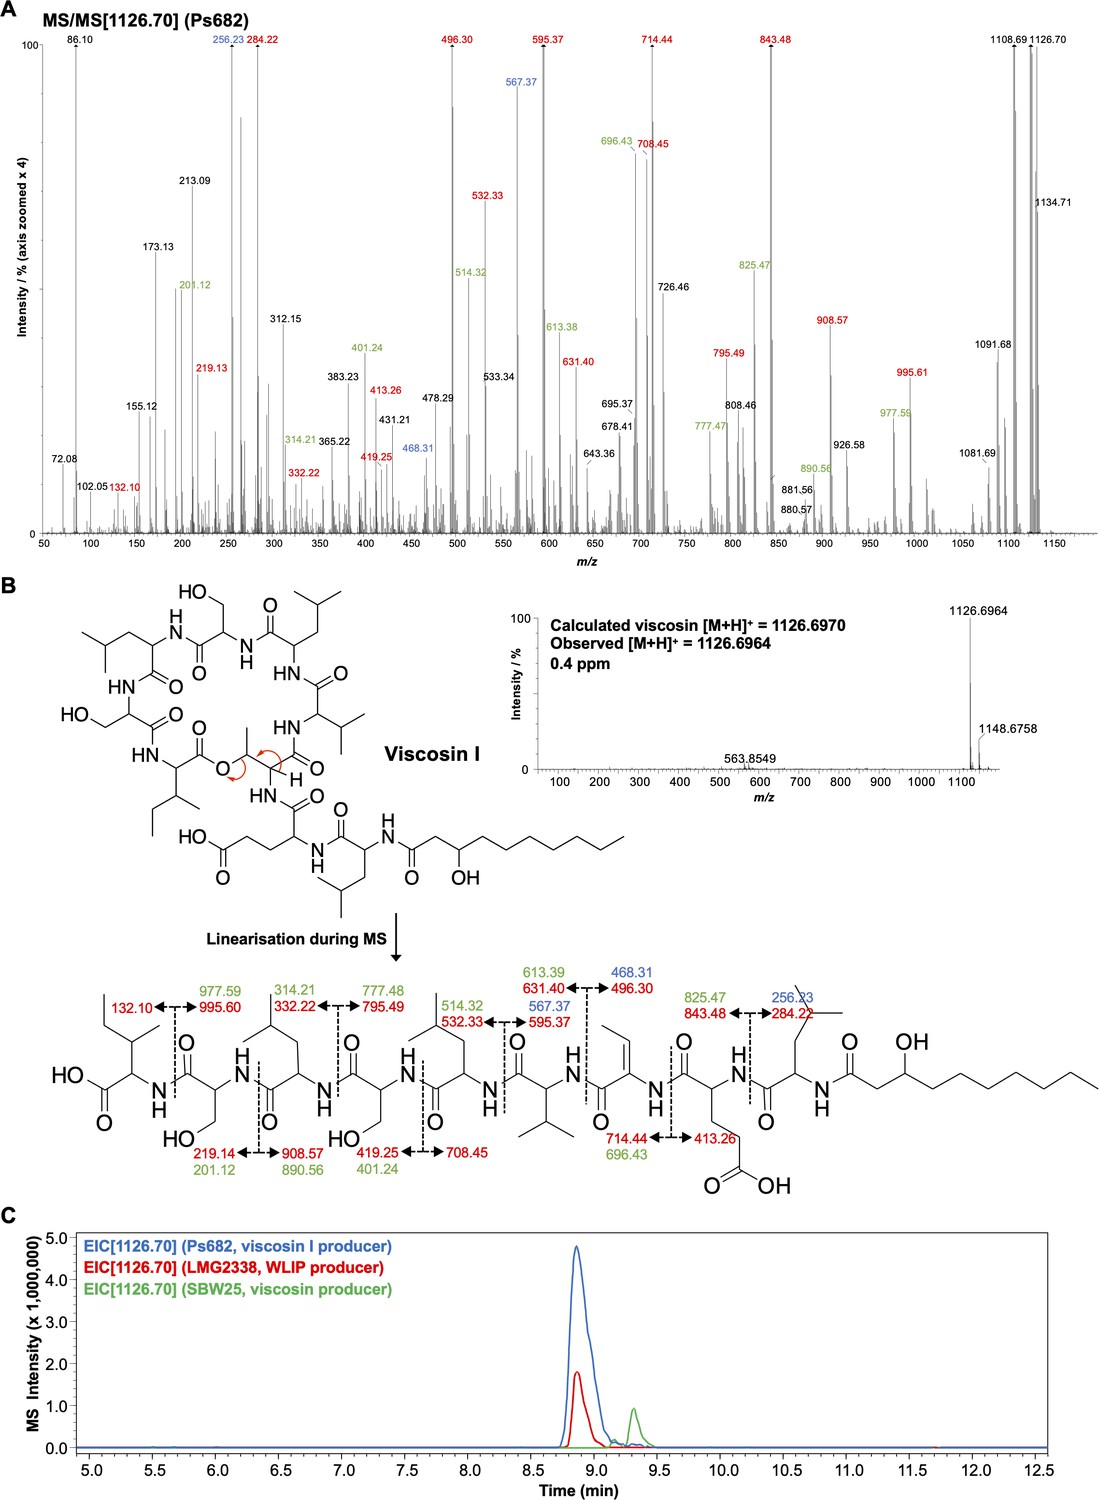
Detailed mass spectrometry (MS) analysis of viscosin-like molecule produced by Ps682.
(A) MS/MS spectrum with annotated peaks color coded (intensity zoomed ×4 for clarity). Red labels, b and y fragments; green labels, loss of water from b/y fragments; blue labels, a fragments. (B) Viscosin I accurate mass spectrum plus MS/MS fragment annotations. (C) Liquid chromatography–tandem mass spectrometry (LC-MS) comparison of Ps682 (viscosin I) versus Pseudomonas producers of WLIP and viscosin. EIC, extracted ion chromatogram.
Figure 5—figure supplement 3
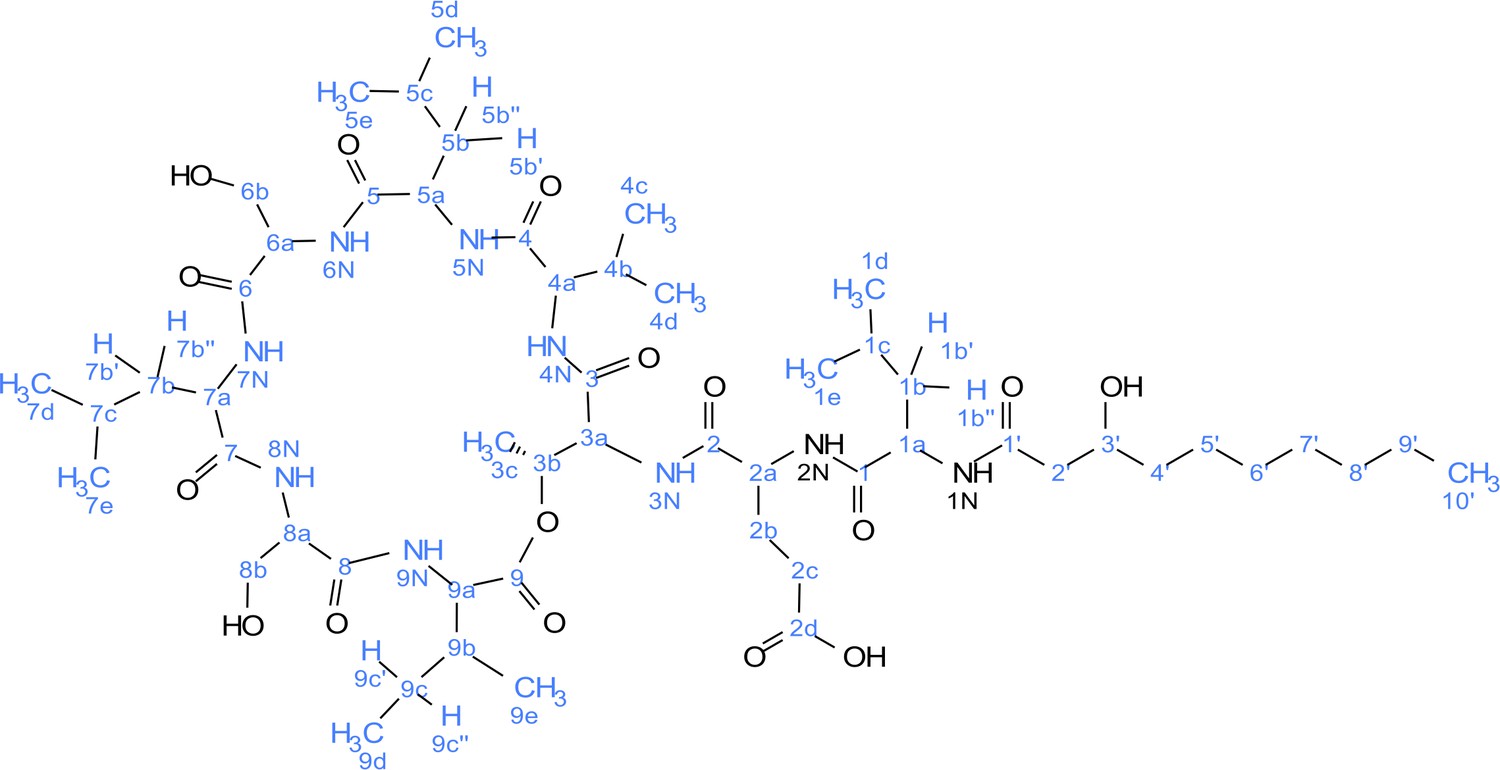
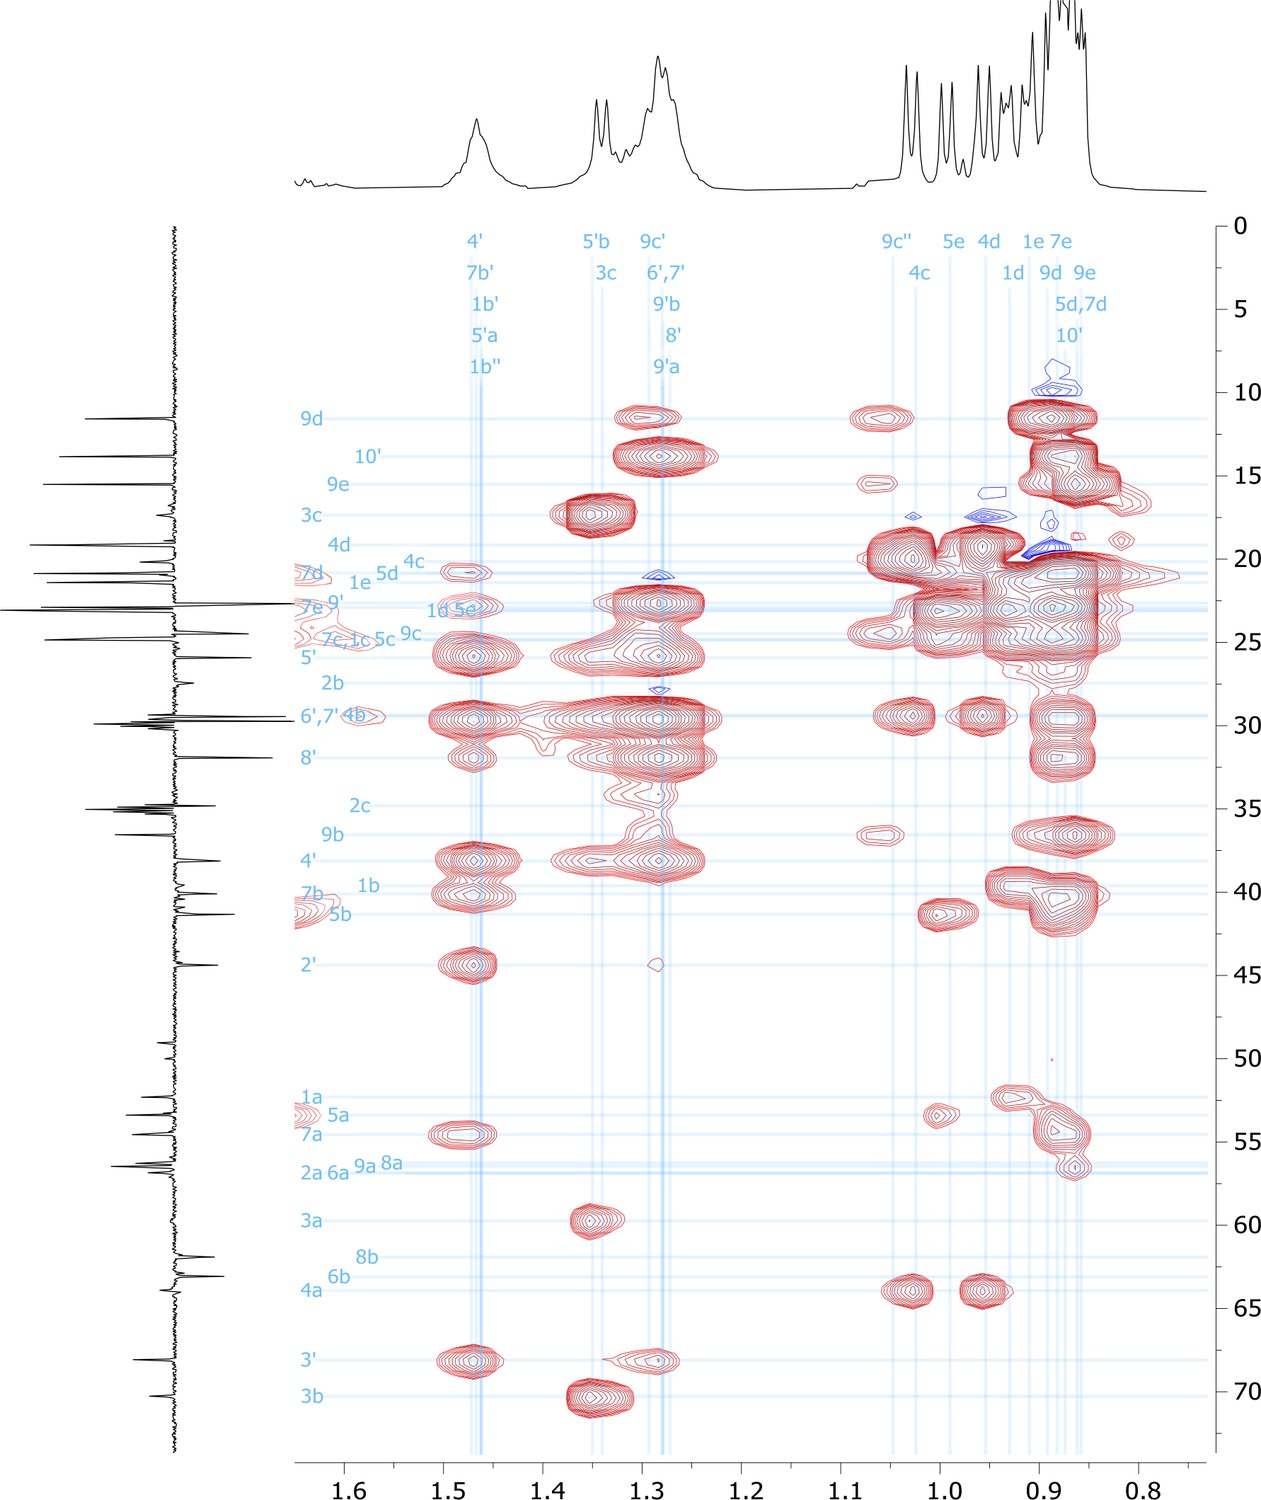
Atom numbering for viscosin I nuclear magnetic resonance (NMR) annotation.
Figure 5—figure supplement 4
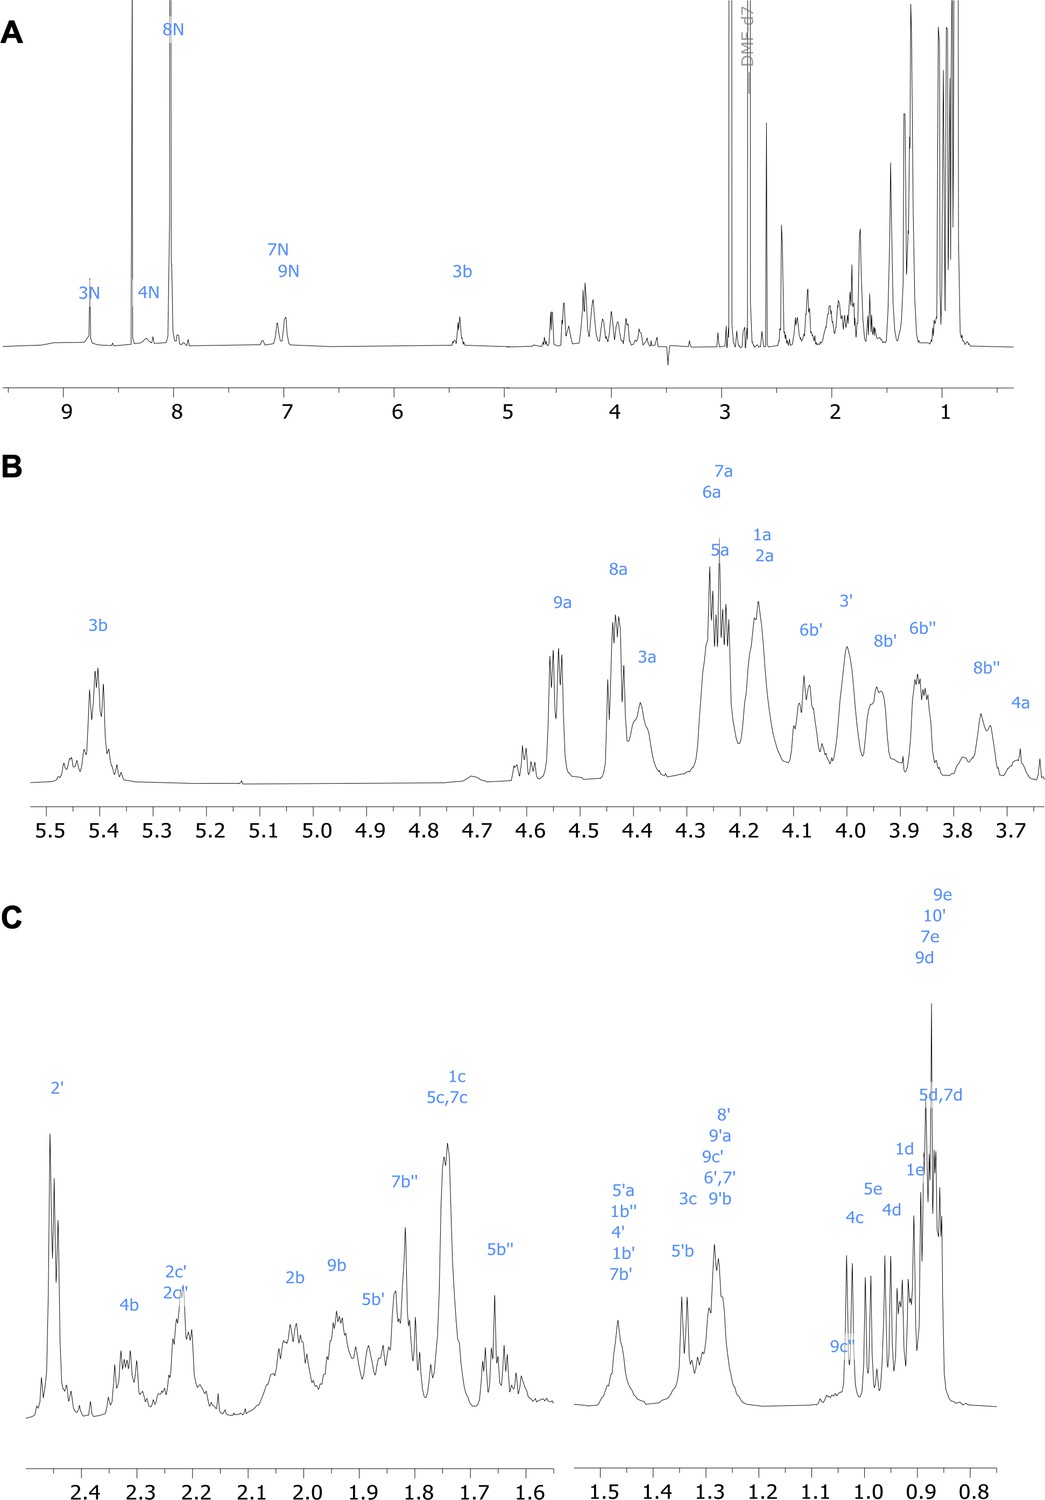
1H nuclear magnetic resonance (NMR) spectrum of viscosin I (600 MHz, DMF-d7, 298 K).
(A) Full spectrum; (B) and (C) show expanded regions of the spectrum.
Figure 5—figure supplement 5
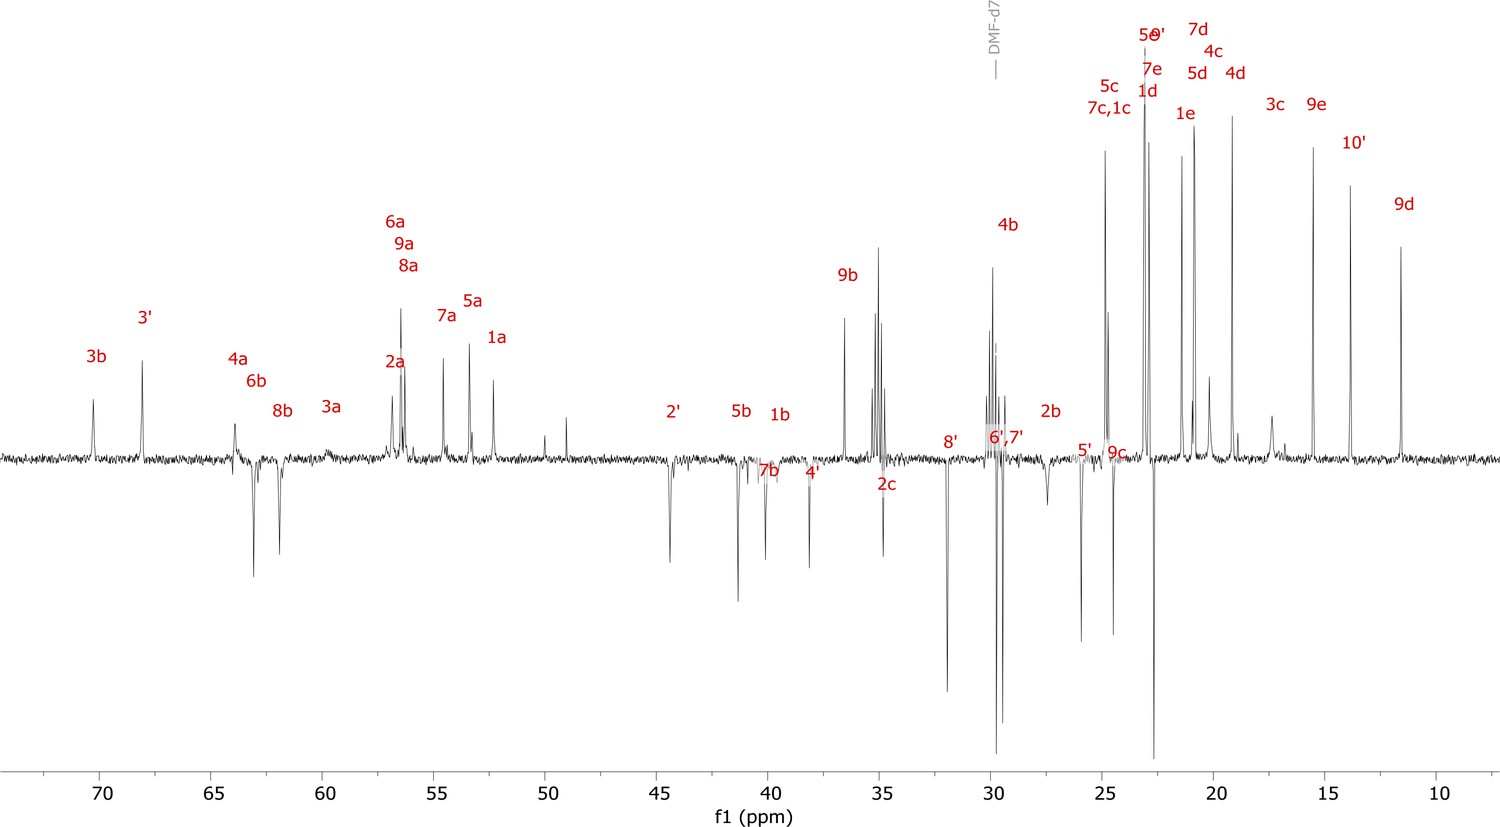
13C nuclear magnetic resonance (NMR) spectrum (DEPT135) of viscosin I (600 MHz, DMF-d7, 298 K).
Figure 5—figure supplement 6
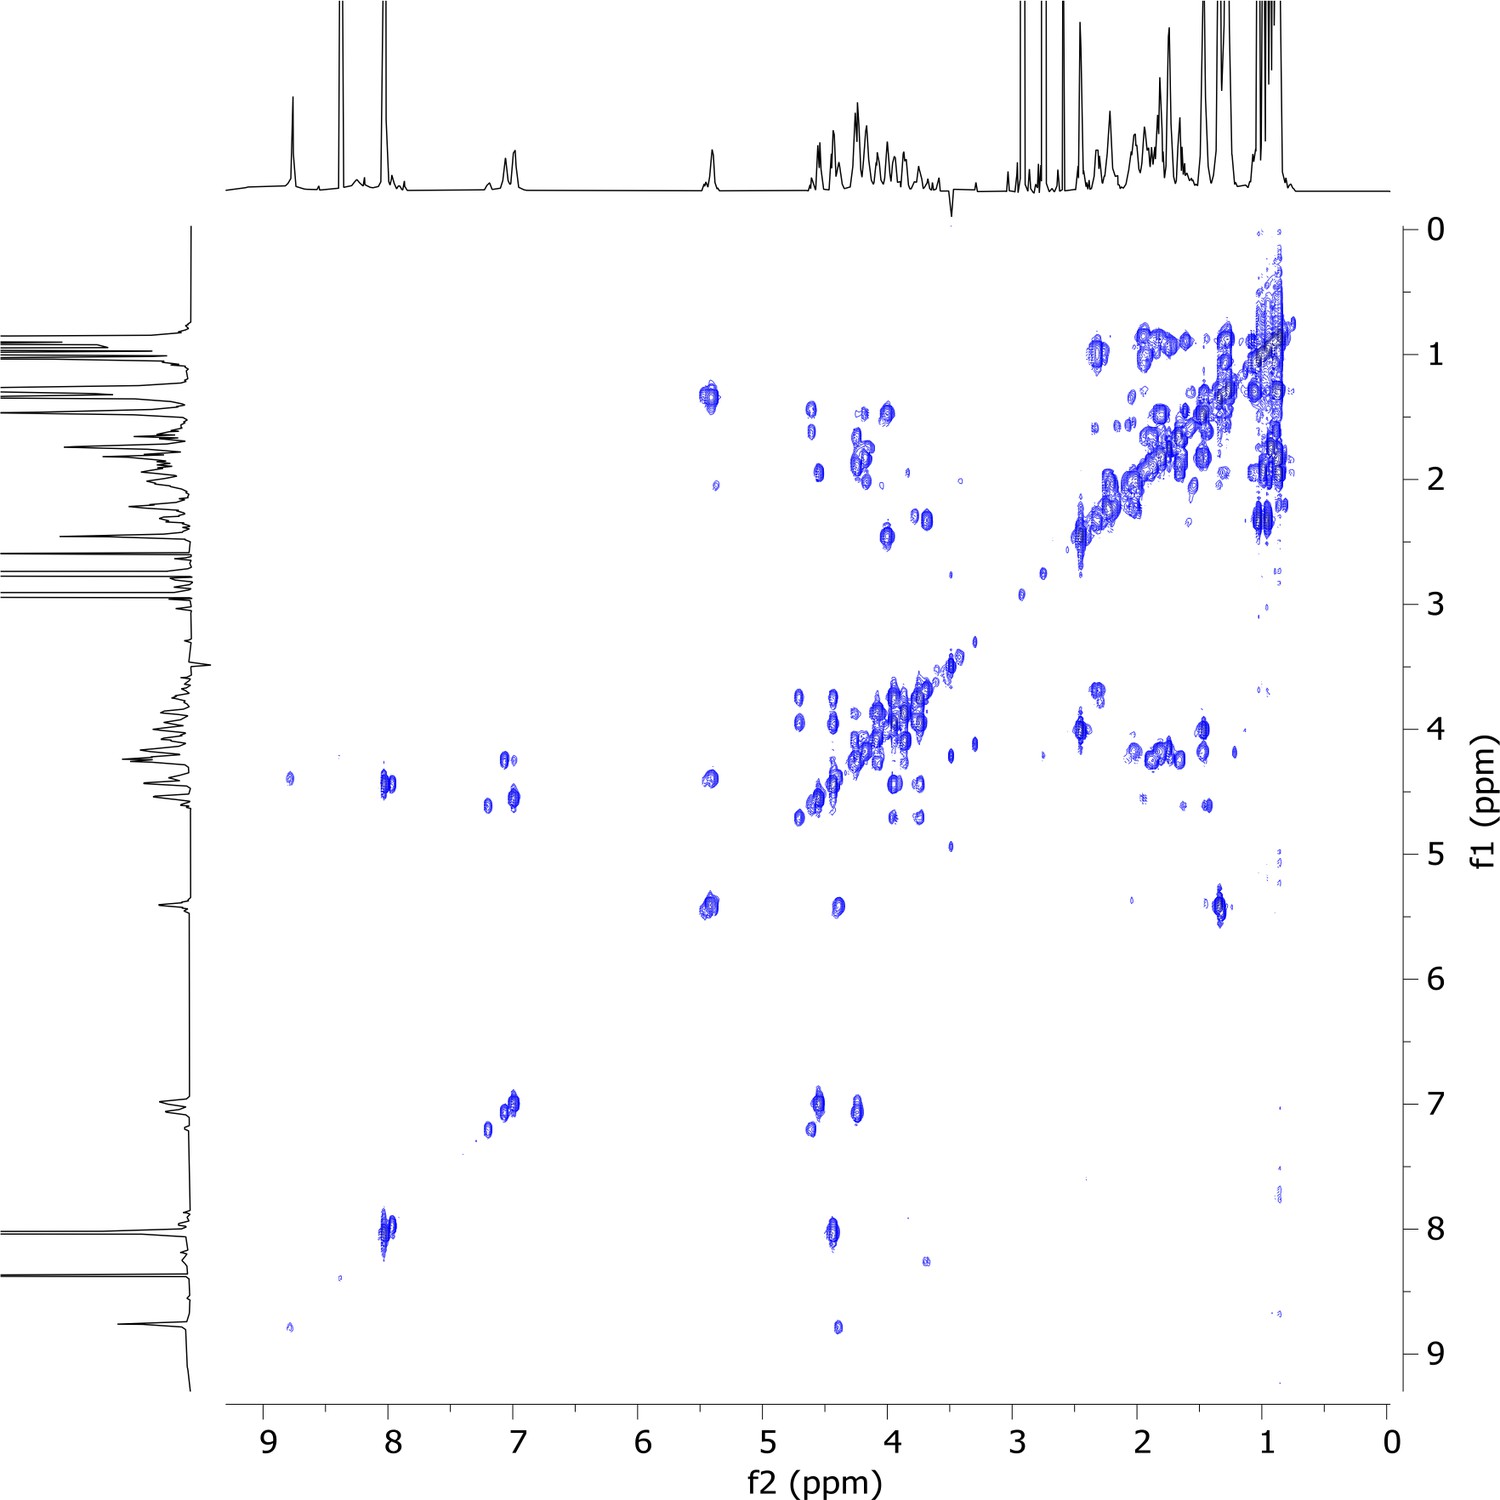
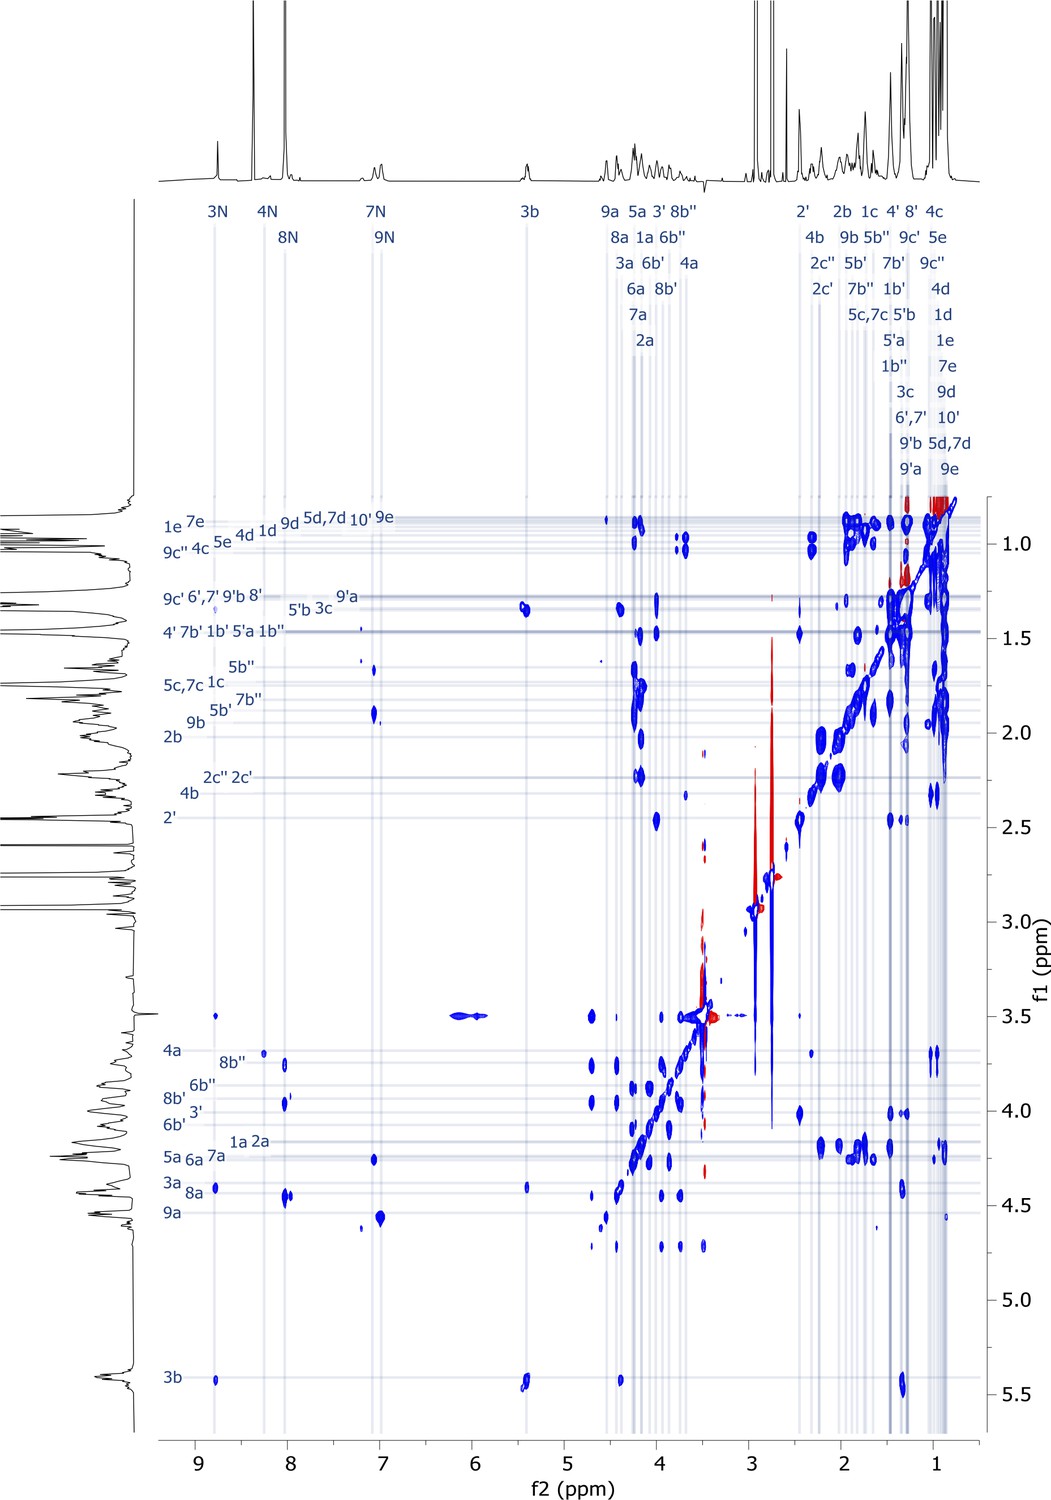
2D COSY nuclear magnetic resonance (NMR) spectrum of viscosin I (600 MHz, DMF-d7, 298 K).
Figure 5—figure supplement 7
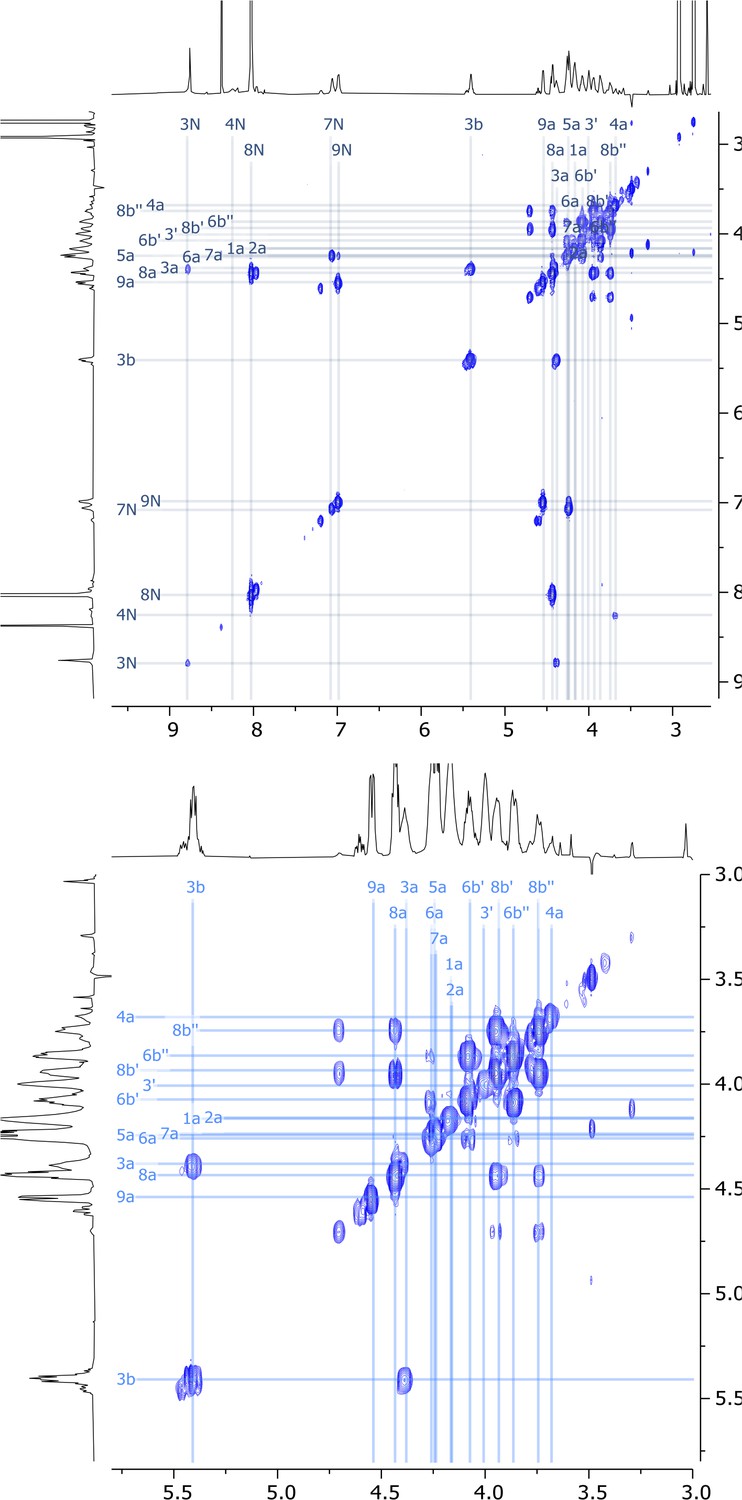
Expanded regions of 2D COSY nuclear magnetic resonance (NMR) spectrum of viscosin I (600 MHz, DMF-d7, 298 K).
Figure 5—figure supplement 8
2D HSQC-EDITED nuclear magnetic resonance (NMR) spectrum of viscosin I (600 MHz, DMF-d7, 298 K).
Figure 5—figure supplement 9
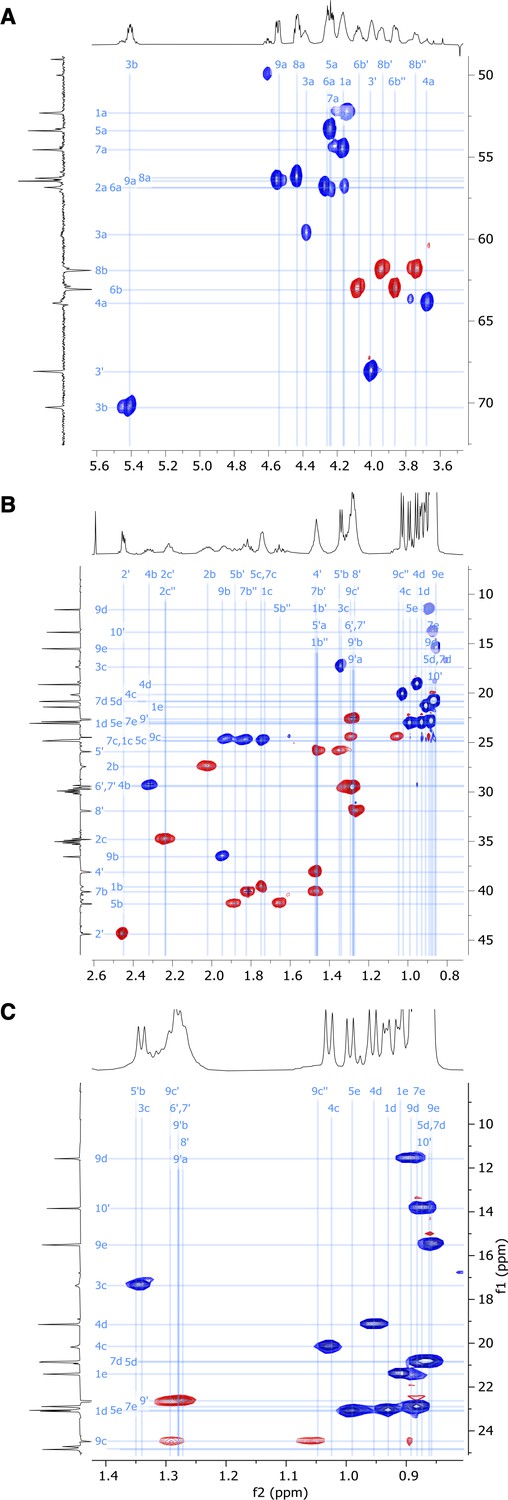
Expansion of (A) α-C, (B) side chain, and (C) Me-group regions of 2D HSQC-EDITED nuclear magnetic resonance (NMR) spectrum of viscosin I (600 MHz, DMF-d7, 298 K).
Figure 5—figure supplement 10
2D TOCSY nuclear magnetic resonance (NMR) spectrum of viscosin I (600 MHz, DMF-d7, 298 K).
Figure 5—figure supplement 11
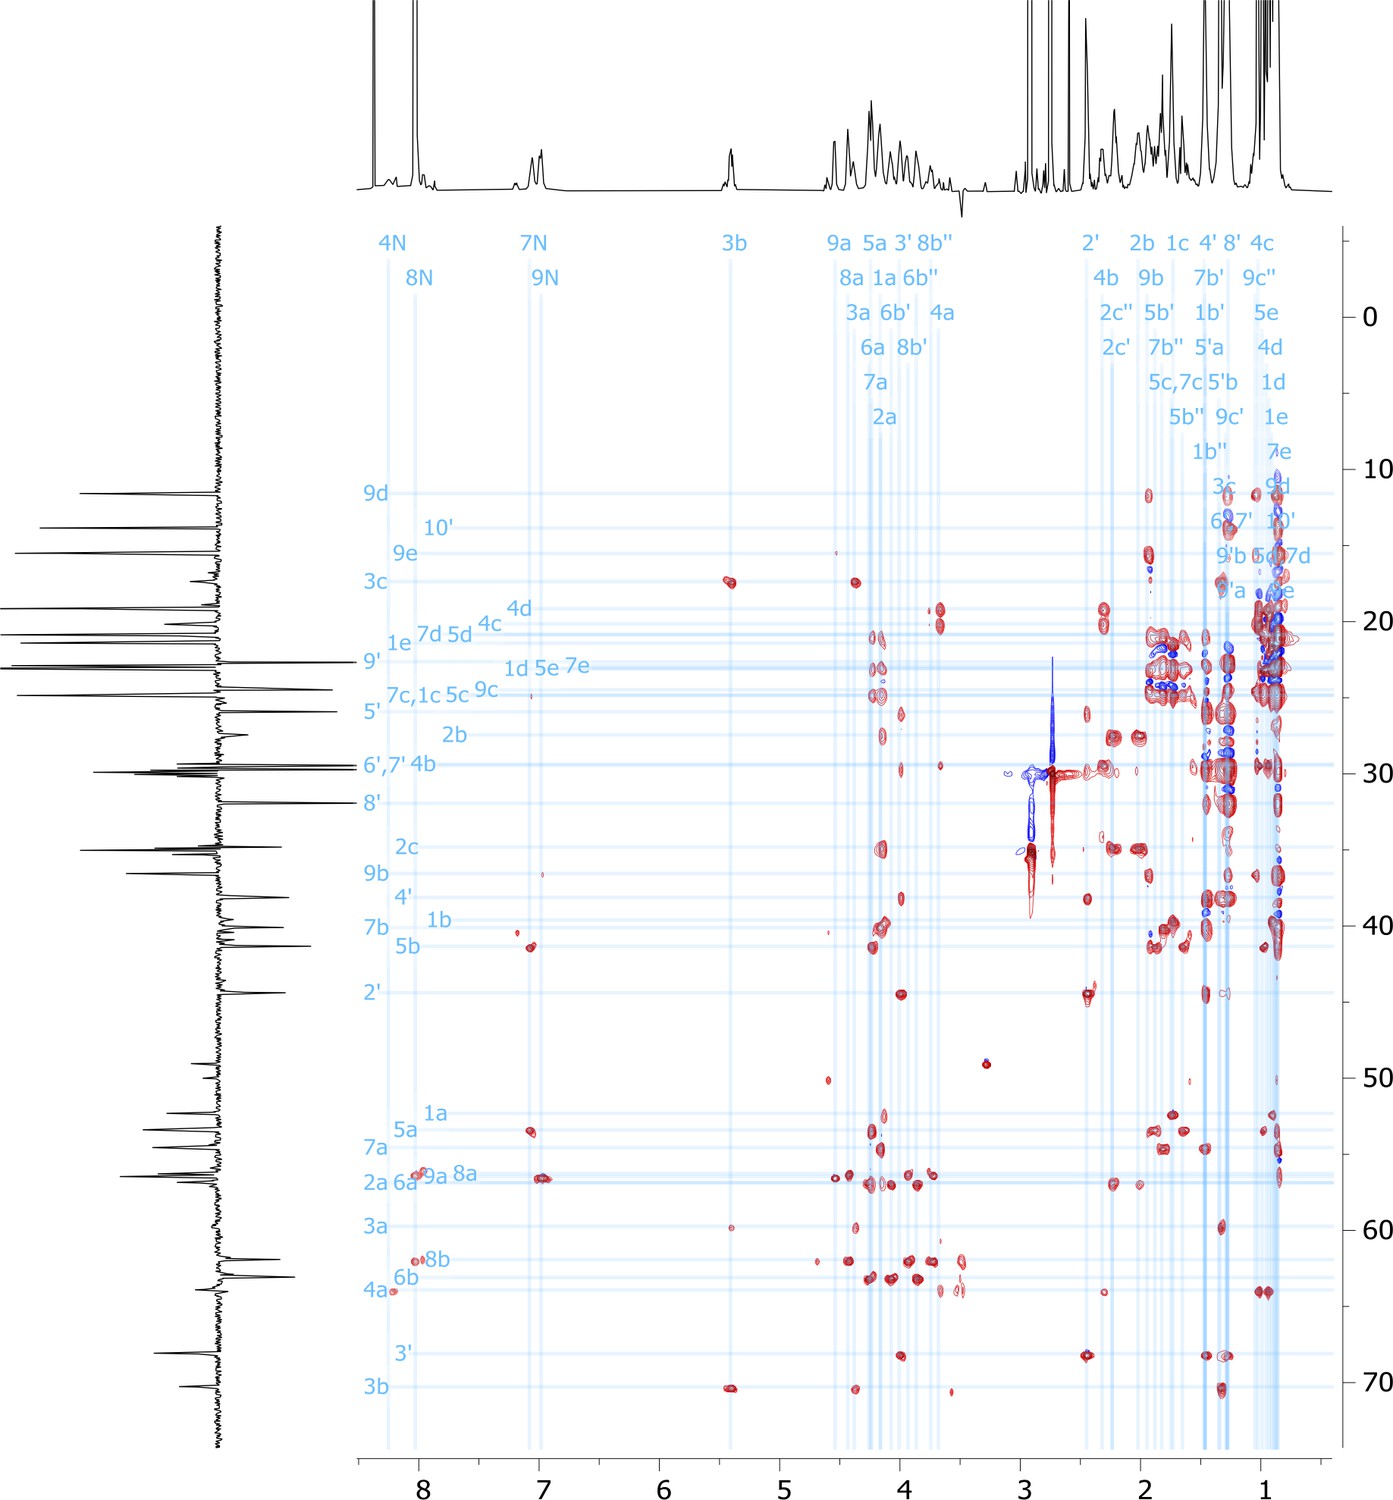
2D HMBC nuclear magnetic resonance (NMR) spectrum of viscosin I (600 MHz, DMF-d7, 298 K).
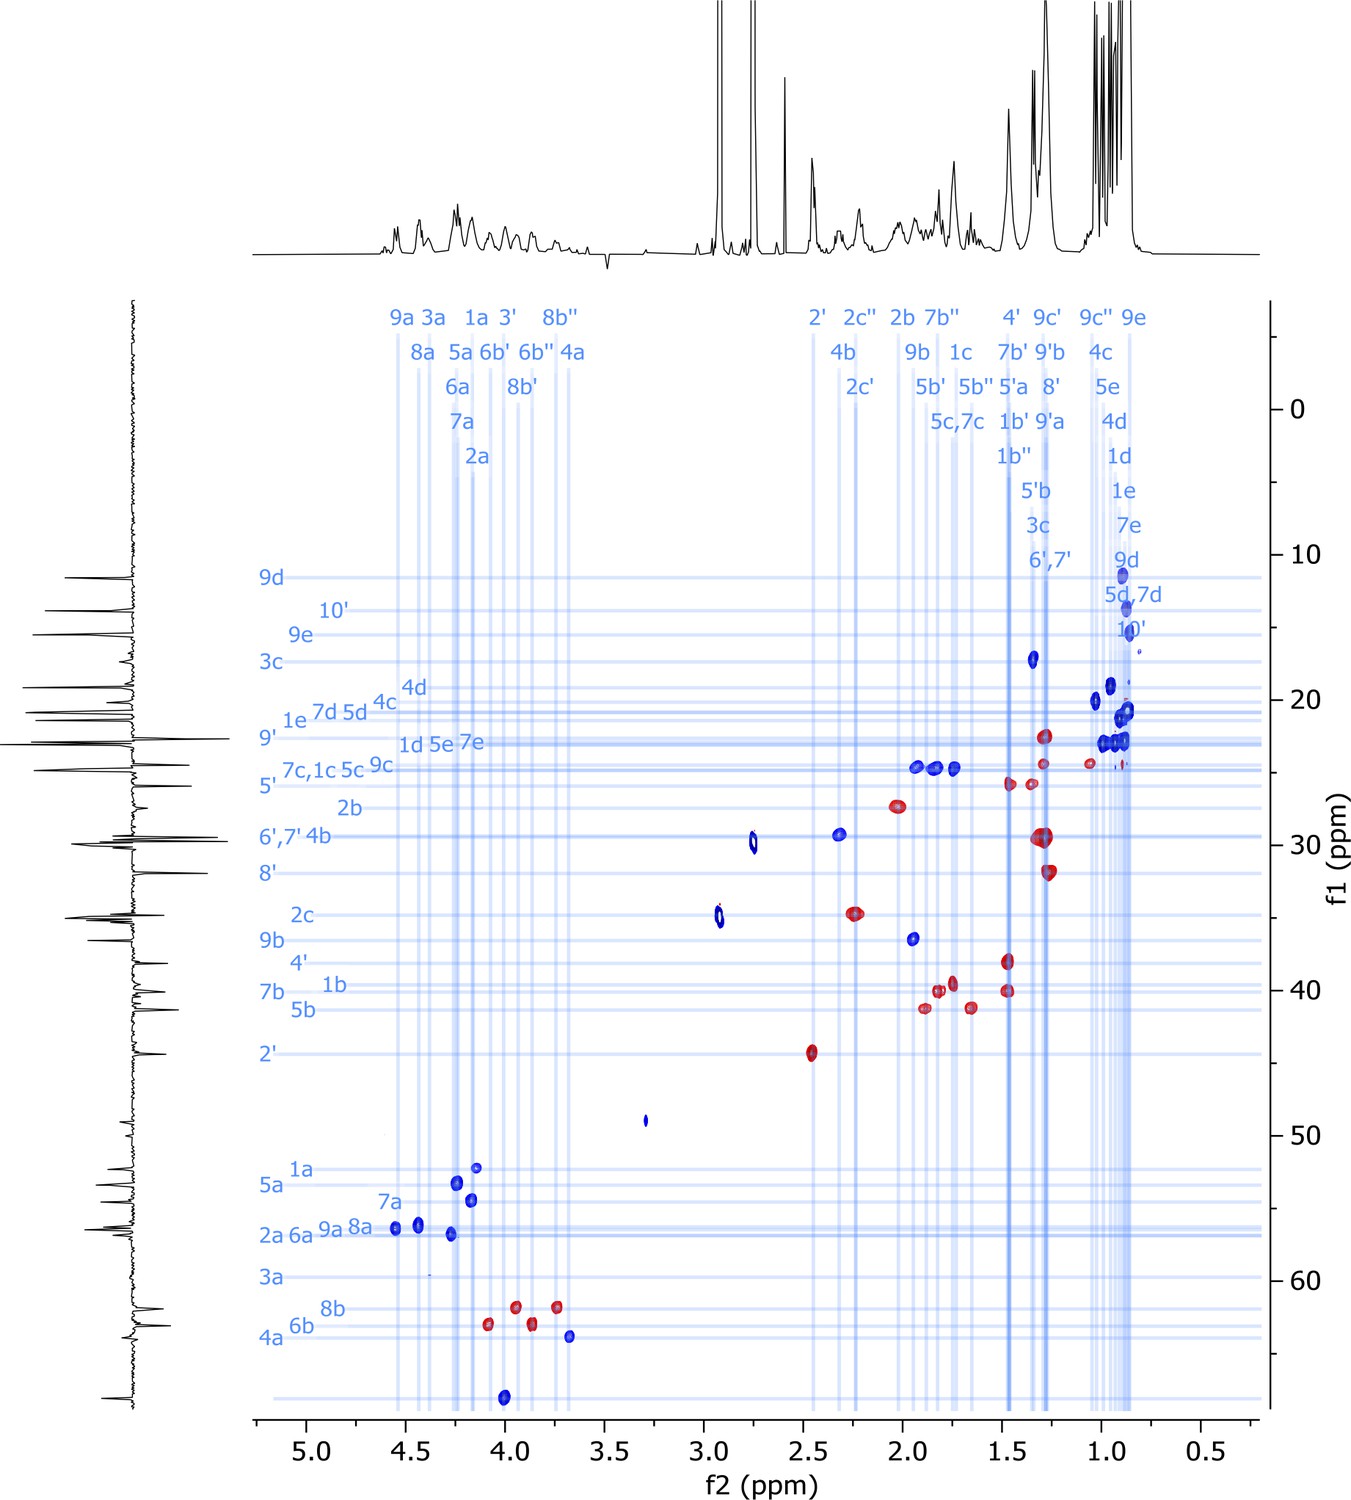
Figure 5—figure supplement 12
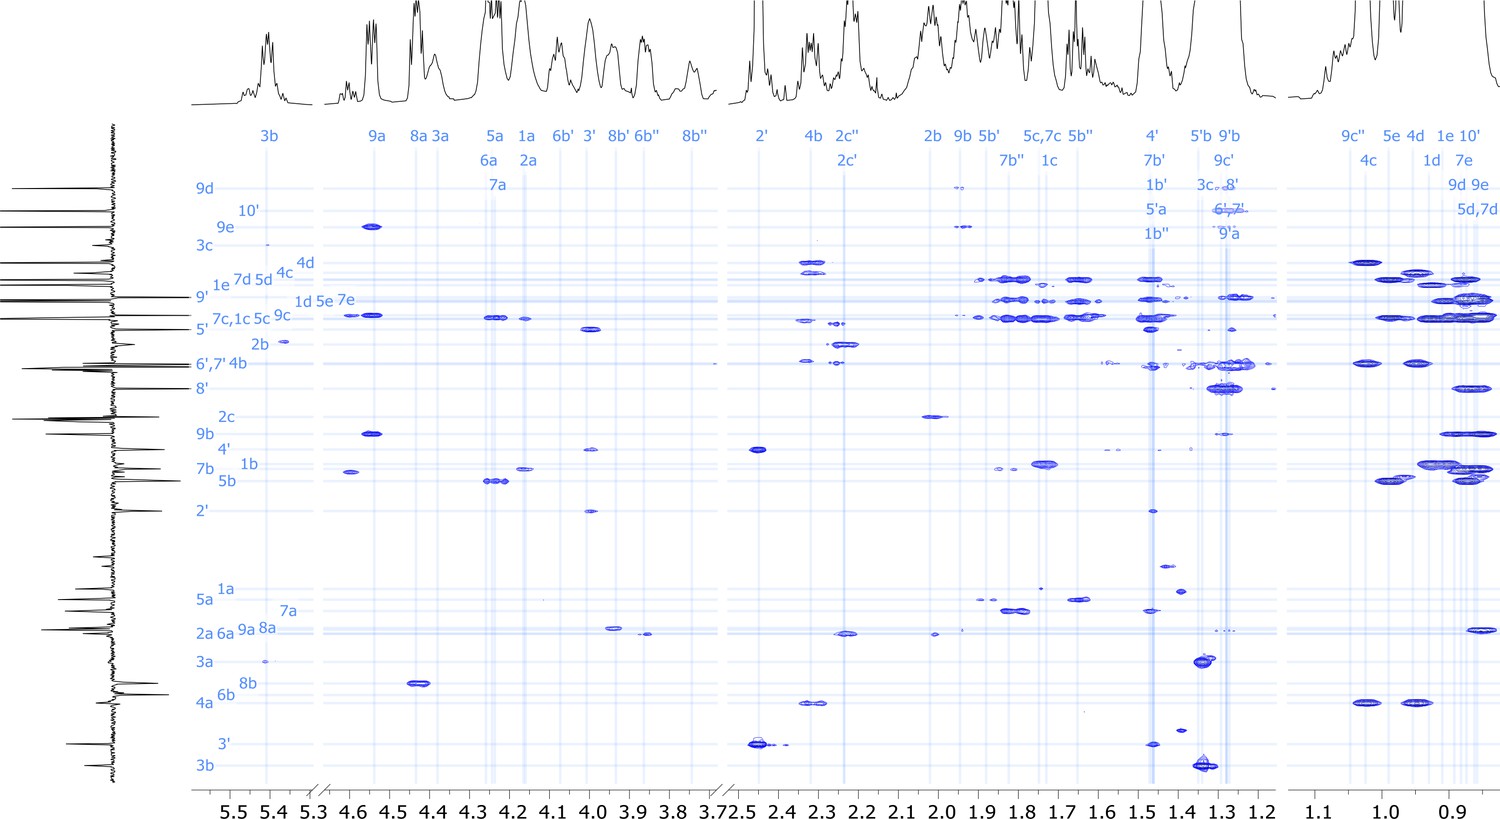
2D HSQC-TOCSY nuclear magnetic resonance (NMR) spectrum of viscosin I (600 MHz, DMF-d7, 298 K).
Figure 5—figure supplement 13
High-field region of 2D HSQC-TOCSY nuclear magnetic resonance (NMR) spectrum of viscosin I (600 MHz, DMF-d7, 298 K).
Figure 5—figure supplement 14
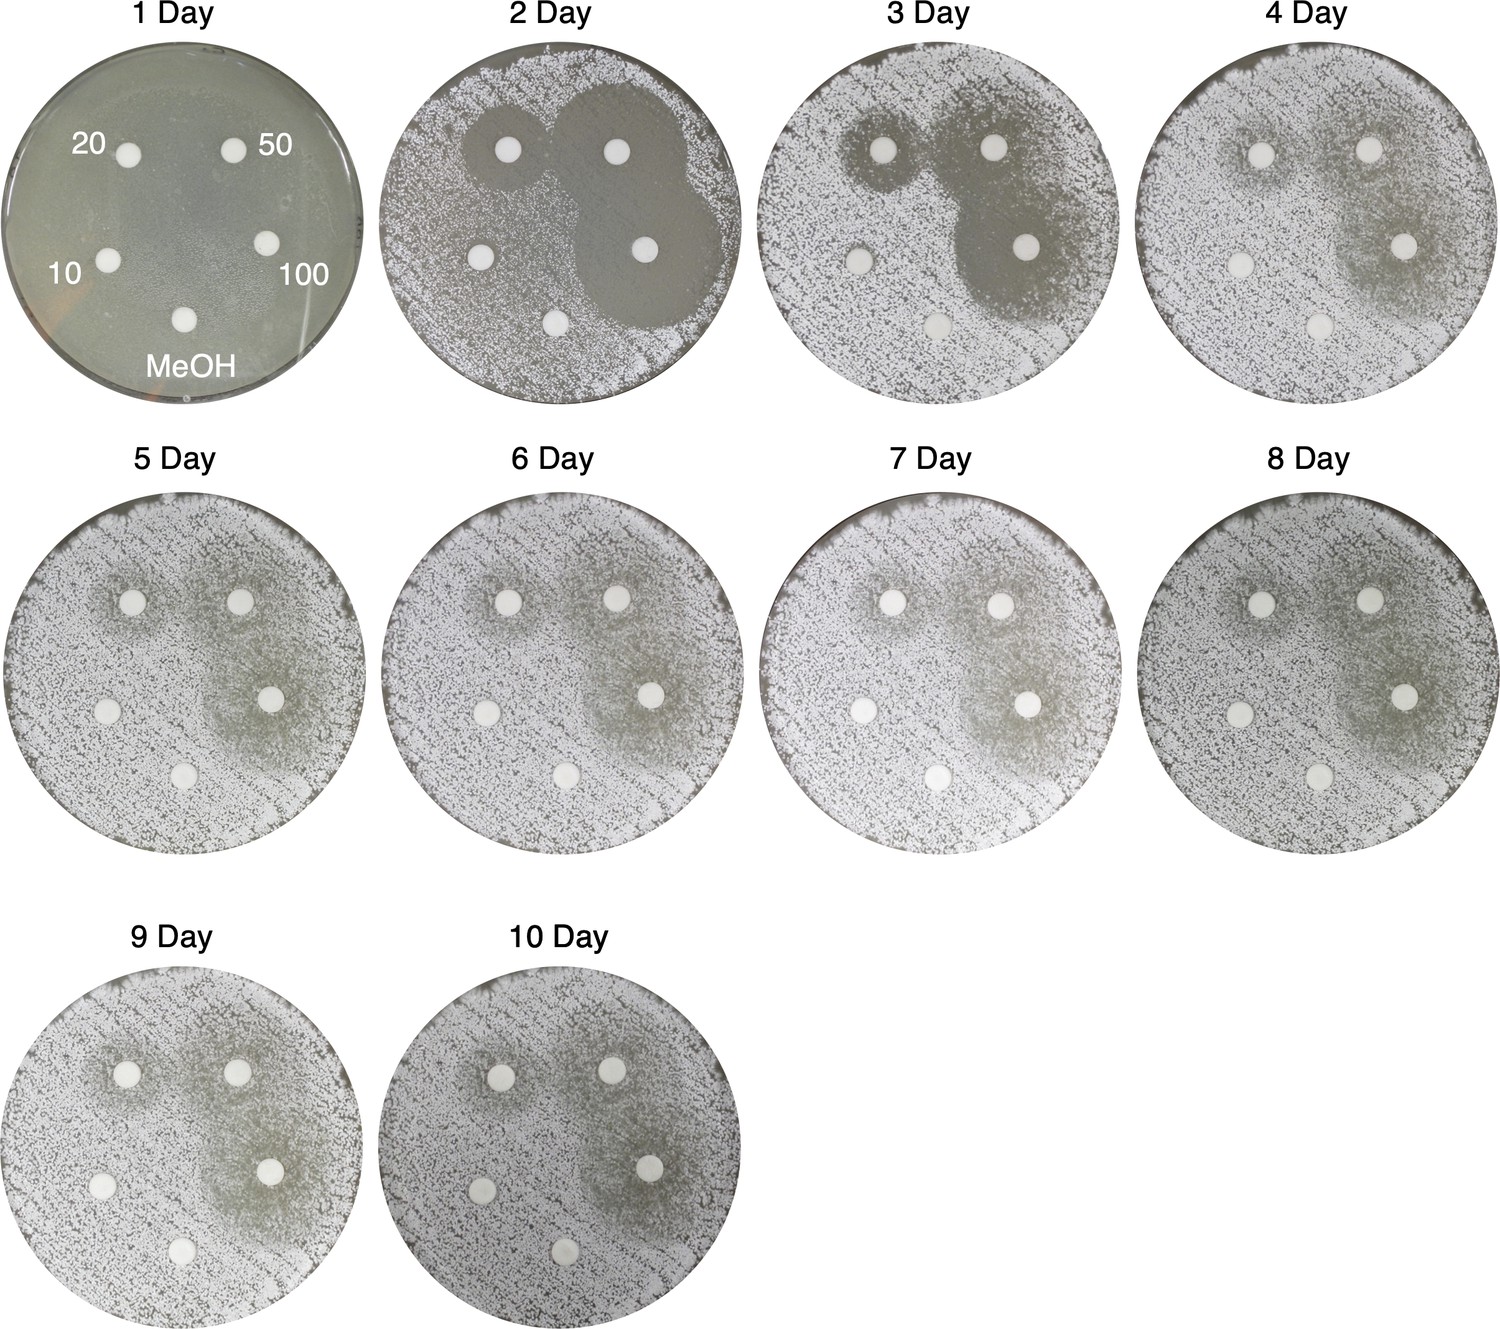
Time course of viscosin I disk diffusion assays against S. scabies 87–22 on Instant Potato Medium (IPM).
Viscosin I concentrations (μg/mL) are indicated, along with a methanol control.
Figure 6 with 3 supplements
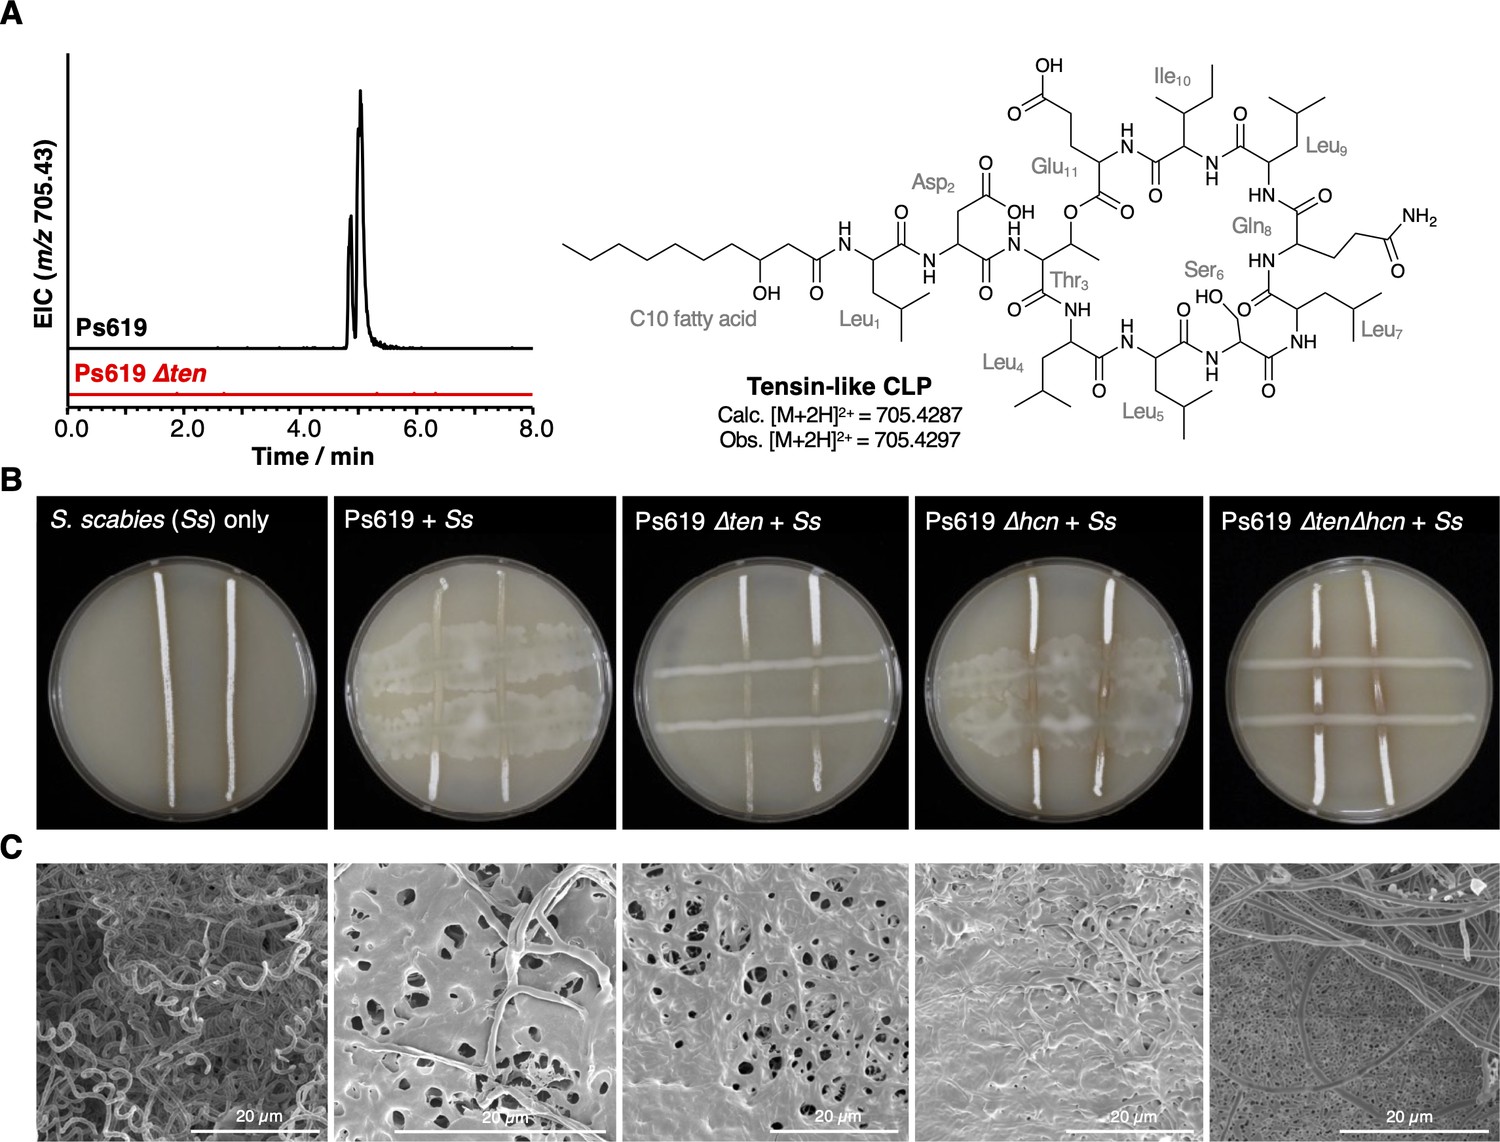
The role of the Ps619 cyclic lipopeptide (CLP) and hydrogen cyanide (HCN) gene clusters in S. scabies suppression.
(A) Predicted structure of the tensin-like molecule and liquid chromatography–tandem mass spectrometry (LC-MS) analysis of CLP production in wild-type (WT) Ps619 and a mutant (Ps619 ∆ten) with an in-frame deletion of nonribosomal peptide synthetase (NRPS) gene 02963 (see Figure 4—figure supplement 3 for biosynthetic gene cluster [BGC] information). (B) Cross-streak assays of Ps619 and associated mutants with S. scabies. See Figure 6—figure supplement 2A for assays with drier plates. (C) Cryo-scanning electron microscopy (Cryo-SEM) images of the interfacial region between the Ps619 strains and S. scabies. The order of images is identical to the cross-streaks in panel (B).
Figure 6—figure supplement 1
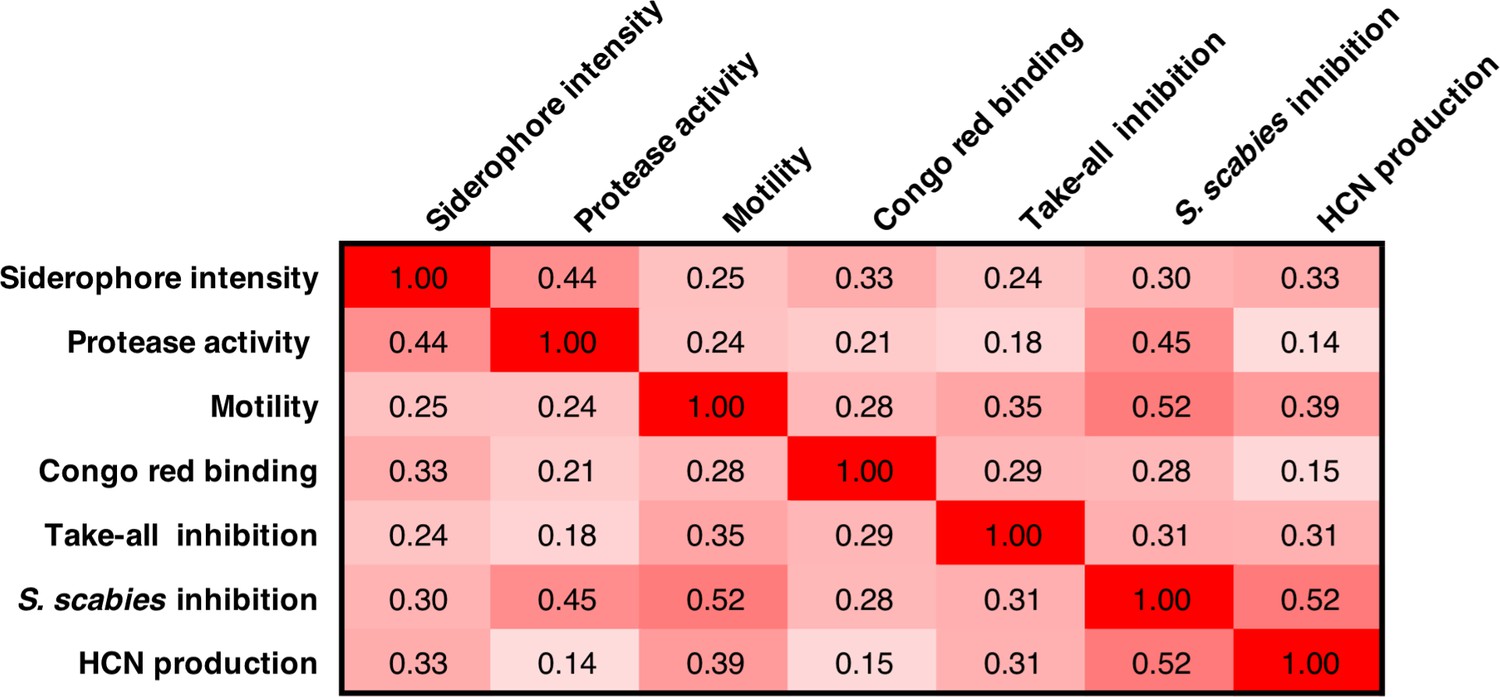
Pearson correlation coefficients for phenotypes across both sequenced and unsequenced isolates.
Isolates where one or more reliable phenotypes were not obtained (Supplementary file 1) were omitted from this correlation analysis.
Figure 6—figure supplement 2
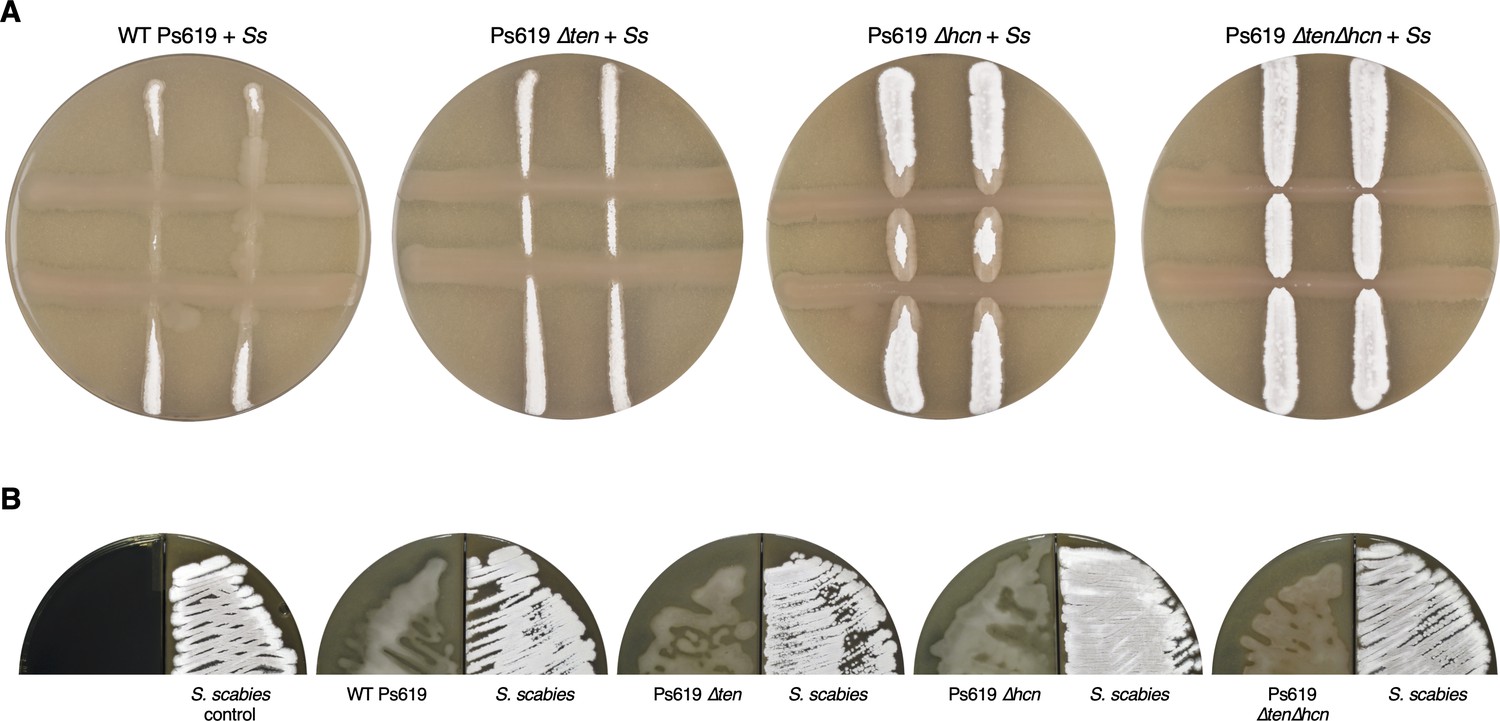
Effect of Ps619 on S. scabies growth and development.
(A) Cross-streak assays (7 days post-inoculation) of Ps619 and associated mutants with S. scabies on drier conditions than in Figure 6B. S. scabies (Ss) is streaked vertically first and then Ps619 is streaked horizontally. (B) Split plates (6 days post-inoculation) of S. scabies grown alongside Ps619 WT and mutant strains. The characteristic gray spore pigment of S. scabies (seen in control plate) is not present when grown alongside wild-type or Δten strains.
Figure 6—figure supplement 3
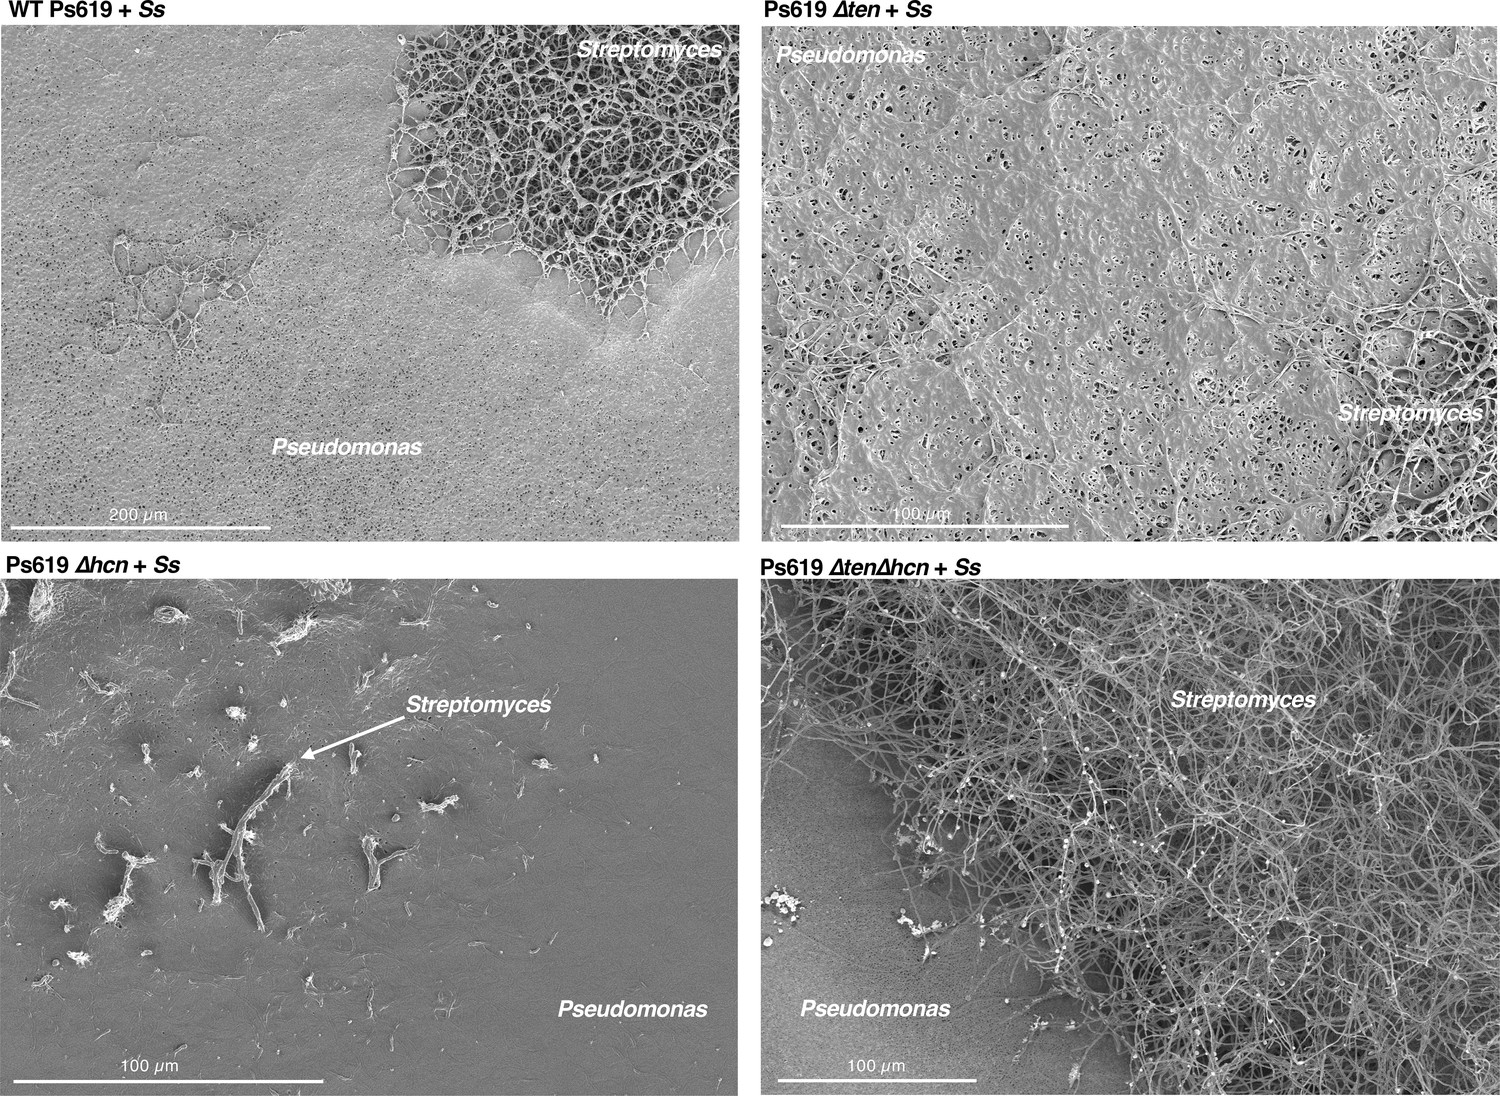
Further cryo-scanning electron microscopy (cryo-SEM) images of the interfacial region between the Ps619 strains and S. scabies (Ss) showing that a well-defined boundary only exists with the Ps619 ∆ten∆hcn strain (bottom right).
Figure 7 with 1 supplement
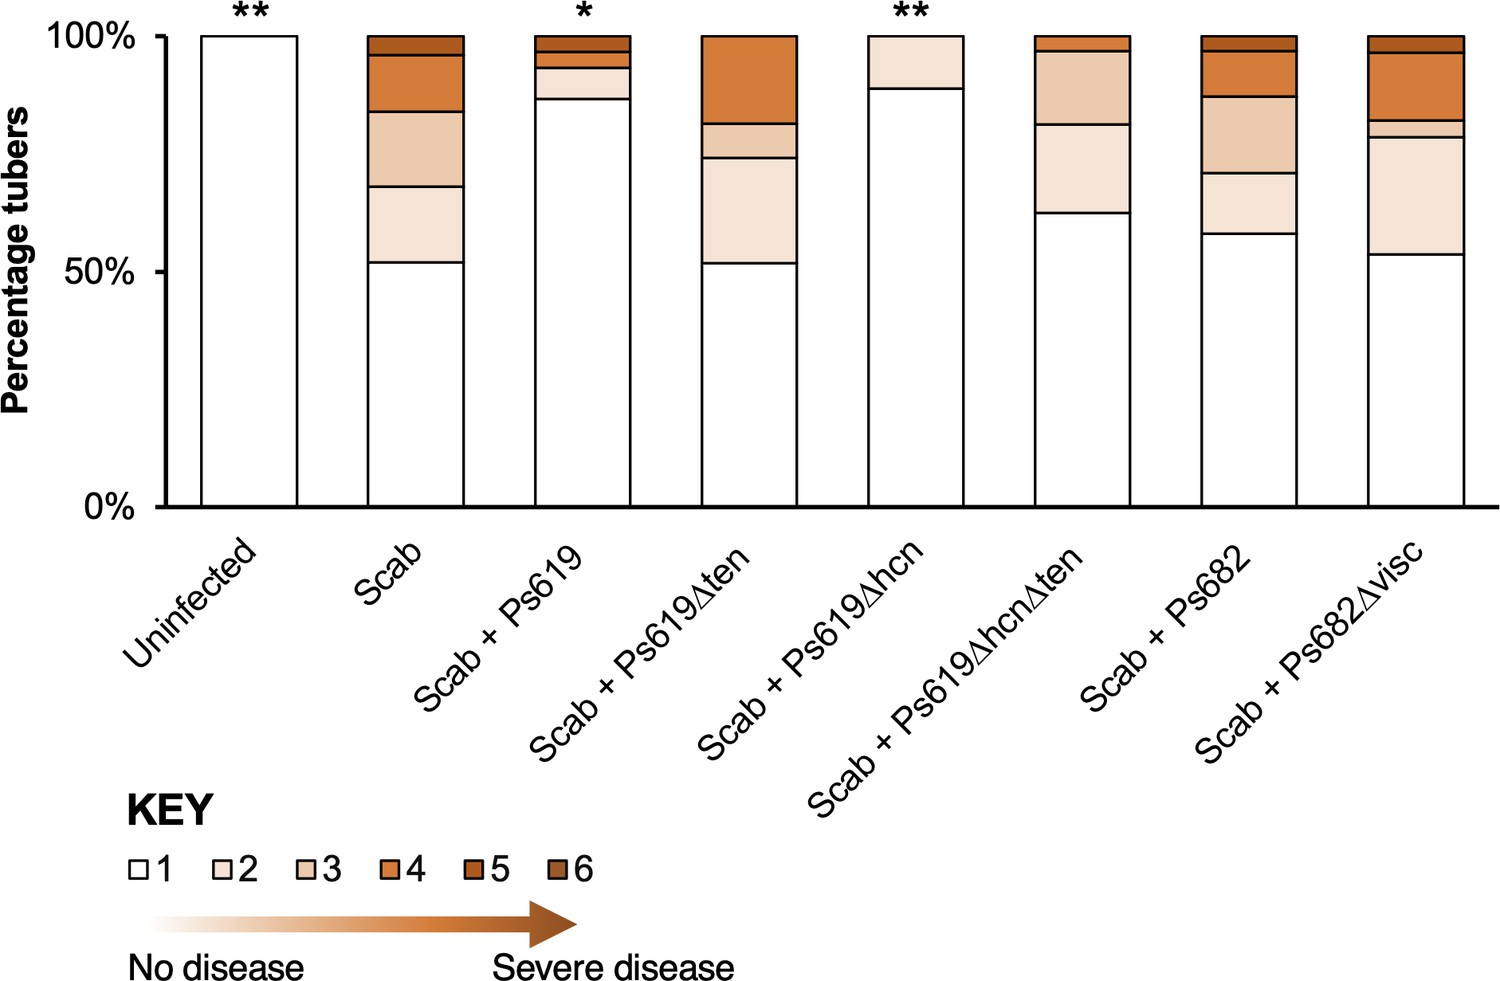
Potato scab biocontrol assay.
The bar chart shows the percentage of diseased tubers following infection with S. scabies (‘Scab’) along with treatment by Ps619, Ps682, and associated mutants. Tubers were scored using a disease severity index from 1 to 6 according to the method of Andrade et al., 2019. Statistical analyses were calculated by taking into account the average disease index of each plant (n = 4). p-Values were calculated using Dunnett’s multiple comparison test, and asterisks indicate *p<0.05, **0.01 as compared to scab treatment only. Results of a repeat biocontrol experiment and further statistical statistics are shown in Figure 7—figure supplement 1.
Figure 7—figure supplement 1
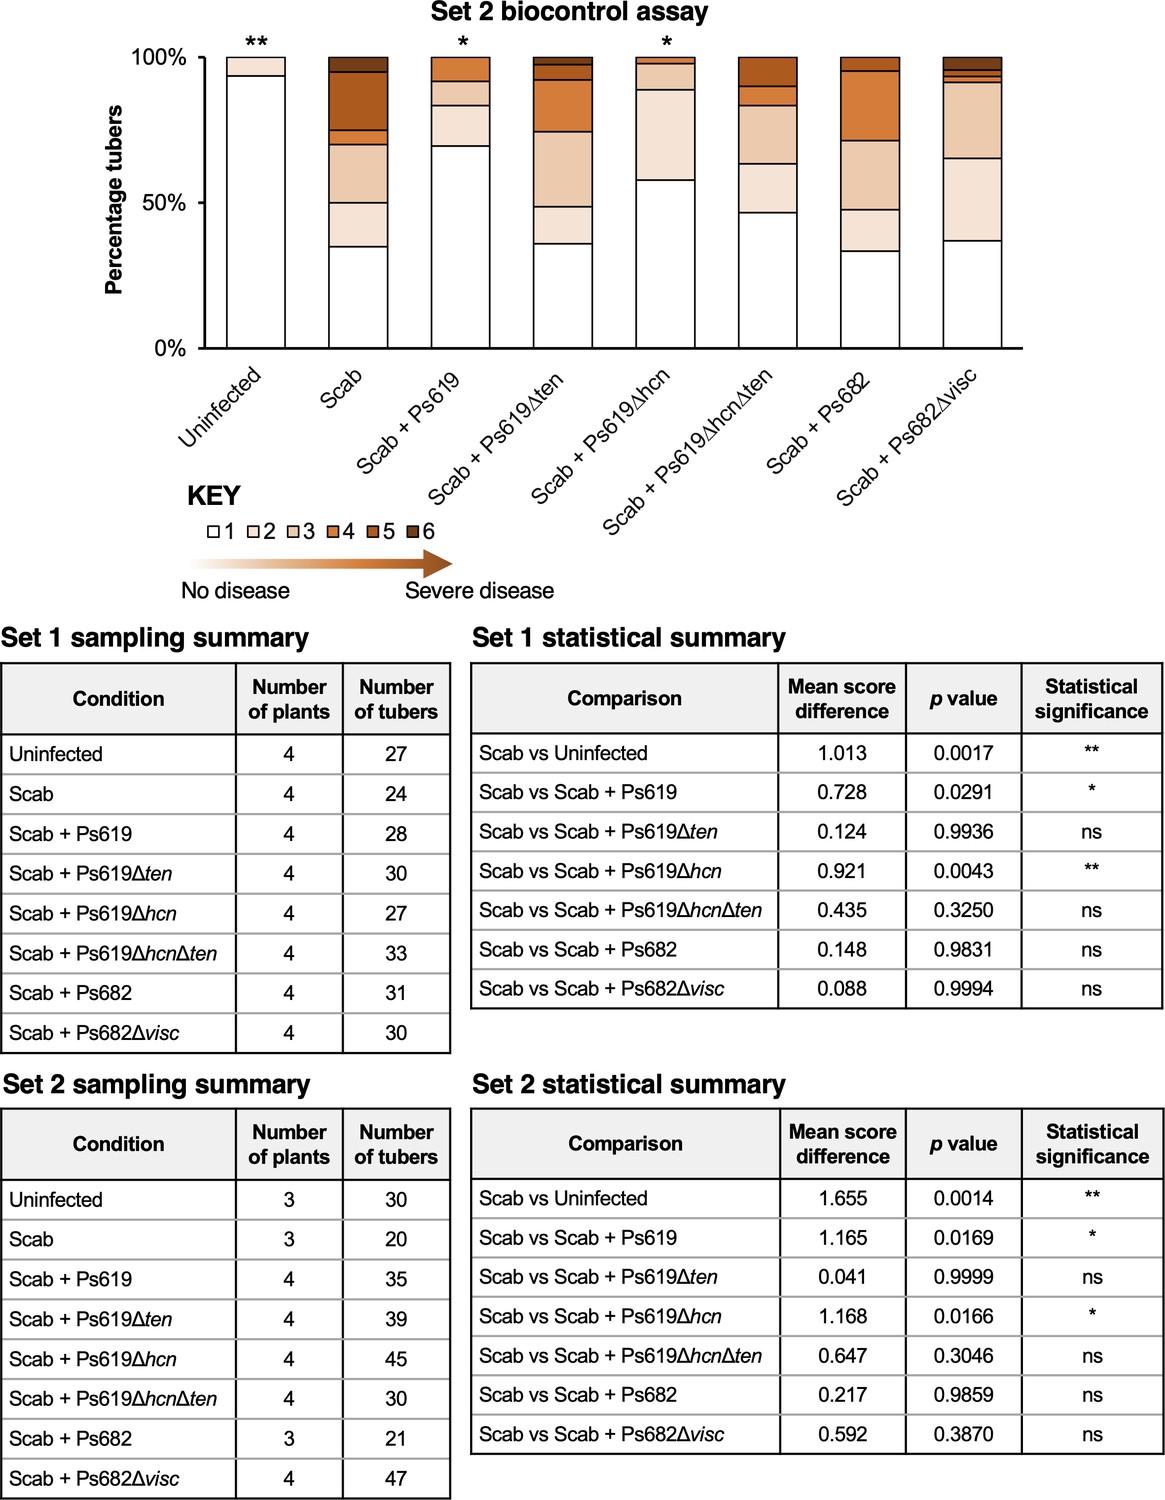
Results from set 2 of the potato scab biocontrol assay (set 1 data shown in Figure 7) alongside statistical summaries of the two sets of experiments.
This assay represents a full repeat of the set 1 experiment, which was started at a different time with a different set of plants. The bar chart shows the percentage of diseased tubers following infection with S. scabies (‘Scab’) along with treatment by Ps619, Ps682, and associated mutants. Tubers were scored using a disease severity index from 1 to 6 according to the method of Andrade et al., 2019. Statistical analyses were calculated by using the average disease index of each plant (n = 3 or 4). p-Values were calculated using Dunnett’s multiple comparison test, and asterisks indicate *p<0.05, **0.01 as compared to scab treatment only (ns, not significant).
Figure 8
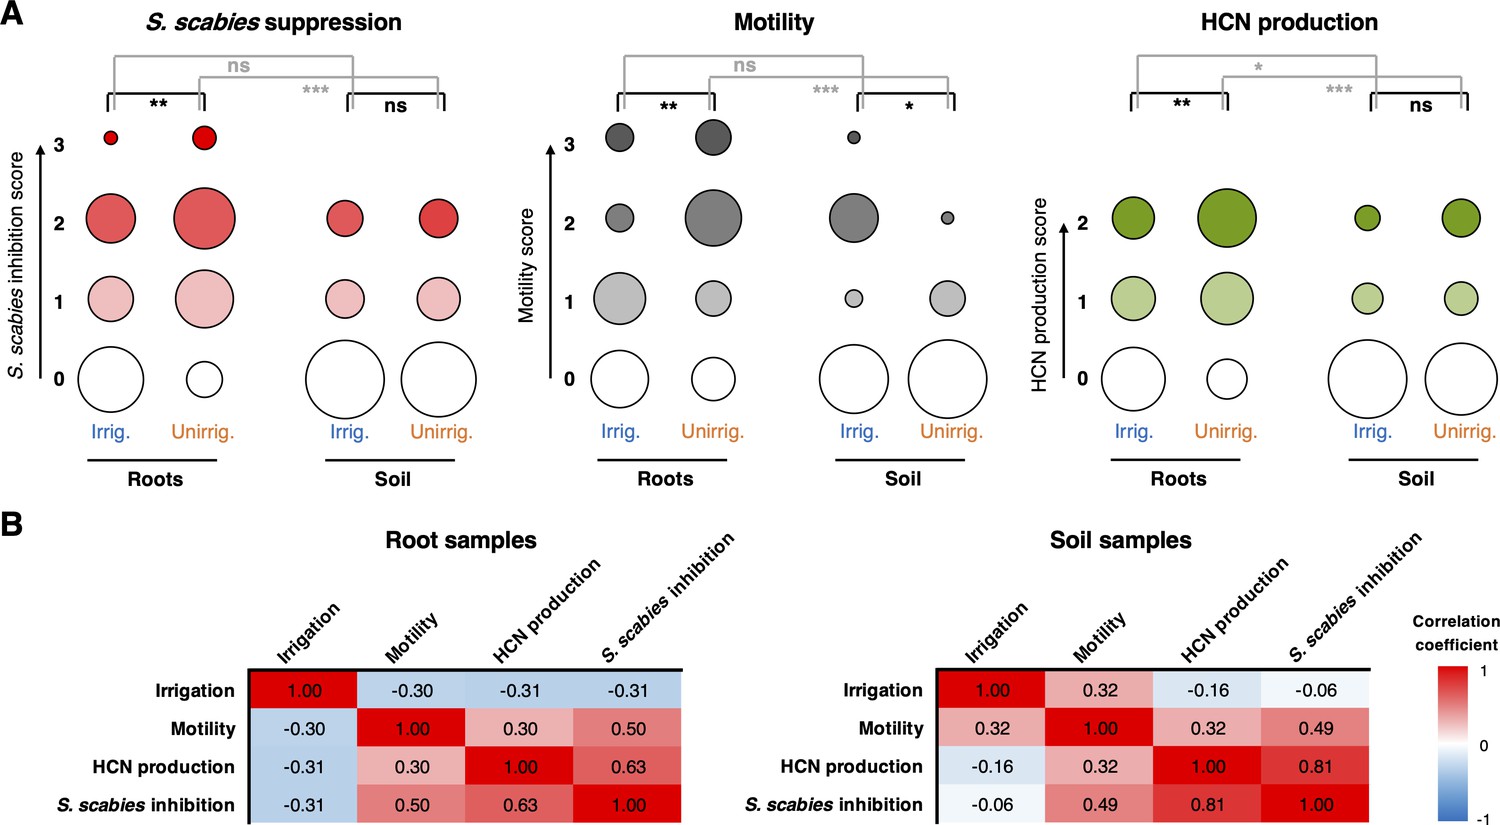
The effect of irrigation and environment (soil versus root) on the P. fluorescens population.
(A) Plots showing the proportion of strains exhibiting a particular phenotype from each environment (n = 48 for each condition). Hydrogen cyanide (HCN) production was scored on a scale of 0–2 based on a qualitative assessment of the color change in the Feigl–Anger assay. The size of each circle is proportional to the number of strains with a given phenotypic score. Statistical comparisons were carried out using two-tailed Mann–Whitney tests where ns (not significant) = p≥0.05, *p<0.05, ** p<0.01, ***p<0.001. (B) Pearson correlation scores for phenotypes from strains isolated from roots (n = 96) and soil (n = 96).
Appendix 1—figure 1

Comparison of characterized pyochelin-like biosynthetic gene cluster (BGCs) versus pyochelin-like BGCs identified in this work.
BGCs were retrieved from MIBiG (https://mibig.secondarymetabolites.org) (Kautsar et al., 2020) for pyochelin (BGC0000412), coelibactin (BGC0000324), and thiazostatin (BGC0001801). BGC homology was assessed using BiG-SCAPE (https://git.wageningenur.nl/medema-group/BiG-SCAPE/) (Navarro-Muñoz et al., 2020) in glocal mode with a cutoff of 0.75. Two figures show two distinct families.
Appendix 1—figure 2
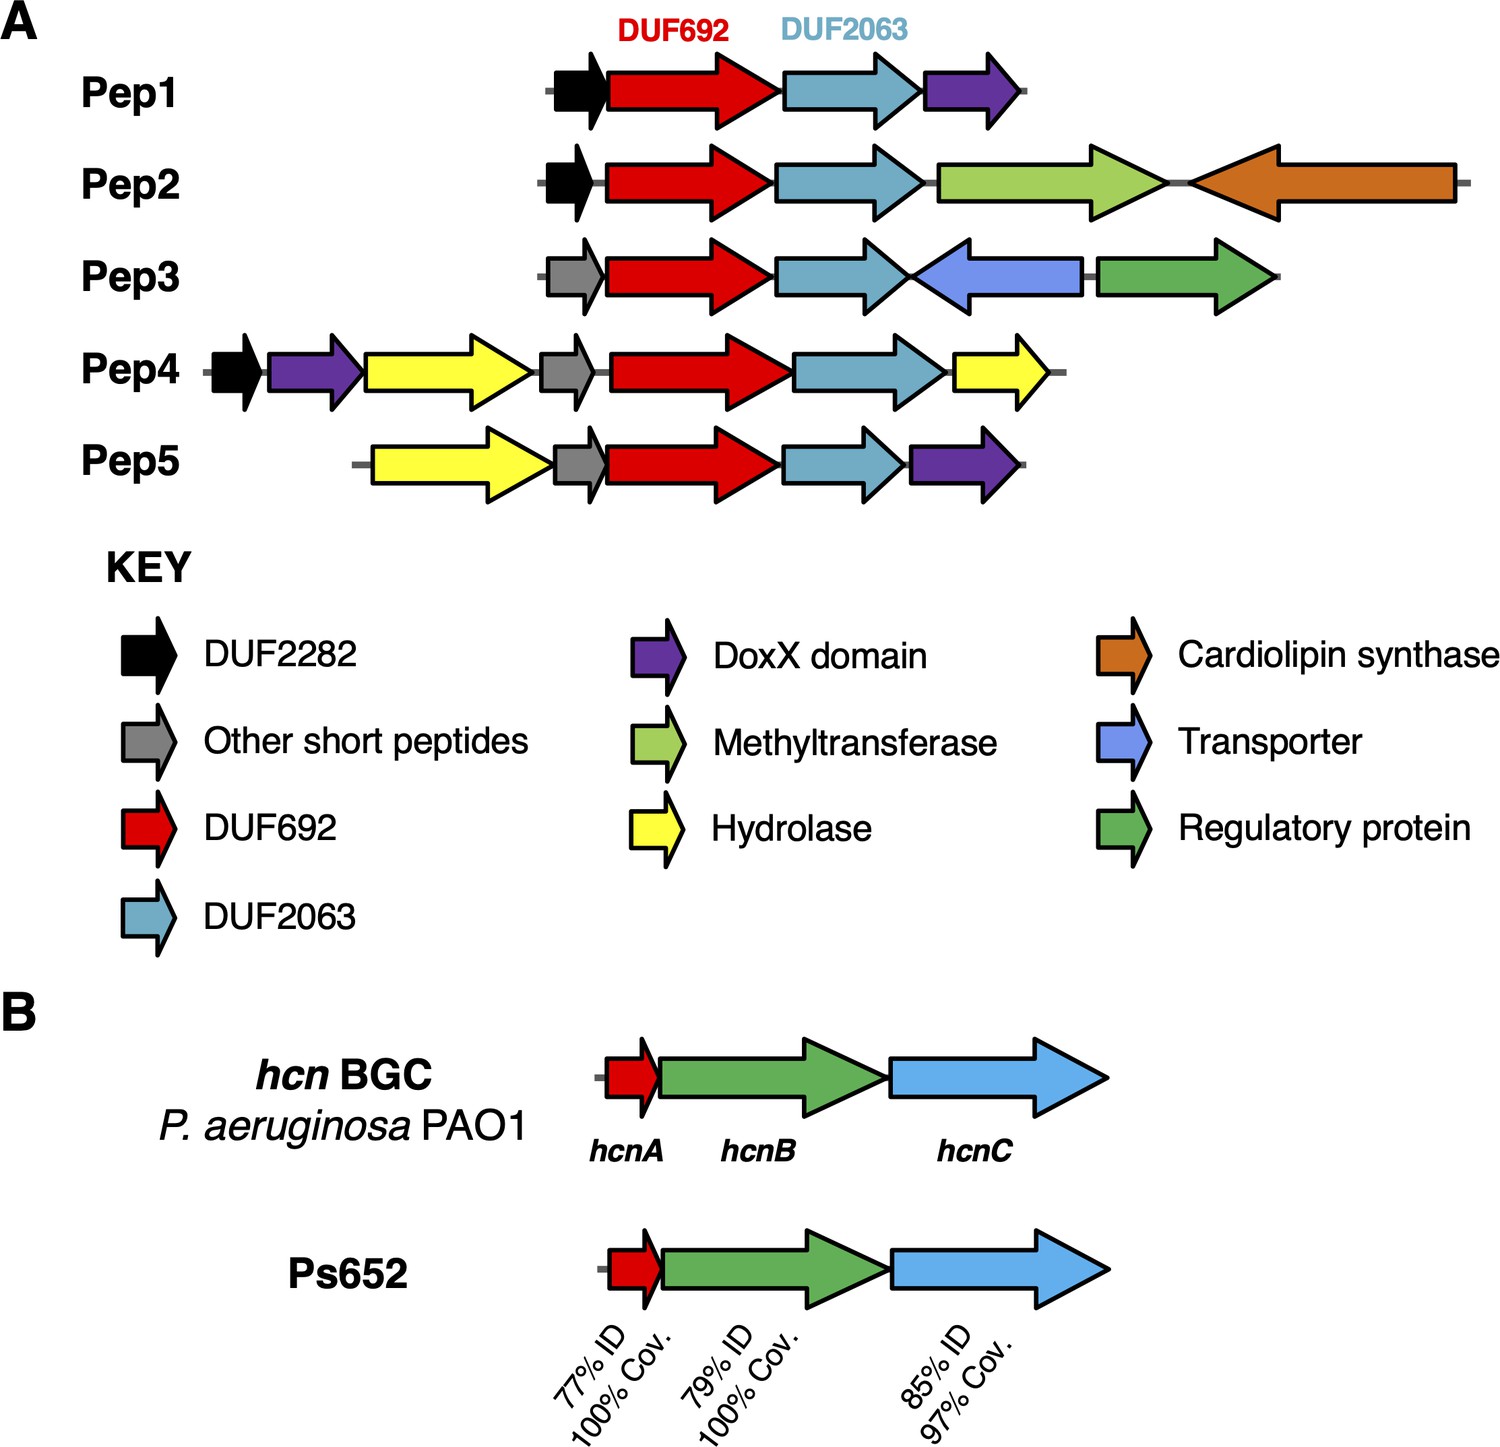
Biosynthetic gene clusters (BGCs) that correlate with S. scabies inhibition.
(A) Putative Pep BGCs. (B) Hydrogen cyanide (HCN) BGC compared to the characterized P. aeruginosa PAO1 BGC (Pessi and Haas, 2000).
Appendix 1—figure 3
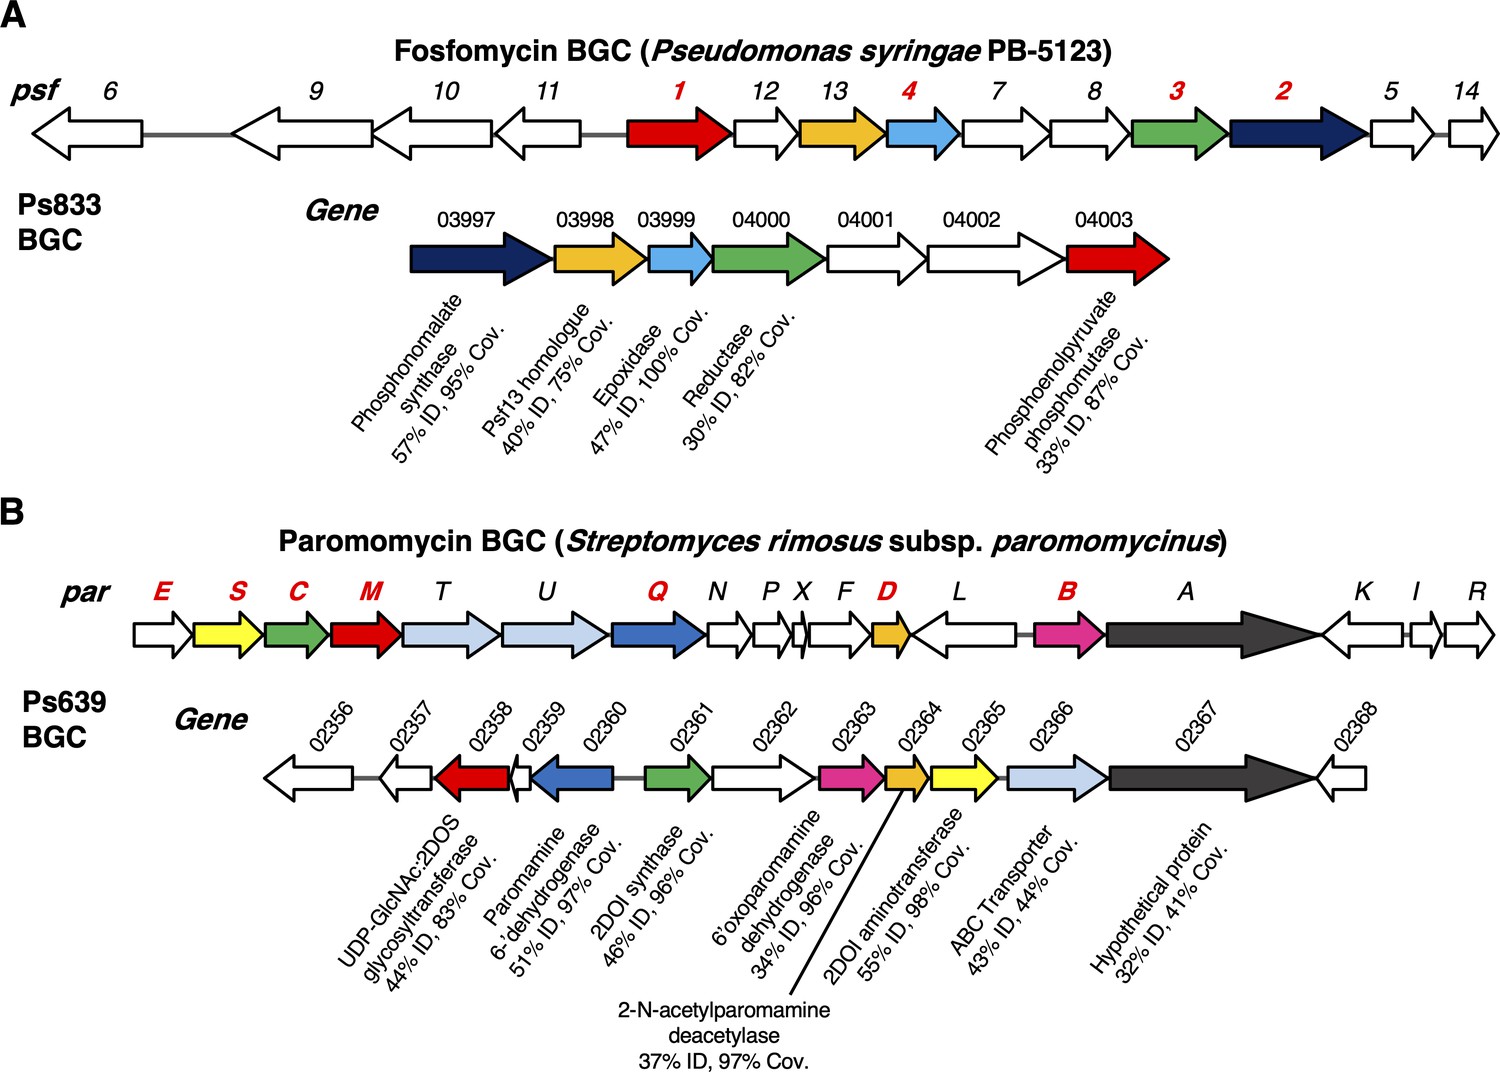
Examples of biosynthetic gene clusters (BGCs) not previously characterized in P. fluorescens.
(A) Fosfomycin-like BGC in strain Ps833. Comparison to the psf BGC in P. syringae PB-5123 is shown, where color coding represents homologous genes (identity and coverage values relate to encoded proteins). Gene numbers colored in red have been experimentally characterized and encode enzymes that catalyze key biosynthetic steps (Kim et al., 2012; Olivares et al., 2017). (B) Aminoglycoside-like BGC in strain Ps639. Comparison to the par BGC in S. rimosus is shown, where color coding represents homologous genes (identity and coverage values relate to encoded proteins). Gene numbers colored in red are predicted to be required for the biosynthesis of the minimal aminoglycoside, neamine (Kudo and Eguchi, 2009).
Appendix 1—figure 4
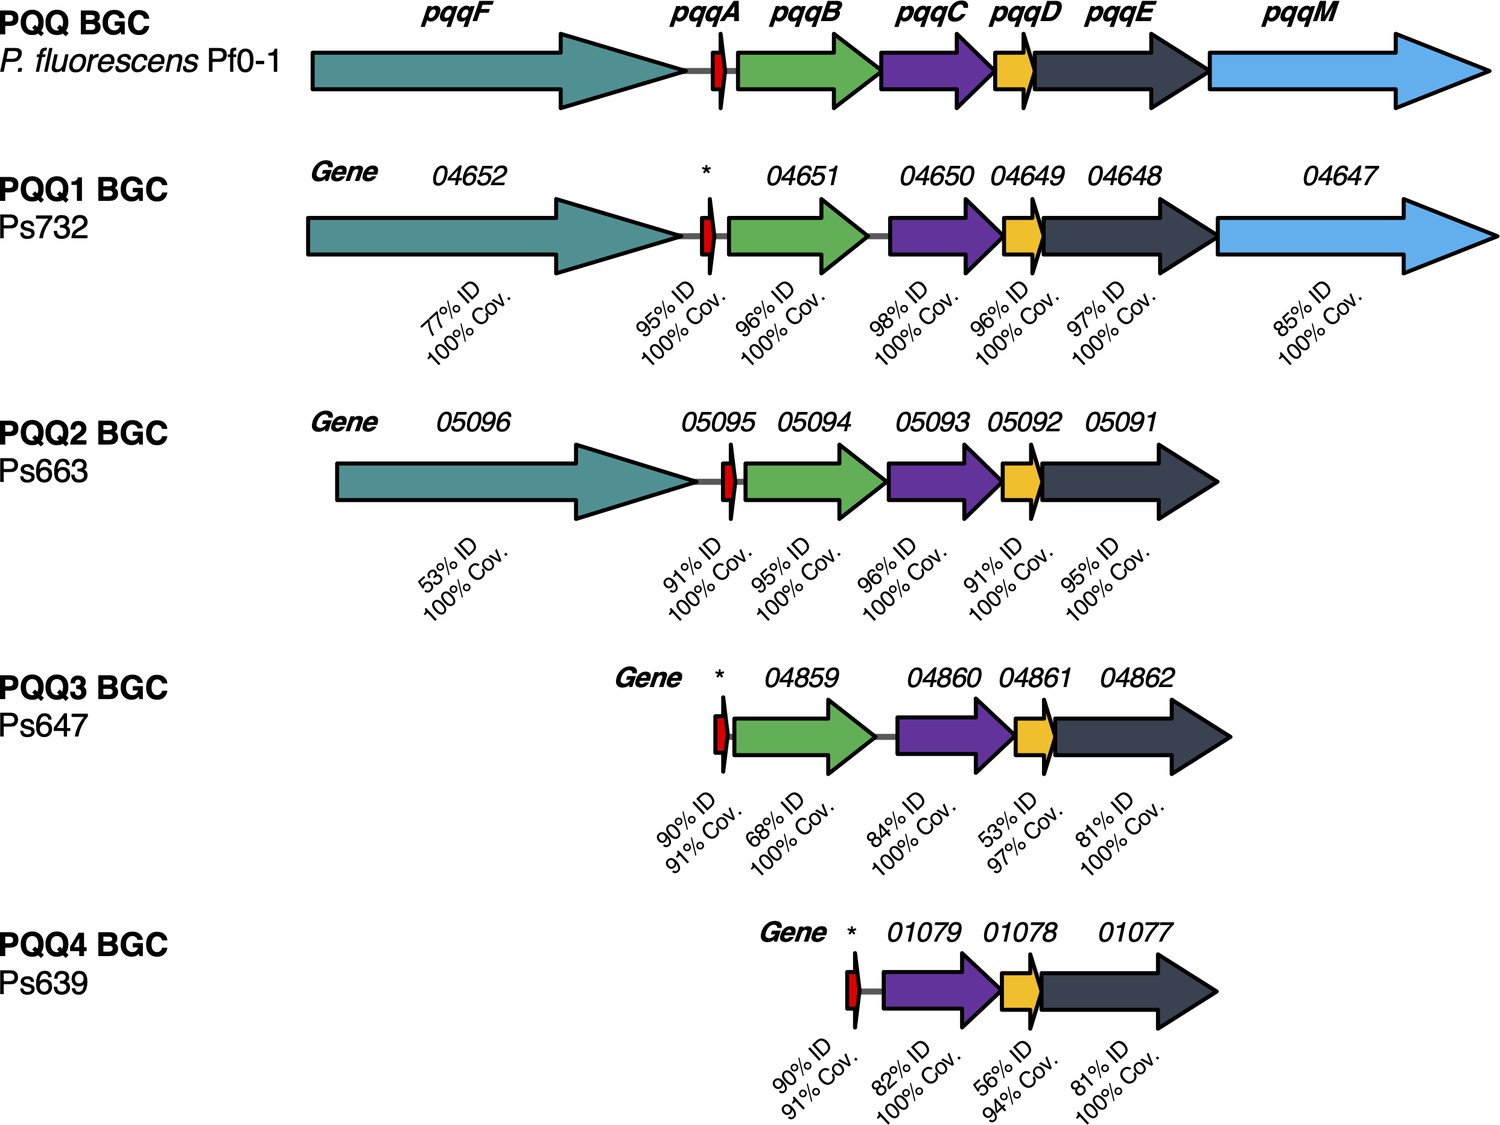
Different pyrroloquinoline quinone (PQQ) biosynthetic gene clusters (BGCs) identified in this study.
Comparison to the pqq BGC in P. fluorescens Pf0-1 is shown, where color coding represents homologous genes and % identity/coverage indicate how similar the encoded proteins are to the Pf0-1 PQQ proteins. *Gene not annotated but pqqA homologue identified by tblastn analysis.
Appendix 2—figure 1
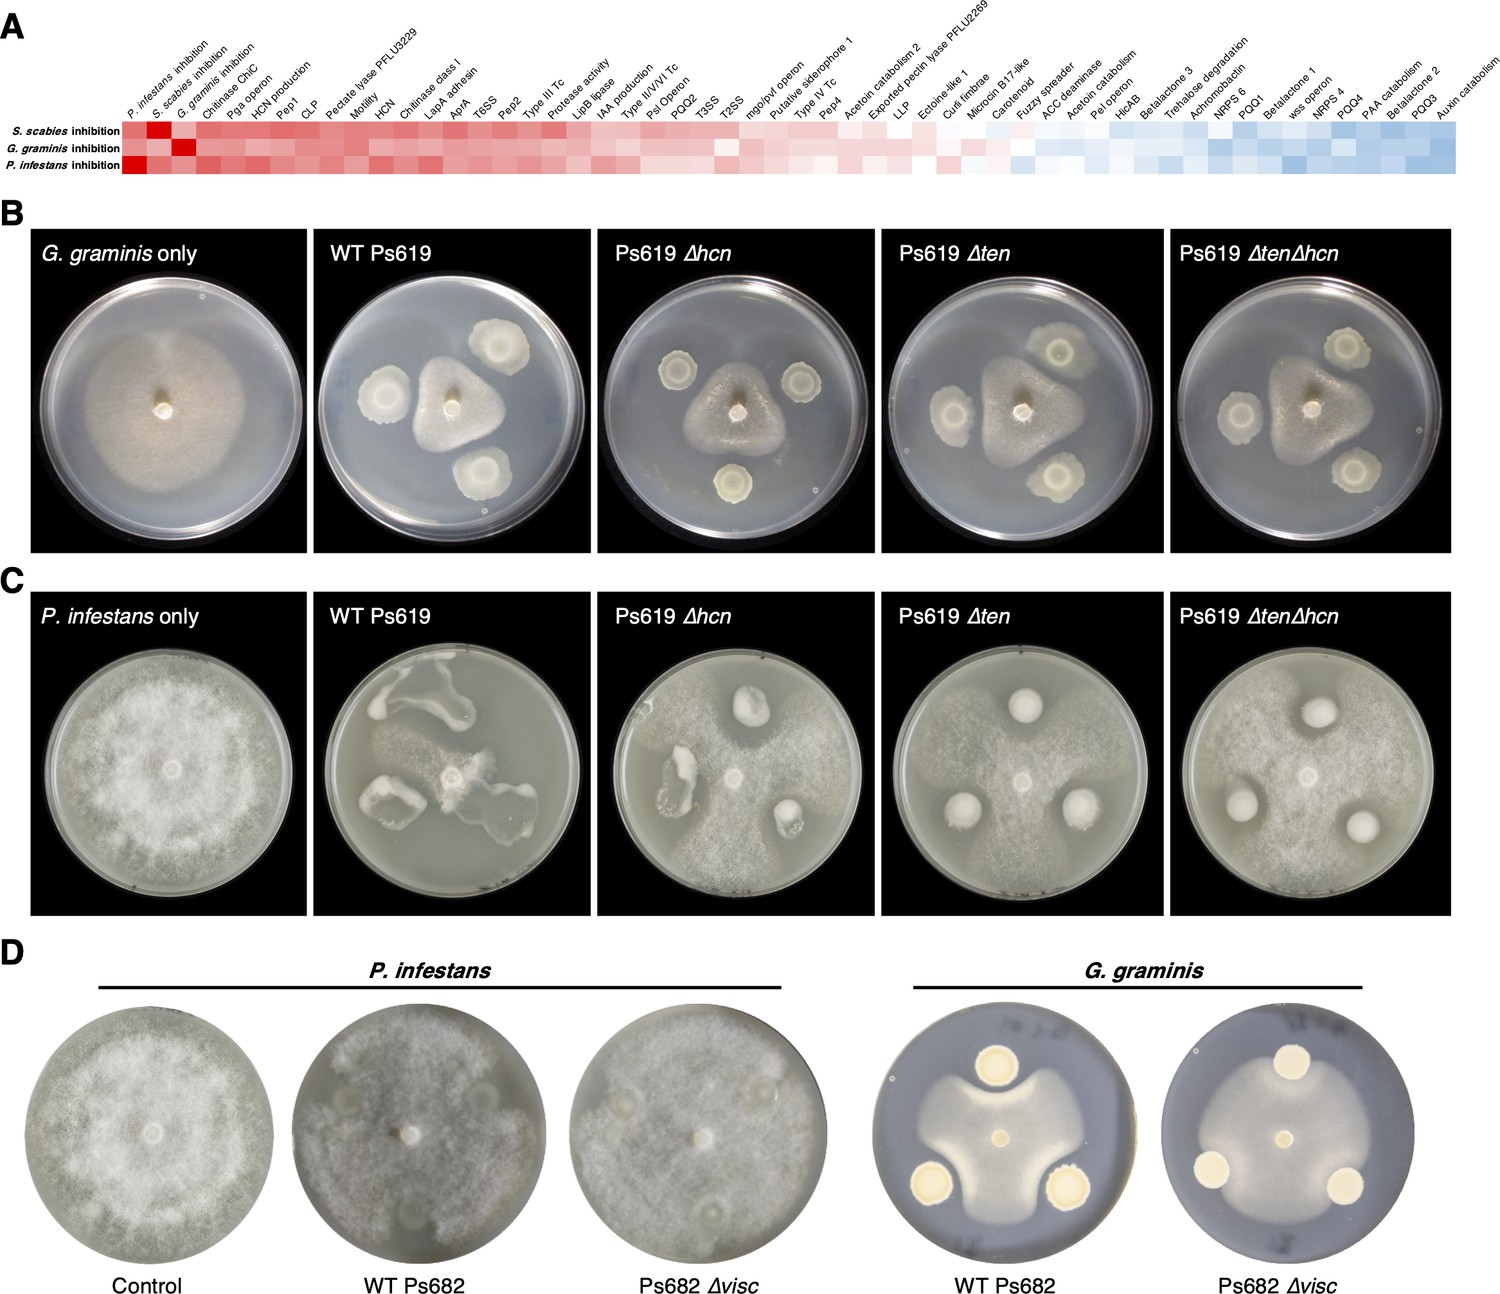
Genotypes and phenotypes that correlate with the suppression of different plant pathogens.
(A) Heatmap of Pearson correlation coefficients of pathogen inhibition versus genotypes and phenotypes (see Figure 3—figure supplement 1 for full correlations; the same color scale is used). (B) On-plate inhibition of G. graminis growth by wild-type (WT) and mutant Ps619 strains. (C) On-plate inhibition of P. infestans growth by WT and mutant Ps619 strains. (D) WT and mutant Ps682 activity towards P. infestans and G. graminis.
Tables
Key resources table
| Reagent type (species) or resource | Designation | Source or reference | Identifiers | Additional information |
|---|---|---|---|---|
| Strain, strain background(Pseudomonas spp.) | Ps | This paper | Ps616-Ps734 | 120 environmental Pseudomonas strains collected from RG Abrey Farms in February 2015 |
| Strain, strain background(Pseudomonas spp.) | Ps | This paper | Ps831-Ps950 | 120 environmental Pseudomonas strains collected from RG Abrey Farms in May 2015 |
| Strain, strain background(Pseudomonas spp.) | Ps | This paper | IR1-1-NS6-8 | 192 environmental Pseudomonas strains collected from RG Abrey Farms in June 2017 |
| Strain, strain background(Pseudomonas fluorescens SBW25) | WT | https://doi.org/10.1046/j.1365-2958.1996.391926.x (Rainey and Bailey, 1996) | SBW25 | Wild-type strain; viscosin producer |
| Strain, strain background(Pseudomonas sp.) | LMG 2338 | Belgian Coordinated Collections of Microorganisms (BCCM) | LMG 2338NCPPB 387 | Wild-type strain; WLIP producer (Mortishire-Smith et al., 1991) |
| Strain, strain background(Escherichia coli) | DH5α | Thermo Fisher Scientific | 18265017 | Competent cells for cloning |
| Strain, strain background(Streptomyces scabies) | 87-22 | https://doi.org/10.1094/Phyto-85-537 | 87-22 | Causative agent of potato scab |
| Strain, strain background(Phytophthora infestans) | 6-A1 | The Sainsbury Laboratory, UK | #2006-3920A(6-A1) | Causative agent of late blight |
| Strain, strain background(Gaeumannomyces graminis var. tritici) | Ggt NZ.66.12 | https://doi.org/10.1111/1462-2920.13038 | NZ.66.12 | Causative agent of take-all decline in wheat |
| Genetic reagent (Pseudomonas sp. Ps682) | Δvisc | This paper | PS682_04206 | In-frame deletion of PS682_04206 (VVN17163.1) in the viscosin-like BGC using allelic exchange |
| Genetic reagent (Pseudomonas sp. Ps682) | ::lux | This paper | luxCDABE | Introduction of the Aliivibrio fischeri luxCDABE cassette into the neutral att::Tn7 site of the Ps682 chromosome using the Tn7-based expression system (K.-H. Choi et al., 2005) |
| Genetic reagent (Pseudomonas sp. Ps682) | Δvisc::lux | This paper | PS682_04206luxCDABE | Introduction of the A. fischeri luxCDABE cassette into the neutral att::Tn7 site of the Ps682 Δvisc chromosome using the Tn7-based expression system (K.-H. Choi et al., 2005) |
| Genetic reagent (Pseudomonas sp. Ps619) | Δten | This paper | PS619_02963 | In-frame deletion of PS619_02963(VVM93793.1) in the tensin-like BGC using allelic exchange |
| Genetic reagent (Pseudomonas sp. Ps619) | Δhcn | This paper | PS619_05844 (hcnB)PS619_05845 (hcnC) | In-frame deletion of PS619_05844 (VVN46770.1) andPS619_05845(VVN46780.1) in the HCN BGC using allelic exchange |
| Genetic reagent (Pseudomonas sp. Ps619) | ΔtenΔhcn | This paper | PS619_02963PS619_05844 (hcnB)PS619_05845 (hcnC) | In-frame deletions of PS619_02963in the tensin-like BGC and PS619_05844 toPS619_05845in the HCN BGC using allelic exchange |
| Biological sample (Solanum tuberosum) | Potato seeds cv. Maris Piper | VCS Potatoes Ltd. | Seed potatoes used for potato scab infection assays | |
| Recombinant DNA reagent | pTS1 | https://doi.org/101038/ncomms15935 | pME3087 derivative containing a sacB counter-selection marker | |
| Recombinant DNA reagent | pTS1-Δviscosin | This paper | PS682_04206 | Plasmid for PS682_04206 deletion in viscosin-like BGC of Ps682 |
| Recombinant DNA reagent | pTS1-Δtensin | This paper | PS619_02963 | Plasmid for PS619_02963 deletion in tensin-like BGC of Ps619 |
| Recombinant DNA reagent | pTS1-Δ619HCN | This paper | PS619_05844PS619_05845 | Plasmid for deletion of PS619_05844 toPS619_05845in HCN BGC of Ps619 |
| Recombinant DNA reagent | pTNS2 | https://doi.org/10.1038/nmeth765 | Tn7 transposase expression plasmid | |
| Recombinant DNA reagent | pUC18-mini-Tn7T-Gm-lux | https://doi.org/10.1038/nmeth765 | luxCDABE | mini-Tn7 luxCDABE transcriptional fusion vector |
| Sequence-based reagent | PCR primers | This paper | Primers used in this study are listed in Supplementary file 2B | |
| Sequence-based reagent | F515/R806 | https://doi.org/10.1073/pnas.1000080107 | F515R806 | Primer pair for amplicon sequencing of the v4 region of 16S rRNA |
| Commercial assay or kit | FastDNA SPIN Kit for Soil | MP Biomedicals | 116560200 | DNA extraction from soil samples |
| Commercial assay or kit | GenElute Bacterial Genomic DNA Kit | Sigma-Aldrich | NA2110 | Genomic DNA extraction from isolated bacteria |
| Chemical compound, drug | Copper(II) ethyl acetoacetate | Sigma-Aldrich | 731714 | Reagent for Feigl–Anger assay of HCN production |
| Chemical compound, drug | 4,4'-Methylenebis N,N-dimethylaniline | Sigma-Aldrich | M44451 | Reagent for Feigl–Anger assay of HCN production |
| Software, algorithm | MaSuRCA | https://doi.org/10.1093/bioinformatics/btt476 | RRID:SCR_010691 Version 3.2.6 | Genome assembly; https://github.com/alekseyzimin/masurca |
| Software, algorithm | SPAdes | https://doi.org/10.1089/cmb.2012.0021 | RRID:SCR_000131 Version 3.6.2 | Genome assembly; https://github.com/ablab/spades |
| Software, algorithm | Prokka | https://doi.org/10.1093/bioinformatics/btu153 | RRID:SCR_014732 Version 1.14.0 | Genome annotation; https://github.com/tseemann/prokka |
| Software, algorithm | CheckM | https://doi.org/10.1101/gr.186072.114 | RRID:SCR_016646 Version 1.1.3 | Quality control assessment of bacterial genomes; https://ecogenomics.github.io/CheckM/ |
| Software, algorithm | antiSMASH | https://doi.org/10.1093/nar/gkz310 | Version 5.0 | Biosynthetic gene cluster detection and analysis; https://antismash.secondarymetabolites.org |
| Software, algorithm | MultiGeneBlast | https://doi.org/10.1093/molbev/mst025 | BLAST searches for gene clusters; http://multigeneblast.sourceforge.net/ | |
| Software, algorithm | MUSCLE | https://doi.org/10.1093/nar/gkh340 | Version 3.8.31 | Sequence alignment; https://www.drive5.com/muscle/ |
| Software, algorithm | RAxML | https://doi.org/10.1093/bioinformatics/btu033 | RRID:SCR_006086 Version 8.2.12 | Phylogenetic analysis; https://github.com/stamatak/standard-RAxML |
| Software, algorithm | Interactive Tree of Life (iTOL) | https://doi.org/10.1093/nar/gkab301 | Version 5 | Visualization of phylogenetic trees; https://itol.embl.de/ |
| Software, algorithm | Global Natural Product Social Molecular Networking (GNPS) | https://doi.org/10.1038/nbt.3597 | Networking of mass spectrometry data; https://gnps.ucsd.edu | |
| Software, algorithm | Cytoscape | https://doi.org/10.1101/gr.1239303 | Version 3.8.2 | Visualization of networks; https://cytoscape.org/ |
| Software, algorithm | TopSpin | Bruker | Version 3.5 | NMR data analysis |
| Software, algorithm | Mnova 14.0 | Mestrelab Research | Version 14.0 | NMR data analysis |
| Software, algorithm | R | The R foundation | Version 3.5.1 | Data analysis; https://www.r-project.org/ |
Additional files
-
Supplementary file 1
XLSX file containing genotypic and phenotypic data associated with Figures 2, 3 and 8.
- https://cdn.elifesciences.org/articles/71900/elife-71900-supp1-v2.xlsx
-
Supplementary file 2
DOCX file containing Supplementary files 2A–D.
- https://cdn.elifesciences.org/articles/71900/elife-71900-supp2-v2.docx
-
Transparent reporting form
- https://cdn.elifesciences.org/articles/71900/elife-71900-transrepform1-v2.docx
Download links
A two-part list of links to download the article, or parts of the article, in various formats.
Downloads (link to download the article as PDF)
Open citations (links to open the citations from this article in various online reference manager services)
Cite this article (links to download the citations from this article in formats compatible with various reference manager tools)
Pan-genome analysis identifies intersecting roles for Pseudomonas specialized metabolites in potato pathogen inhibition
eLife 10:e71900.
https://doi.org/10.7554/eLife.71900


