De novo synthesized polyunsaturated fatty acids operate as both host immunomodulators and nutrients for Mycobacterium tuberculosis
- Immunobiology of Infection Unit, Institut Pasteur, INSERM U1224, Université de Paris, France
- Université de Paris, Sorbonne Paris Cité, France
- Institut de Pharmacologie et de Biologie Structurale (IPBS), Université de Toulouse, CNRS-UPS UMR 5089, France
- Integrated Mycobacterial Pathogenomics Unit, Institut Pasteur, CNRS UMR 3525, Université de Paris, France
- Immunoregulation Unit, Institut Pasteur, INSERM U122, Université de Paris, France
- MetaboHUB-MetaToul, National Infrastructure of Metabolomics and Fluxomics, France
- I2MC, Université de Toulouse, INSERM, Université Toulouse III - Paul Sabatier (UPS), France
Figures
Figure 1 with 1 supplement
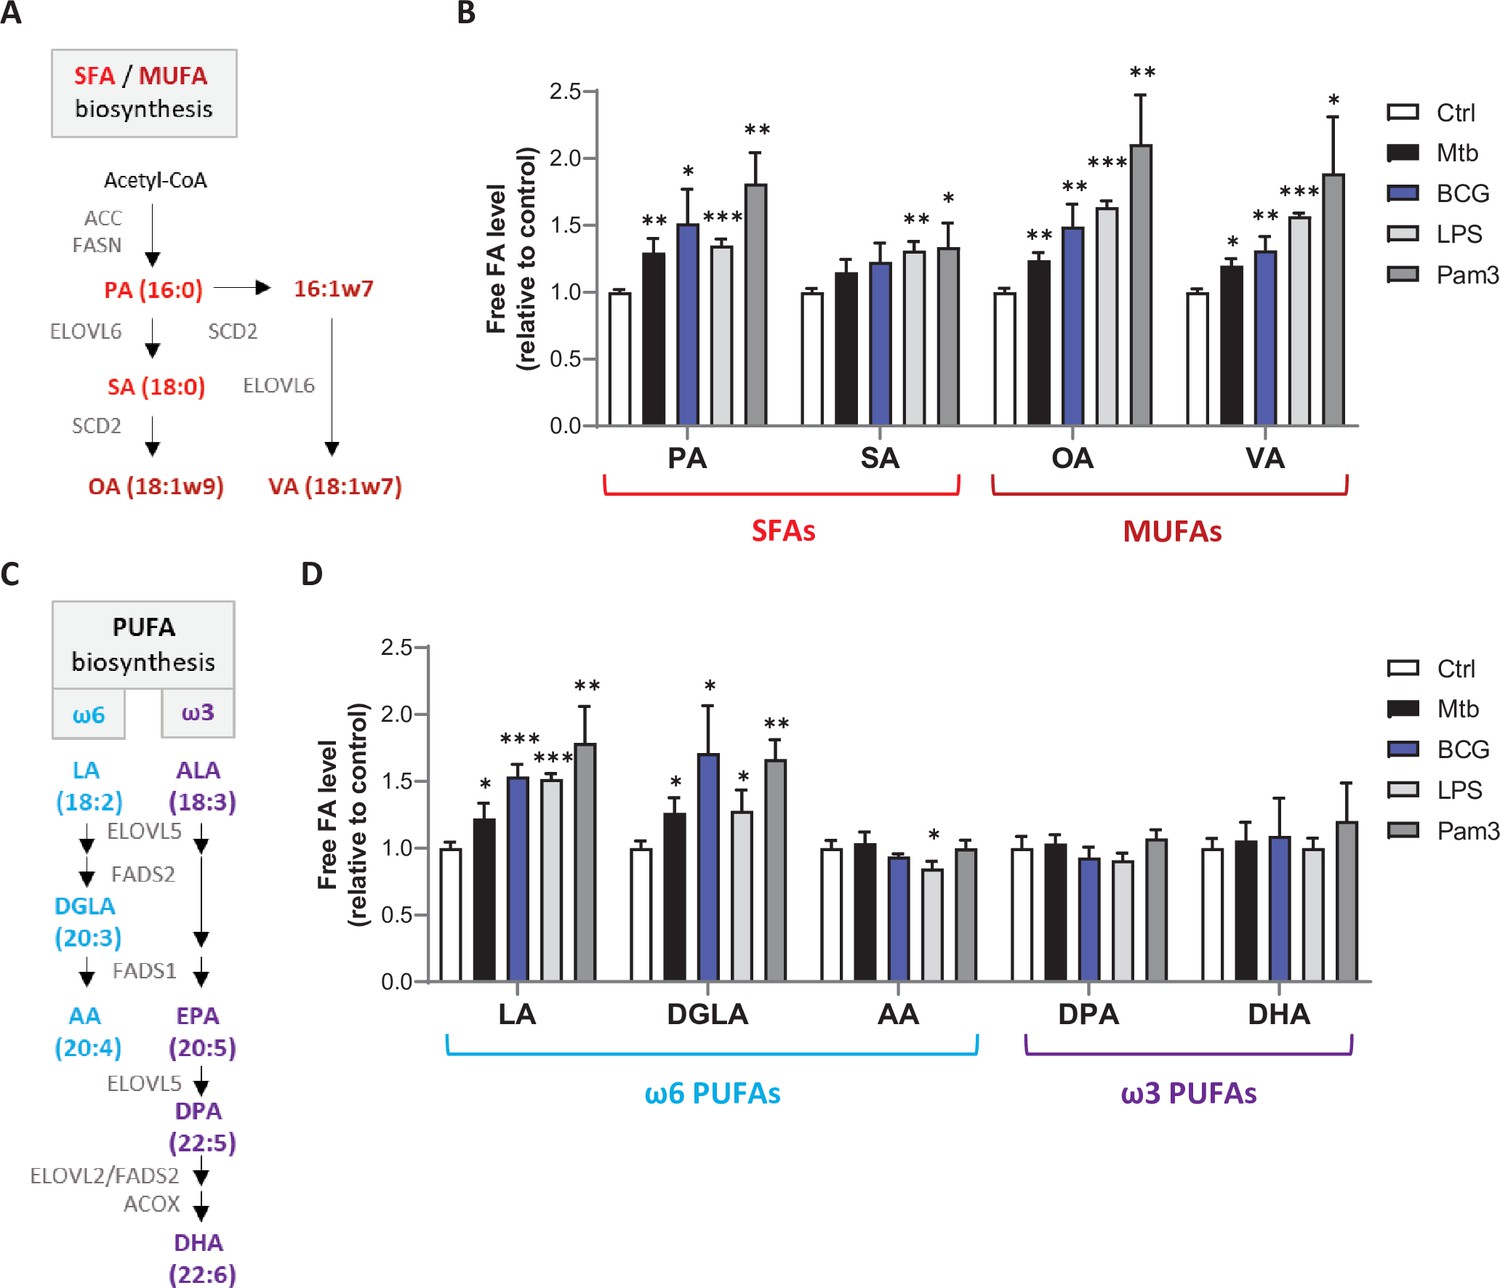
Mtb infection upregulates intracellular levels of free SFAs, MUFAs, and upstream PUFAs in host macrophages.
(A) Schematics of SFA and MUFA biosynthetic pathways. PA, palmitic acid; SA, stearic acid; OA, oleic acid; VA, vaccenic acid. (B) Intracellular levels of free SFAs and MUFAs in BMDMs infected with M. bovis BCG (BCG) or M. tuberculosis H37Rv (Mtb) at the same multiplicity of infection (MOI) of 2:1, or treated with LPS or Pam3Csk4 (Pam3), or left untreated (Ctrl) for 24 hr. FA levels were normalized to total DNA content and are shown as fold change relative to Ctrl. (C) Schematics of PUFA biosynthetic pathways. LA, linoleic acid; DGLA, dihomo-γ-LA; AA, arachidonic acid; ALA, α-linolenic acid; DPA, docosapentaenoic acid; DHA, docosahexaenoic acid. (D) Intracellular levels of free PUFAs in BMDMs treated as in (B). All data are means ± SD (n = 3) and are representative of two independent experiments. *p<0.05, **p<0.01, ***p<0.001, unpaired Student’s t-tests.
Figure 1—figure supplement 1
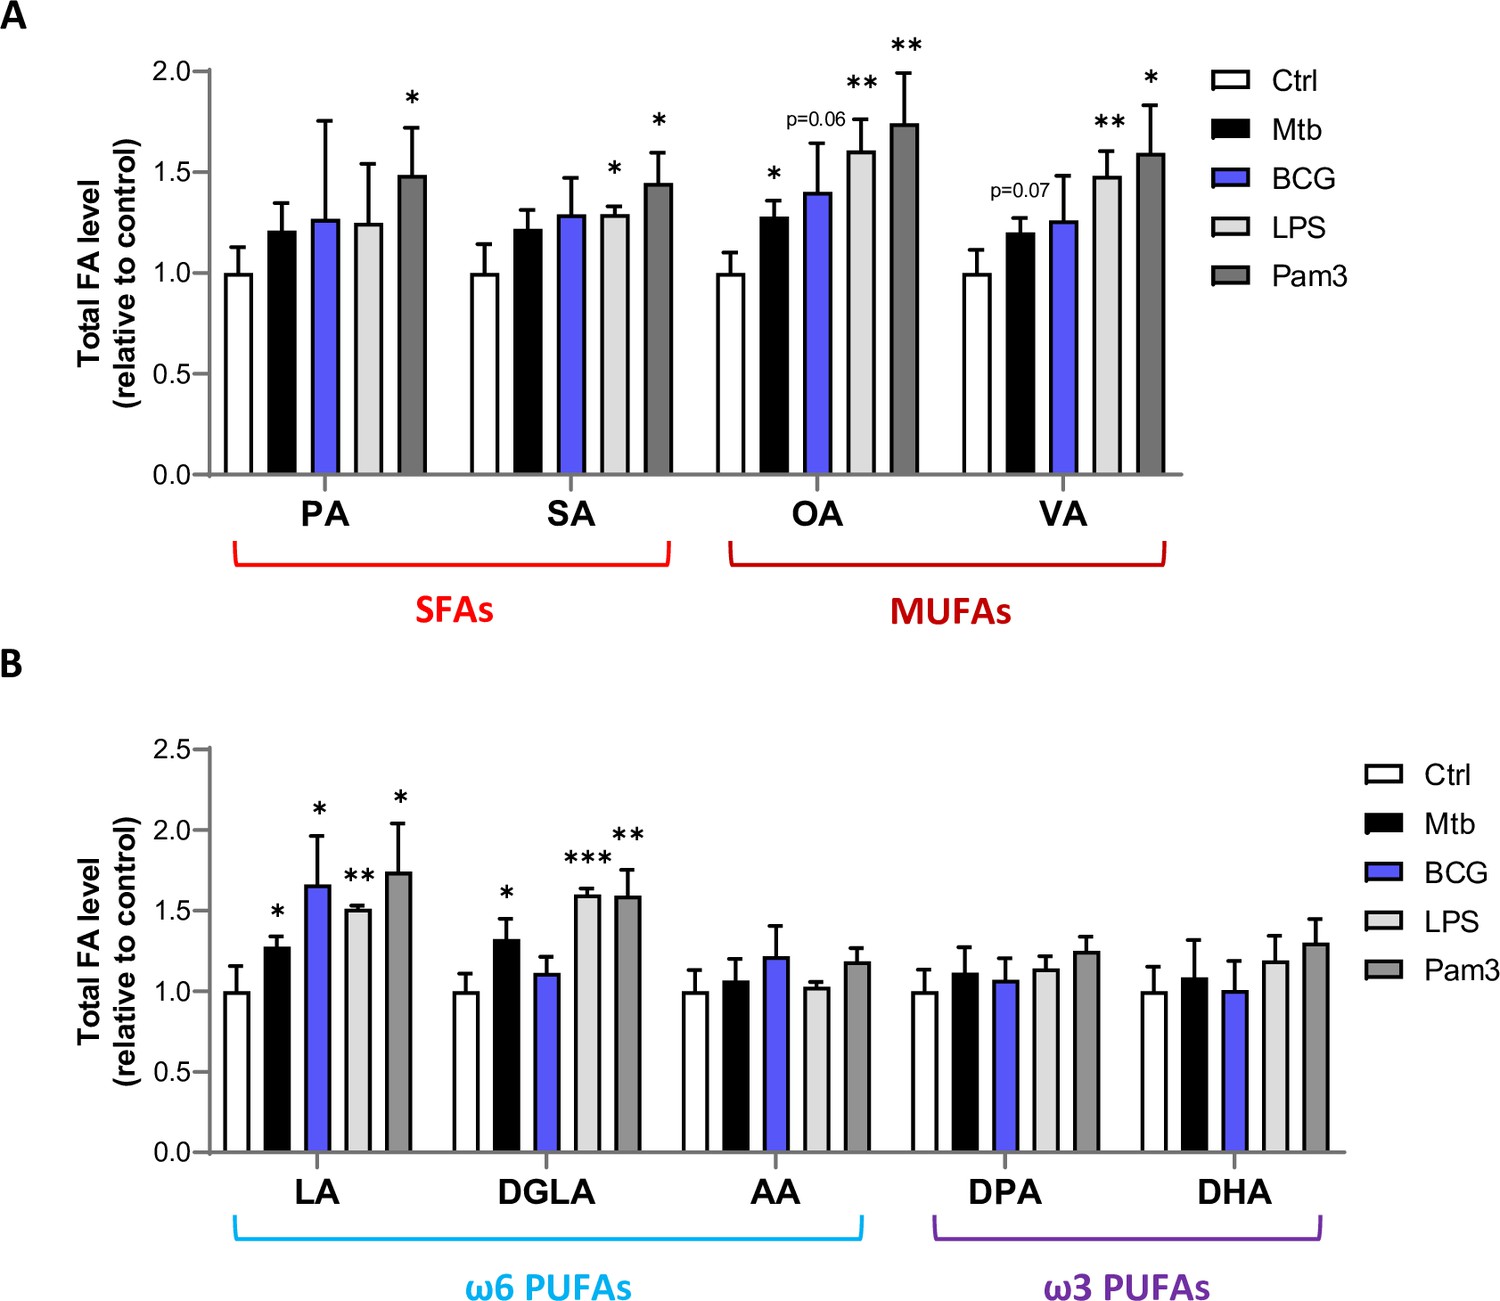
Mtb infection upregulates intracellular levels of total MUFAs and upstream PUFAs in host macrophages.
(A, B) Intracellular levels of total SFAs and MUFAs (A), or total PUFAs (B) in BMDMs treated as in Figure 1B. Data are means ± SD (n = 3) and are representative of two independent experiments. *p<0.05, **p<0.01, ***p<0.001, unpaired Student’s t-tests.
Figure 2
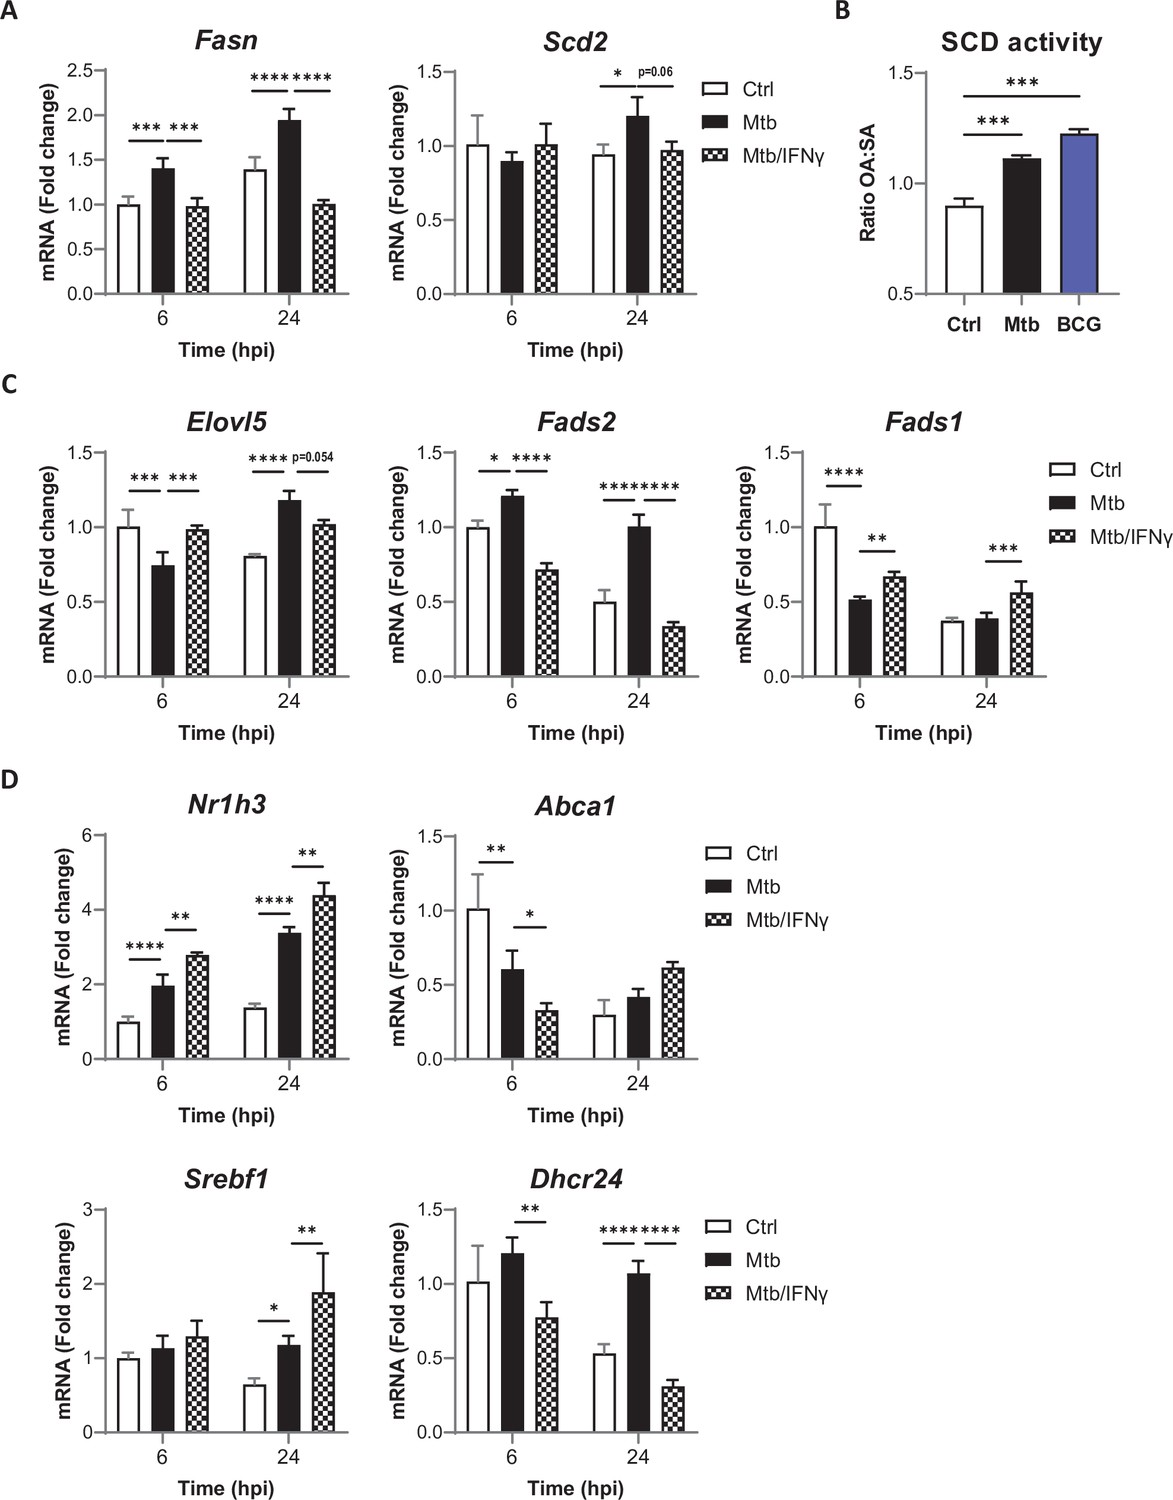
Mtb infection and IFNγ signaling cooperate to stop host PUFA biosynthesis.
(A) Relative mRNA expression of SFA/MUFA biosynthetic enzymes in BMDMs primed with IFNγ before infection with Mtb for the indicated times, as determined by qRT-PCR. (B) SCD activity in BMDMs, as estimated by the ratio of oleic acid (OA) to stearic acid (SA) levels, after 24 hr of infection with Mtb or BCG. (C–D) Relative mRNA expression of biosynthetic enzymes (C) or LXR/SREBP1 target genes (D) in BMDMs treated as in (A), as determined by qRT-PCR. All data are means ± SD (n = 3) and are representative of two independent experiments. *p<0.05, **p<0.01, ***p<0.001, ****p<0.0001, two-way ANOVA with Dunnett post-hoc multiple comparison tests (A, C, D) and unpaired Student’s t-tests (B).
Figure 3 with 1 supplement
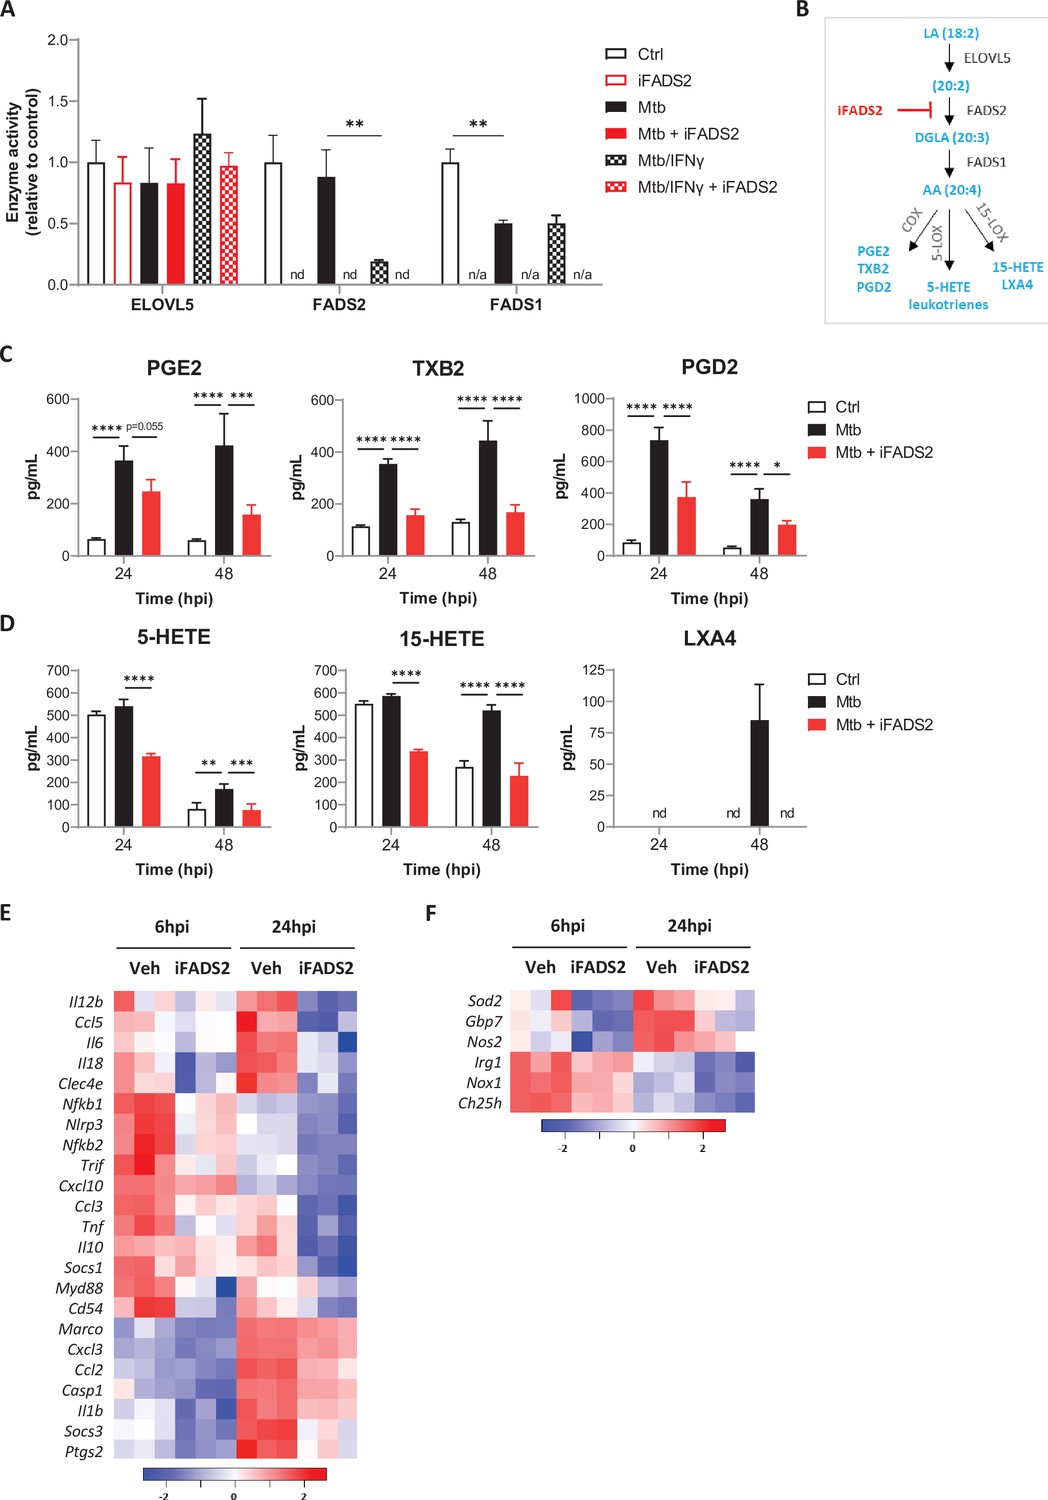
FADS2 inhibition impairs the effector functions of macrophages during Mtb infection.
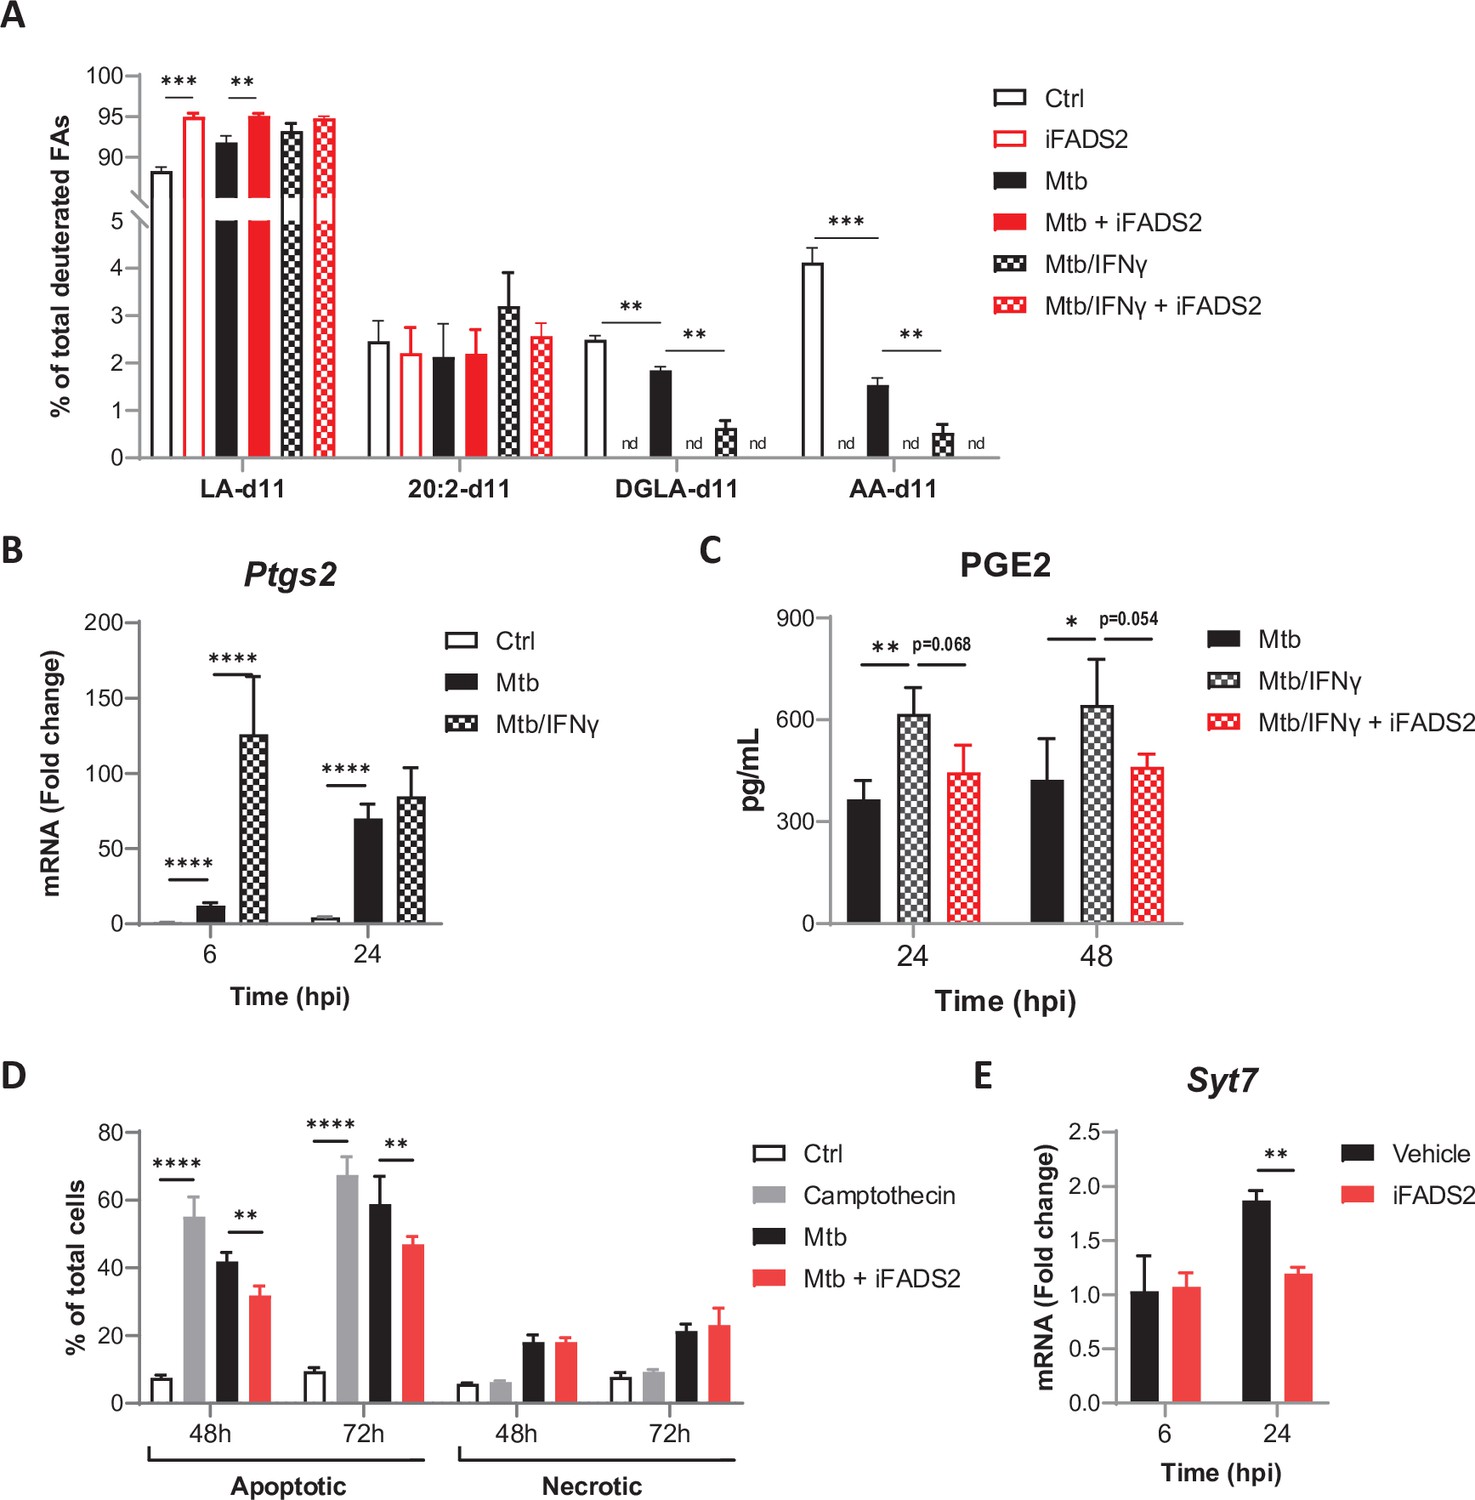
(A) Activities of PUFA biosynthetic enzymes in resting or IFNγ-primed BMDMs, either left untreated (Ctrl), or infected with Mtb and treated with a FADS2 inhibitor (iFADS2) or vehicle control, as determined by a conversion assay from 6 to 24 hr post infection using the ω6 precursor LA-d11. Enzyme activities were estimated with the ratio of deuterated fatty acid product to substrate levels and are shown as fold change relative to Ctrl. nd, product not detected; n/a, not applicable (substrate and product not detected). (B) Schematics of biosynthetic pathways of arachidonic acid (AA)-derived eicosanoids. COX, cyclooxygenase; LOX, lipoxygenase; PG, prostaglandin; TX, thromboxane; HETE, hydroxyeicosatetraenoic acid; LX, lipoxin. (C, D) Secreted levels of COX- (C) and LOX-derived (D) metabolites of AA by BMDMs either uninfected (Ctrl) or infected with Mtb, and treated with iFADS2 or vehicle control for 24 or 48 hr. Data in (A), (C), and (D) are means ± SD (n = 3), *p<0.05, **p<0.01, ***p<0.001, ****p<0.0001, unpaired Student’s t-tests (A) and two-way ANOVA with Dunnett post-hoc multiple comparison tests (C, D). (E, F) Heatmap of mRNA expression levels of inflammatory (E) and antimicrobial (F) genes determined by NanoString analysis of BMDMs treated as in (C) for 6 or 24 hr. Shown are genes that were significantly downregulated by iFADS2 treatment at 6 and/or 24 hr (fold change of at least 1.15 and FDR < 0.05, two-way ANOVA with Benjamini−Hochberg adjustment for multiple comparison). Source data are available in Figure 3—source data 1.
-
Figure 3—source data 1
Complete list of normalized mRNA levels in BMDMs, either noninfected (NI Ctrl) or infected with Mtb, and treated with iFADS2 (Mtb iFADS2) or vehicle control (Mtb Veh), as determined by NanoString analysis.
- https://cdn.elifesciences.org/articles/71946/elife-71946-fig3-data1-v2.xlsx
Figure 3—figure supplement 1
Effects of IFNγ on PUFA biosynthesis by Mtb-infected BMDMs.
(A) Intracellular levels of deuterated ω6 PUFAs in BMDMs treated as in Figure 3A, relative to total deuterated FA levels. (B) Relative mRNA expression of Ptgs2 in BMDMs primed with IFNγ before infection with Mtb, as determined by qRT-PCR. (C) Secreted levels of PGE2 by resting or IFNγ-primed BMDMs, treated with iFADS2 or vehicle control, and infected with Mtb for the indicated time. (D) Proportion of apoptotic or necrotic cells among BMDMs either left untreated (Ctrl), treated with camptothecin, or infected with Mtb and treated with iFADS2 or vehicle control for the indicated time, as estimated by flow cytometry. (E) Relative mRNA expression of Syt7 in Mtb-infected BMDMs treated as in Figure 3C, as determined by qRT-PCR. Data are means ± SD (n = 3), *p<0.05, **p<0.01, ***p<0.001, ****p<0.0001, unpaired Student’s t-tests (A) or two-way ANOVA with Dunnett (B, C) or Bonferroni (D, E) post-hoc multiple comparison tests.
Figure 4 with 1 supplement
Inhibiting FADS2 does not impact Mtb growth in macrophages nor mice.
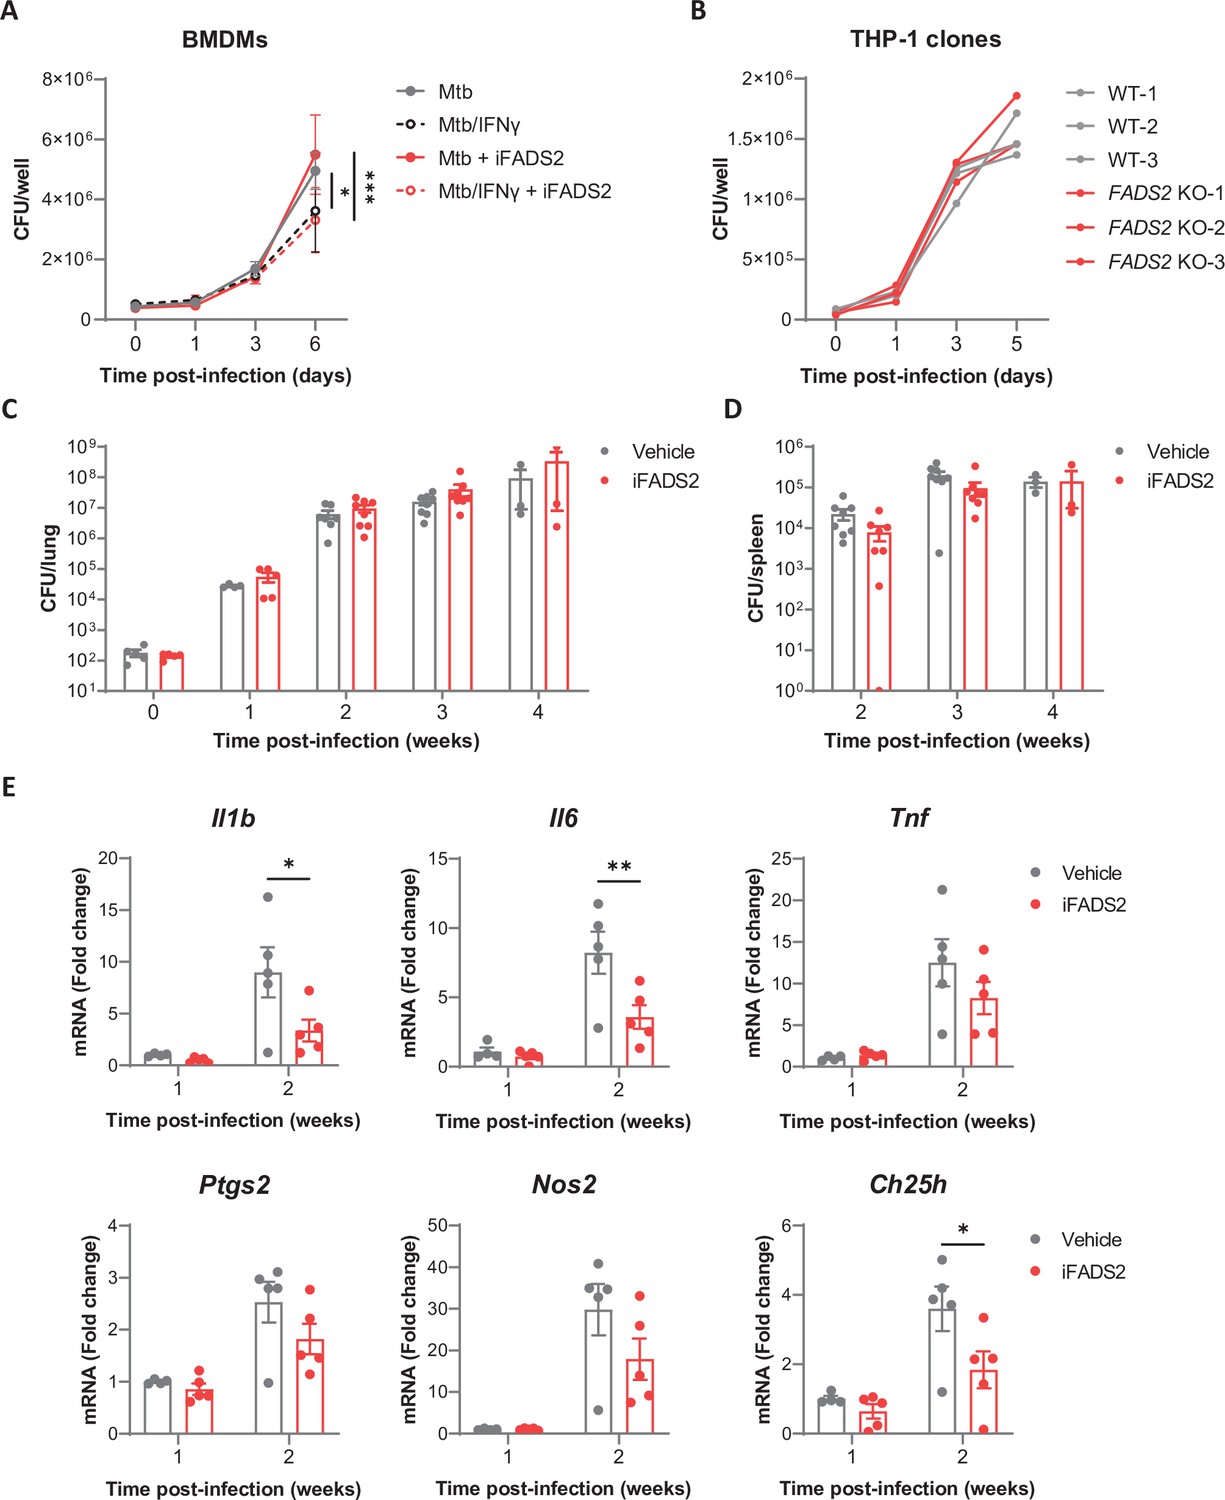
(A) Intracellular growth of Mtb inside resting or IFNγ-primed BMDMs treated with iFADS2 or with vehicle control, as determined by colony-forming unit (CFU) plating at the indicated days post infection. Data are means ± SD (n = 3) and are representative of two independent experiments. *p<0.05, ***p<0.001, two-way ANOVA with Bonferroni post-hoc multiple comparison tests. (B) Intracellular growth of Mtb inside differentiated THP-1 wild-type (WT) or FADS2 knockout (KO) clones, as determined by CFU plating at the indicated days post infection. Each line represents mean CFUs (n = 3) in one independent THP-1 clone. Data are representative of two independent experiments. (C, D) Growth of Mtb in the lungs (C) and spleen (D) of mice treated with iFADS2 or with vehicle control during 4 weeks, as determined by CFU plating. Data shown are means ± SEM of two pooled independent experiments (Exp 1: n = 3, Exp 2: n = 4–5 mice per time point). (E) Relative mRNA expression of inflammatory and antimicrobial genes in the lungs of mice treated as in (C), as determined by qRT-PCR. Data shown are means ± SEM (Exp 2: n = 4 or 5), *p<0.05, **p<0.01 in a two-way ANOVA with Bonferroni post-hoc multiple comparison tests.
Figure 4—figure supplement 1
Limiting Fads2 gene expression in macrophages.
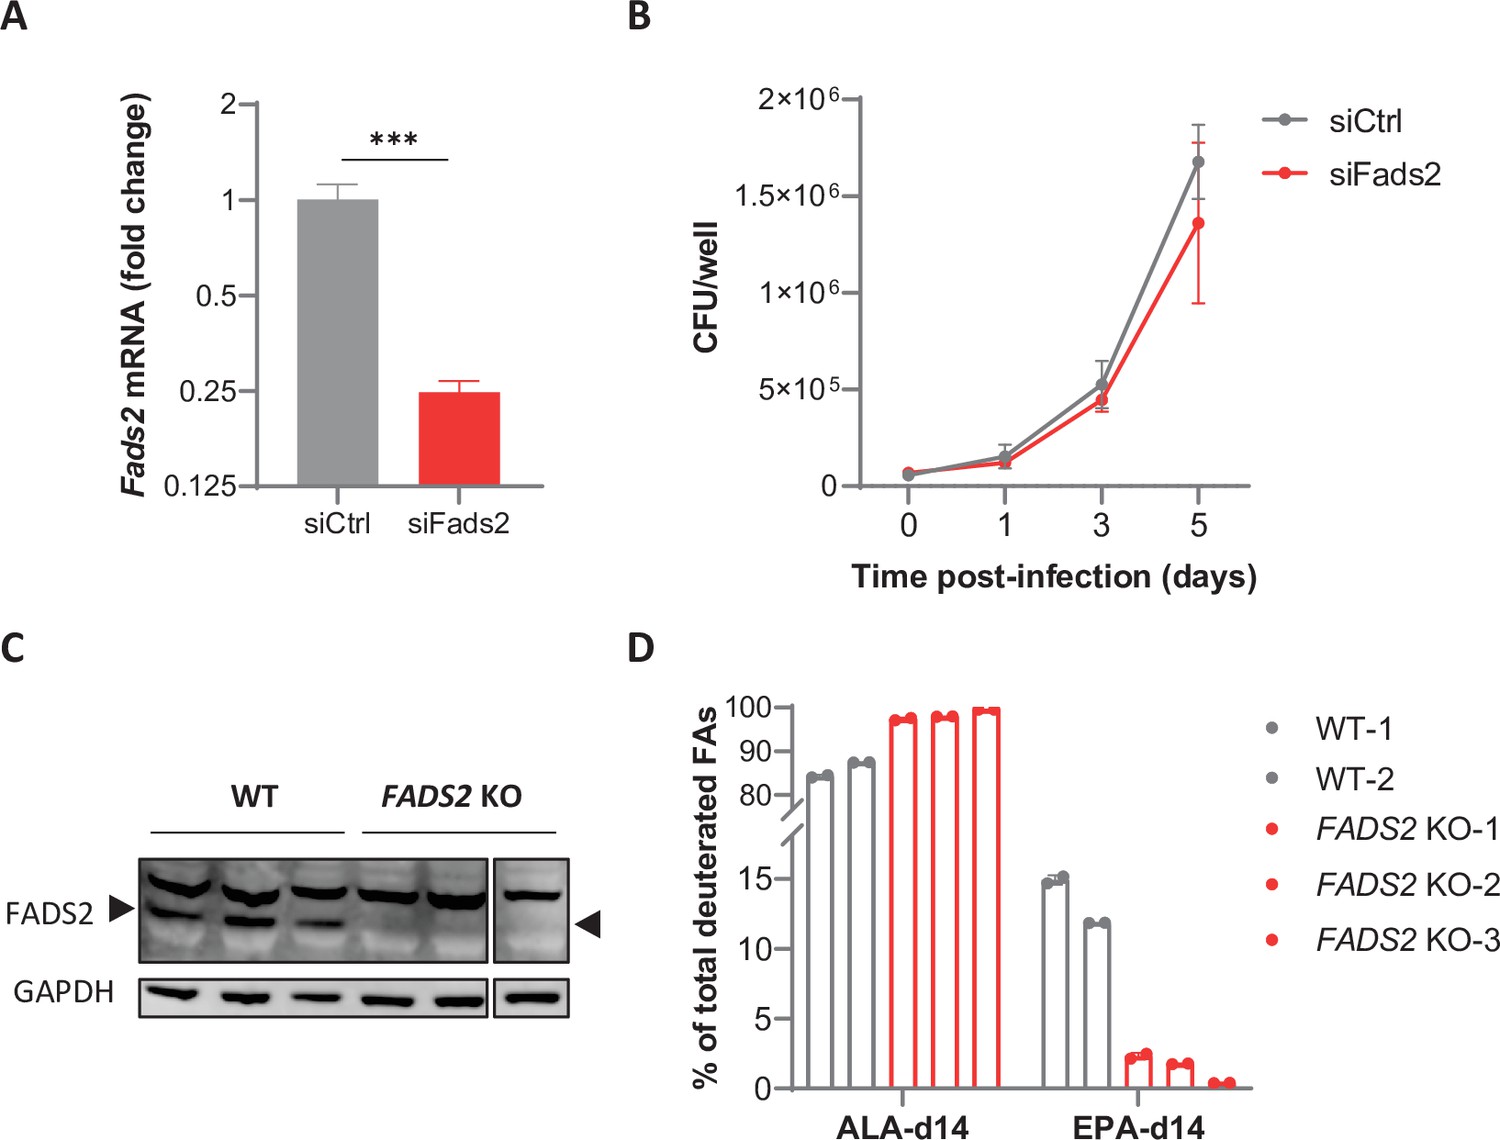
(A) Relative mRNA expression of Fads2 in BMDMs transfected with nontargeting (siCtrl) or Fads2 siRNA (siFads2) for 48 hr, as determined by qRT-PCR. Data are means ± SD (n = 3) and are representative of two independent experiments. ***p<0.001, unpaired Student’s t-test. (B) Intracellular growth of M. tuberculosis (Mtb) inside BMDMs transfected as in (A), as determined by colony-forming unit (CFU) plating at the indicated days post infection. Data are means ± SD (n = 3) and are representative of at least two independent experiments. (C) Protein expression of FADS2 and GAPDH (loading control) in wild-type (WT) and FADS2 knockout (FADS2 KO) THP-1 clones, as determined by western blot. Source data are available as Figure 4—figure supplement 1—source data 1, Figure 4—figure supplement 1—source data 2, and Figure 4—figure supplement 1—source data 3. (D) Intracellular levels of deuterated ω3 polyunsaturated fatty acids (PUFAs) in THP-1 clones incubated with the ω3 precursor ALA-d14 for 24 hr, relative to total deuterated fatty acids (FAs) levels. Data are means ± SD (n = 2).
-
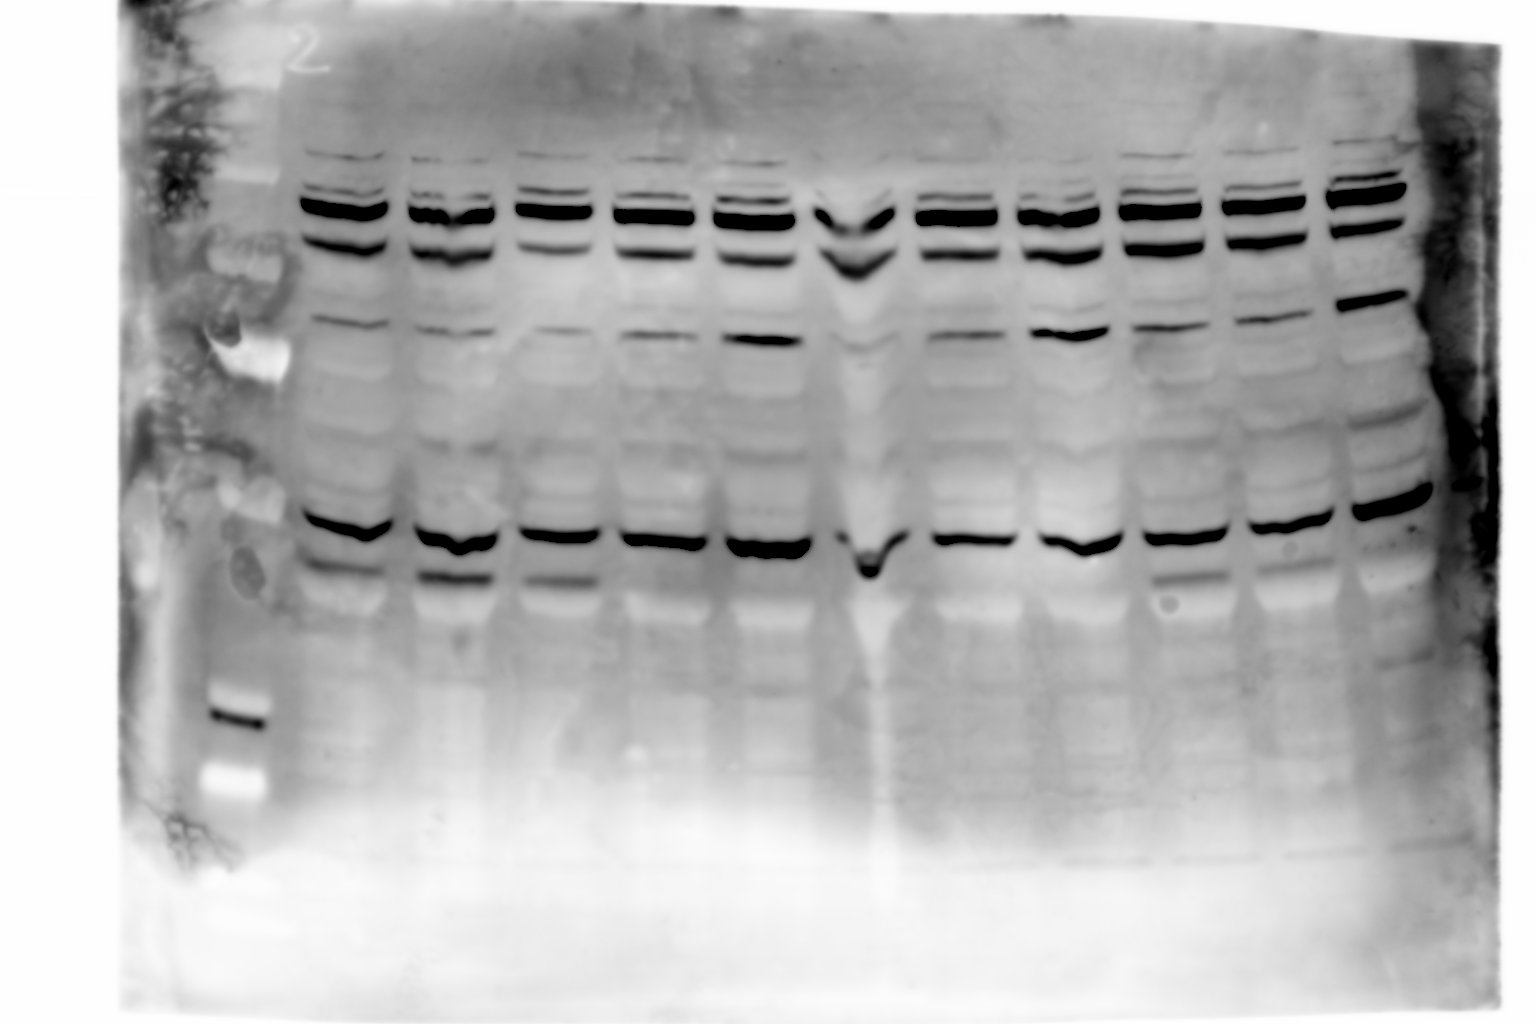
Figure 4—figure supplement 1—source data 1
Raw unedited gels.
- https://cdn.elifesciences.org/articles/71946/elife-71946-fig4-figsupp1-data1-v2.jpg
-
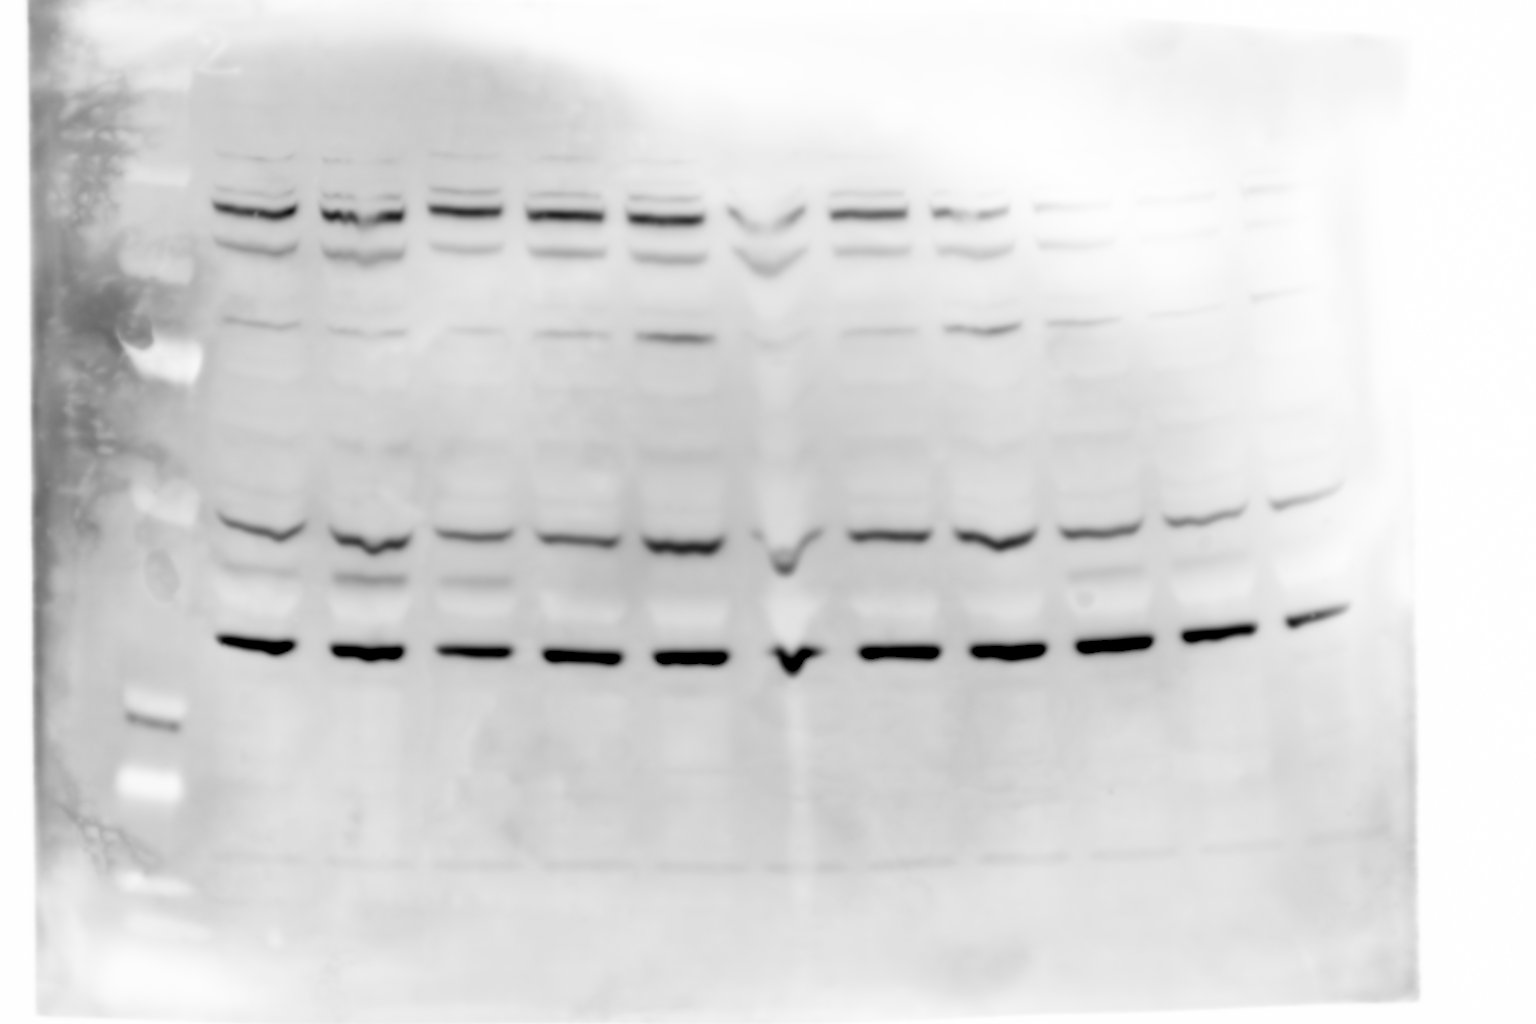
Figure 4—figure supplement 1—source data 2
Raw unedited gels.
- https://cdn.elifesciences.org/articles/71946/elife-71946-fig4-figsupp1-data2-v2.jpg
-
Figure 4—figure supplement 1—source data 3
Figures with uncropped gels.
- https://cdn.elifesciences.org/articles/71946/elife-71946-fig4-figsupp1-data3-v2.pdf
Figure 5 with 1 supplement

Mtb efficiently imports ω6 PUFAs through the Mce1 transporter in axenic culture.
(A) Schematics of the click-chemistry approach used to compare the uptake of SFAs, MUFAs and PUFAs by Mtb in axenic culture. (B) Differential kinetics of alkyne-SFA, -MUFA, and -PUFA uptake (all added at a concentration of 20 µM) by Mtb, as estimated by flow cytometry assessment of the geometric mean fluorescence intensities (gMFI) of clicked-FA. Data shown are representative of three independent experiments. (C) Schematics of the composition of the mce1-4 operons and related genes in Mtb genome. (D) Uptake of alkyne-PA by different Mtb strains deficient for the expression of genes belonging to mce1-4 operons, relative to wild-type (WT) Mtb. Data are means ± SD (n = 3) and are representative of two independent experiments, **p<0.01, unpaired Student’s t-tests. (E) Uptake of alkyne-FAs by Mtb Δmce1D and its complemented counterpart (Comp), relative to WT. Data are means ± SD from three independent experiments, *p<0.05, **p<0.01, ***p<0.001, paired t-tests. (F) Relative uptake of alkyne-OA, -LA, and -AA by Mtb WT in the presence of increasing amounts of natural palmitic acid (PA), oleic acid (OA), linoleic acid (LA), or arachidonic acid (AA). Data shown are representative of at least two independent experiments.
Figure 5—figure supplement 1
Inactivating genes of the Mce1 operon impairs Mtb's ability to import PUFAs.
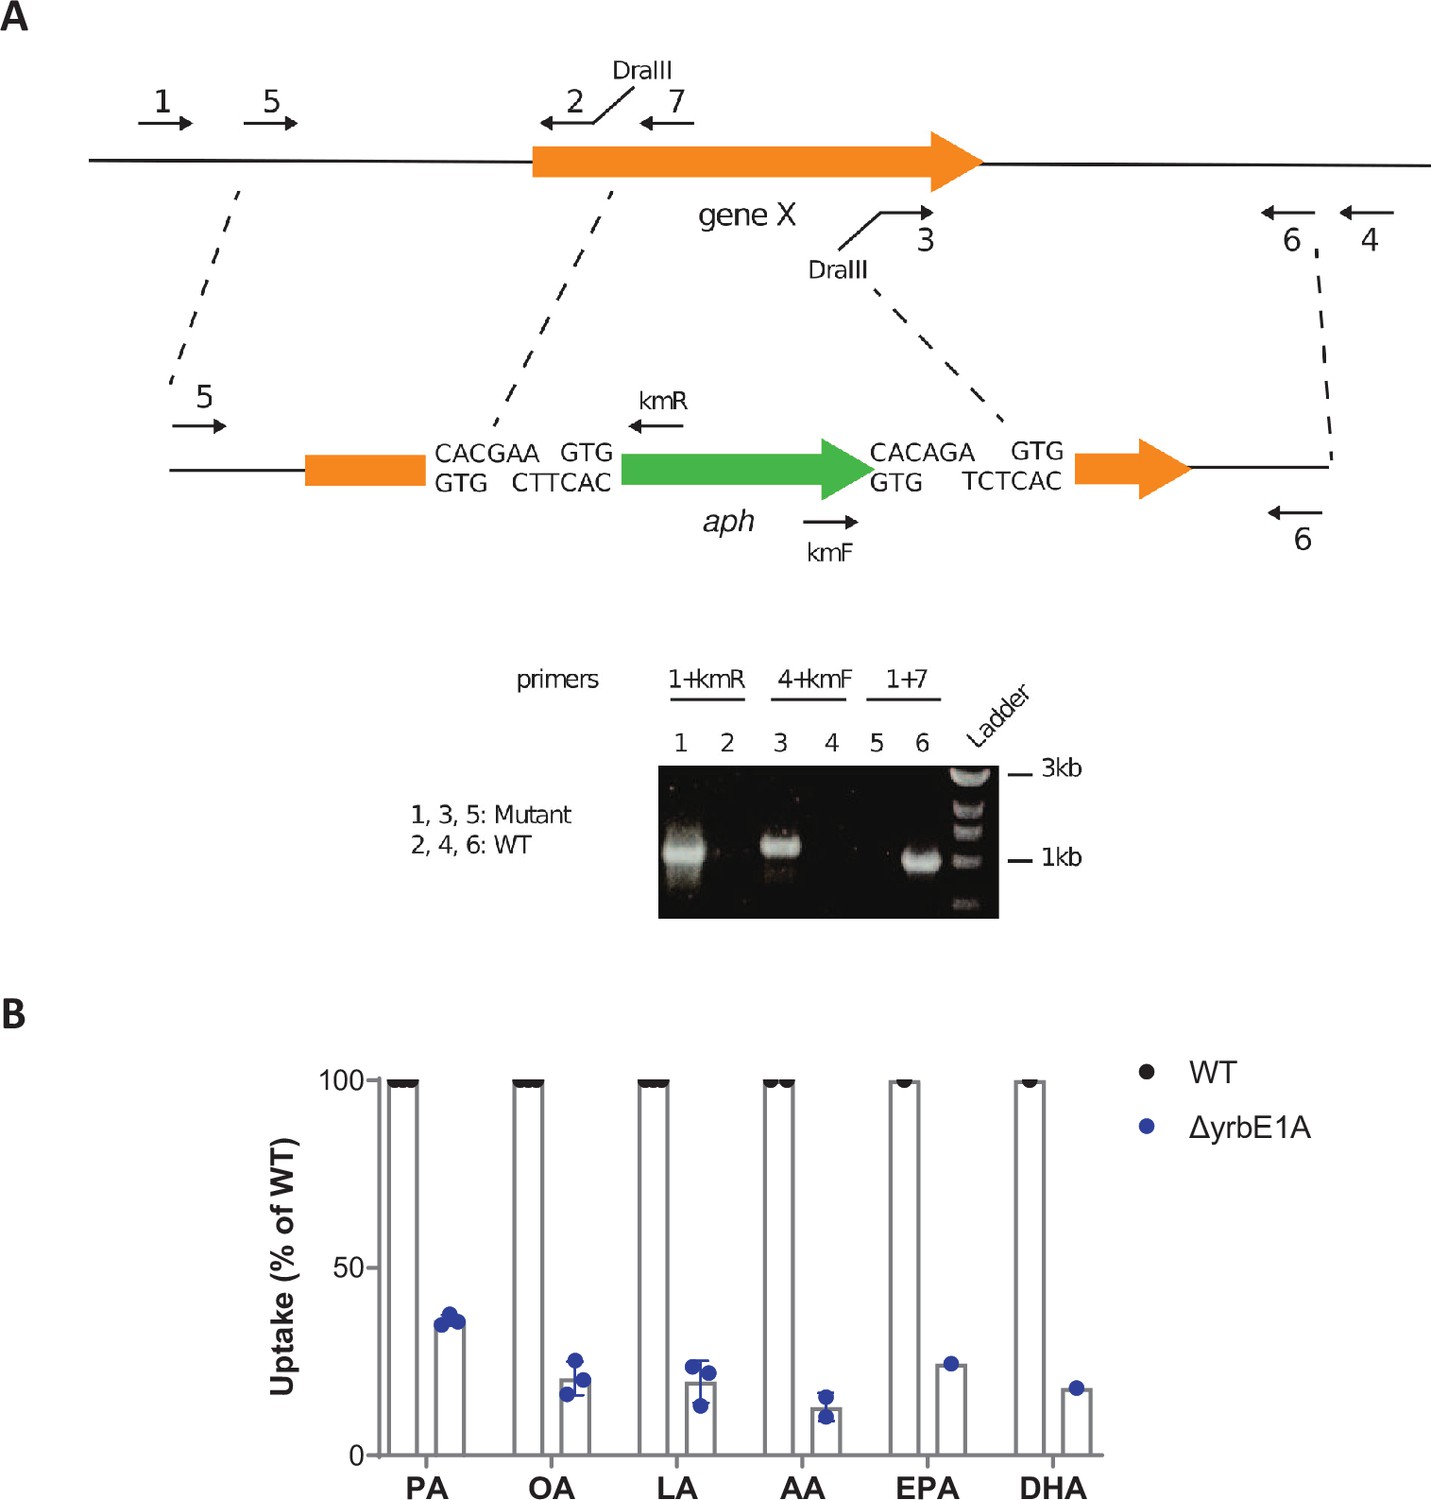
(A) Schematics of the strategy used to generate allelic exchange substrates. Figure 5—figure supplement 1—source data 1 and Figure 5—figure supplement 1—source data 2 show the raw unedited gel. (B) Uptake of alkyne-FAs by the ΔyrbE1A mutant of M. tuberculosis (Mtb), relative to Mtb WT. Data shown are means ± SD (n = 1, 2, or 3 independent experiments).
-
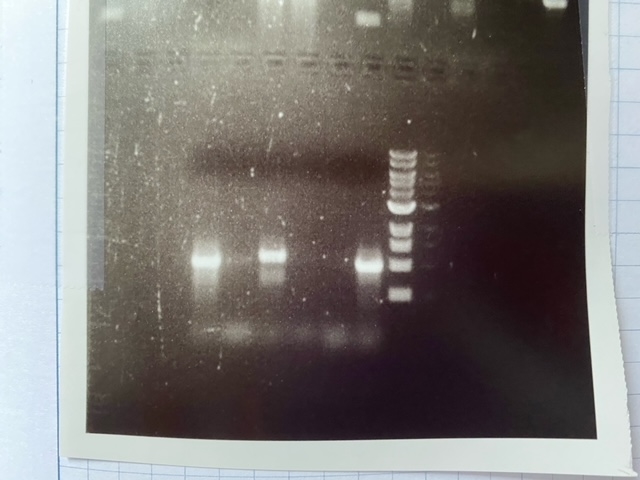
Figure 5—figure supplement 1—source data 1
Raw unedited gel.
- https://cdn.elifesciences.org/articles/71946/elife-71946-fig5-figsupp1-data1-v2.jpg
-
Figure 5—figure supplement 1—source data 2
Raw unedited gel.
- https://cdn.elifesciences.org/articles/71946/elife-71946-fig5-figsupp1-data2-v2.pdf
Figure 6 with 2 supplements
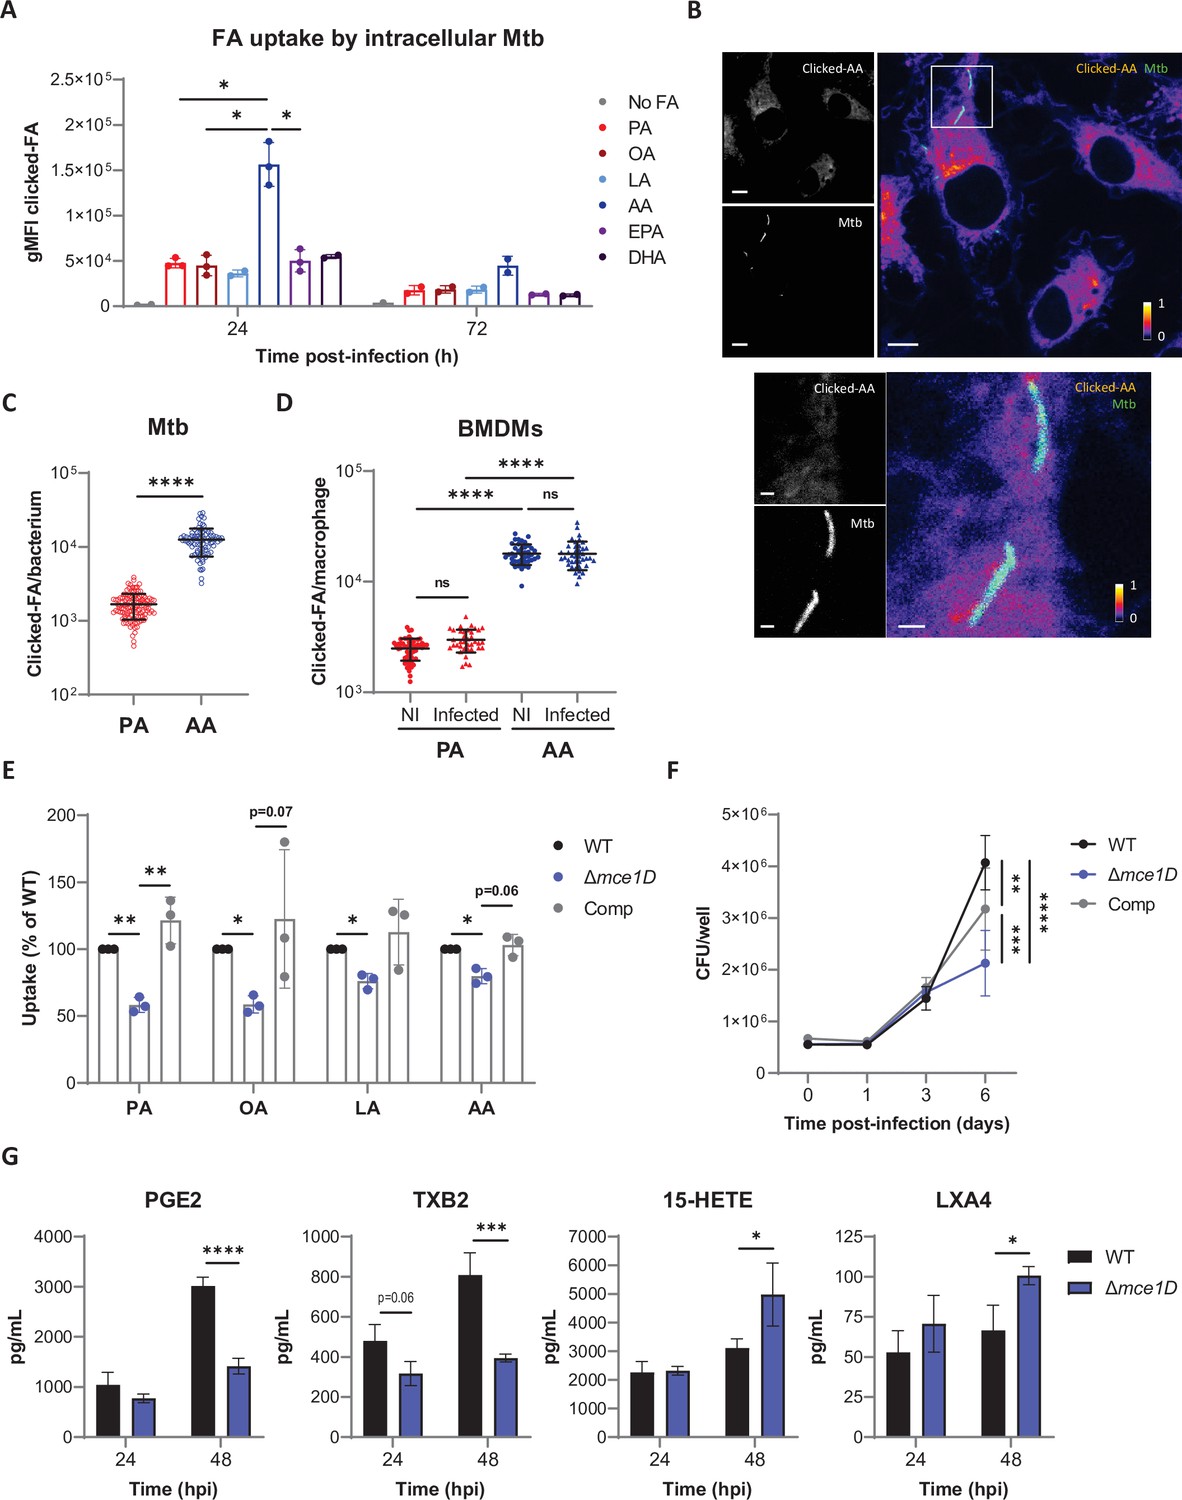
Mtb preferentially internalizes AA in the context of macrophages.
(A) Differential uptake of alkyne-FAs by Mtb isolated from BMDMs infected for 24 or 72 hr, as measured by flow cytometry. Data are means ± SD from two or three independent experiments, *p<0.05, paired t-tests. (B) Distribution of alkyne-AA in Mtb-infected BMDMs at 24 hr post infection, as shown on representative confocal images (green = GFP-expressing Mtb, log scale colormap = clicked AA). Color bar indicates the relative range of pixel intensity (white = high, purple = low, from 0 arbitrary unit to 1). Bar scale = 5 µm. Enlargement of the boxed area in the merged image (bar scale = 1 µm). (C, D) Quantification of the alkyne-FA signal in intracellular bacteria detected based on GFP signal (C) and in whole BMDMs either noninfected (NI) or Mtb-infected (D) using confocal images of BMDMs infected for 24 hr with a GFP-expressing strain of Mtb. Bars show means ± SD, n > 82 for (C) and n > 37 for (D). ns, not significant, ****p<0.0001, unpaired Student’s t-test (C) and one-way ANOVA with Tukey post-hoc multiple comparison tests (D). (E) Uptake of alkyne-FAs by GFP-expressing Mtb Δmce1D and its complemented counterpart (Comp), recovered from BMDMs infected for 24 hr, relative to GFP-expressing Mtb WT, as analyzed by flow cytometry. Data are means ± SD from three independent experiments, *p<0.05, **p<0.01, paired t-tests. (F) Intracellular growth of different Mtb strains inside BMDMs, as determined by colony-forming unit (CFU) plating at the indicated days post infection. (G) Secreted levels of AA metabolites by BMDMs infected with Mtb WT or Δmce1D for 24 or 48 hr. Data in (F) and (G) are means ± SD (n = 3), *p<0.05, **p<0.01, ***p<0.001, ****p<0.0001 in a two-way ANOVA with Bonferroni post-hoc multiple comparison tests.
Figure 6—figure supplement 1
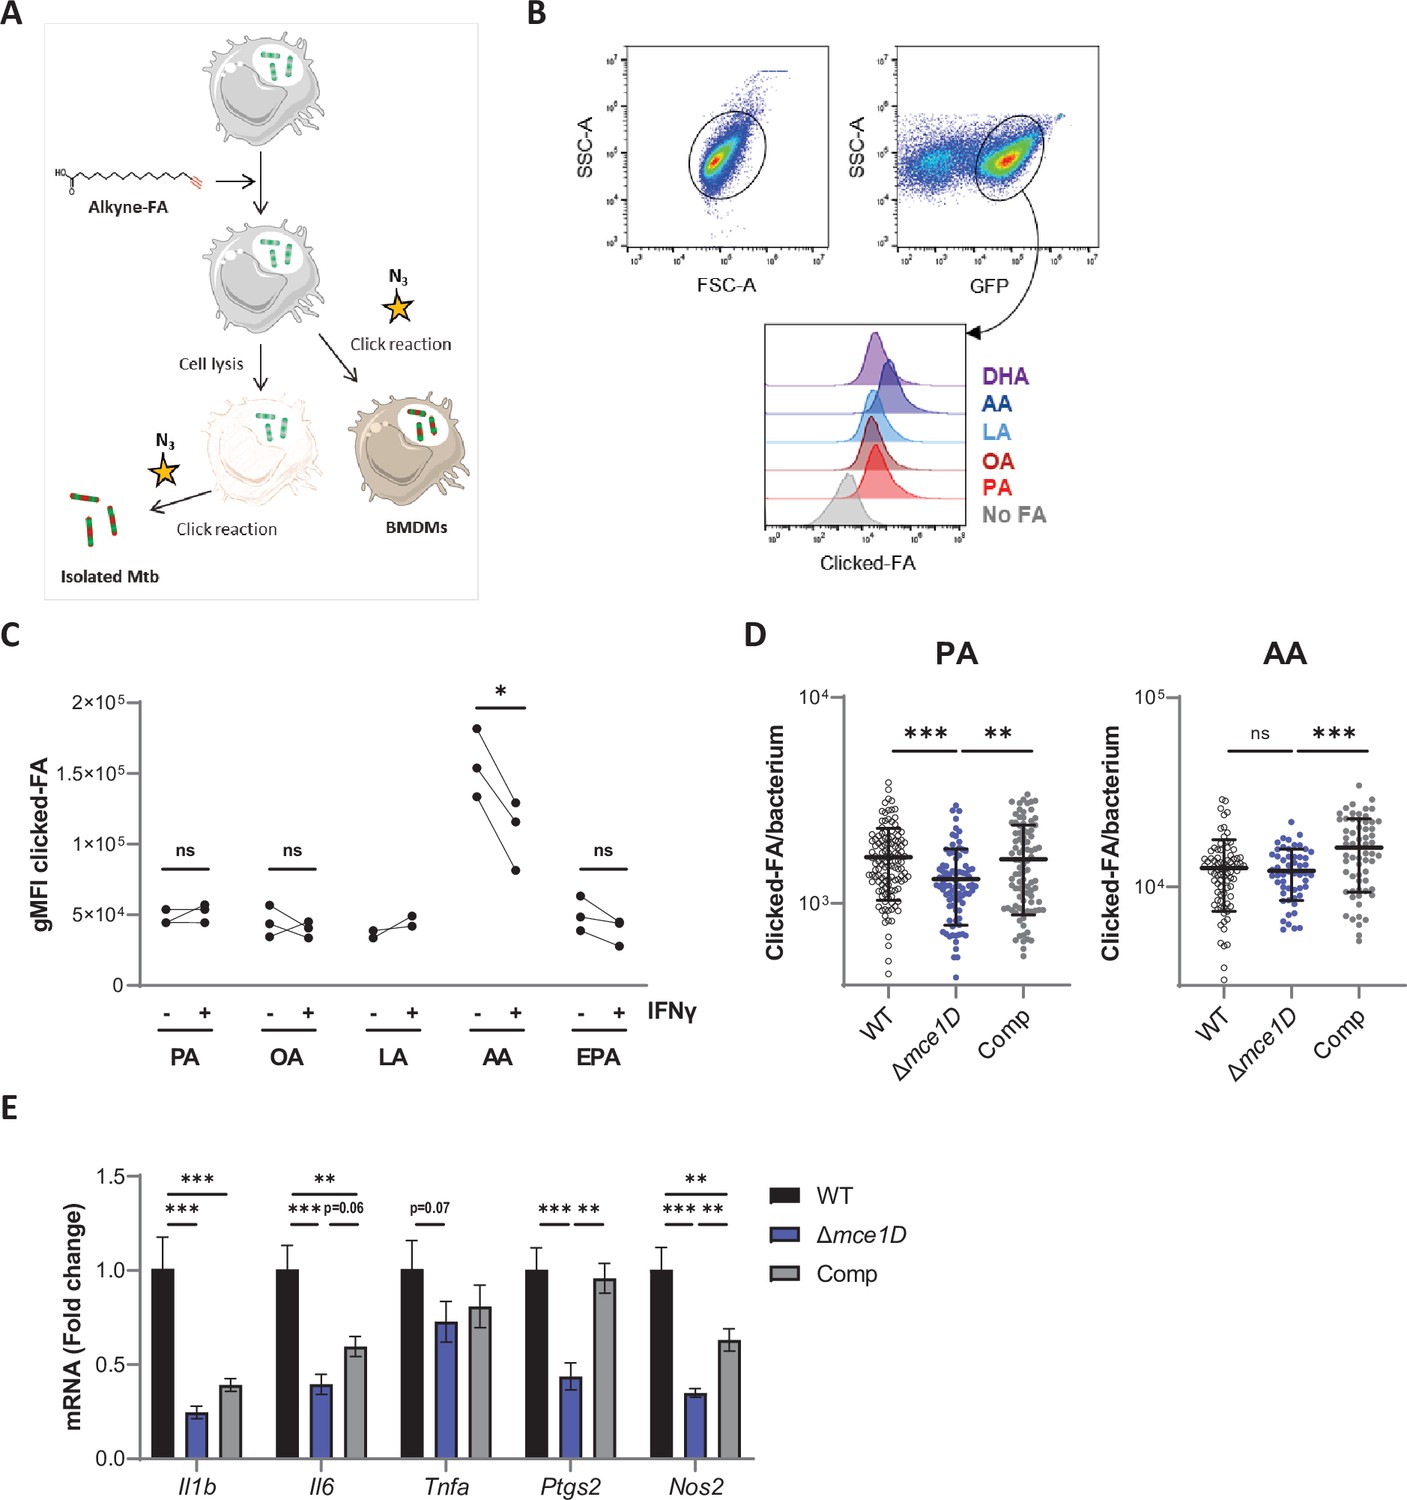
Differential uptake of SFAs, MUFAs and PUFAs by intracellular Mtb and host BMDMs.
(A) Schematics of the click-chemistry approach used . (B) Gating strategy for the analysis of FA uptake by a GFP-expressing strain of Mtb isolated from infected BMDMs at 24 hr post infection, and stained by click-chemistry. (C) Differential uptake of alkyne-FAs by Mtb isolated from resting or IFNγ-primed BMDMs infected for 24 hr, as measured by flow cytometry. Data shown are from two or three independent experiments, ns, not significant, *p<0.05, paired t-tests. (D) Quantification of the alkyne-FA signal in intracellular bacteria detected based on GFP signal using confocal images of BMDMs infected for 24 hr with different GFP-expressing Mtb strains. Bars show means ± SD, n > 54. ns, not significant, **p<0.01, ***p<0.001 in a one-way ANOVA with Dunnett post-hoc multiple comparison tests. (E) Relative mRNA expression of pro-inflammatory genes by BMDMs infected with Mtb WT, Δmce1D, or its complemented counterpart (Comp) for 24 hr. Data are means ± SD (n = 3), *p<0.05, **p<0.01, ***p<0.001, in a one-way ANOVA with Tukey post-hoc multiple comparison tests.
Figure 6—figure supplement 2
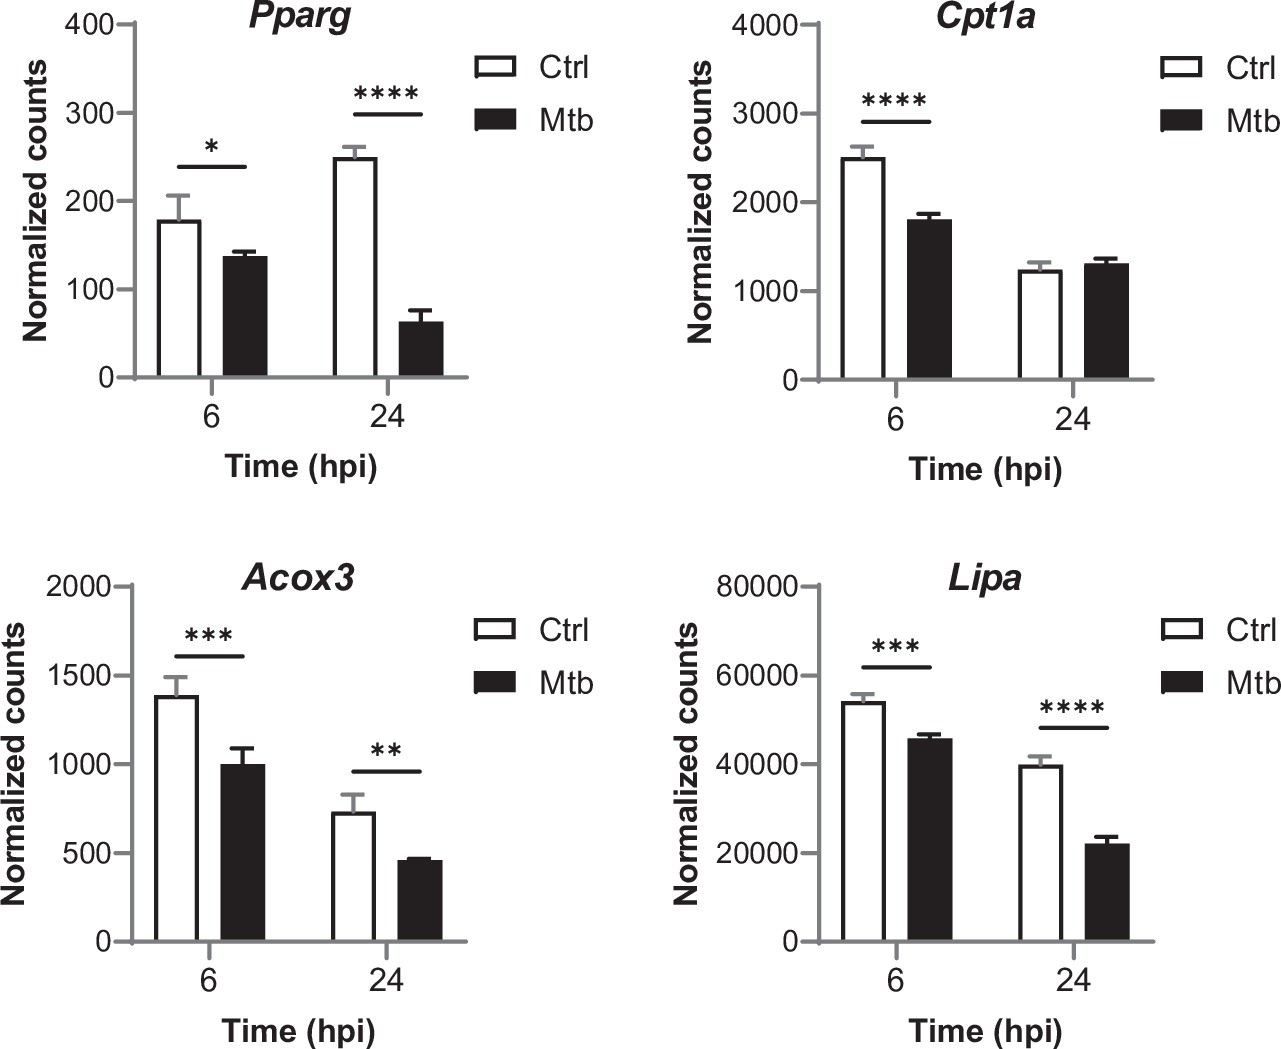
Relative mRNA expression of PPARγ target genes in BMDMs infected with Mtb for the indicated times, as determined by NanoString analysis.
Data are means ± SD (n = 3). *p<0.05, **p<0.01, ***p<0.001, ****p<0.0001 in a two-way ANOVA with Bonferroni post-hoc multiple comparison tests.
Author response image 1

Relative mRNA expression of Alox5 in Mtb-infected BMDMs treated as in Figure 3C, as determined by Nanostring analysis.
Data are means +/- SD (n=3), *P<0.05, ****P<0.0001 in a two-way ANOVA with Bonferroni post-hoc multiple comparison tests.
Author response image 2
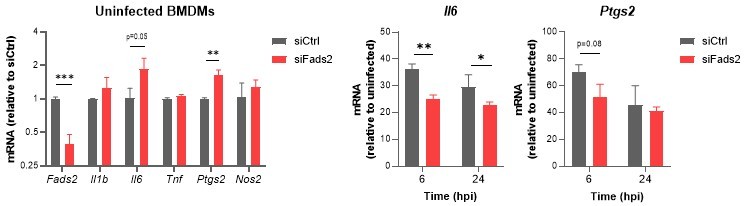
Relative mRNA expression of inflammatory genes in Mtb-infected BMDMs transfected with siCtrl or siFads2 for 48h (left panel), and infected with Mtb for the indicated periods of time (middle and right panels), as determined by qRT-PCR.
Data are means +/- SD (n=3), *P<0.05, **P<0.01, ***P<0.001 in a two-way ANOVA with Bonferroni post-hoc multiple comparison tests.
Tables
Appendix 1—key resources table
| Reagent type (species) or resource | Designation | Source or reference | Identifiers | Additional information |
|---|---|---|---|---|
| Strain, strain background (Mycobacterium tuberculosis) | M. tuberculosis | Laleh Majlessi, Institut Pasteur, Paris | H37Rv | Animal passaged |
| Strain, strain background (M. tuberculosis) | M. tuberculosis DsRed | Marino et al., 2015 | H37Rv DsRed | Animal passaged |
| Strain, strain background (Mycobacterium bovis) | BCG Pasteur | Roland Brosch, Institut Pasteur, Paris | 1173P2 | |
| Strain, strain background (Mus musculus), male | C57BL/6J | Charles River Laboratories | JAX stock no: 000664;RRID: IMSR_JAX:000664 | |
| Cell line (Homo sapiens) | THP-1 | ATCC | ATCC TIB-202;RRID:CVCL_0006 | |
| Strain, strain background (Escherichia coli) | HB101 | Promega | Cat# L2011 | Recombinant cloning and subcloning strain |
| Gene (M. tuberculosis) | lucA | ATCC27294 | Rv3723 | |
| Gene (M. tuberculosis) | mce1D | ATCC27294 | Rv0172 | |
| Gene (M. tuberculosis) | mceG | ATCC27294 | Rv0655 | |
| Gene (M. tuberculosis) | omamB | ATCC27294 | Rv0200 | |
| Gene (M. tuberculosis) | yrbE1A | ATCC27294 | Rv0167 | |
| Gene (M. tuberculosis) | yrbE2A | ATCC27294 | Rv0587 | |
| Gene (M. tuberculosis) | yrbE3A | ATCC27294 | Rv1964 | |
| Gene (M. tuberculosis) | yrbE4A | ATCC27294 | Rv3501 | |
| Genetic reagent (M. tuberculosis) | ΔlucA | This study, available from the corresponding author | ΔlucA::km | Chromosomal deletion of Rv3723 (lucA) and insertion of an antibiotic resistance marker by double crossover recombination |
| Genetic reagent (M. tuberculosis) | Δmce1D | This study, available from the corresponding author | Δmce1D::km | Chromosomal deletion of Rv0172 (mce1D) and insertion of an antibiotic resistance marker by double crossover recombination |
| Genetic reagent (M. tuberculosis) | ΔmceG | This study, available from the corresponding author | ΔmceG::km | Chromosomal deletion of Rv0655 (mceG) and insertion of an antibiotic resistance marker by double crossover recombination |
| Genetic reagent (M. tuberculosis) | ΔomamB | This study, available from the corresponding author | ΔomamB::km | Chromosomal deletion of Rv0200 (omamB) and insertion of an antibiotic resistance marker by double crossover recombination |
| Genetic reagent (M. tuberculosis) | ΔyrbE1A | This study, available from the corresponding author | ΔyrbE1A::km | Chromosomal deletion of Rv0167 (yrbE1A) and insertion of an antibiotic resistance marker by double crossover recombination |
| Genetic reagent (M. tuberculosis) | ΔyrbE2A | This study, available from the corresponding author | ΔyrbE2A::km | Chromosomal deletion of Rv0587 (yrbE2A) and insertion of an antibiotic resistance marker by double crossover recombination |
| Genetic reagent (M. tuberculosis) | ΔyrbE3A | This study, available from the corresponding author | ΔyrbE3A::km | Chromosomal deletion of Rv1964 (yrbE3A) and insertion of an antibiotic resistance marker by double crossover recombination |
| Genetic reagent (M. tuberculosis) | ΔyrbE4A | This study, available from the corresponding author | ΔyrbE4A::km | Chromosomal deletion of Rv3501 (yrbE4A) and insertion of an antibiotic resistance marker by double crossover recombination |
| Genetic reagent (M. tuberculosis) | Δmce1D Comp | This study, available from the corresponding author | Δmce1D::km::yrbE1 to rv0178 | WT copy of the yrbE1 to rv0178 operon integrated at AttB |
| Recombinant DNA reagent | PX458 (plasmid) | Addgene(Ran et al., 2013) | pSpCas9(BB)–2A-GFP (pX458) | |
| Recombinant DNA reagent | pET26b (plasmid) | Sigma-Aldrich | pET26b(+) - Novagen | |
| Recombinant DNA reagent | pJV53H (plasmid) | This study, available from C. Guilhot | pJV53H | pJV53 (van Kessel and Hatfull, 2007) with hygromycin resistance gene |
| Recombinant DNA reagent | pMV361 (plasmid) | Stover et al., 1993 | pMV361 | AttB integrating M. tuberculosis plasmid |
| Recombinant DNA reagent | pMVZ621 (plasmid) | Didier Zerbib, Toulouse Biotechnology Institute, France | pMVZ621 | pMV261 carrying a Zeocin resistance gene |
| Recombinant DNA reagent | pWM430 (plasmid) | This study | pWM430 | pMV361 with insertion of a zeocin cassette between the XbaI and Eco147i restriction sites |
| Recombinant DNA reagent | pWM431 (plasmid) | This study | pWM431 | pWM430 with a fragment going from gene yrbE1A to gene rv0178 of M. tuberculosis H37Rv |
| Recombinant DNA reagent | pWM251 (plasmid) | This study | pWM251 | pMIP12 (Le Dantec et al., 2001) carrying the streptomycin resistance cassette from pHP45Ω (Prentki and Krisch, 1984) and the gfp under the control of the pBlaF* promotor |
| Recombinant DNA reagent | Rv165 (cosmid) | Brosch et al., 1998 | Rv165 cosmid | Cosmid carrying a large fragment of the H37Rv genome covering the Mce1 region. |
| Sequence-based reagent | Primers used to generate AES and Mtb mutants | Merck | PCR primers | Supplementary file 2 |
| Sequence-based reagent | Eurofins Genomics | qPCR primers | Supplementary file 3 | |
| Sequence-based reagent | FADS2_ex2_F | Eurofins Genomics | PCR primer | 5′-GCACATTTCCAGTGCCAAGG-3′ |
| Sequence-based reagent | FADS2_ex2_R | Eurofins Genomics | PCR primer | 5′-GGAGAGAGGAGACGCCACTA-3′ |
| Sequence-based reagent | Guide RNA targeting the exon 2 of FADS2 | Eurofins Genomics | Oligonucleotide | 5′-GCACCCTGACCTGGAATTCGT-3′ |
| Transfected construct (M. musculus) | ON-TARGETplus siRNAs (SMARTpool) | Dharmacon/Horizon Discoveries | Non-targeting: D-001810-10Mouse Fads2:L-049816-01 | |
| Antibody | Anti-FADS2 (rabbit polyclonal) | Thermo Fisher Scientific | PA576611; RRID:AB_2720338 | (1:1000) dilution |
| Antibody | Anti-GAPDH (rabbit monoclonal) | Cell Signaling Technology | 2118; RRID:AB_561053 | (1:1000) dilution |
| Antibody | Goat anti-rabbit IgG (HRP conjugate) | Santa Cruz | SC-2004;RRID:AB_631746 | (1:1000) dilution |
| Chemical compound, drug | SC-26196 | Cayman Chemical | 10792 | |
| Chemical compound, drug | Ultrapure LPS from E. coli | Enzo Life Sciences | ALX-581-013 | Serotype 055:B5 |
| Chemical compound, drug | Pam3Csk4 | Invivogen | tlrl-pms | |
| Chemical compound, drug | Lipofectamine RNAiMAX | Thermo Fisher Scientific | 13778075 | |
| Commercial assay or kit | VenorGeM Advance Mycoplasma detection kit | Minerva Biolabs | 11-7024 | |
| Commercial assay or kit | Human Monocyte Nucleofector Kit | Lonza | VPA-1007 | |
| Commercial assay or kit | Click-iT Plus Alexa Fluor-647 Picolyl Azide kit | Thermo Fisher Scientific | C10643 | |
| Commercial assay or kit | Quant-iT dsDNA Assay Kit, broad range | Thermo Fisher Scientific | Q33130 | |
| Commercial assay or kit | Apoptosis/ Necrosis Assay Kit | Abcam | ab176750 | |
| Commercial assay or kit | High-Capacity cDNA Reverse Transcription Kit | Thermo Fisher Scientific | 4368814 | |
| Commercial assay or kit | Power SYBR Green PCR Master Mix | Thermo Fisher Scientific | 4367659 | |
| Commercial assay or kit | miRNeasy Mini Kit | QIAGEN | 217004 | |
| Commercial assay or kit | CloneJET PCR Cloning Kit | Thermo Fisher Scientific | K1231 | |
| Commercial assay or kit | AmpliTaq Gold 360 master mix | Thermo Fisher Scientific | 4398876 | |
| Peptide, recombinant protein | DreamTaq Green polymerase | Thermo Fisher Scientific | EP0711 | |
| Peptide, recombinant protein | T4 DNA ligase | Thermo Fisher Scientific | EL0011 | |
| Peptide, recombinant protein | PrimeSTAR GXL DNA Polymerase | Takara Bio | R050B | |
| Software, algorithm | GraphPad Prism | GraphPad Prism (https://graphpad.com) | RRID:SCR_015807 | |
| Software, algorithm | Zen Imaging software | Zeiss | RRID:SCR_013672 | |
| Software, algorithm | Icy opensource platform | http://www.icy.bioimageanalysis.org de Chaumont et al., 2012 | RRID:SCR_010587 | |
| Software, algorithm | FlowJo software | https://www.flowjo.com/ | RRID:SCR_008520 | |
| Software, algorithm | nSolver analysis software | http://www.nanostring.com/products/nSolver | RRID:SCR_003420 | |
| Other | 4–12% NuPAGE Bis-Tris gels | Thermo Fisher Scientific | NP0322BOX | |
| Other | iBlot 2 gel transfer Stacks Nitrocellulose system | Thermo Fisher Scientific | IB23001 | |
| Other | Prolong Diamond Antifade Mountant | Thermo Fisher Scientific | P36961 | |
| Other | DAPI stain | Sigma-Aldrich | D9542 | Used at 1 µg/mL |
Additional files
-
Supplementary file 1
NanoString nCounter Custom CodeSet.
- https://cdn.elifesciences.org/articles/71946/elife-71946-supp1-v2.docx
-
Supplementary file 2
Primers used to generate the various allelic exchange substrates (AES) and M. tuberculosis (Mtb) mutants.
DraIII and Van91I restriction sites introduced into the primers are indicated in red and green, respectively.
- https://cdn.elifesciences.org/articles/71946/elife-71946-supp2-v2.docx
-
Supplementary file 3
qPCR primers sequences.
- https://cdn.elifesciences.org/articles/71946/elife-71946-supp3-v2.docx
-
Transparent reporting form
- https://cdn.elifesciences.org/articles/71946/elife-71946-transrepform1-v2.pdf
Download links
A two-part list of links to download the article, or parts of the article, in various formats.
Downloads (link to download the article as PDF)
Open citations (links to open the citations from this article in various online reference manager services)
Cite this article (links to download the citations from this article in formats compatible with various reference manager tools)
De novo synthesized polyunsaturated fatty acids operate as both host immunomodulators and nutrients for Mycobacterium tuberculosis
eLife 10:e71946.
https://doi.org/10.7554/eLife.71946


