Structure of mycobacterial CIII2CIV2 respiratory supercomplex bound to the tuberculosis drug candidate telacebec (Q203)
- Molecular Medicine Program, The Hospital for Sick Children, Canada
- Department of Medical Biophysics, The University of Toronto, Canada
- Department of Biochemistry and Biophysics, Stockholm University, Sweden
- Department of Pharmaceutical/Medicinal Chemistry and Clinical Pharmacy, Martin-Luther-Universitaet Halle-Wittenberg, Germany
- Department of Biochemistry, The University of Toronto, Canada
Figures
Figure 1 with 3 supplements

Structure of the Mycobacterium smegmatis CIII2CIV2 respiratory complex.
(A) SDS-PAGE shows most of the known subunits of the complex and indicates that the superoxide dismutase (SOD) and LpqE subunits are depleted by gel filtration chromatography. (B) Electron cryomicroscopy (CryoEM) map of the CIII2CIV2. The different density thresholds for the SOD subunit and the rest of the complex are indicated. Scale bar, 50 Å. (C) Three-dimensional variability analysis indicates two different clusters of particle images (‘cluster 1’ and ‘cluster 2’) that show the SOD subunit in different positions over the twofold symmetry axis of the complex. Scale bar, 50 Å. (D) An atomic model for the CIII2CIV2 complex with SOD fitted into the map and showing one half of the complex missing the LpqE subunit and with the cyt. cc domain in the ‘open’ conformation and the other half of the complex possessing the LpqE subunit and with the cyt. cc domain in the ‘closed’ conformation.
Figure 1—figure supplement 1

Electron cryomicroscopy (CryoEM) map validation.
(A) An example micrograph, class average images, Fourier shell correlation curves (including correction for the effects of masking following gold-standard refinement), orientation distribution plot, and local resolution estimate are shown for the inhibitor-free CIII2CIV2 map. (B) An example micrograph, class average images, Fourier shell correlation curves (including correction for the effects of masking following gold-standard refinement), orientation distribution plot, and local resolution estimate are shown for the telacebec-bound CIII2CIV2 map. Scale bars, 50 nm.
Figure 1—figure supplement 2
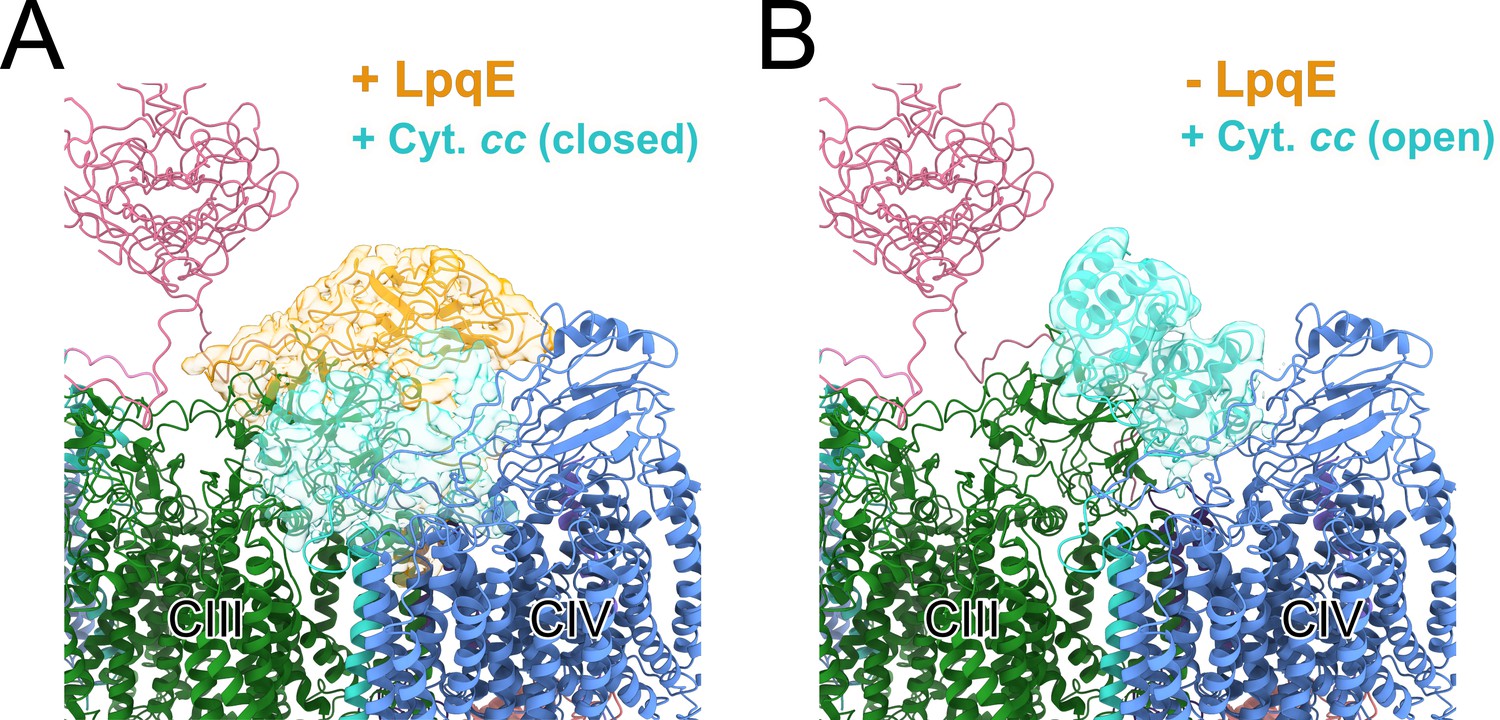
Three-dimensional (3D) variability analysis of LpqE and the cyt. cc domain.
Focusing on one half of the CIII2CIV2 supercomplex with symmetry expansion to allow all half complexes to contribute, complexes were identified with LpqE (gold) and the cyt. cc domain (cyan) in the ‘closed’ position (A) and without LpqE and the cyt. cc domain (cyan) in the ‘open’ position (B).
Figure 1—figure supplement 3
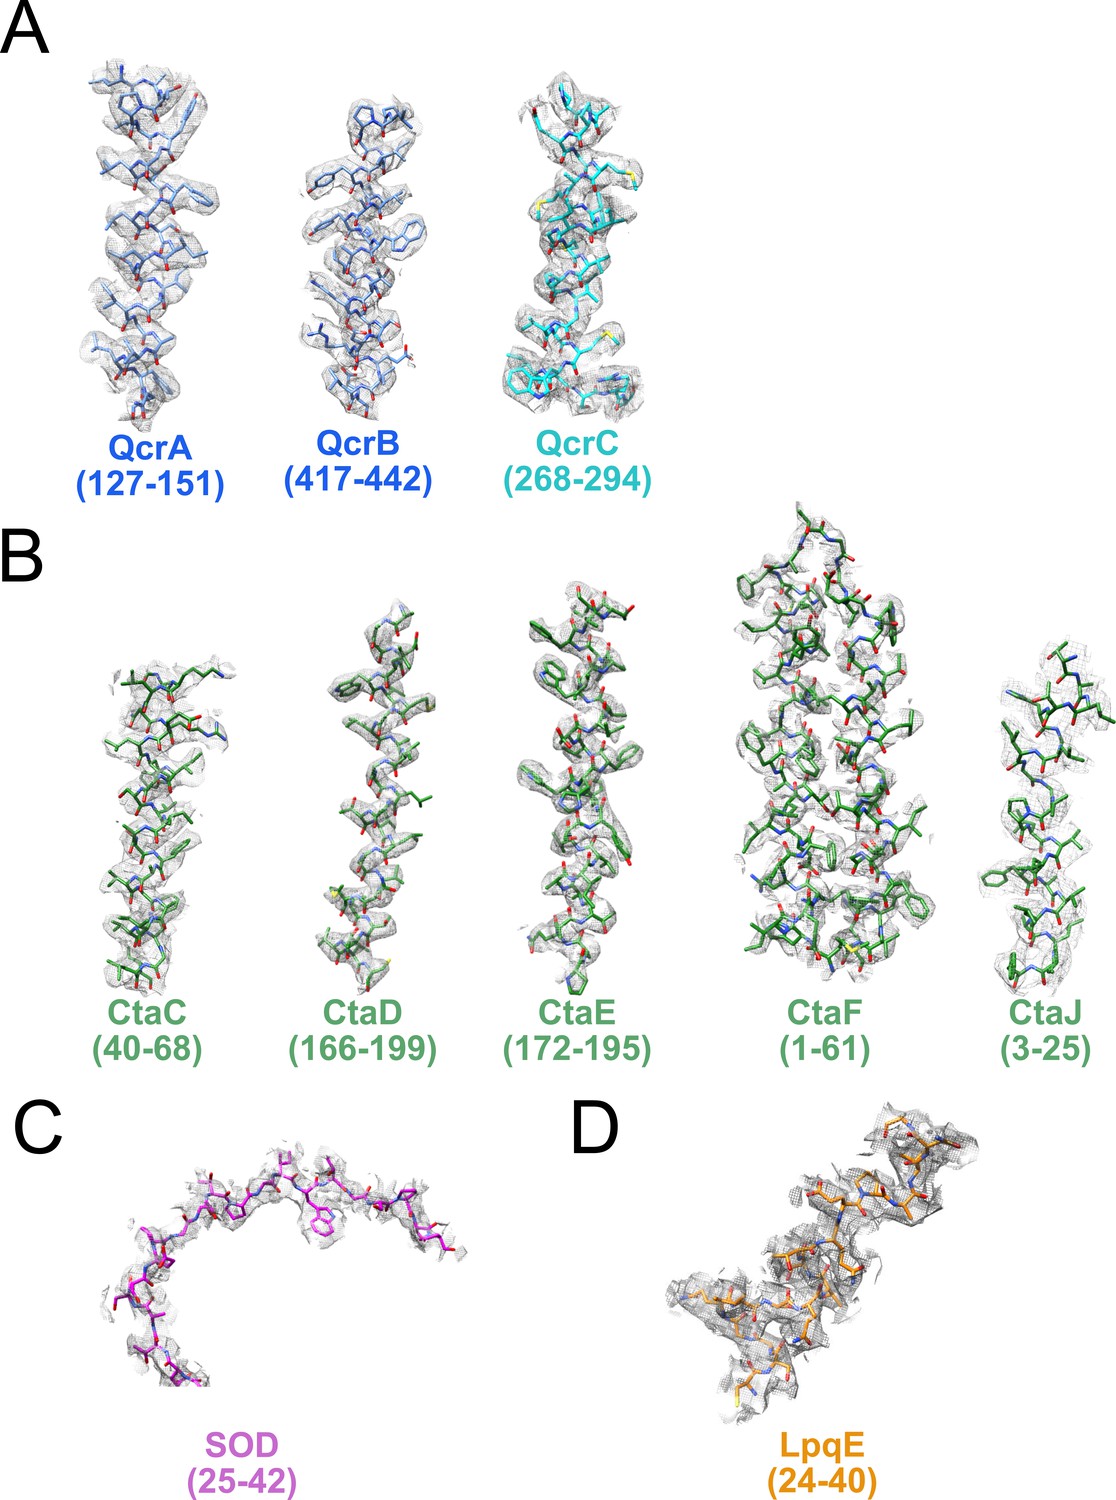
Examples of model in map fit.
Examples for model in map fit are shown for the CIII part of the supercomplex (A), the CIV part of the supercomplex (B), as well as the superoxide dismutase (SOD) (C) and LpqE (D) subunits.
Figure 2 with 1 supplement

Assay of 2,3-dimethyl-[1,4]naphthohydroquinone (DMWH2:O2) oxidoreductase activity of CIII2CIV2.
(A) An oxygen reduction assay shows that autoxidation of DMWH2, blue curve, is decreased by the presence of 500 nM bovine superoxide dismutase (SOD), orange curve. Measurement of oxygen reduction by CIII2CIV2 in the presence of bovine SOD, green curve, allows calculation of CIII2CIV2 activity. (B) Structure of CIII2CIV2 inhibitor telacebec (Q203). (C) Titration of CIII2CIV2 (60 nM) with telacebec shows an IC50 of 53 ± 19 nM (± s.d., n = 3 independent titrations) with 100 µM DMWH2.
Figure 2—figure supplement 1
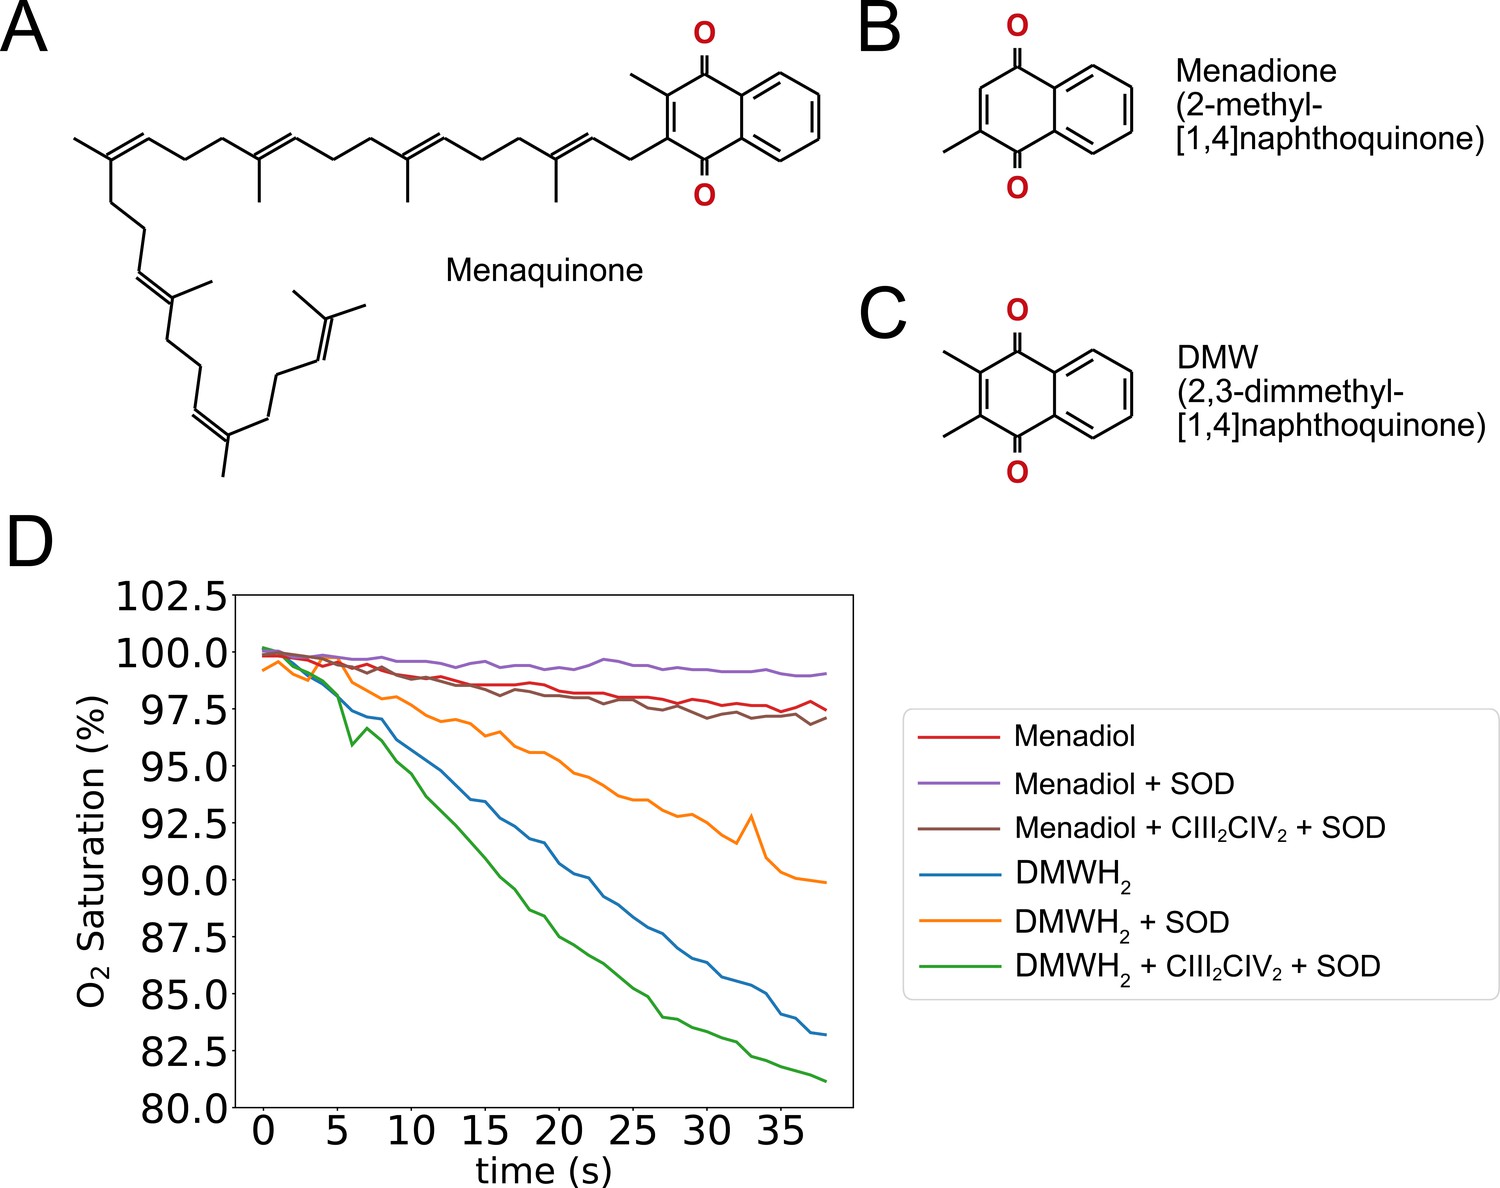
Structural and kinetic comparison of menaquinone and analogues.
Oxidized menaquinone (A), menadione (2-methyl-[1,4]naphthoquinone) (B), and DMW (2,3-dimethyl-[1,4]naphthoquinone) (C) are shown. (D) An overlay of oxygen reduction assays shows that the rate of autoxidation for menadiol (2-dimethyl-[1,4]naphthohydroquinone) blue curve, is larger than for DMWH2 (2,3-dimethyl-[1,4]naphthohydroquinone) red curve, and both autoxidation rates decrease in the presence of 500 nM bovine superoxide dismutase (SOD) orange and purple curves. Measurement of oxygen reduction by CIII2CIV2 in the presence of bovine SOD shows that CIII2CIV2 activity is greater with DMWH2 green curve, than with menadiol brown curve.
Figure 3 with 1 supplement
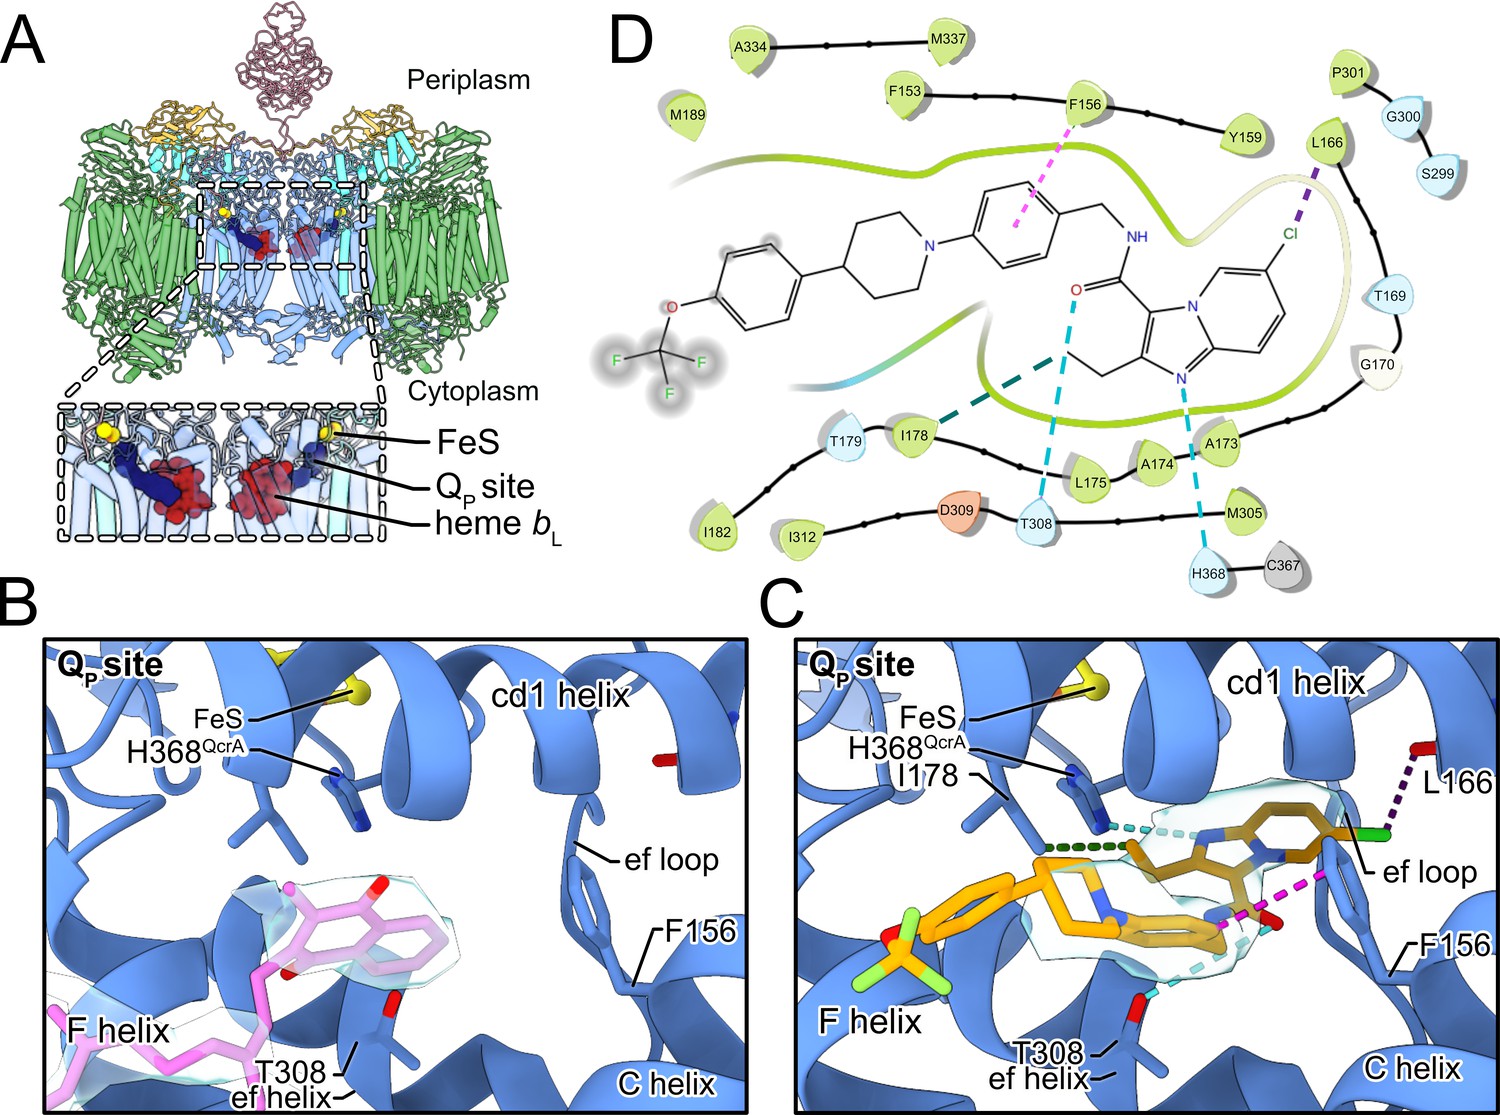
Telacebec binding to the QP site.
(A) The dashed boxes indicate the two QP sites in CIII2CIV2, each showing menaquinone (blue), the Rieske protein FeS (yellow), and heme bL (red). (B) In the inhibitor-free structure, there is density for endogenous menaquinone (pink model and gray surface) distal from the FeS group among the well-conserved structural elements of the QP site. (C) In the inhibitor-bound structure, there is density for telacebec (orange model and gray surface) deeper in the QP site where it can form numerous interactions with the protein, including possible hydrogen bonds (dashed teal lines), hydrophobic interactions (dashed green line), a halogen bond (dashed purple line), and an aromatic interaction (dashed pink line). (D) A two-dimensional (2D) representation of the interactions between telacebec and residues of CIII2CIV2 using the same color convention as in part C.
Figure 3—figure supplement 1
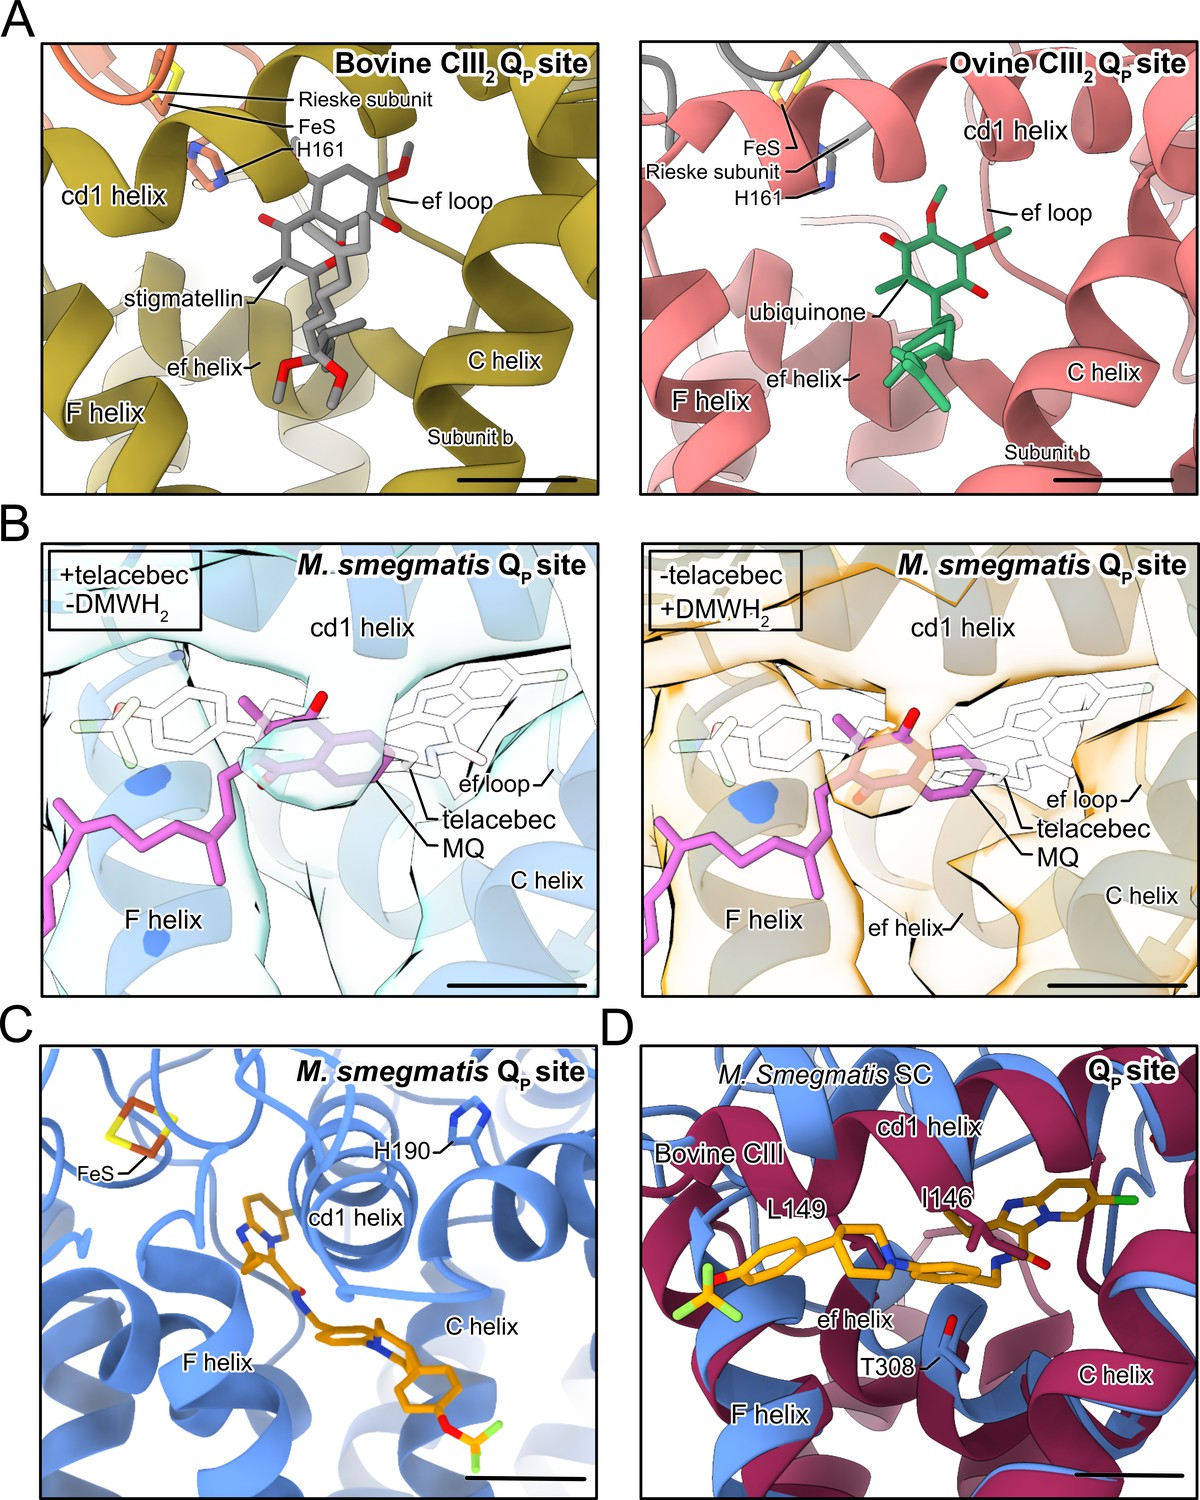
Binding of small molecules in the QP site of CIII.
(A) Both stigmatellin (gray model) in the bovine CIII2 QP site (left) (PDB: 1PPJ) (Huang et al., 2005) and ubiquinone (green model) in the bovine CICIII2 supercomplex QP (right) (PDB: 6Q9E) (Letts et al., 2019) bind deep in the site close to the FeS group, different from endogenous menaquinone (MQ) with Mycobacterium smegmatis CIII2CIV2. (B) Electron cryomicroscopy (CryoEM) density from the 200 kV screening microscope shows that CIII2CIV2 with telacebec but without 2,3-dimethyl-[1,4] naphthohydroquinone (DMWH2) at 4.7 Å resolution (left) and with enzymatically reduced DMWH2 but without telacebec at 4.4 Å resolution (right) is consistent with binding of MQ (pink model) but not telacebec (white model) in the QP site. (C) Alternative view of Mycobacterium smegmatis QP site showing H109. (D) Overlay of a bovine CIII2 atomic model (PDB: 1PPJ) with the M. smegmatis CIII2CIV2 atomic model.
Figure 4
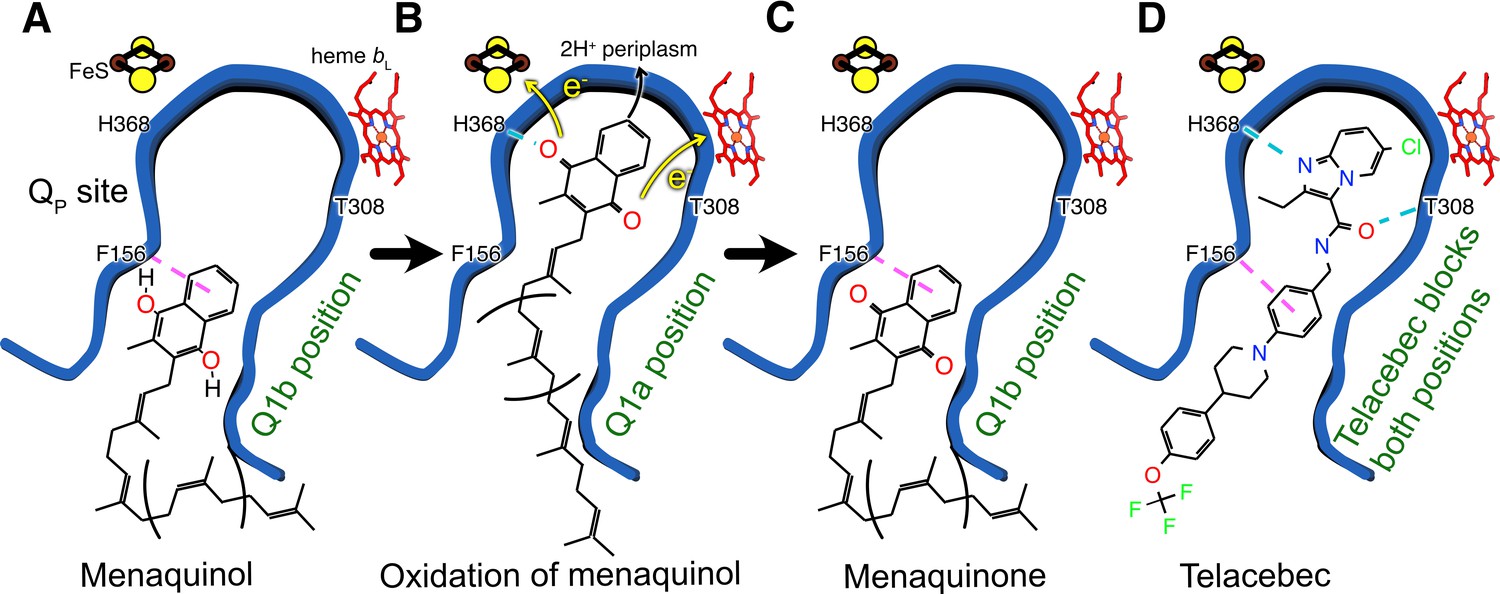
Model for oxidation of MQH2 in the QP site and how telacebec blocks it.
An emerging model for MQH2 reduction at the QP site proposes that the substrate binds in the Q1b position where it is too far from FeS to donate protons and electrons (A). Upon moving deeper into the QP site to the Q1a position, MQH2 is oxidized to menaquinone (MQ), donating its first electron to FeS, its second electron to heme bL, and releasing two protons to the positively charged periplasmic side of the lipid bilayer (B). Telacebec binds deep within the QP site, forming numerous interactions with the protein and blocking both the Q1a and Q1b positions (C).
Videos
Video 1
Three-dimensional variability analysis of CIII2CIV2 showing the presence of LpqE with the cyt.
cc subunit in the closed position or the absence of LpqE with the cyt. cc subunit in the open position. Subunits are colored as in Figure 1. Please view as a loop.
Video 2
Three-dimensional variability analysis showing movement of superoxide dismutase (SOD) subunit of CIII2CIV2.
Subunits are colored as in Figure 1. Please view as a loop.
Tables
Table 1
Electron cryomicroscopy (CryoEM) structure determination.
| A. CryoEM data acquisition and image processing | |||
|---|---|---|---|
| Data collection | |||
| Electron microscope | Titan Krios G3 | ||
| Camera | Falcon 4 | ||
| Voltage (kV) | 300 | ||
| Nominal magnification | 75,000 | ||
| Calibrated pixel size (Å) | 1.03 | ||
| Total exposure (e/Å2) | 43.5 | ||
| Exposure rate (e/pixel/s) | 5.99 | ||
| Number of exposure fractions | 29 | ||
| Defocus range (μm) | 0.7–2 | ||
| Image processing | |||
| Motion correction software | cryoSPARC v3 | ||
| CTF estimation software | cryoSPARC v3 | ||
| Particle selection software | cryoSPARC v3 | ||
| Micrographs used in inhibitor-free dataset | 4308 | ||
| Micrographs used in telacebec-bound dataset | 2793 | ||
| Particle images selected in inhibitor-free dataset | 1,037,709 | ||
| Particle images selected in telacebec-bound dataset | 387,777 | ||
| 3D map classification and refinement software | cryoSPARC v3 | ||
| B. Model statistics | |||
| Dataset | Inhibitor-free | Telacebec-bound | |
| Associated PDB ID | |||
| Modeling and refinement software | Coot, phenix, ISOLDE | Coot, phenix, ISOLDE | |
| Protein residues | 6058 | 6075 | |
| Ligand | 9 XX: 4, 9Y0: 6, 9YF: 8, FES: 2, HEC: 4, HEA: 4, MQ9: 10, HEM: 4, PLM: 4, CU: 8 | 9 XX: 4, 9Y0: 6, 9YF: 8, FES: 2, HEC: 4, HEA: 4, MQ9: 10, HEM: 4, PLM: 4, CU: 8, QTE: 1 | |
| RMSD bond length (Å) | 0.005 | 0.004 | |
| RMSD bond angle (°) | 0.712 | 0.818 | |
| Ramachandran outliers (%) | 0.22 | 0.2 | |
| Ramachandran favored (%) | 92.58 | 91.52 | |
| Rotamer outliers (%) | 0 | 0 | |
| Clash score | 19.29 | 15.47 | |
| MolProbabity score | 2.25 | 2.20 | |
| EMRinger score | 3.12 | 2.61 | |
Additional files
Download links
A two-part list of links to download the article, or parts of the article, in various formats.
Downloads (link to download the article as PDF)
Open citations (links to open the citations from this article in various online reference manager services)
Cite this article (links to download the citations from this article in formats compatible with various reference manager tools)
Structure of mycobacterial CIII2CIV2 respiratory supercomplex bound to the tuberculosis drug candidate telacebec (Q203)
eLife 10:e71959.
https://doi.org/10.7554/eLife.71959


