Predictors of human-infective RNA virus discovery in the United States, China, and Africa, an ecological study
- Usher Institute, University of Edinburgh, United Kingdom
- Roslin Institute and Royal (Dick) School of Veterinary Studies, University of Edinburgh, United Kingdom
- Department of Medicine, Li Ka Shing Faculty of Medicine, University of Hong Kong, China
Figures
Figure 1
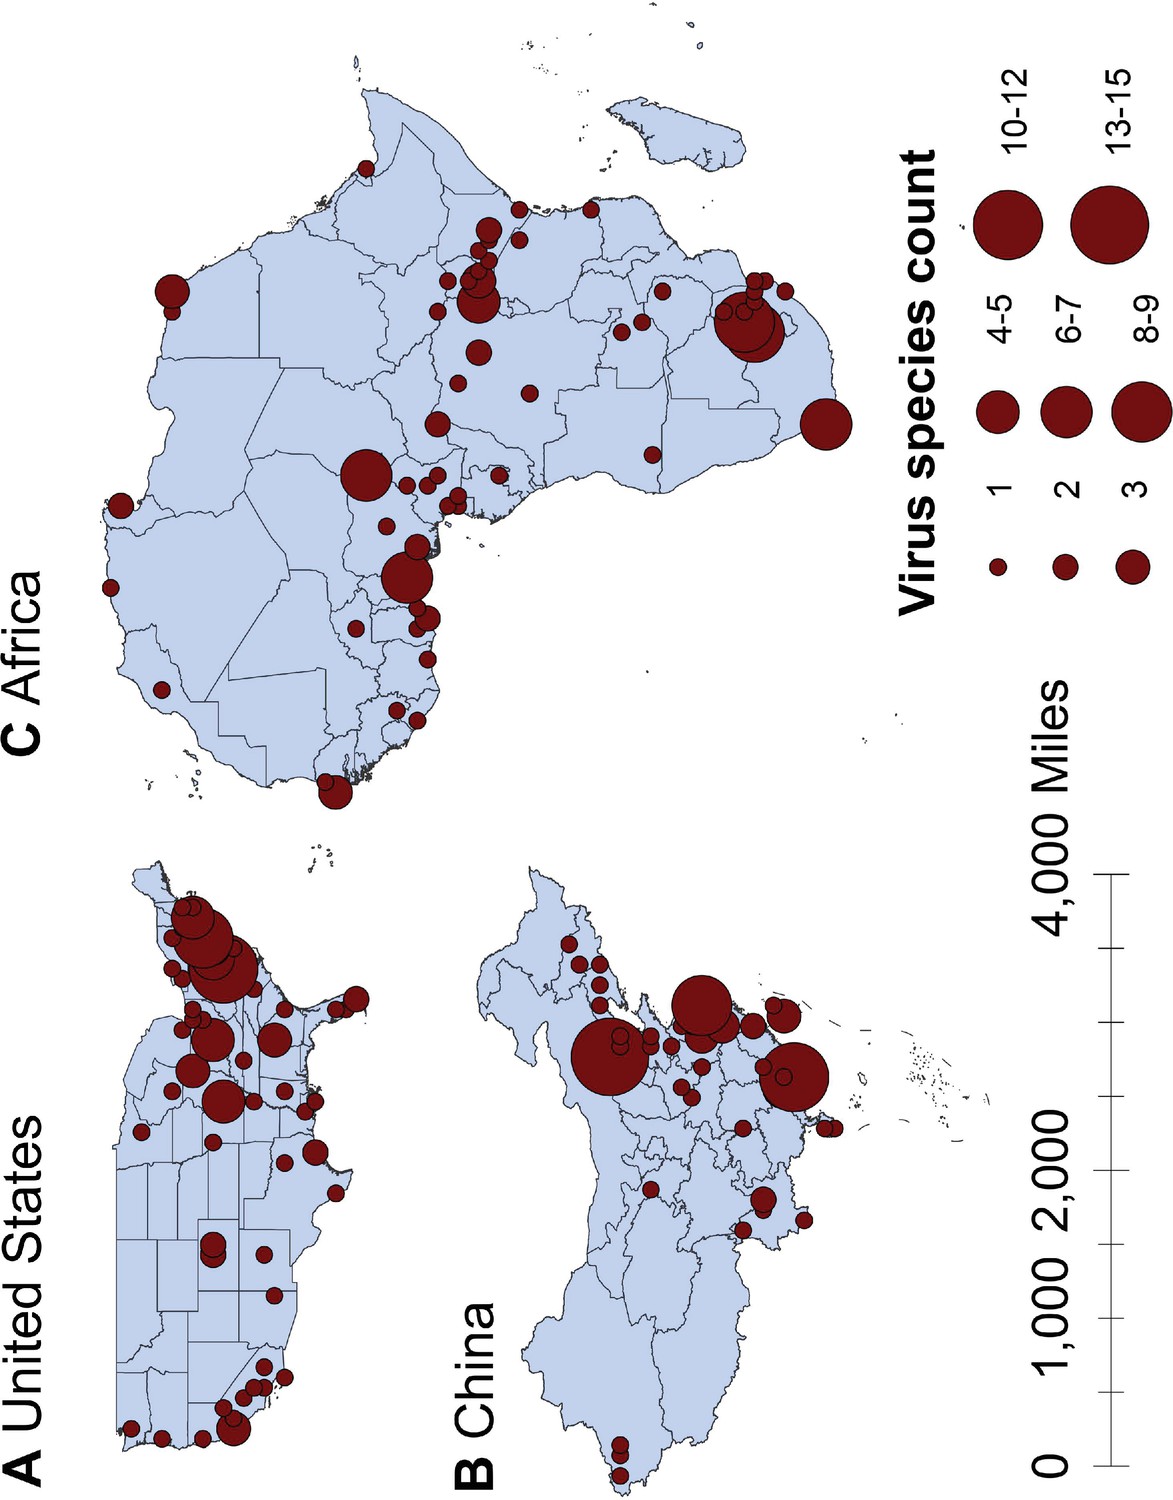
Spatial distribution of human-infective RNA virus discovery in three regions, 1901–2019.
(A) United States. (B) China. (C) Africa. Red dots represent discovery points or centroids of polygons, with the size representing the cumulative virus species count.
Figure 2
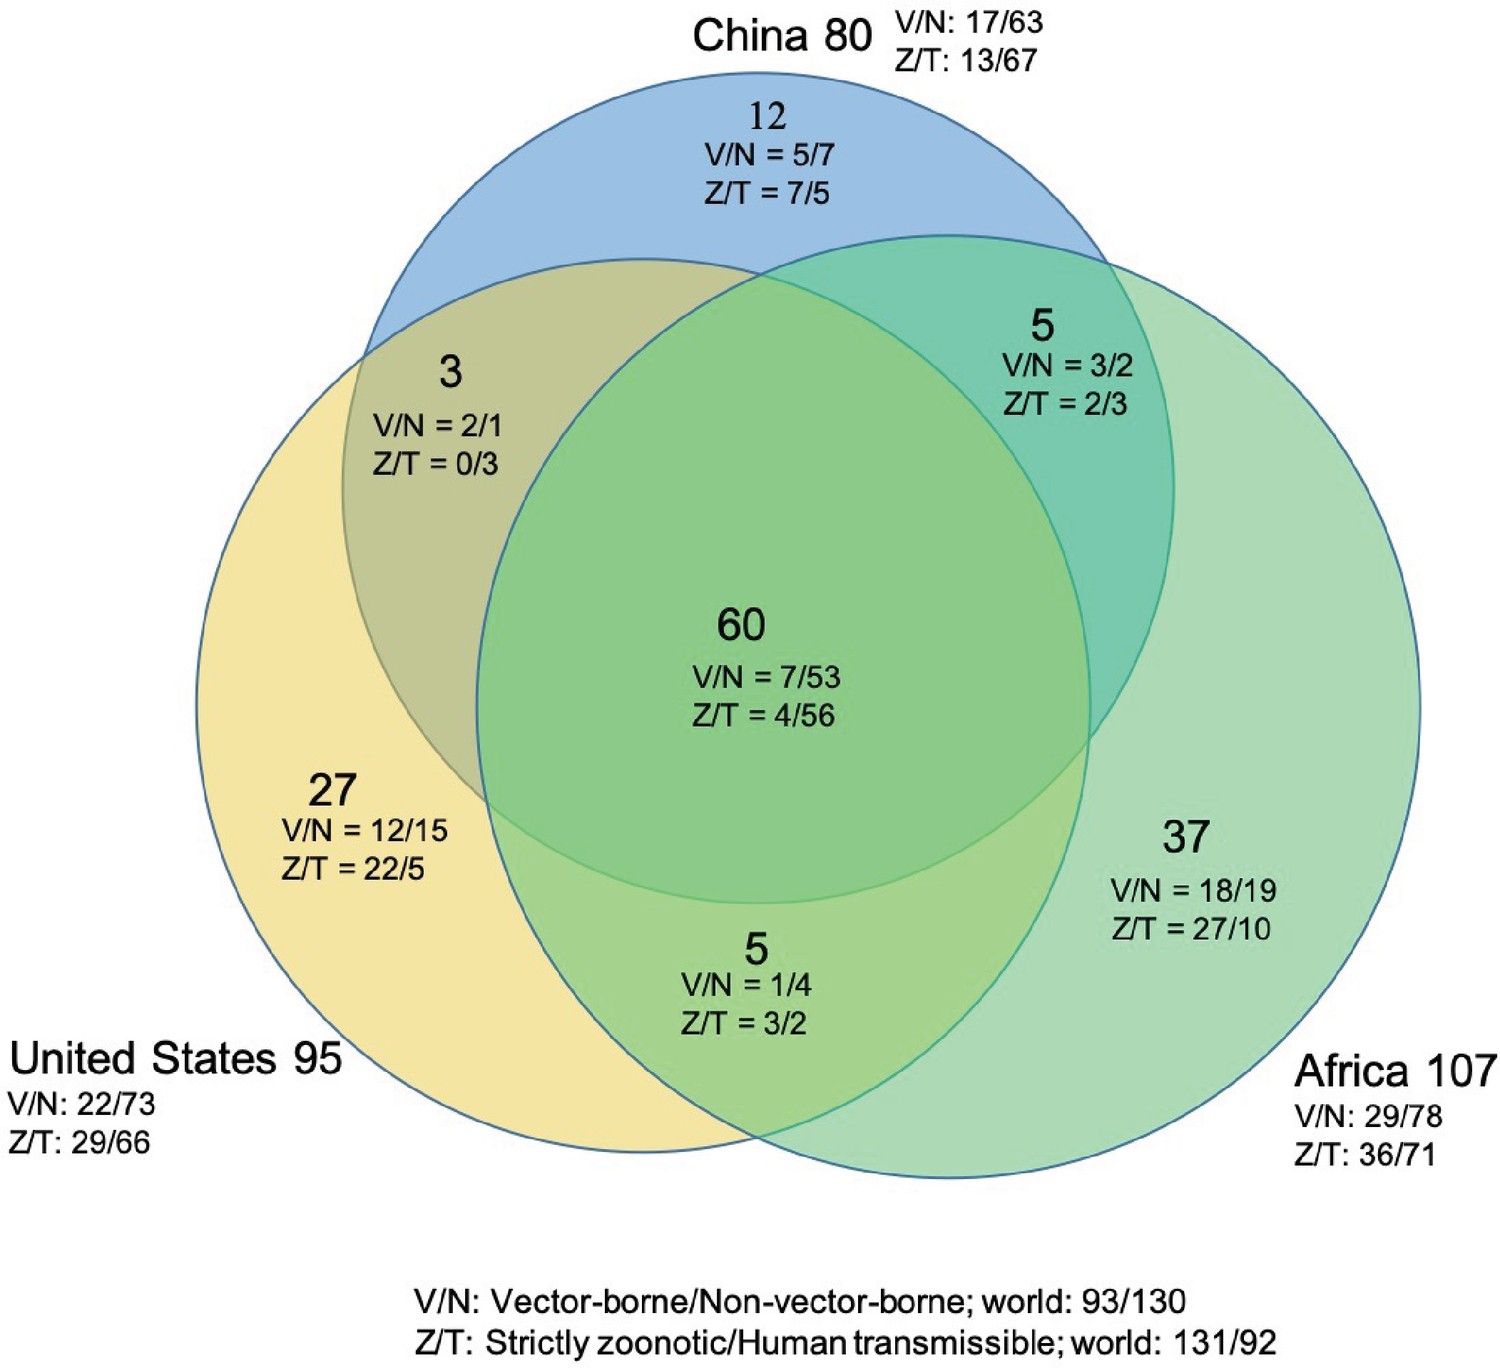
Shared human-infective RNA virus species count in three regions.
Under/By the species count the ratios of vector-borne (V) to non-vector-borne (N) viruses and strictly zoonotic (Z) to human transmissible (T) viruses were shown.
Figure 3
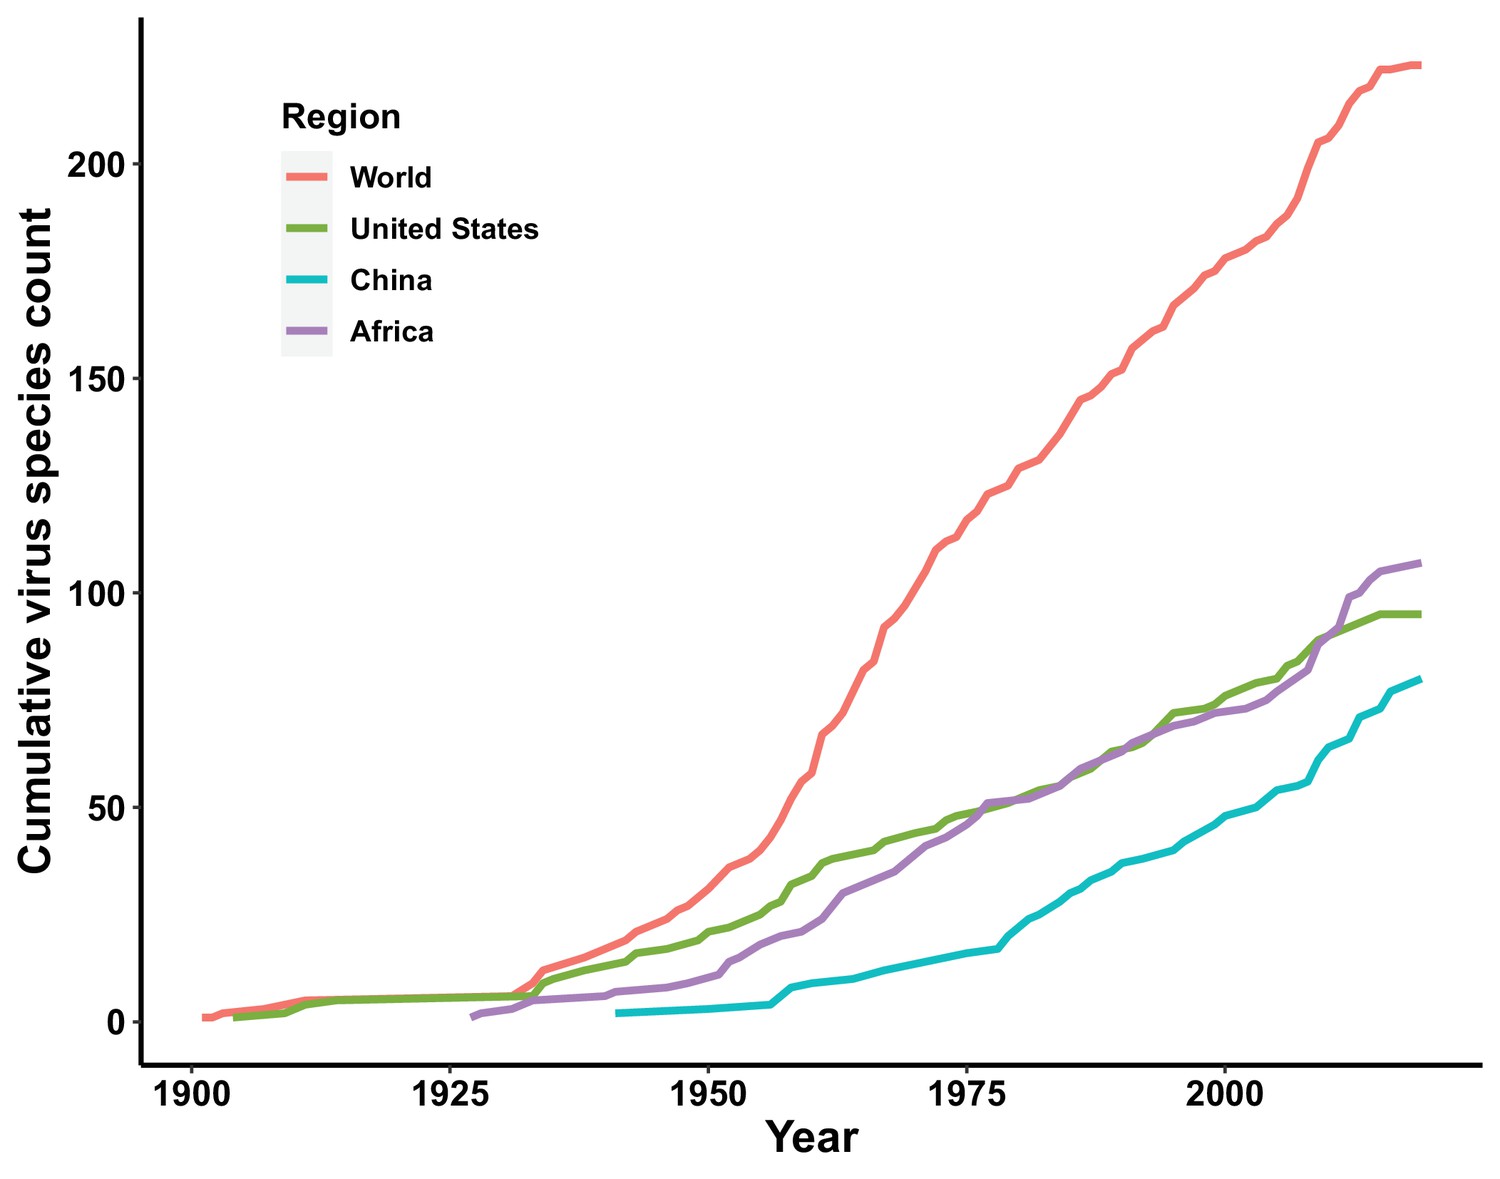
Discovery curve of human-infective RNA virus species in three regions and the world.
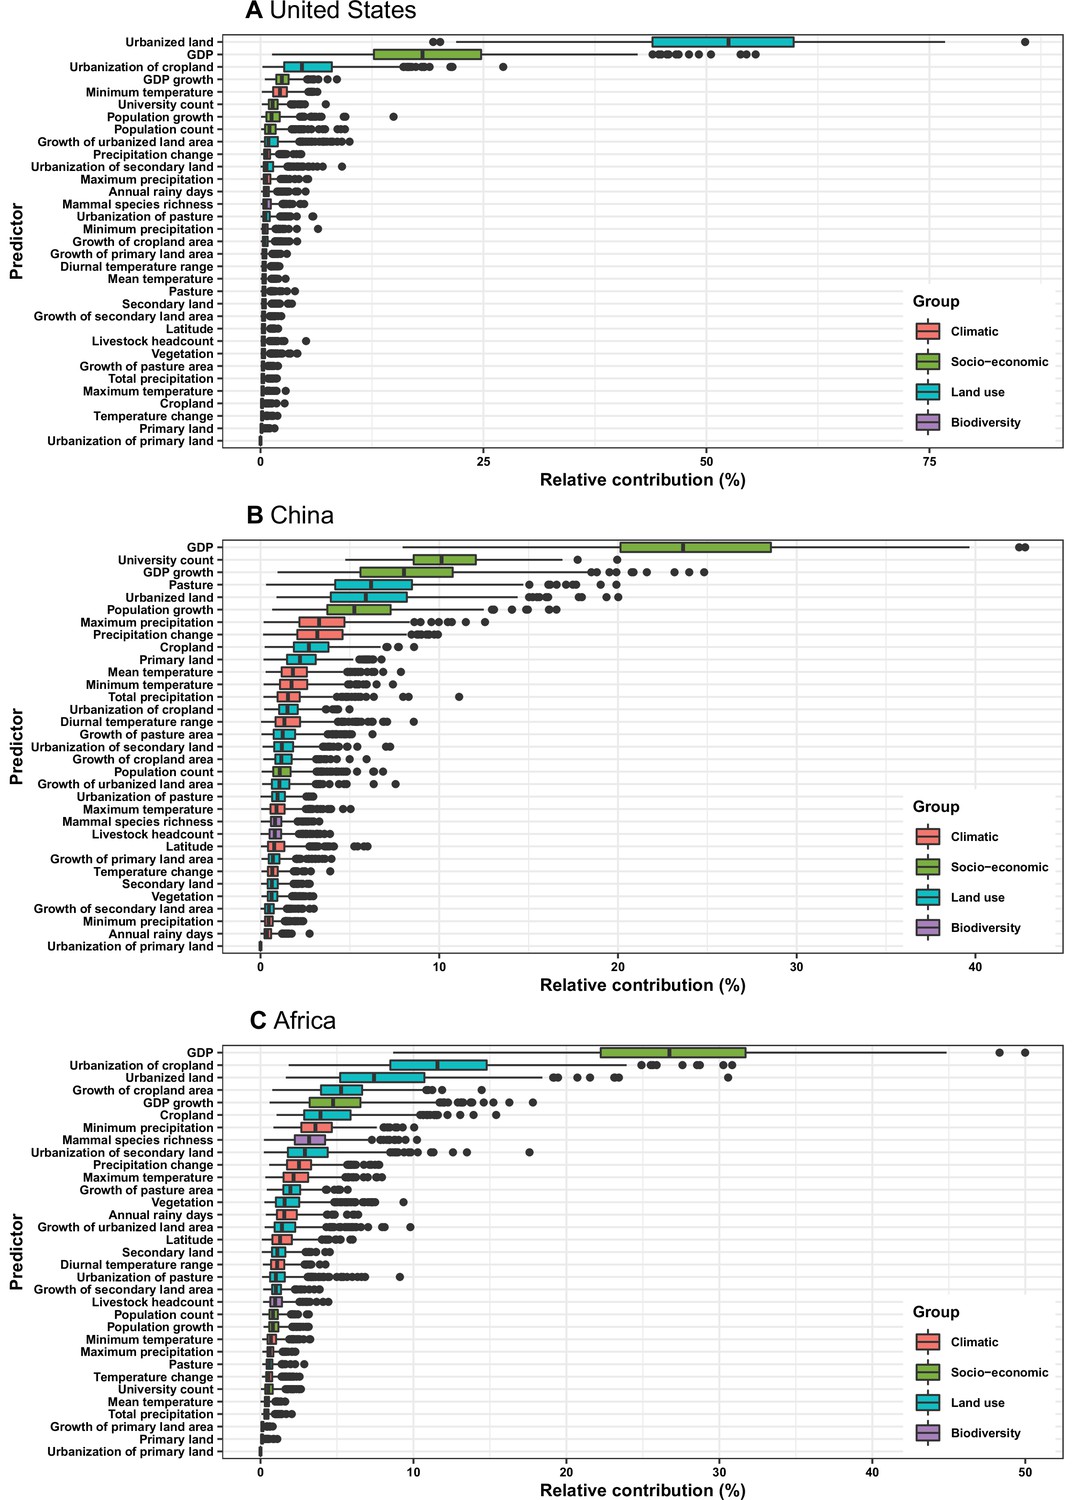
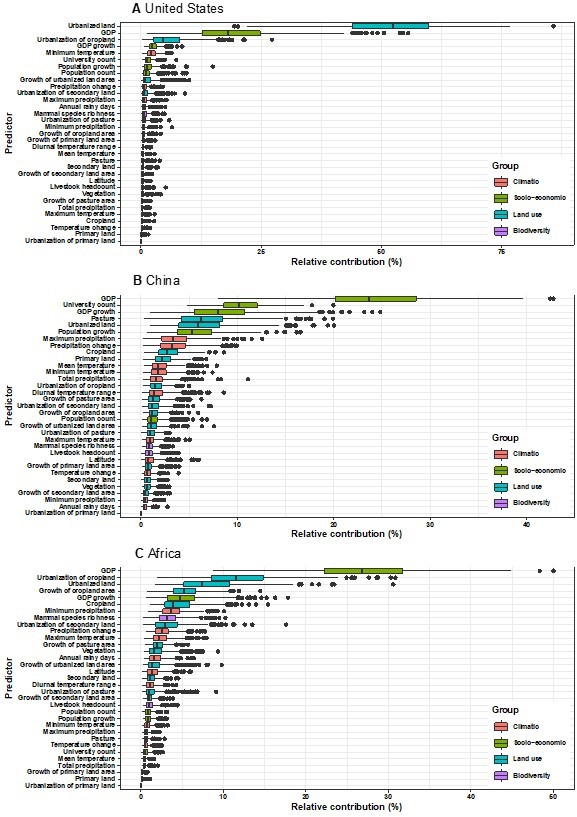
Figure 4
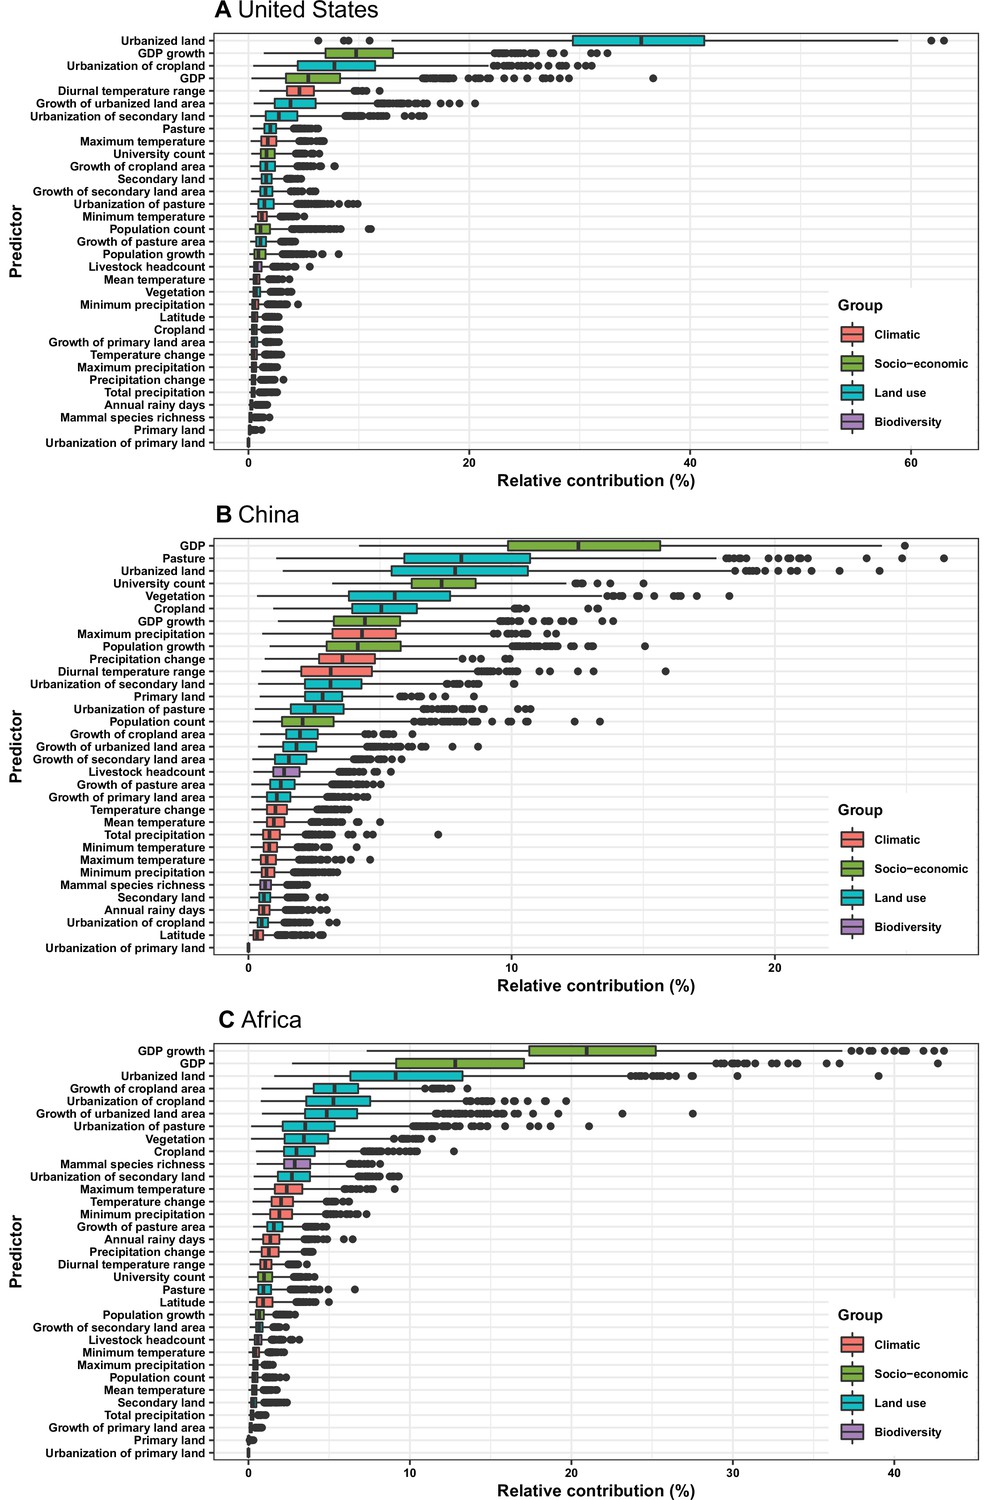
Relative contribution of predictors to human-infective RNA virus discovery in three regions.
(A) United States. (B) China. (C) Africa. The boxplots show the median (black bar) and interquartile range (box) of the relative contribution across 1000 replicate boosted regression tree models, with whiskers indicating minimum and maximum and black dots indicating outliers.
Figure 5
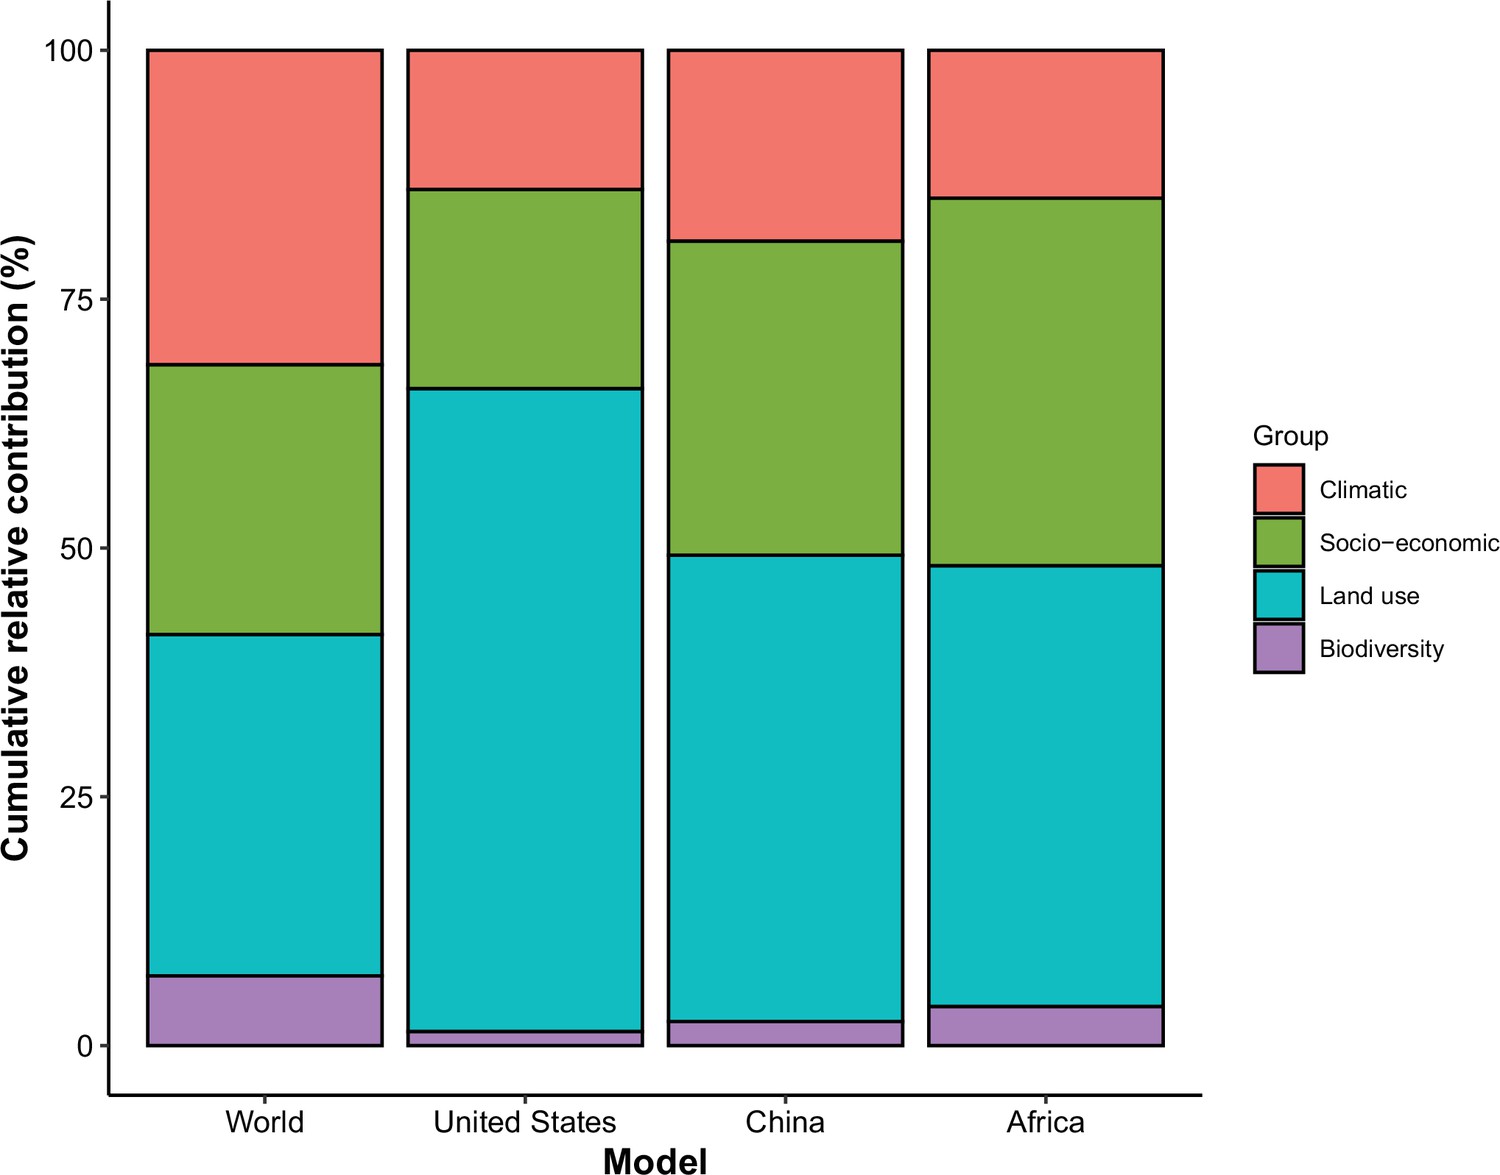
Cumulative relative contribution of predictors to human-infective RNA virus discovery by group in each model of different regions.
The relative contributions of all explanatory factors sum to 100% in each model, and each colour represents the cumulative relative contribution of all explanatory factors within each group.
Figure 6
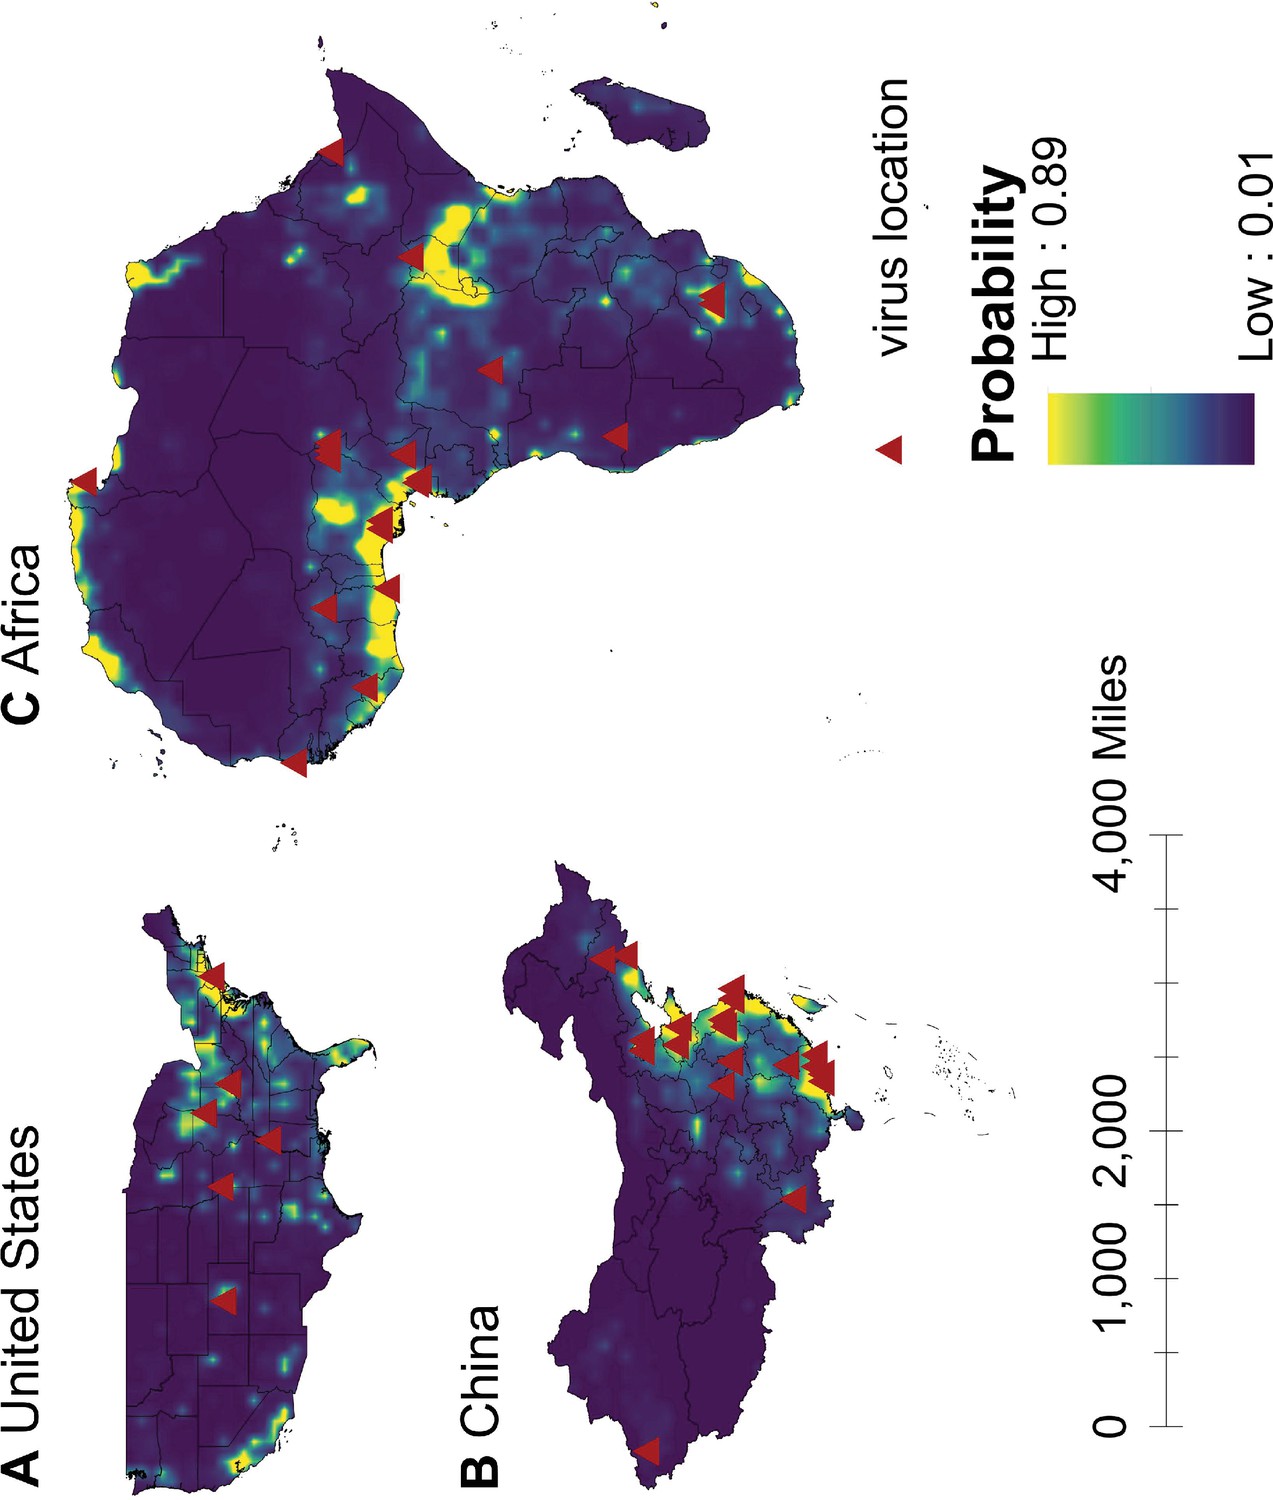
Predicted probability of human-infective RNA virus discovery in three regions in 2010–2019.
(A) United States. (B) China. (C) Africa. The triangles represented the actual discovery sites from 2010 to 2019, and the background colour represented the predicted discovery probability.
Appendix 3—figure 1

Relationship between published human-infective RNA virus count and total number of papers from the journals which published all human-infective RNA viruses in Web of Science.
(A) Total number of papers vs. published human virus count; (B) Total number of papers on viruses vs. published human virus count; (C) Total number of papers vs. total number of papers on viruses; (D) Percent of papers on viruses in each journal. Journal of Infectious Diseases (JID) is highlighted in blue.
Appendix 3—figure 2
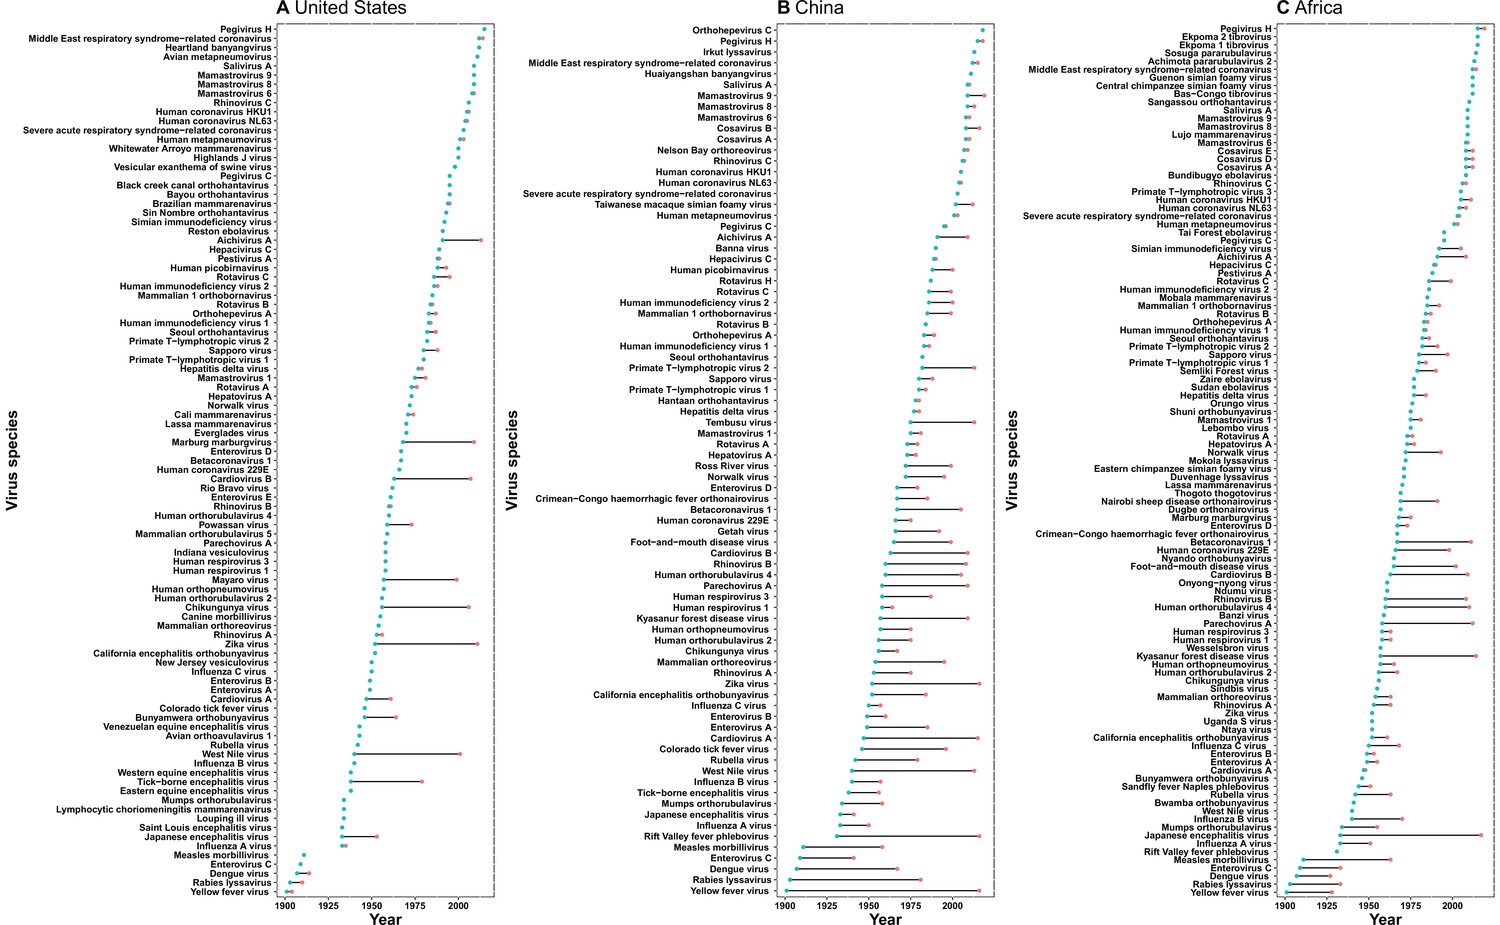
Time lag of human-infective RNA virus discovery between the three regions and the world.
(A) United States. (B) China. (C) Africa. The blue dots represent the original discovery year of each virus in the world; the red dots represent the discovery year of each virus in three regions; and the segments between them represent the time lag.
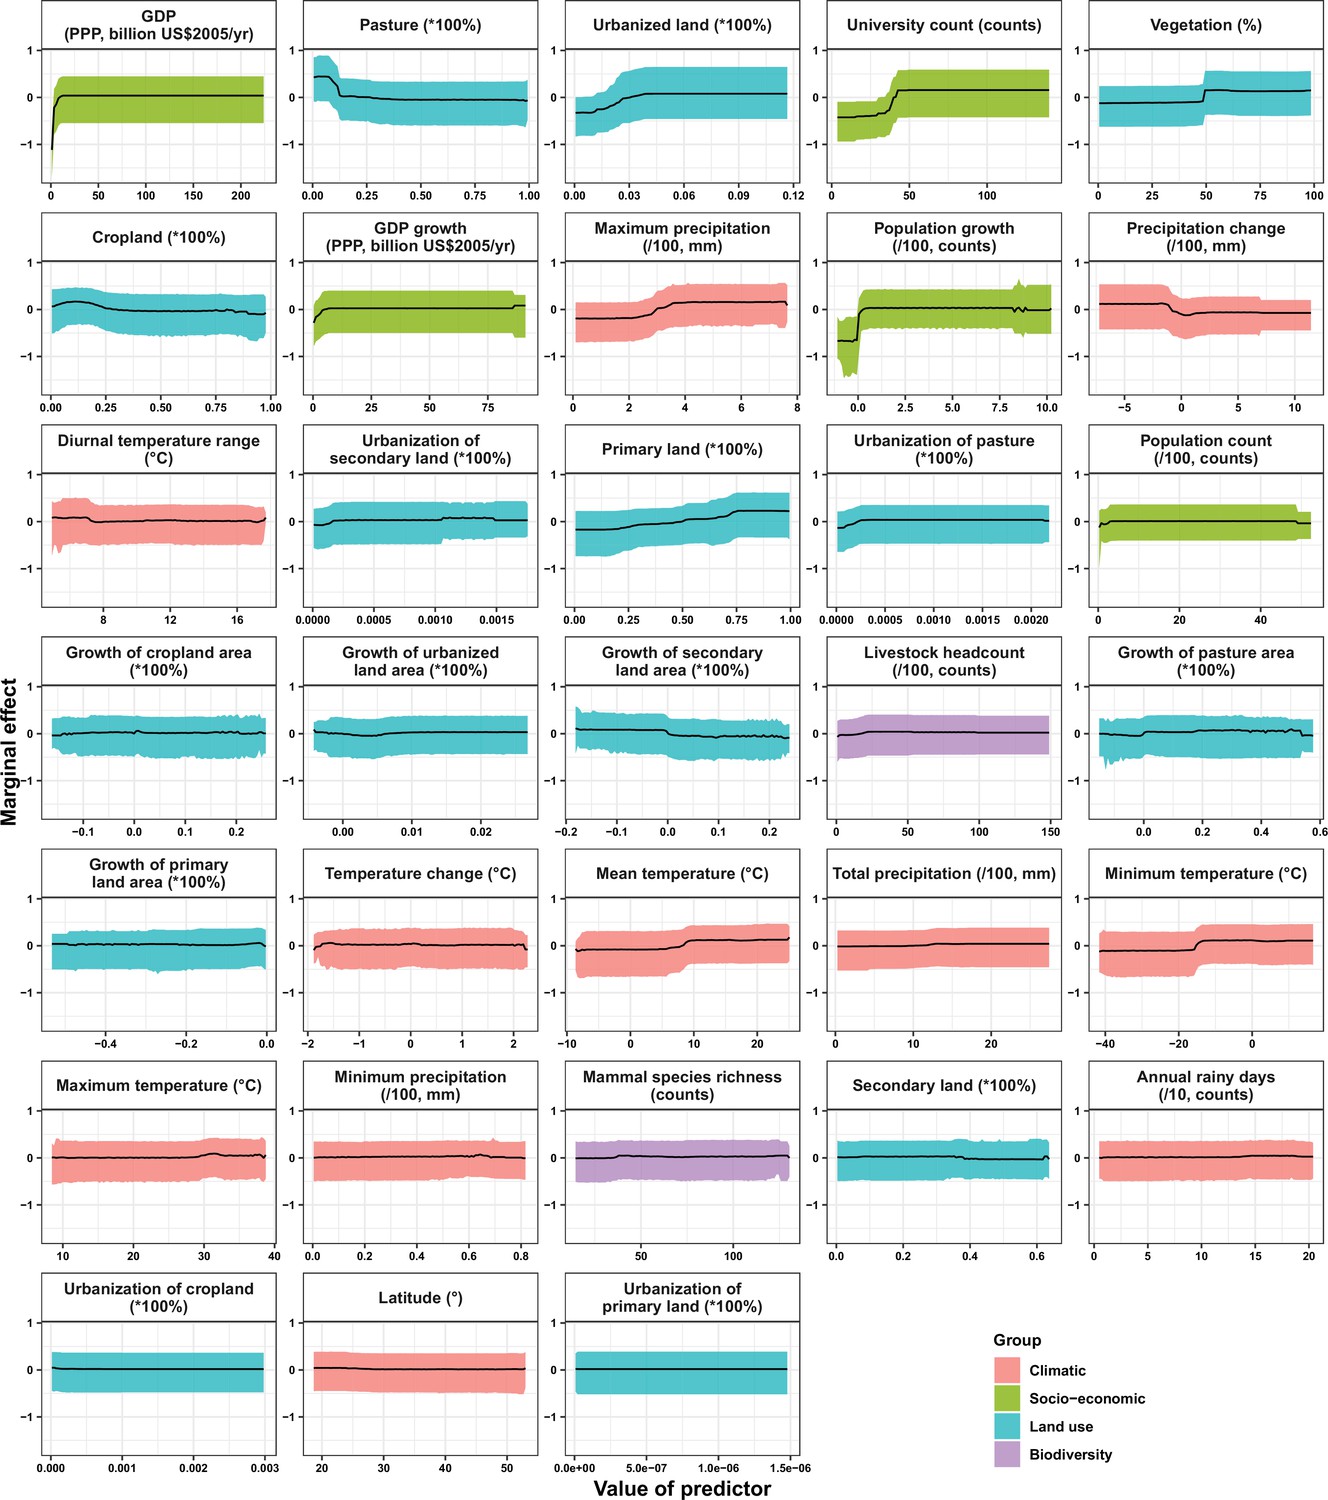
Appendix 3—figure 3
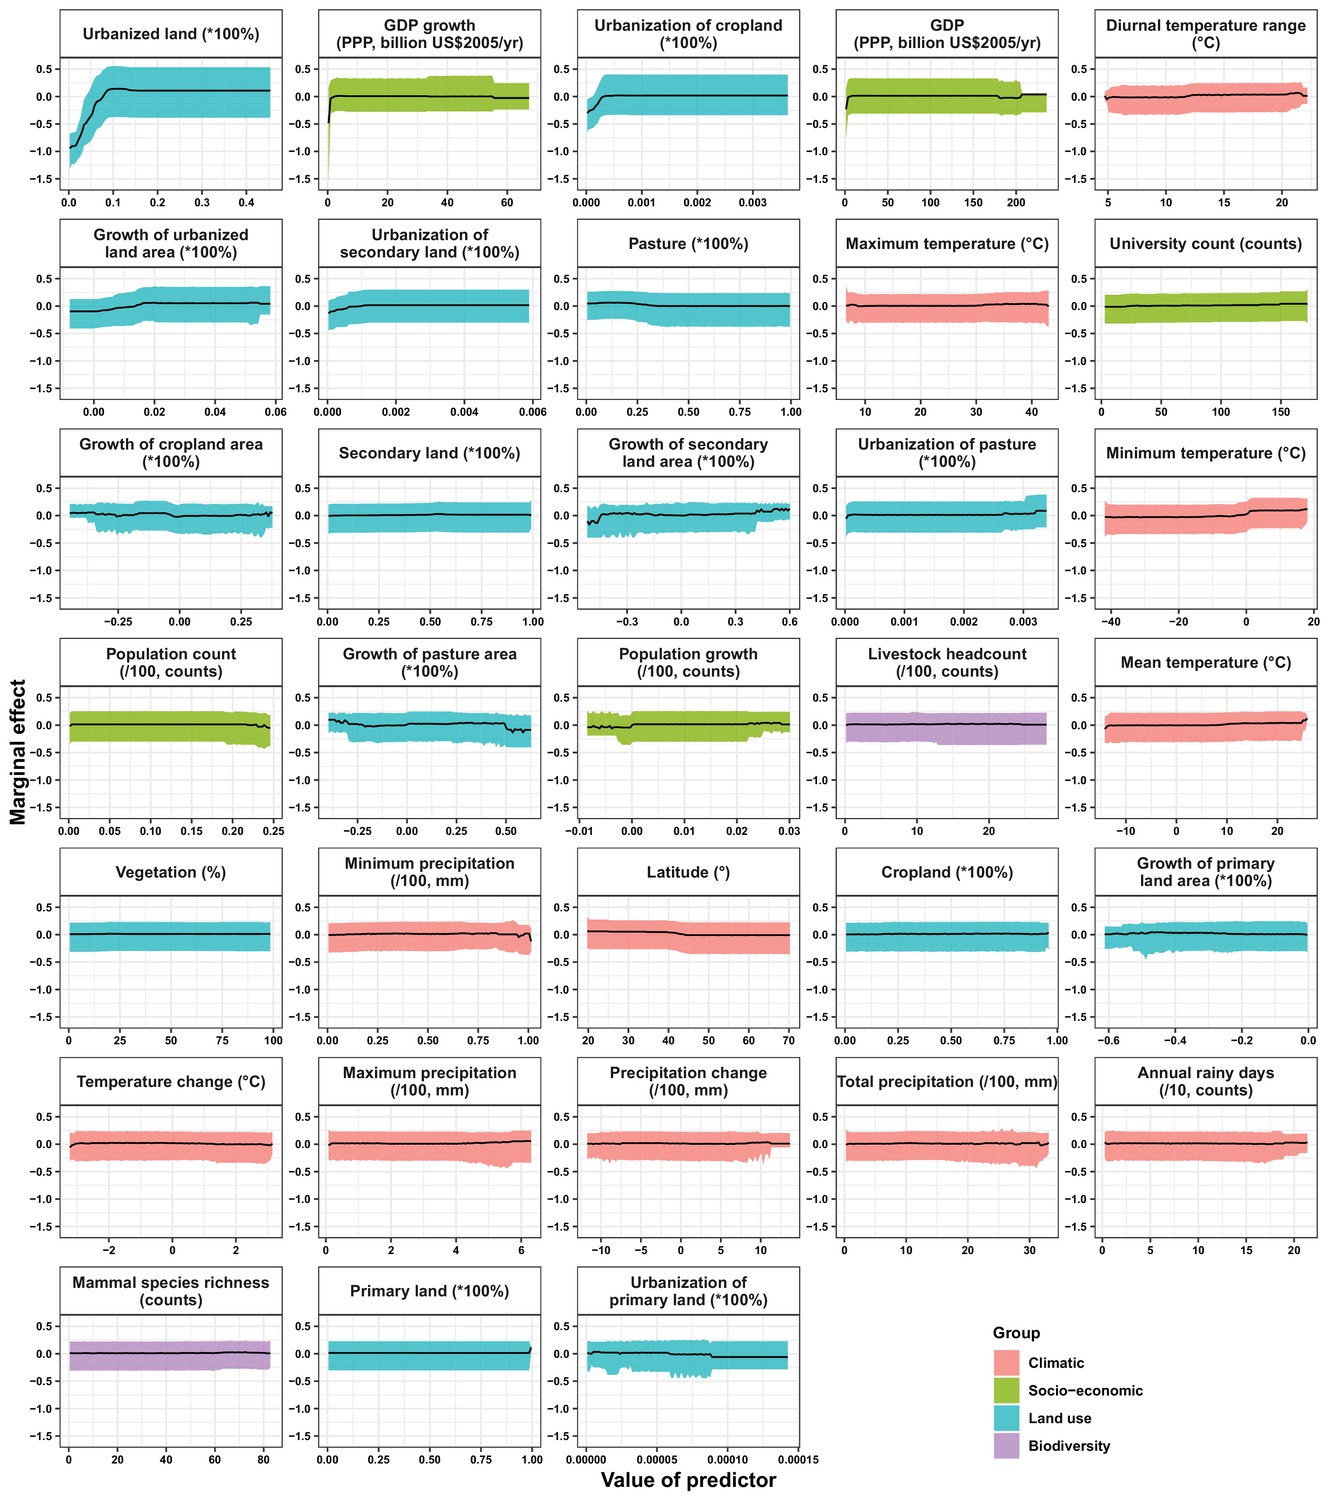
Partial dependence plots showing the influence on human-infective RNA virus discovery for all predictors in the Unites States.
Partial dependence plots show the effect of an individual predictor over its range on the response after factoring out other predictors. Fitted lines represent the median (black) and 95% quantiles (coloured) based on 1000 replicated boosted regression tree models. Y axes are centred around the mean without scaling. X axes show the range of sampled values of predictors.
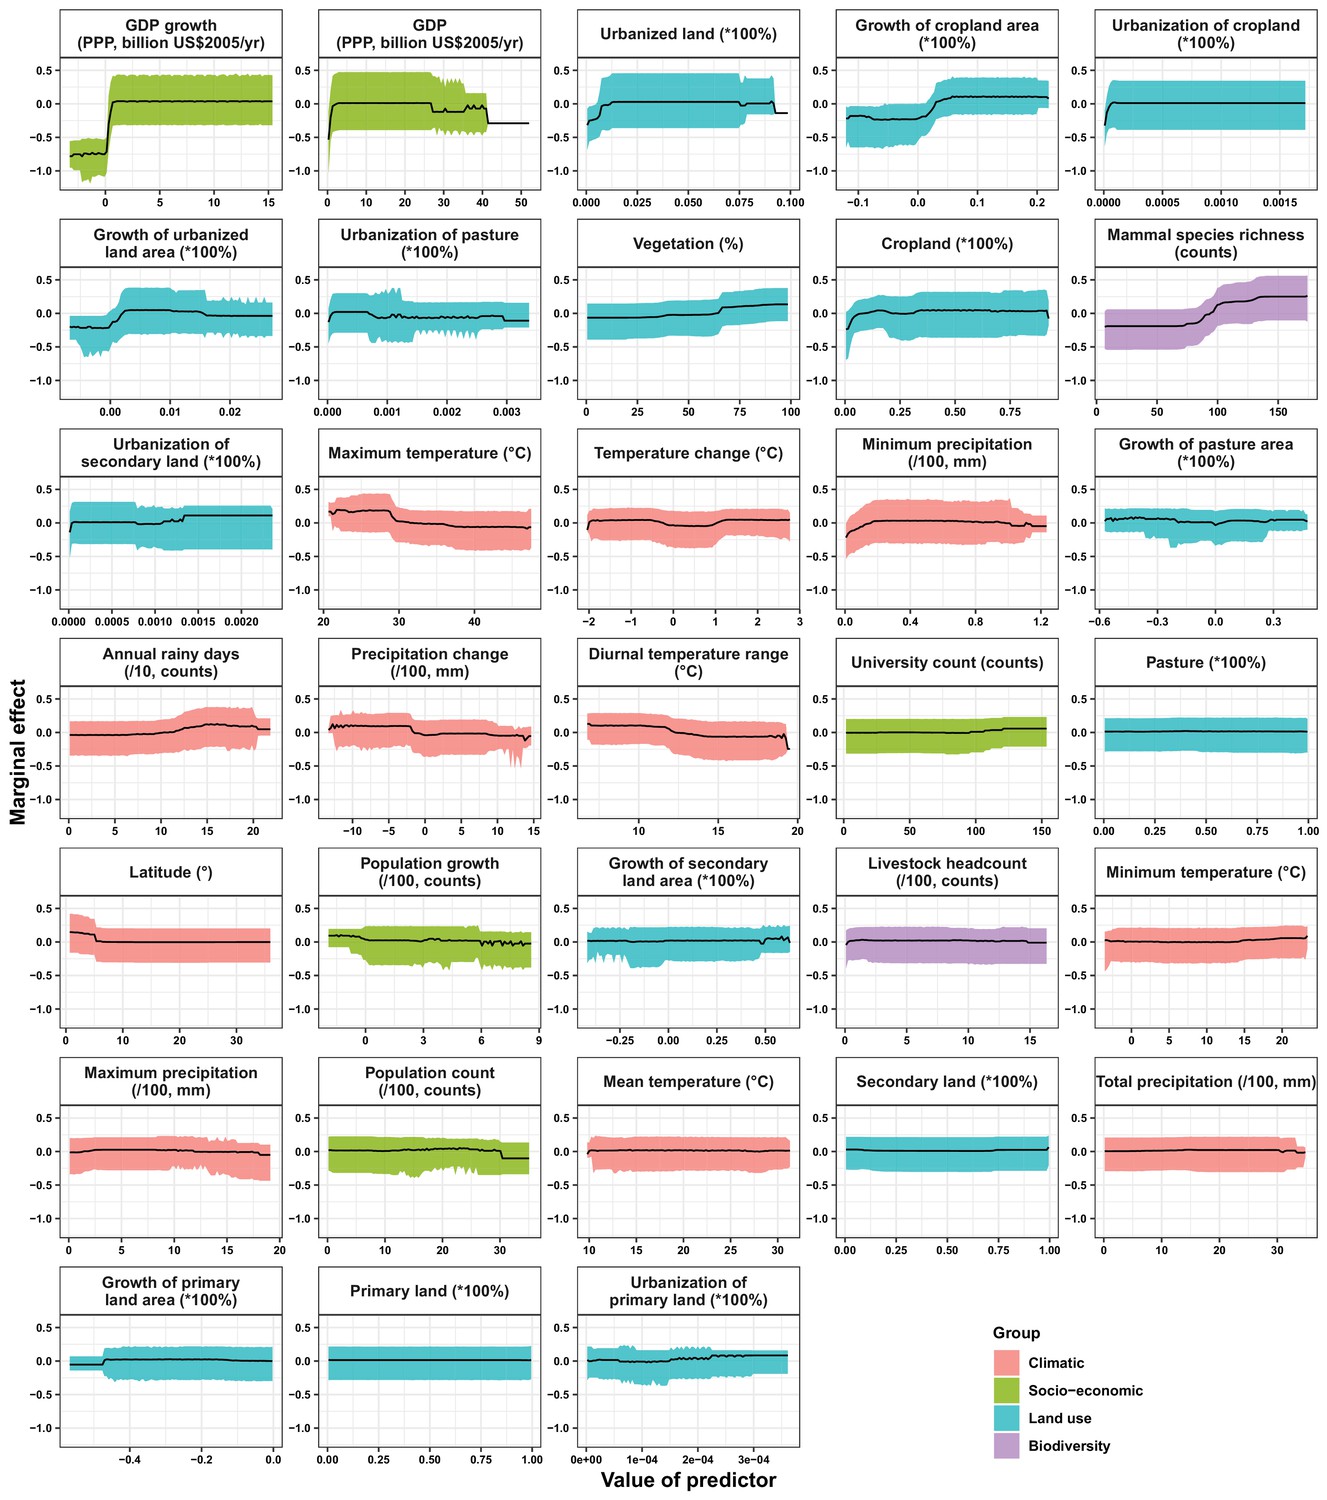
Appendix 3—figure 4
Partial dependence plots showing the influence on human-infective RNA virus discovery for predictors in China.
Partial dependence plots show the effect of an individual predictor over its range on the response after factoring out other predictors. Fitted lines represent the median (black) and 95% quantiles (coloured) based on 1000 replicated boosted regression tree models. Y axes are centred around the mean without scaling. X axes show the range of sampled values of predictors.
Appendix 3—figure 5
Partial dependence plots showing the influence on human-infective RNA virus discovery for all predictors in Africa.
Partial dependence plots show the effect of an individual predictor over its range on the response after factoring out other predictors. Fitted lines represent the median (black) and 95% quantiles (coloured) based on 1000 replicated boosted regression tree models. Y axes are centred around the mean without scaling. X axes show the range of sampled values of predictors.
Appendix 3—figure 6

Moran’s I across different spherical distances.
(A) United States; (B) China; (C) Africa. The solid line and dots represented the median Moran’s I value, and the grey area represented its 95% quantiles generated from 1000 samples (Blue: Raw virus data) or replicate boosted regression tree (BRT) models (Red: Model residuals). We used the fixed spherical distance as the neighbourhood weights—as there is no general consensus for selecting cut-off values, we chose spherical distances ranging from one time to fifteen times of distance of 1° grid cell at the equator, i.e. 110km to 1650km, considering the area of three regions. Our BRT models reduced Moran’s I value from a range of 0.19–0.50 for the raw virus data to 0.009–0.04 for the model residuals in the United States (A), 0.11–0.45 to –0.01–0.09 in China (B), 0.05–0.31 to –0.004–0.15 in Africa (C), suggesting that BRT models with 33 predictors have adequately accounted for spatial autocorrelations in the raw virus data in all three regions.
Appendix 3—figure 7
Relative contribution of predictors to human-infective RNA virus discovery in three regions.
Virus discovery data were matched to time-varying covariate data by year. (A) United States. (B) China. (C) Africa. The boxplots show the median (black bar) and interquartile range (box) of the relative contribution across 1000 replicate boosted regression tree models, with whiskers indicating minimum and maximum and black dots indicating outliers.
Appendix 3—figure 8

Relative contribution of predictors to human-infective RNA virus discovery in three regions.
Virus discovery data at year t were matched to time-varying covariate data at year t-1. (A) United States. (B) China. (C) Africa. The boxplots show the median (black bar) and interquartile range (box) of the relative contribution across 1000 replicate boosted regression tree models, with whiskers indicating minimum and maximum and black dots indicating outliers.
Appendix 3—figure 9
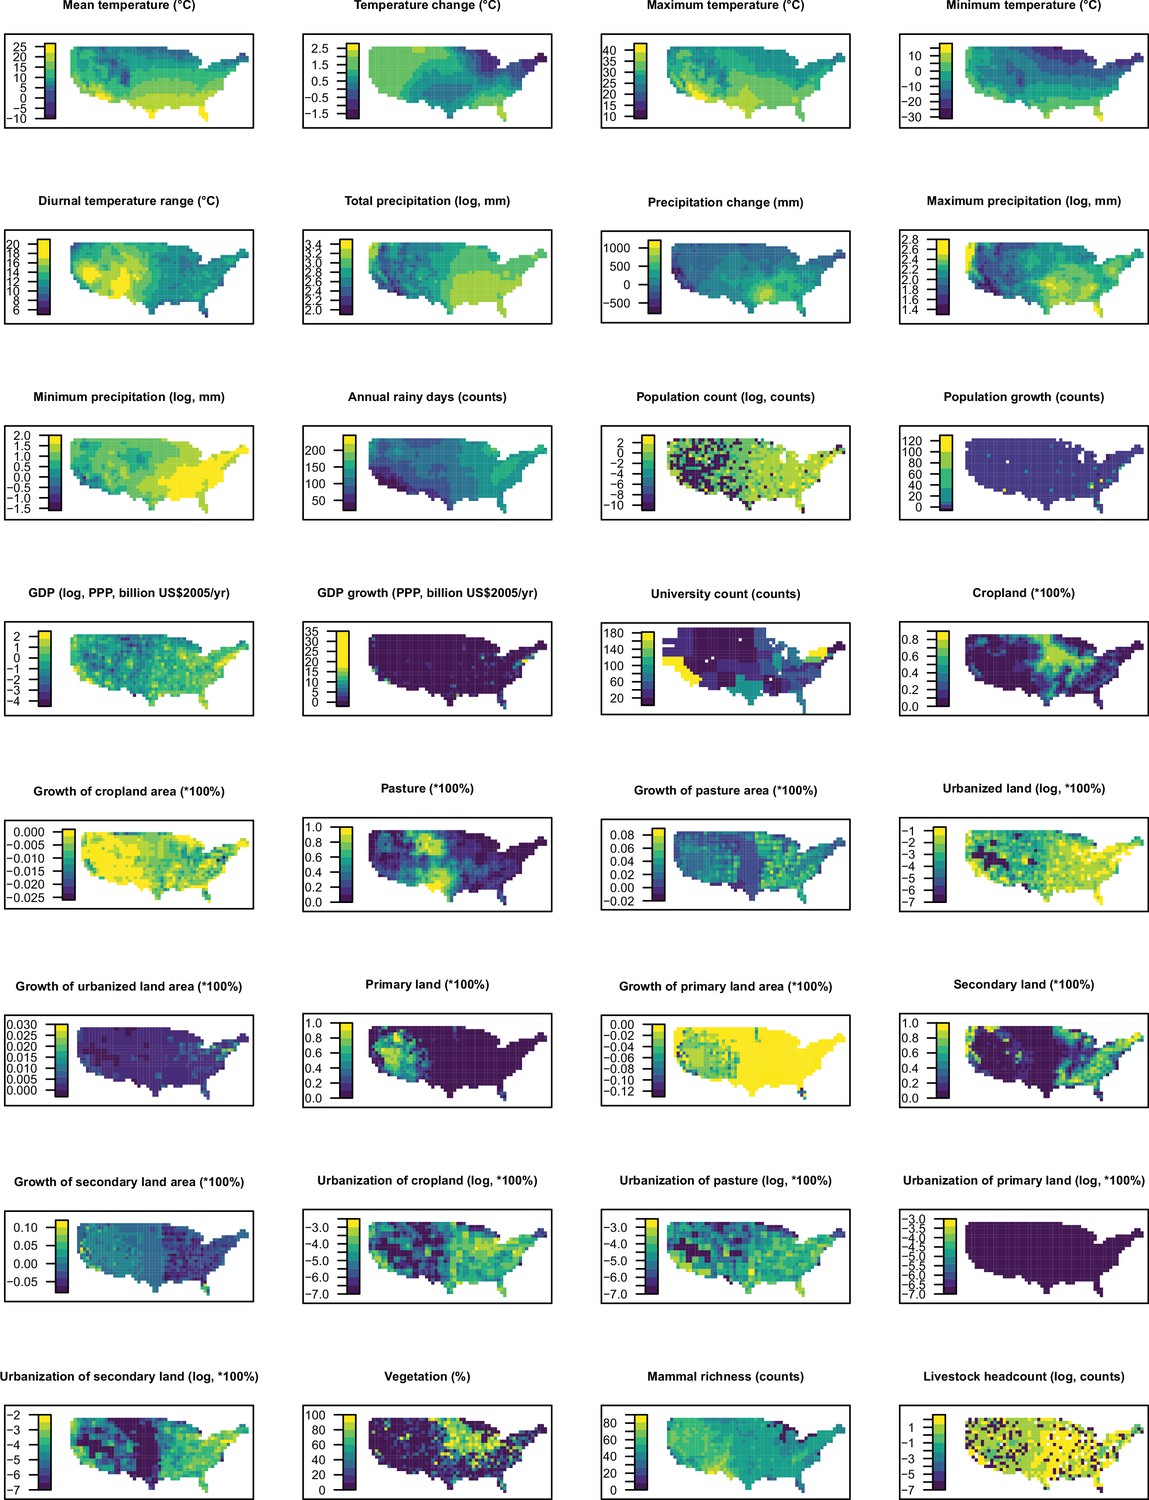
Distribution maps for 32 predictors in 2015 in the United States.
The values of these explanatory variables and latitude in each grid cell were used to predict the virus discovery in the corresponding grid cell in the Unites States in 2010–2019. Explanatory variables were log transformed where necessary to get better visualization, not meaning they entered the model by logged values.
Appendix 3—figure 10
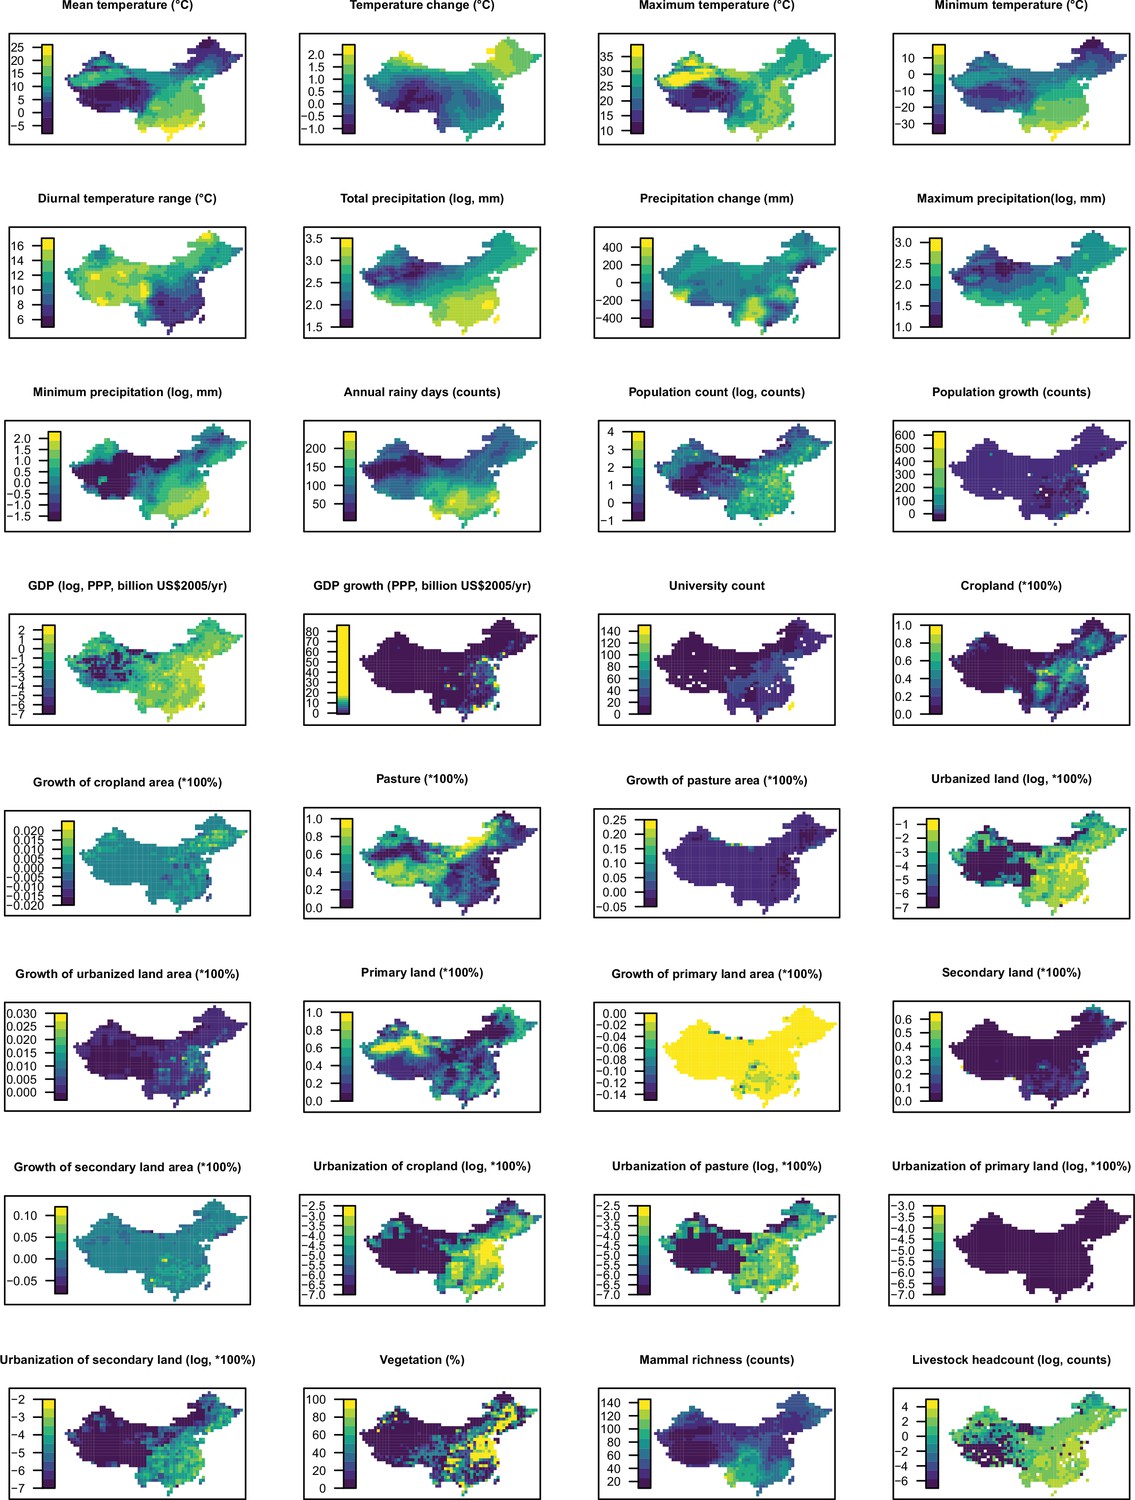
Distribution maps for 32 predictors in 2015 in China.
The values of these explanatory variables and latitude in each grid cell were used to predict the virus discovery in the corresponding grid cell in China in 2010–2019. Explanatory variables were log transformed where necessary to get better visualization, not meaning they entered the model by logged values.
Appendix 3—figure 11
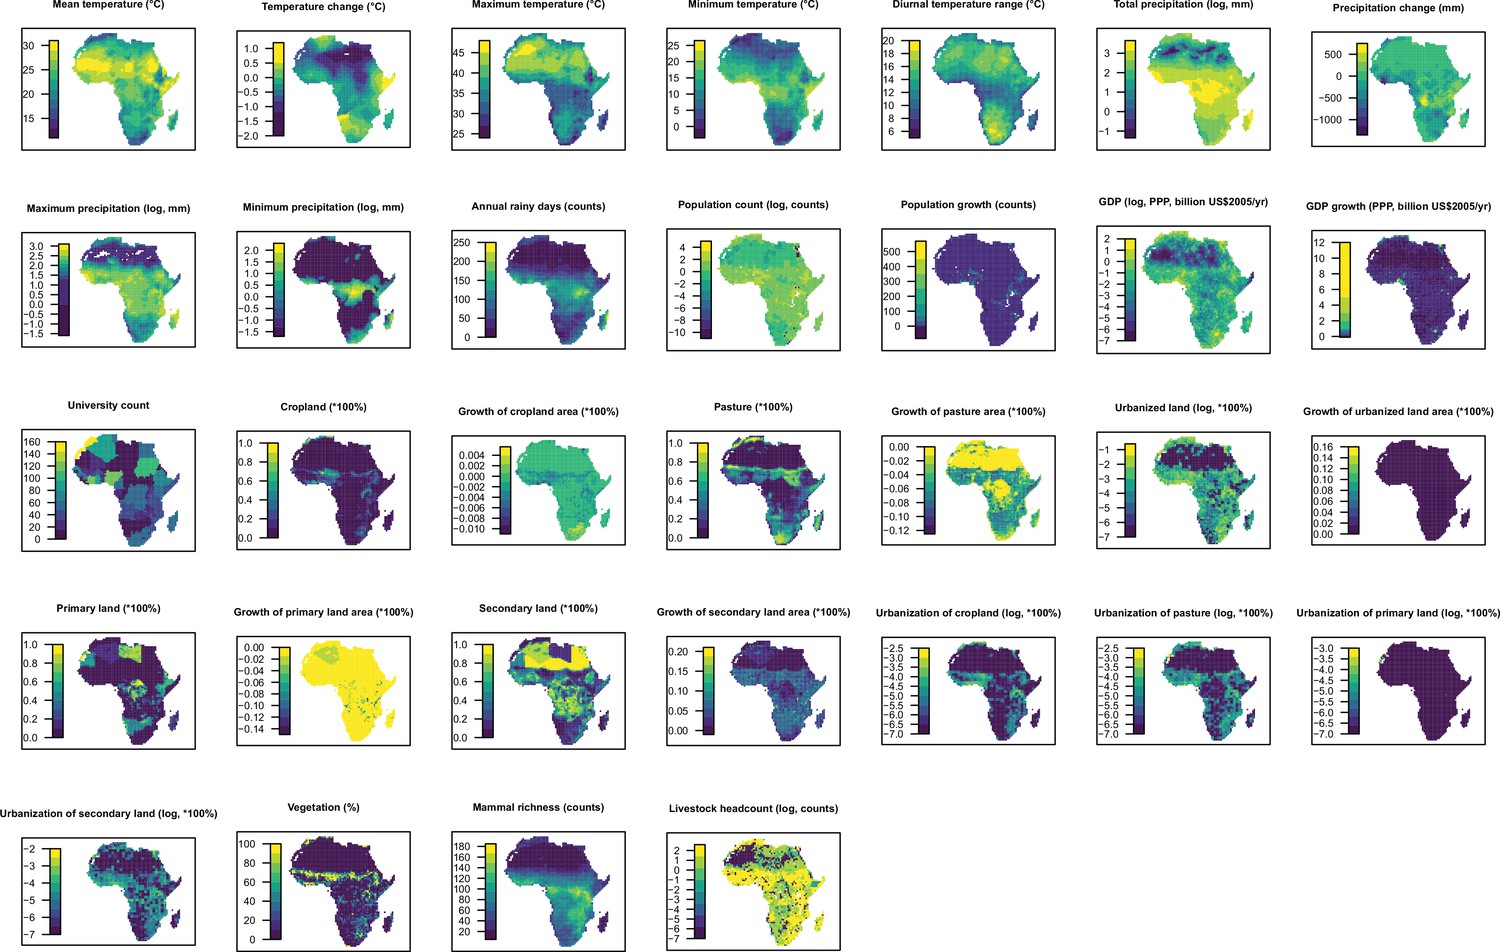
Distribution maps for 32 predictors in 2015 in Africa.
The values of these explanatory variables and latitude in each grid cell were used to predict the virus discovery in the corresponding grid cell in Africa in 2010–2019. Explanatory variables were log transformed where necessary to get better visualization, not meaning they entered the model by logged values.
Appendix 3—figure 12
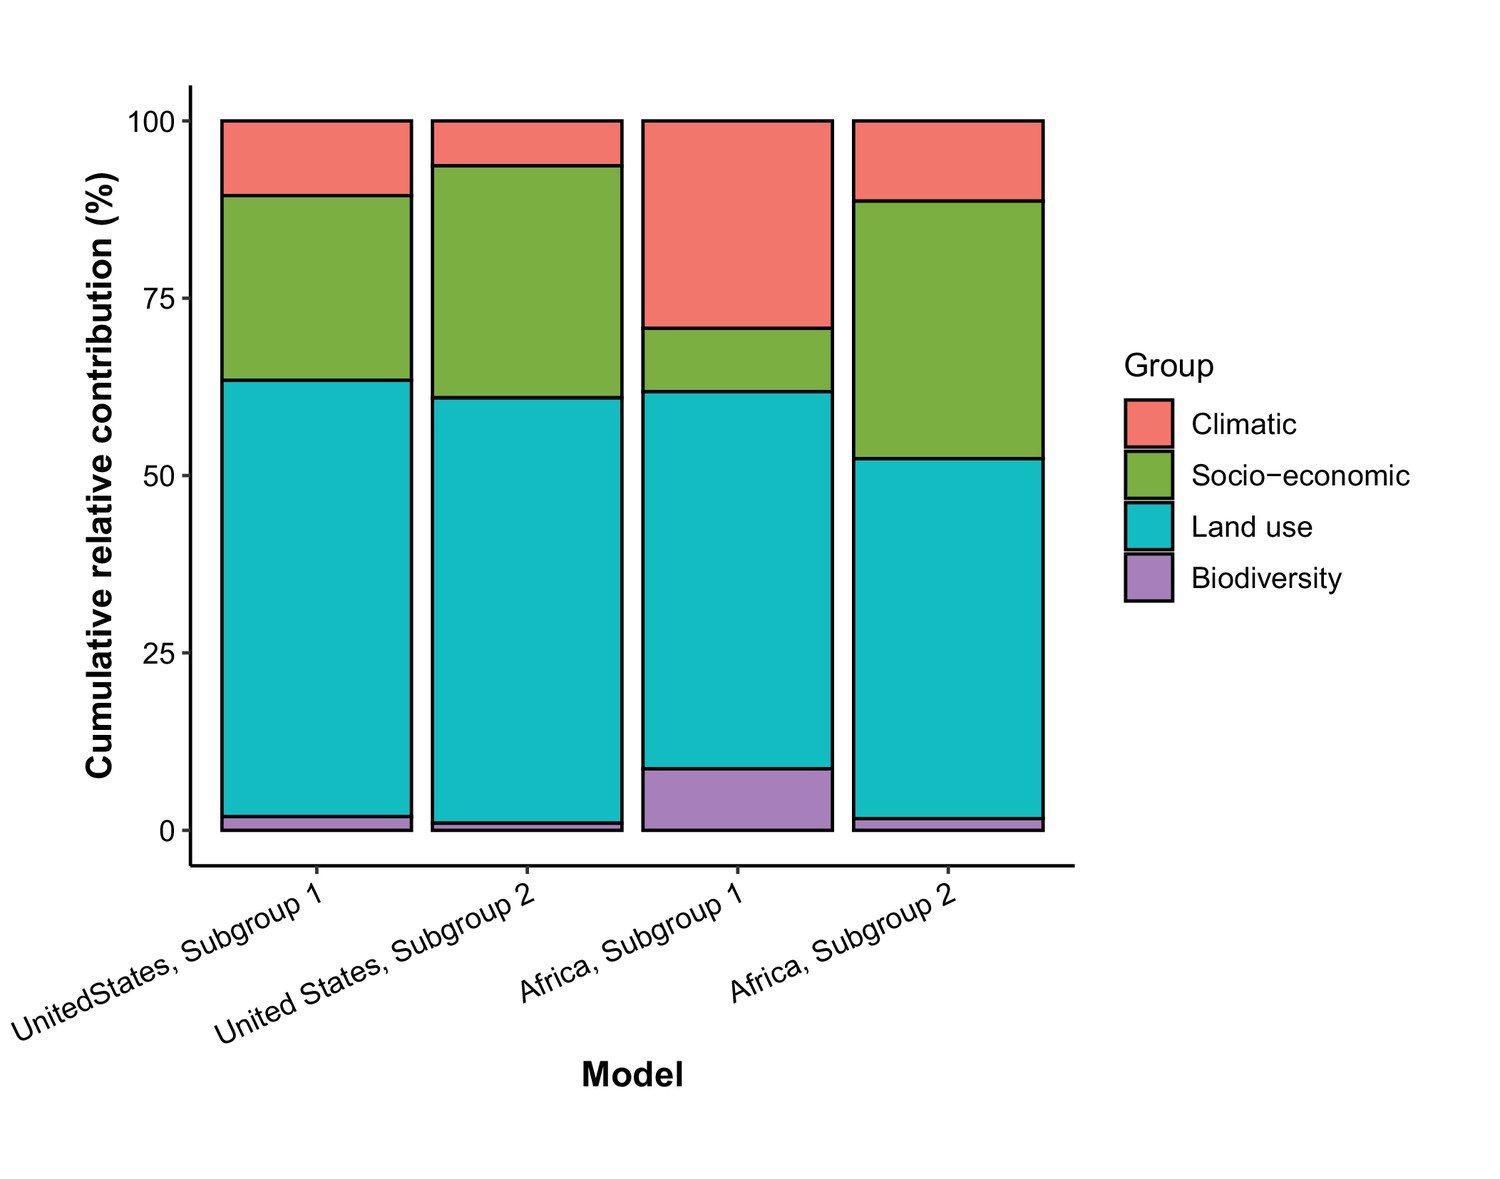
Cumulative relative contribution of predictors to human-infective RNA virus discovery by group in each model of subgroups.
Subgroup 1 represents viruses firstly discovered from the region (United States or Africa); Subgroup 2 represents viruses firstly discovered elsewhere in the world. In the United States, virus count of Subgroup 1 and Subgroup 2 were 52 and 43, respectively. In Africa, virus count of Subgroup 1 and Subgroup 2 were 39 and 68, respectively. The relative contributions of all explanatory factors sum to 100% in each model, and each colour represents the cumulative relative contribution of all explanatory factors within each group.
Author response image 1

Relationship between published human-infective RNA virus count and total number of papers from the journals which published all human-infective RNA viruses in Web of Science.
A, total number of papers vs. published human virus count; B, total number of papers on viruses vs. published human virus count; C, total number of papers vs. total number of papers on viruses; D, Percent of papers on viruses in each journal. (J) Infect Dis (JID) is highlighted in blue.
Author response image 2
Relative contribution of predictors to human-infective RNA virus discovery in three regions.
Virus discovery data were matched to time-varying covariate data by year. (A) United States. (B) China. (C) Africa. The boxplots show the median (black bar) and interquartile range (box) of the relative contribution across 1000 replicate models, with whiskers indicating minimum and maximum and black dots indicating outliers.
Author response image 3

Relative contribution of predictors to human-infective RNA virus discovery in three regions.
Virus discovery data at year t were matched to time-varying covariate data at year t-1. (A) United States. (B) China. (C) Africa. The boxplots show the median (black bar) and interquartile range (box) of the relative contribution across 1000 replicate models, with whiskers indicating minimum and maximum and black dots indicating outliers.
Author response image 4

Correlation matrix for predictors.
Positive correlations are displayed in blue and negative correlations in red colour. Spearman’s rank correlation test was used. Colour intensity is proportional to the correlation coefficients.
Author response image 5
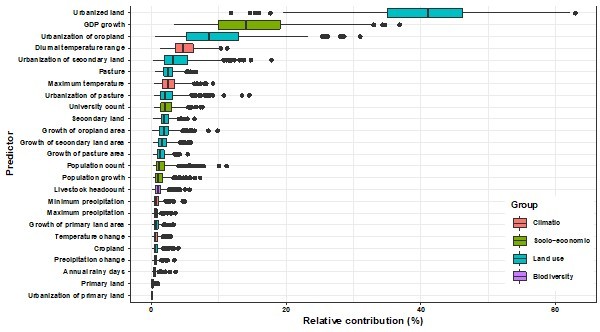
Relative contribution of predictors to human-infective RNA virus discovery in the United States by removing high-correlated predictors.
The boxplots show the median (black bar) and interquartile range (box) of the relative contribution across 1000 replicate models, with whiskers indicating minimum and maximum and black dots indicating outliers.
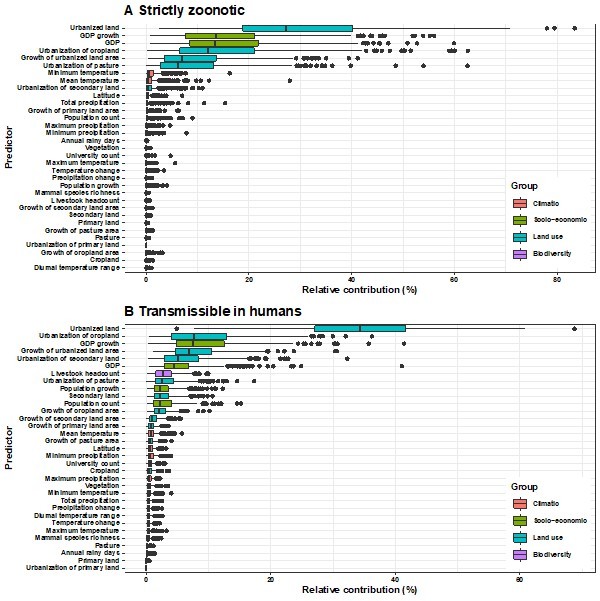
Author response image 6
Relative contribution of explanatory factors to human RNA virus discovery in the stratified model by transmissibility in Africa.
(A) Strictly zoonotic, (B) Transmissible in humans. The boxplots show the median (black bar) and interquartile range (box) of the relative contribution across 1000 replicate models, with whiskers indicating minimum and maximum and black dots indicating outliers.
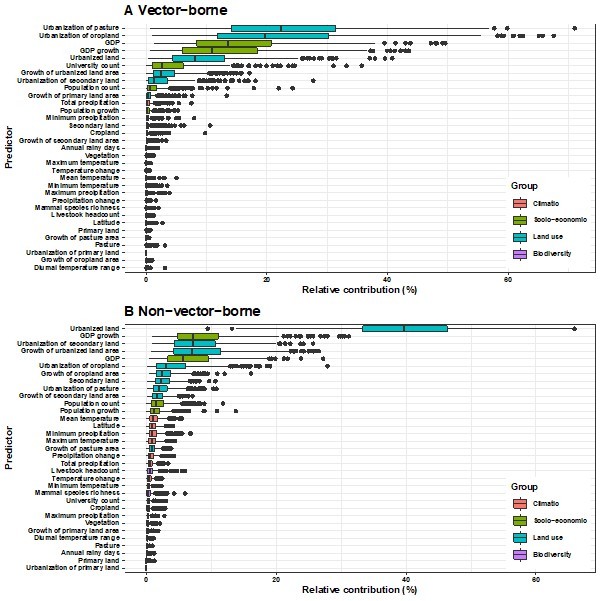
Author response image 7
Relative contribution of explanatory factors to human RNA virus discovery in the stratified model by transmission mode in Africa.
(A) Vector-borne, (B) Non-vector- borne. The boxplots show the median (black bar) and interquartile range (box) of the relative contribution across 1000 replicate models, with whiskers indicating minimum and maximum and black dots indicating outliers.
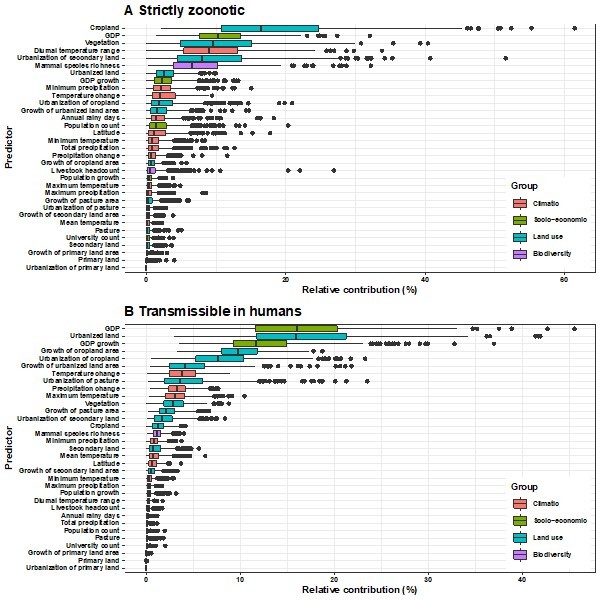
Author response image 8
Relative contribution of explanatory factors to human RNA virus discovery in the stratified model by transmissibility in the United States.
(A) Strictly zoonotic, (B) Transmissible in humans. The boxplots show the median (black bar) and interquartile range (box) of the relative contribution across 1000 replicate models, with whiskers indicating minimum and maximum and black dots indicating outliers..
Author response image 9
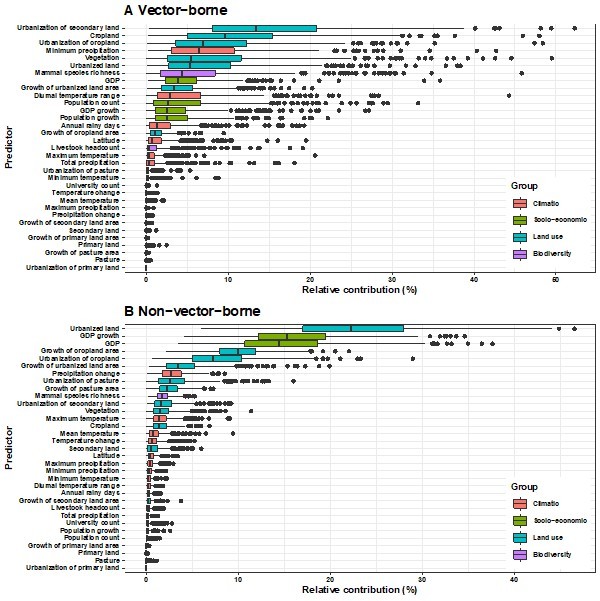
Relative contribution of explanatory factors to human RNA virus discovery in the stratified model by transmission mode in the United States.
(A) Vector-borne, (B) Non-vector- borne. The boxplots show the median (black bar) and interquartile range (box) of the relative contribution across 1000 replicate models, with whiskers indicating minimum and maximum and black dots indicating outliers.
Author response image 10
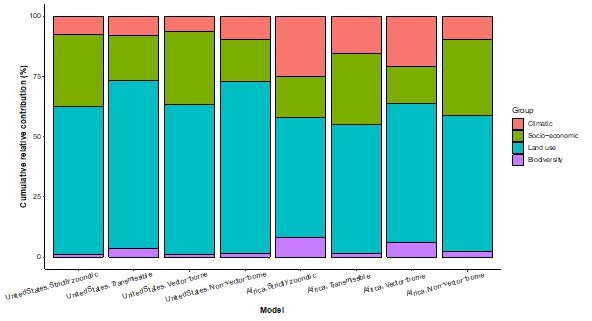
Cumulative relative contribution of predictors to human-infective RNA virus discovery by group in each model of different regions.
The relative contributions of all explanatory factors sum to 100% in each model, and each colour represents the cumulative relative contribution of all explanatory factors within each group.
Tables
Appendix 1—table 1
Summary of the human-infective RNA virus data sets in the United States, Africa, and China.
| Species | Original discovery year | United States | China | Africa | ||||||||||||
|---|---|---|---|---|---|---|---|---|---|---|---|---|---|---|---|---|
| Reported? | Discovery year | location | Lat | Lon | Reported? | Discovery year | location | Lat | Lon | Reported? | Discovery year | location | Lat | Lon | ||
| Argentinian mammarenavirus | 1958 | No | No | No | ||||||||||||
| Brazilian mammarenavirus | 1994 | Yes Barry et al., 1995 | 1995 | New Haven, Connecticut | 41.31 | --72.93 | No | No | ||||||||
| Cali mammarenavirus | 1971 | Yes Buchmeier et al., 1974 | 1974 | Houston, Texas | 29.76 | --95.37 | No | No | ||||||||
| Chapare mammarenavirus | 2008 | No | No | No | ||||||||||||
| Guanarito mammarenavirus | 1991 | No | No | No | ||||||||||||
| Lassa mammarenavirus | 1970 | Yes Buckley and Casals, 1970 | 1970 | New Haven, Connecticut | 41.31 | --72.93 | No | Yes Buckley and Casals, 1970 | 1970 | Lassa, Borno State, Nigeria | 10.69 | 13.27 | ||||
| Lujo mammarenavirus | 2009 | No | No | Yes Briese et al., 2009 | 2009 | Lusaka, Zambia | --15.39 | 28.32 | ||||||||
| Lymphocytic choriomeningitis mammarenavirus | 1934 | Yes Armstrong and Lillie, 1934 | 1934 | St. Louis county, Missouri | 38.61 | --90.41 | No | No | ||||||||
| Machupo mammarenavirus | 1964 | No | No | No | ||||||||||||
| Mobala mammarenavirus | 1985 | No | No | Yes Georges et al., 1985 | 1985 | Bouboui and Gomoka village, Boali town, Central African Republic | 4.89 | 18.14 | ||||||||
| Whitewater Arroyo mammarenavirus | 2000 | Yes Enserink, 2000 | 2000 | Alameda County, California | 37.60 | --121.72 | No | No | ||||||||
| Mamastrovirus 1 | 1975 | Yes Oshiro et al., 1981 | 1981 | Martin County, California | 40.22 | --123.10 | Yes Xu et al., 1981 | 1981 | Guangzhou, Guangdong | 23.13 | 113.26 | Yes Dowling and Wynne, 1981 | 1981 | Lebowa, South Africa | --23.5 | 29.5 |
| Mamastrovirus 6 | 2008 | Yes Finkbeiner et al., 2009c | 2009 | St. Louis, Missouri | 38.63 | --90.20 | Yes Chu et al., 2010 | 2010 | Hong Kong | 22.40 | 114.11 | Yes Kapoor et al., 2009 | 2009 | Maiduguri, Borno State, Nigeria | 11.83 | 13.15 |
| Mamastrovirus 8 | 2009 | Yes Finkbeiner et al., 2009a | 2009 | St. Louis, Missouri | 38.63 | --90.20 | Yes Wang et al., 2013 | 2013 | Nanjing, Jiangsu and Lanzhou, Gansu | 31.95 | 118.78 | Yes Kapoor et al., 2009 | 2009 | Maiduguri, Borno State, Nigeria | 11.83 | 13.15 |
| Mamastrovirus 9 | 2009 | Yes Finkbeiner et al., 2009b | 2009 | Accomack and Northampton Counties, Virginia | 37.71 | --75.81 | Yes Tao et al., 2019 | 2019 | Jinan, Shandong | 36.68 | 117.11 | Yes Kapoor et al., 2009 | 2009 | Maiduguri, Borno State, Nigeria | 11.83 | 13.15 |
| Mammalian 1 orthobornavirus | 1985 | Yes Rott et al., 1985 | 1985 | Philadelphia, Pennsylvania | 39.95 | --75.17 | Yes Chen et al., 1999 | 1999 | Taiwan | 23.70 | 120.96 | Yes Bode et al., 1992 | 1992 | Rural area of East Africa | --1.28 | 34.53 |
| Mammalian 2 orthobornavirus | 2015 | No | No | No | ||||||||||||
| Norwalk virus | 1972 | Yes Kapikian et al., 1972 | 1972 | Norwalk, Ohio | 41.24 | --82.62 | Yes Fang et al., 1995 | 1995 | Henan | 33.88 | 113.48 | Yes Taylor et al., 1993 | 1993 | Pretoria, Gauteng province, South Africa | --25.75 | 28.23 |
| Sapporo virus | 1980 | Yes Nakata et al., 1988 | 1988 | Houston, Texas | 29.76 | --95.37 | Yes Nakata et al., 1988 | 1988 | Shanghai | 31.23 | 121.47 | Yes Wolfaardt et al., 1997 | 1997 | Pretoria, Gauteng province, South Africa | --25.75 | 28.23 |
| Vesicular exanthema of swine virus | 1998 | Yes Smith et al., 1998 | 1998 | Corvallis, Oregon | 44.56 | --123.26 | No | No | ||||||||
| Alphacoronavirus 1 | 2007 | No | No | No | ||||||||||||
| Human coronavirus 229E | 1966 | Yes Hamre and Procknow, 1966 | 1966 | Chicago, Illinois | 41.88 | --87.63 | Yes Virus Research Group of Kun Number 323 Unit, The Chinese People’s Liberation Army, 1975 | 1975 | Kunming, Yunnan | 25.07 | 102.68 | Yes Hays and Myint, 1998 | 1998 | Kumasi, Ghana | 6.70 | --1.62 |
| Human coronavirus NL63 | 2004 | Yes Esper et al., 2005 | 2005 | New Haven, Connecticut | 41.31 | --72.93 | Yes Chan et al., 2005 | 2005 | Hong Kong | 22.40 | 114.11 | Yes Smuts et al., 2008 | 2008 | Cape Town, Western Cape Province, South Africa | --33.90 | 18.57 |
| Betacoronavirus 1 | 1967 | Yes McIntosh et al., 1967 | 1967 | Bethesda, Maryland | 38.98 | --77.09 | Yes Chan et al., 2005 | 2005 | Hong Kong | 22.40 | 114.11 | Yes Venter et al., 2011 | 2011 | Pretoria, Gauteng province, South Africa | --25.75 | 28.23 |
| Human coronavirus HKU1 | 2005 | Yes Esper et al., 2006 | 2006 | New Haven, Connecticut | 41.31 | --72.92 | Yes Woo et al., 2005 | 2005 | Hong Kong | 22.40 | 114.11 | Yes Venter et al., 2011 | 2011 | Pretoria, Gauteng province, South Africa | --25.75 | 28.23 |
| Middle East respiratory syndrome-related coronavirus | 2012 | Yes* Bialek et al., 2014 | 2014 | Lake county, Indiana | 41.45 | --87.37 | Yes* Gao and Song, 2015 | 2015 | Huizhou, Guangdong | 23.09 | 114.40 | Yes* Abroug et al., 2014 | 2014 | Monastir, Tunisia | 35.79 | 10.82 |
| Severe acute respiratory syndrome-related coronavirus | 2003 | Yes* Charles M, 2003 | 2003 | Atlanta, Georgia | 33.75 | --84.39 | Yes Peiris et al., 2003a | 2003 | Hong Kong | 22.40 | 114.11 | Yes Chiu et al., 2004 | 2004 | Pretoria, Gauteng province, South Africa | --25.75 | 28.23 |
| Human torovirus (been abolished) | 1984 | No | No | No | ||||||||||||
| Bundibugyo ebolavirus | 2008 | No | No | Yes Smuts et al., 2008 | 2008 | Bundibugyo and Kikyo town, Bundibugyo District, Western Uganda | 0.71 | 30.06 | ||||||||
| Reston ebolavirus | 1991 | Yes Miranda et al., 1991 | 1991 | Reston, Fairfax County, Virginia | 38.96 | --77.35 | No | No | ||||||||
| Sudan ebolavirus | 1977 | No | No | Yes Bowen et al., 1977 | 1977 | Maridi, South Sudan | 4.91 | 29.45 | ||||||||
| Tai Forest ebolavirus | 1995 | No | No | Yes Le Guenno et al., 1995 | 1995 | Abidjan, Cote-d’lvoire | 5.36 | --4.01 | ||||||||
| Zaire ebolavirus | 1977 | No | No | Yes Johnson et al., 1977 | 1977 | Yambuku village, Democratic Republic of the Congo | 2.83 | 22.22 | ||||||||
| Marburg marburgvirus | 1968 | Yes* Centers for Disease Control and Prevention, 2009 | 2009 | Denver county, Colorado | 39.55 | --105.78 | No | Yes Gear et al., 1975 | 1975 | Johannesburg, South Africa | --26.20 | 27.90 | ||||
| Aroa virus | 1971 | No | No | No | ||||||||||||
| Bagaza virus | 2009 | No | No | No | ||||||||||||
| Banzi virus | 1959 | No | No | Yes Smithburn et al., 1959 | 1959 | Maponde's Kraal(Usutu river), South Africa | --26.52 | 31.67 | ||||||||
| Cacipacore virus | 2011 | No | No | No | ||||||||||||
| Dengue virus | 1907 | Yes Lavinder and Francis, 1914 | 1914 | Savannah, Georgia | 32.02 | --81.12 | Yes Clarke et al., 1967 | 1967 | Southwest Taiwan | 23.06 | 120.59 | Yes Edington, 1927 | 1927 | Durban, KwaZulu-Natal Province, South Africa | --29.86 | 31.02 |
| Edge Hill virus | 1985 | No | No | No | ||||||||||||
| Gadgets Gully virus | 1991 | No | No | No | ||||||||||||
| Ilheus virus | 1947 | No | No | No | ||||||||||||
| Japanese encephalitis virus | 1933 | Yes* Perex-Pina and Merikangas, 1953 | 1953 | Waltham, Massachusetts | 42.38 | --71.24 | Yes Yen, 1941 | 1941 | Beijing | 40.01 | 116.41 | Yes Simon-Loriere et al., 2017 | 2017 | Cunene, Angola | --16.28 | 15.28 |
| Kokobera virus | 1964 | No | No | No | ||||||||||||
| Kyasanur forest disease virus | 1957 | No | Yes Wang et al., 2009 | 2009 | Hengduanshan Mountain, Yunnan | 27.50 | 99.00 | Yes Andayi et al., 2014 | 2014 | Djibouti, Republic of Djibouti | 11.57 | 43.15 | ||||
| Langat virus | 1956 | No | No | No | ||||||||||||
| Louping ill virus | 1934 | Yes Rivers and Schwentker, 1934 | 1934 | New York | 40.71 | --74.01 | No | No | ||||||||
| Murray Valley encephalitis virus | 1952 | No | No | No | ||||||||||||
| Ntaya virus | 1952 | No | No | Yes Smithburn, 1952 | 1952 | Bwamba county, Uganda | 0.75 | 30.02 | ||||||||
| Omsk hemorrhagic fever virus | 1948 | No | No | No | ||||||||||||
| Powassan virus | 1959 | Yes Goldfield et al., 1973 | 1973 | Middlesex County, New Jersey | 40.54 | --74.37 | No | No | ||||||||
| Rio Bravo virus | 1962 | Yes Suklin et al., 1962 | 1962 | Dallas city, Texas | 32.78 | --96.80 | No | No | ||||||||
| Saint Louis encephalitis virus | 1933 | Yes Webster and Fite, 2009 | 1933 | St. Louis City, Missouri | 38.63 | --90.20 | No | No | ||||||||
| Tembusu virus | 1975 | No | Yes Tang et al., 2013 | 2013 | Shandong | 36.40 | 118.77 | No | ||||||||
| Tick-borne encephalitis virus | 1938 | Yes* Cruse et al., 1979 | 1979 | Cleveland, Ohio | 41.51 | --81.69 | Yes Wang and Zhao, 1956 | 1956 | Bali village, Wuchang, Heilongjiang | 44.91 | 127.16 | No | ||||
| Uganda S virus | 1952 | No | No | Yes Dick and Haddow, 1952 | 1952 | Bwamba county, Uganda | 0.75 | 30.02 | ||||||||
| Usutu virus | 2009 | No | No | No | ||||||||||||
| Wesselsbron virus | 1957 | No | No | Yes Smithburn et al., 1957 | 1957 | Lake Simbu region, Maputaland, KwaZulu-Natal, South Africa | --27.36 | 32.32 | ||||||||
| West Nile virus | 1940 | Yes Nash et al., 2001 | 2001 | New York | 40.71 | --74.01 | Yes Li et al., 2013 | 2013 | Jiashi County, Xinjiang | 39.58 | 77.18 | Yes Smithburn et al., 1940 | 1940 | Omogo, West Nile district, Uganda | 0.42 | 33.21 |
| Yellow fever virus | 1901 | Yes Guiteras, 1904 | 1904 | Laredo, Texas | 27.51 | --99.51 | Yes* Chen and Lu, 2016 | 2016 | Beijing | 40.01 | 116.41 | Yes Stokes et al., 1928 | 1928 | Larteh, Ghana | 5.94 | --0.07 |
| Zika virus | 1952 | Yes* Foy et al., 2011 | 2011 | Northern Colorado | 39.55 | --105.78 | Yes* Sun et al., 2016 | 2016 | Gan County, Ganzhou city, Jiangxi | 25.86 | 115.02 | Yes Dick, 1952 | 1952 | Zika, Uganda | 0.12 | 32.53 |
| Hepacivirus C | 1989 | Yes Choo et al., 1989 | 1989 | Emeryville, California | 37.83 | --122.29 | Yes Xu et al., 1990a | 1990 | Qidong county, Jiangsu | 31.88 | 121.72 | Yes Kew et al., 1990 | 1990 | Johannesburg, South Africa | --26.20 | 27.90 |
| Pegivirus C | 1995 | Yes Simons et al., 1995 | 1995 | Chapel Hill, North Carolina; Rochester, Minnesota; Dallas, Texas | 35.91 | --79.06 | Yes Wang et al., 1996 | 1996 | Beijing | 40.01 | 116.41 | Yes Simons et al., 1995 | 1995 | Cairo, Egypt | 30.04 | 31.24 |
| Pegivirus H | 2015 | Yes Kapoor et al., 2015 | 2015 | New York city, New York | 40.71 | --74.01 | Yes Wang et al., 2018 | 2018 | Guangzhou, Guangdong | 23.13 | 113.26 | Yes Rodgers et al., 2019 | 2019 | Ebolowa, Cameroon | 2.92 | 11.15 |
| Pestivirus A | 1988 | Yes Yolken et al., 1989 | 1989 | Whiteriver, Arizona | 33.83 | --109.97 | No | Yes Giangaspero et al., 1988 | 1988 | Zambia | --13.13 | 27.85 | ||||
| Andes orthohantavirus | 1996 | No | No | No | ||||||||||||
| Bayou orthohantavirus | 1995 | Yes Morzunov et al., 1995 | 1995 | Louisiana | 30.98 | --91.96 | No | No | ||||||||
| Black creek canal orthohantavirus | 1995 | Yes Ravkov et al., 1995 | 1995 | Miami-Dade County, Florida | 25.76 | --80.34 | No | No | ||||||||
| Choclo orthohantavirus | 2000 | No | No | No | ||||||||||||
| Dobrava-Belgrade orthohantavirus | 1992 | No | No | No | ||||||||||||
| Hantaan orthohantavirus | 1978 | No | Yes Lee et al., 1980 | 1980 | Zhejiang | 29.14 | 119.79 | No | ||||||||
| Laguna Negra orthohantavirus | 1997 | No | No | No | ||||||||||||
| Puumala orthohantavirus | 1980 | No | No | No | ||||||||||||
| Sangassou orthohantavirus | 2010 | No | No | Yes Klempa et al., 2010 | 2010 | Sangassou village, Macenta district, Forest Guinea | 8.24 | --9.32 | ||||||||
| Seoul orthohantavirus | 1982 | Yes Forthal et al., 1987 | 1987 | Mississippi | 32.57 | --89.88 | Yes Song et al., 1982 | 1982 | Jiangsu | 33.14 | 119.79 | Yes Tomori et al., 1986 | 1986 | Jos, Nigeria | 9.90 | 8.86 |
| Sin Nombre orthohantavirus | 1993 | Yes Nichol et al., 1993 | 1993 | New Mexico | 34.52 | --105.87 | No | No | ||||||||
| Thailand orthohantavirus | 2006 | No | No | No | ||||||||||||
| Thottopalayam thottimvirus | 2007 | No | No | No | ||||||||||||
| Tula orthohantavirus | 1996 | No | No | No | ||||||||||||
| Orthohepevirus A | 1983 | Yes* De Cock et al., 1987 | 1987 | Los Angeles County, California | 34.05 | --118.24 | Yes Huang et al., 1989 | 1989 | Kashi county, Kashi city, Xinjiang | 39.46 | 75.99 | Yes Belabbes et al., 1985 | 1985 | Medea town, Algeria | 36.26 | 2.75 |
| Orthohepevirus C | 2018 | No | Yes Sridhar et al., 2018 | 2018 | Hong Kong | 22.40 | 114.11 | No | ||||||||
| Crimean-Congo haemorrhagic fever orthonairovirus | 1967 | No | Yes Yen et al., 1985 | 1985 | Bachu, southern Xinjiang | 39.79 | 78.55 | Yes Simpson et al., 1967 | 1967 | Kisangani, Tshopo province, Democratic Republic of the Congo | 0.53 | 25.19 | ||||
| Dugbe orthonairovirus | 1969 | No | No | Yes Causey et al., 1969 | 1969 | Ibadan, Nigeria | 7.35 | 3.88 | ||||||||
| Nairobi sheep disease orthonairovirus | 1969 | No | No | Yes Morrill et al., 1991 | 1991 | Mombasa; Malindi; and Kilifi, Coast Province, Kenya | --3.34 | 39.57 | ||||||||
| Thiafora orthonairovirus | 1989 | No | No | No | ||||||||||||
| Influenza A virus | 1933 | Yes Francis and Magill, 1935 | 1935 | Philadelphi, Pennsylvania | 39.95 | --75.17 | Yes Chang and Chiang, 1950 | 1950 | Beijing | 40.01 | 116.41 | Yes Isaacs and Andrews, 1951 | 1951 | Johannesburg, South Africa and Cape Town, South Africa | --26.20 | 27.90 |
| Influenza B virus | 1940 | Yes Francis, 1940 | 1940 | Irvington village, Greenburgh town, Westchester County, New York | 41.03 | --73.87 | Yes Wen and Chu, 1957 | 1957 | Beijing | 40.01 | 116.41 | Yes Montefiore et al., 1970 | 1970 | Arusha, Arusha Region, Tanzania | --3.37 | 36.69 |
| Influenza C virus | 1950 | Yes Francis et al., 1950 | 1950 | Ann Arbor city, Michigan | 42.28 | --83.74 | Yes Zhang, 1957 | 1957 | Beijing | 40.01 | 116.41 | Yes Joosting et al., 1968 | 1968 | Johannesburg, South Africa | --26.20 | 27.90 |
| Dhori thogotovirus | 1985 | No | No | No | ||||||||||||
| Thogoto thogotovirus | 1969 | No | No | Yes Causey et al., 1969 | 1969 | Ibadan, Nigeria | 7.35 | 3.88 | ||||||||
| Avian orthoavulavirus 1 | 1943 | Yes Burnet, 1943 | 1943 | Washington, D. C. | 38.91 | --77.04 | No | No | ||||||||
| Hendra henipavirus | 1995 | No | No | No | ||||||||||||
| Nipah henipavirus | 1999 | No | No | No | ||||||||||||
| Canine morbillivirus | 1955 | Yes Karzon, 1955 | 1955 | Buffalo, New York | 42.89 | --78.88 | No | No | ||||||||
| Measles morbillivirus | 1911 | Yes Goldberger and Anderson, 1911 | 1911 | Washington, D. C. | 38.91 | --77.04 | Yes Tang et al., 1958 | 1958 | Beijing | 40.01 | 116.41 | Yes Baylet et al., 1963 | 1963 | Dakar, Senegal | 14.72 | --17.47 |
| Human respirovirus 1 | 1958 | Yes Chanock et al., 1958 | 1958 | Washington, D. C. | 38.91 | --77.04 | Yes Chen et al., 1964 | 1964 | Zhejiang | 29.14 | 119.79 | Yes Taylor-Robinson and Tyrrell, 1963 | 1963 | Cape Town, Western Cape Province, South Africa | --33.90 | 18.57 |
| Human respirovirus 3 | 1958 | Yes Chanock et al., 1958 | 1958 | Washington, D. C. | 38.91 | --77.04 | Yes Yu et al., 1987 | 1987 | Guangzhou, Guangdong | 23.13 | 113.26 | Yes Taylor-Robinson and Tyrrell, 1963 | 1963 | Cape Town, Western Cape Province, South Africa | --33.90 | 18.57 |
| Achimota pararubulavirus 2 | 2013 | No | No | Yes Baker et al., 2013 | 2013 | Volta, Ghana | 6.05 | 0.37 | ||||||||
| Human orthorubulavirus 2 | 1956 | Yes Chanock, 1956 | 1956 | Cincinnati, Ohio | 39.10 | --84.51 | Yes Pathogen biology research group, Jiangsu new medical college, 1975 | 1975 | Nanjing, Jiangsu | 31.95 | 118.78 | Yes Balestrieri et al., 1967 | 1967 | Accra, Ghana | 5.60 | --0.19 |
| Human orthorubulavirus 4 | 1960 | Yes Johnson et al., 1960 | 1960 | Bethesda, Maryland | 38.98 | --77.09 | Yes Lau et al., 2005 | 2005 | Hong Kong | 22.40 | 114.11 | Yes Niang et al., 2010 | 2010 | Ndiop village, Sine Saloum region, Senegal | 15.18 | --16.74 |
| Mammalian orthorubulavirus 5 | 1959 | Yes Schultz and Habel, 1959 | 1959 | Stanford, California | 37.42 | --122.17 | No | No | ||||||||
| Menangle pararubulavirus | 1998 | No | No | No | ||||||||||||
| Mumps orthorubulavirus | 1934 | Yes Johnson and Goodpasture, 1934 | 1934 | Nashville, Tennessee | 36.16 | --86.78 | Yes Wang et al., 1958 | 1958 | Beijing | 40.01 | 116.41 | Yes Bayer and Gear, 1955 | 1955 | Johannesburg, South Africa | --26.20 | 27.90 |
| Simian orthorubulavirus | 1968 | No | No | No | ||||||||||||
| Sosuga pararubulavirus | 2014 | No | No | Yes Albariño et al., 2014 | 2014 | ˉ | 3.76 | 32.82 | ||||||||
| Tioman pararubulavirus | 2007 | No | No | No | ||||||||||||
| Bunyamwera orthobunyavirus | 1946 | Yes Work, 1964 | 1964 | Southern Florida | 26.92 | --81.21 | No | Yes Smithburn et al., 1946 | 1946 | Bwamba County, Uganda | 0.75 | 30.02 | ||||
| Bwamba orthobunyavirus | 1941 | No | No | Yes Smithburn et al., 1941 | 1941 | Bwamba county, Western Province of Uganda | 0.75 | 30.02 | ||||||||
| California encephalitis orthobunyavirus | 1952 | Yes Hammon and Reeves, 1952 | 1952 | Kern county, California | 35.49 | --118.86 | Yes Gu et al., 1984 | 1984 | Longhua, Shanghai | 31.22 | 121.43 | Yes Bardos and Sefcovicova, 1961 | 1961 | Uganda | 1.37 | 32.29 |
| Caraparu orthobunyavirus | 1961 | No | No | No | ||||||||||||
| Catu orthobunyavirus | 1961 | No | No | No | ||||||||||||
| Guama orthobunyavirus | 1961 | No | No | No | ||||||||||||
| Guaroa orthobunyavirus | 1959 | No | No | No | ||||||||||||
| Kairi orthobunyavirus | 1967 | No | No | No | ||||||||||||
| Madrid orthobunyavirus | 1964 | No | No | No | ||||||||||||
| Marituba orthobunyavirus | 1961 | No | No | No | ||||||||||||
| Nyando orthobunyavirus | 1965 | No | No | Yes Williams et al., 1965 | 1965 | Kisumu, Kenya | --0.09 | 34.77 | ||||||||
| Oriboca orthobunyavirus | 1961 | No | No | No | ||||||||||||
| Oropouche orthobunyavirus | 1961 | No | No | No | ||||||||||||
| Patois orthobunyavirus | 1972 | No | No | No | ||||||||||||
| Shuni orthobunyavirus | 1975 | No | No | Yes Moore et al., 1975 | 1975 | Ibadan, Nigeria | 7.38 | 3.95 | ||||||||
| Tacaiuma orthobunyavirus | 1967 | No | No | No | ||||||||||||
| Wyeomyia orthobunyavirus | 1965 | No | No | No | ||||||||||||
| Candiru phlebovirus | 1983 | No | No | No | ||||||||||||
| Punta Toro phlebovirus | 1970 | No | No | No | ||||||||||||
| Rift Valley fever phlebovirus | 1931 | No | Yes* Liu et al., 2016 | 2016 | Beijing | 40.01 | 116.41 | Yes Daubney et al., 1931 | 1931 | Rift Valley of Kenya Colony | --0.28 | 36.07 | ||||
| Sandfly fever Naples phlebovirus | 1944 | No | No | Yes Sabin, 1951 | 1951 | Cairo, Egypt | 30.04 | 31.24 | ||||||||
| Heartland banyangvirus | 2012 | Yes McMullan et al., 2012 | 2012 | Andrew and Nodaway Counties, Missouri | 39.82 | --94.59 | No | No | ||||||||
| Huaiyangshan banyangvirus | 2011 | No | Yes Zhang et al., 2011 | 2011 | Huaiyangshan | 31.37 | 115.39 | No | ||||||||
| Uukuniemi phlebovirus | 1970 | No | No | No | ||||||||||||
| Human picobirnavirus | 1988 | Yes Grohmann et al., 1993 | 1993 | Atlanta, Georgia | 33.75 | --84.39 | Yes Rosen et al., 2000 | 2000 | Lulong County, Hebei | 39.94 | 116.94 | No | ||||
| Equine rhinitis A virus | 1962 | No | No | No | ||||||||||||
| Foot-and-mouth disease virus | 1965 | No | Yes Luo et al., 1999 | 1999 | Guangzhou | 23.13 | 113.26 | Yes Donia and Youssef, 2002 | 2002 | Alexandria Governorate, Egypt | 30.74 | 29.74 | ||||
| Cardiovirus A | 1947 | Yes Jonkers, 1961 | 1961 | New Orleans, Louisiana | 29.95 | --90.07 | Yes Feng et al., 2015 | 2015 | Changchun, Jilin | 43.87 | 125.34 | Yes Dick and Best, 1948 | 1948 | Entebbe, Uganda | 0.05 | 32.46 |
| Cardiovirus B | 1963 | Yes Jones et al., 2007 | 2007 | San Diego, California | 32.72 | --117.16 | Yes Cheng et al., 2009a | 2009 | Lanzhou, Gansu | 36.06 | 103.79 | Yes Zoll et al., 2009 | 2009 | Cameroon | 5.03 | 12.40 |
| Cosavirus A | 2008 | No | Yes Dai et al., 2010 | 2010 | Shanghai | 31.23 | 121.47 | Yes Kapusinszky et al., 2012 | 2012 | Maiduguri, Borno State, Nigeria | 11.83 | 13.15 | ||||
| Cosavirus B | 2008 | No | Yes Yang et al., 2016 | 2016 | Zhenjiang, Jiangsu | 32.19 | 119.43 | No | ||||||||
| Cosavirus D | 2008 | No | No | Yes Kapusinszky et al., 2012 | 2012 | Maiduguri, Borno State, Nigeria | 11.83 | 13.15 | ||||||||
| Cosavirus E | 2008 | No | No | Yes Kapusinszky et al., 2012 | 2012 | Maiduguri, Borno State, Nigeria | 11.83 | 13.15 | ||||||||
| Cosavirus F | 2012 | No | No | No | ||||||||||||
| Enterovirus A | 1949 | Yes Sickles and Dalldorf, 1949 | 1949 | New York | 43.30 | --74.22 | Yes Xiao et al., 1985 | 1985 | Tianjin | 39.34 | 117.36 | Yes Bayer and Gear, 1955 | 1955 | Johannesburg, South Africa | --26.20 | 27.90 |
| Enterovirus B | 1949 | Yes Sickles and Dalldorf, 1949 | 1949 | Wilmington | 39.74 | --75.54 | Yes Wu et al., 1960 | 1960 | Fuzhou, Fujian | 26.07 | 119.30 | Yes Patz et al., 1953 | 1953 | Middelburg, Transvaal, South Africa | --25.77 | 29.46 |
| Enterovirus C | 1909 | Yes Flexner and Lewis, 1909 | 1909 | New York city, New York | 40.71 | --74.01 | Yes Yen and Hsü, 1941 | 1941 | Bejing | 39.90 | 116.41 | Yes Hudson and Lennette, 1933 | 1933 | Monrovia, Liberia | 6.29 | --10.76 |
| Enterovirus D | 1967 | Yes Schieble et al., 1967 | 1967 | Berkeley, California | 37.87 | --122.27 | Yes Shanghai Eye and Skin Disease Prevention and Treatment Institute, 1979 | 1979 | Shanghai | 31.23 | 121.47 | Yes Mirkovic et al., 1973 | 1973 | Morocco | 31.79 | --7.09 |
| Enterovirus E | 1961 | Yes Moscovivci et al., 1961 | 1961 | Denver, Colorado | 39.74 | --104.99 | No | No | ||||||||
| Enterovirus H | 1965 | No | No | No | ||||||||||||
| Rhinovirus A | 1953 | Yes Price, 1956 | 1956 | Baltimore, Maryland | 39.29 | --76.61 | Yes Guangzhou Institute of Medicine and Health, 1975 | 1975 | Guangzhou, Guangdong | 23.13 | 113.26 | Yes Taylor-Robinson, 1963 | 1963 | Cape Town, Western Cape Province, South Africa | --33.90 | 18.57 |
| Rhinovirus B | 1960 | Yes Hamre and Procknow, 1961 | 1961 | Chicago, Illinois | 41.88 | --87.63 | Yes Xiang et al., 2008 | 2008 | Beijing | 40.01 | 116.41 | Yes Briese et al., 2008 | 2008 | Pretoria, Gauteng province, South Africa | --25.75 | 28.23 |
| Rhinovirus C | 2006 | Yes Lamson et al., 2006 | 2006 | New York city, New York | 40.71 | --74.01 | Yes Lau et al., 2007 | 2007 | Hong Kong | 22.40 | 114.11 | Yes Briese et al., 2008 | 2008 | Pretoria, Gauteng province, South Africa | --25.75 | 28.23 |
| Erbovirus A | 2005 | No | No | No | ||||||||||||
| Hepatovirus A | 1973 | Yes Feinstone et al., 1973 | 1973 | Bethesda, Maryland | 38.98 | --77.09 | Yes Microbiology Research Group of Shanghai First Medical College and Laboratory of Shanghai Sixth People’s Hospital, 1978 | 1978 | Shanghai | 31.23 | 121.47 | Yes Szmuness et al., 1977 | 1977 | Dakar, Senegal | 14.72 | --17.47 |
| Aichivirus A | 1991 | Yes Chhabra et al., 2013 | 2013 | Cincinnati, Ohio | 39.10 | --84.51 | Yes Yang et al., 2009 | 2009 | Shanghai | 31.23 | 121.47 | Yes Sdiri-Loulizi et al., 2008 | 2008 | Monastir, Tunisia | 35.77 | 10.82 |
| Parechovirus A | 1958 | Yes Ramoz-alverz and Sabin, 1958 | 1958 | Cincinnati, Ohio | 39.10 | --84.51 | Yes Shan et al., 2009 | 2009 | Shanghai | 31.23 | 121.47 | Yes Kapusinszky et al., 2012 | 2012 | Ouagadougou, Burkina Faso | 12.24 | --1.56 |
| Parechovirus B | 2003 | No | No | No | ||||||||||||
| Salivirus A | 2009 | Yes Greninger et al., 2009 | 2009 | Northern California | 38.84 | --120.90 | Yes Shan et al., 2010 | 2010 | Shanghai | 31.23 | 121.47 | Yes Li et al., 2009 | 2009 | Maiduguri, Borno State, Nigeria | 11.83 | 13.15 |
| Avian metapneumovirus | 2011 | Yes Kayali et al., 2011 | 2011 | Memphis, Tennessee | 35.15 | --90.05 | No | No | ||||||||
| Human metapneumovirus | 2001 | Yes Falsey et al., 2003 | 2003 | Rochester, New York | 43.16 | --77.61 | Yes Peiris et al., 2003b | 2003 | Hong Kong | 22.40 | 114.11 | Yes Madhi et al., 2003 | 2003 | Johannesburg, South Africa | --26.20 | 27.90 |
| Human orthopneumovirus | 1957 | Yes Chanock et al., 1957 | 1957 | Baltimore, Maryland | 39.29 | --76.61 | Yes Kun Number 323 Unit, the Chinese People’s Liberation Army, 1975 | 1975 | Kunming, Yunnan | 25.07 | 102.68 | Yes Doggett, 1965 | 1965 | Cape Town, Western Cape Province, South Africa | --33.90 | 18.57 |
| Colorado tick fever virus | 1946 | Yes Florio et al., 1946 | 1946 | Denver, Colorado | 39.74 | --104.99 | Yes Yang et al., 1996 | 1996 | Nanjing, Jiangsu | 31.95 | 118.78 | No | ||||
| Eyach virus | 1980 | No | No | No | ||||||||||||
| Corriparta virus | 1967 | No | No | No | ||||||||||||
| Great Island virus | 1963 | No | No | No | ||||||||||||
| Lebombo virus | 1975 | No | No | Yes Moore et al., 1975 | 1975 | lbadan, Nigeria | 7.38 | 3.95 | ||||||||
| Orungo virus | 1976 | No | No | Yes Tomori et al., 1976 | 1976 | Ibadan, Nigeria | 7.38 | 3.95 | ||||||||
| Mammalian orthoreovirus | 1954 | Yes Ramos-Alvarez and Sabin, 1954 | 1954 | Cincinnati, Ohio | 39.10 | --84.51 | Yes Zhao et al., 1995 | 1995 | Xuzhou, Jiangsu | 34.26 | 117.19 | Yes Malherbe et al., 1963 | 1963 | Johannesburg, South Africa | --26.20 | 27.90 |
| Nelson Bay orthoreovirus | 2007 | No | Yes* Cheng et al., 2009b | 2009 | Hong Kong | 22.40 | 114.11 | No | ||||||||
| Rotavirus A | 1973 | Yes Kapikian et al., 1976 | 1976 | Washington, D. C. | 38.90 | --77.04 | Yes PaPa et al., 1979 | 1979 | Beijing | 40.01 | 116.41 | Yes Tomori et al., 1976 | 1976 | Johannesburg, South Africa | --26.20 | 27.90 |
| Rotavirus B | 1984 | Yes Eiden et al., 1985 | 1985 | Baltimore, Maryland | 39.29 | --76.61 | Yes Hung et al., 1984 | 1984 | Jinzhou, Liaoning | 41.10 | 121.13 | Yes Nakata et al., 1987 | 1987 | Kenya | --0.02 | 37.91 |
| Rotavirus C | 1986 | Yes Jiang et al., 1995 | 1995 | Providence, Rhode Island | 41.82 | --71.41 | Yes Qiao et al., 1999 | 1999 | Beijing | 40.01 | 116.41 | Yes Sebata and Steele, 1999 | 1999 | Pretoria, Gauteng province, South Africa | --25.75 | 28.23 |
| Rotavirus H | 1987 | No | Yes Wang et al., 1987 | 1987 | Huaihua, Hunan Province | 27.55 | 109.96 | No | ||||||||
| Banna virus | 1990 | No | Yes Xu et al., 1990b | 1990 | Xishuangbanna, Yunnan Province | 21.90 | 100.80 | No | ||||||||
| Primate T-lymphotropic virus 1 | 1980 | Yes Poiesz et al., 1980 | 1980 | Bethesda, Maryland | 38.98 | --77.09 | Yes Hung et al., 1984 | 1984 | Shenyang, Liaoing | 41.80 | 123.38 | Yes Williams et al., 1984 | 1984 | Ibadan, Nigeria | 7.38 | 3.95 |
| Primate T-lymphotropic virus 2 | 1982 | Yes Kalyanaraman et al., 1982 | 1982 | Seattle, Washington | 47.61 | --122.33 | Yes Ma et al., 2013 | 2013 | Henan and Hubei | 32.21 | 112.96 | Yes Delaporte et al., 1991 | 1991 | Franceville, Gabon | --1.63 | 13.60 |
| Primate T-lymphotropic virus 3 | 2005 | No | No | Yes Calattini et al., 2005 | 2005 | Océan department, South Province, Cameroon | 2.50 | 10.50 | ||||||||
| Human immunodeficiency virus 1 | 1983 | Yes Safai et al., 1984 | 1984 | Washington, D. C. | 38.90 | --77.04 | Yes Chang et al., 1986 | 1986 | Hong Kong | 22.40 | 114.11 | Yes Brun-Vézinet et al., 1984 | 1984 | Kisangani, Tshopo province, Democratic Republic of the Congo | 0.53 | 25.19 |
| Human immunodeficiency virus 2 | 1986 | Yes* Centers for Disease Control, 1988 | 1988 | New Jersey | 40.06 | --74.41 | Yes* Yan et al., 2000 | 2000 | Fuzhou, Fujian | 26.07 | 119.30 | Yes Kanki et al., 1986 | 1986 | Dakar, Senegal | 14.72 | --17.47 |
| Simian immunodeficiency virus | 1992 | Yes Khabbaz et al., 1992 | 1992 | Atlanta, Georgia | 33.75 | --84.39 | No | Yes Calattini et al., 2005 | 2005 | Cameroon | 7.37 | 12.35 | ||||
| Central chimpanzee simian foamy virus | 2012 | No | No | Yes Rua et al., 2012 | 2012 | Near Dja Nature Reserves, Southern Cameroon | 4.50 | 13.50 | ||||||||
| Eastern chimpanzee simian foamy virus | 1971 | No | No | Yes Achong et al., 1971 | 1971 | Kenya | --0.02 | 37.91 | ||||||||
| Grivet simian foamy virus | 1997 | No | No | No | ||||||||||||
| Guenon simian foamy virus | 2012 | No | No | Yes Rua et al., 2012 | 2012 | Near lolodrof, Southern Cameroon | 3.23 | 10.73 | ||||||||
| Taiwanese macaque simian foamy virus | 2002 | No | Yes Huang et al., 2012 | 2012 | Yunnan | 25.18 | 101.86 | No | ||||||||
| Australian bat lyssavirus | 1998 | No | No | No | ||||||||||||
| Duvenhage lyssavirus | 1971 | No | No | Yes Meredith et al., 1971 | 1971 | Pretoria, Gauteng province, South Africa | --25.75 | 28.23 | ||||||||
| European bat Yeslyssavirus | 1989 | No | No | No | ||||||||||||
| European bat 2 lyssavirus | 1986 | No | No | No | ||||||||||||
| Irkut lyssavirus | 2013 | No | Yes Liu et al., 2013 | 2013 | Tonghua county, Jilin | 41.68 | 125.76 | No | ||||||||
| Mokola lyssavirus | 1972 | No | No | Yes Familusi et al., 1972 | 1972 | Ibadan, Nigeria | 7.38 | 3.95 | ||||||||
| Rabies lyssavirus | 1903 | Yes Black and Powers, 1910 | 1910 | Southern California | 34.57 | --116.76 | Yes Wu, 1981 | 1981 | Beijing | 40.01 | 116.41 | Yes Wilhelm and Alexis, 1933 | 1933 | Carolina, Mpumalanga, South Africa | --26.07 | 30.12 |
| Bas-Congo tibrovirus | 2012 | No | No | Yes Grard et al., 2012 | 2012 | Mangala village, Boma Bungu Health Zone, Democratic Republic of Congo (DRC) | --4.04 | 21.76 | ||||||||
| Ekpoma Yestibrovirus | 2015 | No | No | Yes Stremlau et al., 2015 | 2015 | Irrua, Edo State, Nigeria | 6.74 | 6.22 | ||||||||
| Ekpoma 2 tibrovirus | 2015 | No | No | Yes Stremlau et al., 2015 | 2015 | Irrua, Edo State, Nigeria | 6.74 | 6.22 | ||||||||
| Alagoas vesiculovirus | 1967 | No | No | No | ||||||||||||
| Chandipura vesiculovirus | 1967 | No | No | No | ||||||||||||
| Cocal vesiculovirus | 1964 | No | No | No | ||||||||||||
| Indiana vesiculovirus | 1958 | Yes Patterson et al., 1958 | 1958 | Beltsville, Prince George's County, Maryland | 39.05 | --76.90 | No | No | ||||||||
| Isfahan vesiculovirus | 1977 | No | No | No | ||||||||||||
| Maraba vesiculovirus | 1984 | No | No | No | ||||||||||||
| New Jersey vesiculovirus | 1950 | Yes Hanson et al., 1950 | 1950 | Madison, Wisconsin | 43.07 | --89.40 | No | No | ||||||||
| Piry vesiculovirus | 1974 | No | No | No | ||||||||||||
| Barmah Forest virus | 1986 | No | No | No | ||||||||||||
| Chikungunya virus | 1956 | Yes* Centers for Disease Control and Prevention, 2006 | 2006 | Minnesota | 46.44 | --93.36 | Yes Clarke et al., 1967 | 1967 | Southwest Taiwan | 23.06 | 120.59 | Yes Ross, 1956 | 1956 | Newala district, Tanzania | --10.64 | 39.24 |
| Eastern equine encephalitis virus | 1938 | Yes Howitt, 1938 | 1938 | Southwestern Massachusetts | 42.19 | --73.09 | No | No | ||||||||
| Everglades virus | 1970 | Yes Ehrenkranz et al., 1970 | 1970 | Homestead, Florida | 25.47 | --80.48 | No | No | ||||||||
| Getah virus | 1966 | No | Yes Li et al., 1992 | 1992 | Baoting County, Hainan | 18.98 | 109.83 | No | ||||||||
| Highlands J virus | 2000 | Yes Meehan et al., 2000 | 2000 | Florida | 27.66 | --81.52 | No | No | ||||||||
| Madariaga virus | 1972 | No | No | No | ||||||||||||
| Mayaro virus | 1957 | Yes* Tesh et al., 1999 | 1999 | Ohio | 40.42 | --82.91 | No | No | ||||||||
| Mosso das Pedras virus | 2013 | No | No | No | ||||||||||||
| Mucambo virus | 1965 | No | No | No | ||||||||||||
| Ndumu virus | 1961 | No | No | Yes Kokernot et al., 1961 | 1961 | Ndumu, Maputaland, KwaZulu-Natal, South Africa | --26.93 | 32.26 | ||||||||
| Onyong-nyong virus | 1961 | No | No | Yes Williams and Woodall, 1961 | 1961 | Entebbe, Uganda | 0.05 | 32.46 | ||||||||
| Pixuna virus | 1991 | No | No | No | ||||||||||||
| Rio Negro virus | 1993 | No | No | No | ||||||||||||
| Ross River virus | 1972 | No | Yes Xu et al., 1999 | 1999 | Hainan | 19.16 | 109.94 | No | ||||||||
| Semliki Forest virus | 1979 | No | No | Yes Mathiot et al., 1990 | 1990 | Bangui, Central Africa | 4.36 | 18.58 | ||||||||
| Sindbis virus | 1955 | No | No | Yes Taylor et al., 1955 | 1955 | Cairo, Egypt | 30.04 | 31.24 | ||||||||
| Tonate virus | 1976 | No | No | No | ||||||||||||
| Una virus | 1963 | No | No | No | ||||||||||||
| Venezuelan equine encephalitis virus | 1943 | Yes Casals et al., 1943 | 1943 | New York | 40.71 | --74.01 | No | No | ||||||||
| Western equine encephalitis virus | 1938 | Yes Howitt, 1938 | 1938 | Fresno, California | 36.75 | --119.77 | No | No | ||||||||
| Whataroa virus | 1964 | No | No | No | ||||||||||||
| Rubella virus | 1942 | Yes Habel, 1942 | 1942 | Washington, D. C. | 38.91 | --77.04 | Yes He et al., 1979 | 1979 | Hangzhou, Zhejiang | 29.87 | 119.33 | Yes Selzer, 1963 | 1963 | Cape Town, Western Cape Province, South Africa | --33.90 | 18.57 |
| Hepatitis delta virus | 1977 | Yes Rizzetto et al., 1979 | 1979 | New Jersey | 40.06 | --74.41 | Yes Rizzetto et al., 1980 | 1980 | Taipei, Taiwan | 24.96 | 121.51 | Yes Crocchiolo et al., 1984 | 1984 | Harare, Zimbabwe | --17.83 | 31.03 |
-
Notes: Yes denotes the virus was ever discovered from the region; * denotes the virus was ever discovered from the region, but imported from other regions; No denotes the virus species has never been discovered from the region; The lat and long denote the coordidate of discovery points or centroids of polygons
Appendix 1—table 2
Resolution and covered grid cells for virus discovery data.
| Polygon data | Point data | Total | ||||
|---|---|---|---|---|---|---|
| Country level | State/Province level | City/County level | ||||
| United States | Virus counts | NA | 14 (14.7%) | 11 (11.6%) | 70 (73.7%) | 95 |
| Gridded cell counts | NA | 189 | 12 | 72* | 273 | |
| China | Virus counts | NA | 22 (27.5%) | 47 (58.7%) | 11 (13.8%) | 80 |
| Gridded cell counts | NA | 161 | 70 | 12* | 243 | |
| Virus counts | 7 (6.5%) | 5 (4.7%) | 15 (14.0%) | 80 (74.8%) | 107 | |
| Africa | Gridded cell counts | 307 | 22 | 17 | 80 | 426 |
-
*
Grid cell counts here include viruses first detected in multiple points from the literature, NA, not applicable
Appendix 1—table 3
Model parameters.
| Model | Tree complexity | Learning rate | Bag fraction | No. of trees |
|---|---|---|---|---|
| United States | 2 | 0.0020 | 0.5 | 1430 |
| China | 2 | 0.0035 | 0.5 | 1473 |
| Africa | 2 | 0.0030 | 0.5 | 1446 |
Appendix 1—table 4
Model validation statistics for analyses in three regions.
| Model | % of deviance explained (95% quantiles) | ICC (95% quantiles) |
|---|---|---|
| United States | 50.5% (44.3%–56.8%) | 0.66 (0.60–0.70) |
| China | 42.0% (32.4%–50.8%) | 0.52 (0.41–0.60) |
| Africa | 42.4% (34.2%–50.0%) | 0.51 (0.44–0.62) |
-
ICC, intraclass correlation coefficient
Additional files
Download links
A two-part list of links to download the article, or parts of the article, in various formats.
Downloads (link to download the article as PDF)
Open citations (links to open the citations from this article in various online reference manager services)
Cite this article (links to download the citations from this article in formats compatible with various reference manager tools)
Predictors of human-infective RNA virus discovery in the United States, China, and Africa, an ecological study
eLife 11:e72123.
https://doi.org/10.7554/eLife.72123


