Predictors of human-infective RNA virus discovery in the United States, China, and Africa, an ecological study
- Usher Institute, University of Edinburgh, United Kingdom
- Roslin Institute and Royal (Dick) School of Veterinary Studies, University of Edinburgh, United Kingdom
- Department of Medicine, Li Ka Shing Faculty of Medicine, University of Hong Kong, China
Abstract
Background:
The variation in the pathogen type as well as the spatial heterogeneity of predictors make the generality of any associations with pathogen discovery debatable. Our previous work confirmed that the association of a group of predictors differed across different types of RNA viruses, yet there have been no previous comparisons of the specific predictors for RNA virus discovery in different regions. The aim of the current study was to close the gap by investigating whether predictors of discovery rates within three regions—the United States, China, and Africa—differ from one another and from those at the global level.
Methods:
Based on a comprehensive list of human-infective RNA viruses, we collated published data on first discovery of each species in each region. We used a Poisson boosted regression tree (BRT) model to examine the relationship between virus discovery and 33 predictors representing climate, socio-economics, land use, and biodiversity across each region separately. The discovery probability in three regions in 2010–2019 was mapped using the fitted models and historical predictors.
Results:
The numbers of human-infective virus species discovered in the United States, China, and Africa up to 2019 were 95, 80, and 107 respectively, with China lagging behind the other two regions. In each region, discoveries were clustered in hotspots. BRT modelling suggested that in all three regions RNA virus discovery was better predicted by land use and socio-economic variables than climatic variables and biodiversity, although the relative importance of these predictors varied by region. Map of virus discovery probability in 2010–2019 indicated several new hotspots outside historical high-risk areas. Most new virus species since 2010 in each region (6/6 in the United States, 19/19 in China, 12/19 in Africa) were discovered in high-risk areas as predicted by our model.
Conclusions:
The drivers of spatiotemporal variation in virus discovery rates vary in different regions of the world. Within regions virus discovery is driven mainly by land-use and socio-economic variables; climate and biodiversity variables are consistently less important predictors than at a global scale. Potential new discovery hotspots in 2010–2019 are identified. Results from the study could guide active surveillance for new human-infective viruses in local high-risk areas.
Funding:
FFZ is funded by the Darwin Trust of Edinburgh (https://darwintrust.bio.ed.ac.uk/). MEJW has received funding from the European Union’s Horizon 2020 research and innovation programme under grant agreement No. 874735 (VEO) (https://www.veo-europe.eu/).
Editor's evaluation
This study will be of interest to readers in the field of virus discovery. This study attempts to identify predictors of human-infective RNA virus discovery and predict high risk areas in a recent period in the United States, China, and Africa using an ecological modeling framework. The study has potential to inform future discovery efforts for human-infective viruses.
https://doi.org/10.7554/eLife.72123.sa0Introduction
RNA viruses are the primary cause for emerging infectious diseases with epidemic potential, given that they have a high rate of evolution and high capacity to adapt to new hosts (Woolhouse et al., 2016). In recent decades, infectious diseases caused by severe acute respiratory syndrome coronavirus (SARS-CoV), Middle East respiratory syndrome coronavirus (MERS-CoV), Bundibugyo Ebola virus and SARS-CoV-2 present major threats to the health and welfare of humans (Albariño et al., 2013; Ksiazek et al., 2003; Mackay and Arden, 2015; World Health Organisation, 2020). Detection of formerly unknown human-infective RNA viruses in the earliest stage after the emergence are essential for controlling the infections they cause. Measures to implement early detection include not only advanced diagnostic techniques (Lipkin and Firth, 2013), but more importantly the idea where to look for them (so-called hotspots) (Morse, 2012).
Socio-economic, environmental, and ecological factors related to both virus natural history and research effort have been found to affect the discovery of emerging RNA viruses (Jones et al., 2008; Morse, 2012; Rosenberg, 2015; Zhang et al., 2020). However, these factors are highly spatially heterogeneous, making the generality of any associations with discovery debatable. For example, the United States, China, and Africa have experienced different rates of socio-economic, environmental, and ecological changes in the last one hundred years. The United States has always had better resources to discover new viruses. For example, the Rockefeller Foundation—a U.S. foundation—supported the discovery of 23 arboviruses in Latin America, Africa, and India in 1951–1969 (Rosenberg et al., 2013). China has seen urban land coverage more than double and GDP per capita increase by seven times since the 1980s (Ritchie, 2018; Roser, 2013). Nine out of 223 human-infective RNA viruses have been originally discovered in China, and all were discovered after 1982 (Zhang et al., 2020). In contrast, effective surveillance is challenging in less developed regions such as large parts of Africa given resource constraints (Petti et al., 2006).
There have been no previous comparisons of the specific predictors for RNA virus discovery in different regions. In this study, we applied a similar methodology from our previous study of global patterns of discovery of human-infective RNA viruses (Zhang et al., 2020) to investigate whether predictors of discovery rates within three regions—the United States, China, and Africa—differ from one another and from those at the global level, using three new virus discovery data sets. We also mapped discovery probability in three regions in 2010–2019 using the fitted models and historical predictors. According to findings from our previous study (Zhang et al., 2020), the main predictors for virus discovery at the global scale were GDP-related. This suggests that the patterns of virus discovery we have identified may have been largely driven by research effort rather than the underlying biology. In this study, by focusing on more restricted and homogenous regions where the research effort is less variable, we expected to identify predictors more associated with virus biology.
Materials and methods
Data sets of human-infective RNA viruses in three regions
Request a detailed protocolWe performed an ecological study, and the subject of interest is each human-infective RNA virus species. With reference to a full list of human-infective RNA virus species (Zhang et al., 2020), we geocoded the first report of each in humans in the United States, China, and Africa separately. The latest version as of 31 December 2019 included 223 species (Appendix 1—table 1), with Human torovirus abolished and a new species—Heartland banyangvirus—added by International Committee on Taxonomy of Viruses (ICTV) in 2018 (International Committee on Taxonomy of Viruses, 2018). Data used in this study were not subsets of our previous global analysis; information on discovery locations and discovery dates for each virus species was re-collated for each specific geographical region.
We followed the same search terms, databases searched, and inclusion or exclusion criteria as our global data set for data collection (Woolhouse and Brierley, 2018). In each region, we established whether or not each virus species has been discovered in humans according to peer-reviewed literature. Reference databases included PubMed, Web of Science, Google Scholar, and Scopus. Two Chinese databases [i.e. China National Knowledge Infrastructure (CNKI) and Wanfang Data] were also searched when collecting data for China. Reference lists of relevant studies and reviews were also checked manually to find potential earlier discovery papers. The following key words were used for the retrieval: virus full name or abbreviations or virus synonyms; and human* or person* or case* or patient* or worker* or infection* or disease* or outbreak* or epidemic*; and region name (Chin* or Taiwan or Hong Kong or Macau; United States or US or USA or America*; Africa* or all African country names). Virus synonyms and abbreviations include early names used in the discovery paper and all subtypes provided by the ICTV online report (International Committee on Taxonomy of Viruses, 2018 ). Evidence which met the following criteria from peer-reviewed literatures were included: (a) Diagnostic methods for RNA virus infection in humans were clearly described, through either viral isolation or serological methods; (b) Specific virus species name or subtypes falling under that species were clearly provided; (c) Both natural infection and iatrogenic or occupational infections were accepted. Evidence which met the following criteria were excluded: (a) Uncertain species due to cross-reactivity with related viruses; (b) Diagnostic methods for virus infection were not specified; (c) Description of clinical symptoms or pathogenicity were not considered as human infection of one certain virus species; (d) Report of ‘[virus name]-like’ or ‘potential [virus name] infections’; (e) Intentional infections including experimental inoculation or vitro infections; (f) Non-peer-reviewed literature, including media reports, thesis, or unpublished data. Literature selection was performed by two individuals independently and discrepancies were resolved by discussion with a third individual.
We defined discovery location as where the initial human was exposed to/infected with the virus, as suggested in the first report of human infections from peer-reviewed literature. All locations were geolocated as precisely as possible using methods from our previous paper (Zhang et al., 2020). For each region, a polygon was created for those locations at administrative level 3 (county for the United States; city for China; for Africa, it varies between different countries) and above. Details of data types for virus discovery database in three regions was summarised in Appendix 1—table 2. Although the majority of discovery locations in the United States and Africa involved point data and in China the majority involved polygon data at province level, the average number of grid cells per virus in three regions were similar. A bootstrap resampling procedure was developed for polygon data covering more than one grid cell (details below). Discovery date of human infection was defined as the publication year in the scientific literature.
Spatial covariates
Request a detailed protocolAs for our global analysis (Zhang et al., 2020), a suite of global gridded climatic, socio-economic, land use, and biodiversity variables (n=33) postulated to affect the spatial distribution of RNA virus discovery were compiled, each at a resolution of 0.5°/30" (except university count having a resolution at country level for Africa and at state/province level for the United States and China). Of these, GDP, GDP growth, and university were included to adjust for discovery effort as they could partially explain the infrastructure and technology that are available for virus research (Zhang et al., 2020). We reviewed and tested previous strategies researchers have used to adjust for discovery bias, including frequency of the country listed as the address for authors in scientific papers and frequency of publications for each pathogen from scientific databases (Jones et al., 2008; Olival et al., 2017) but the results were not encouraging as the frequency of published papers from virus-related scientific journals is weakly linked to the published count of novel human-infective RNA virus (Appendix2, Appendix 3—figure 1).
Data for the United States, China, and Africa were extracted by restricting the coordinates within each region. The definition, original resolution, and source of each variable were the same as our previous paper (Zhang et al., 2020). All predictors were aggregated from their original spatial resolution to 1°×1° resolution; data for climatic variables, population, GDP, and land use data without full temporal coverage were extrapolated back to 1901; both following methods from our previous paper (Zhang et al., 2020).
Boosted regression trees modelling
Request a detailed protocolWe used a Poisson boosted regression trees (BRT) model to examine the relationship between discovery of RNA virus and 33 predictors for each 1° resolution of grid cell across each region separately, following codes from our previous study (Zhang et al., 2020) and one previous paper (Allen et al., 2017). As a tree-based machine learning method, the BRT model can automatically capture complex relationships and interactions between variables, and also can well account for spatial autocorrelation within the data (Crase et al., 2012). We compared Moran’s I values of the raw virus data and the model residuals to estimate the ability of the BRT model to account for spatial autocorrelation (Cliff and Ord, 1981). In order to minimise the effect of spatial uncertainty of virus discovery data, we performed 1000 times bootstrap resampling for those discovery locations reported as polygons. We assumed each grid cell in the polygon has the equal chance to be selected, and for each virus record we selected one grid cell randomly from the polygon for each subsample. A ratio of 1:2 for presence to absence constituted each subsample, that is, for each grid cell with virus discovery, two grid cells with no discovery were randomly selected from ‘virus discovery free’ areas at all time points within the region. Take the United States as an example, each subsample included 95 grid cells with virus discovery and 190 with no virus discovery. We then matched the virus data with all predictors by geographical coordinates and decade (using the nearest decade for time-varying predictors). We assumed that the virus count in any given grid cell in each decade followed a Poisson distribution, and we calculated the virus discovery count in each grid cell by decade as the response variable.We also performed further sensitivity analyses by (i) matching virus discovery data and time-varying covariate data by year and (ii) testing for lag effects by matching virus discovery at year t and predictors at t-1 to t-5 year (Appendix4).
All BRT models were fitted in R v. 3.6.3, using packages dismo and gbm. BRT models require the user to balance three parameters including tree complexity, learning rate, and bag fraction. Tree complexity reflects the order of interaction in a tree; learning rate shrinks the contribution of each tree to the growing model; bag fraction specifies the proportion of data drawn from the full training data at each step. We set these parameters as recommended from Elith et al., 2008, and make sure each resampling model contained at least 1000 trees. BRT models identified the final optimal number of trees in each model using a 10-fold cross validation stagewise function (Elith et al., 2008). The three parameter values of the optimal model as well as the mean optimal number of trees across 1000 replicate models for all three regions were summarised in Appendix 1—table 3.
By fitting 1000 replicate BRT models, the relative contribution plots and partial dependence plots with 95% quantiles were plotted. We defined variables with a relative contribution greater than the mean (3.03%) as influential predictors in all three regions (Shearer et al., 2018). The partial dependence plots depict the influence of each variable on the response while controlling for the average effects of all the other variables in the model. The map of virus discovery probability across each region in 2010–2019 was derived from the means of the predictions of 1000 replicate models, using values of the 33 predictors in 2015. In order to show discovery hotspots, we converted the prediction map of virus count to a map of probability.
Two statistics were calculated to evaluate the model’s predictive performance: (a) the deviance of the bootstrap model (Elith et al., 2008), (b) intraclass correlation coefficient (ICC) calculated from 50 rounds of 10-fold cross-validation, by following methods from our previous paper (Zhang et al., 2020). For the 10-fold cross-validation, we selected 50 data sets randomly from the 1000 bootstrapped subsamples. We took the first data set and partitioned into 10 subsets. For each round of 10-fold cross-validation, the unique combinations of nine subsets constituted the training sets and were used to fit models, and the remaining one was used as a test set to evaluate the predictive performance of the model. We repeated the same process as above for the remaining 49 data sets. One intraclass correlation coefficient (ICC) was calculated from each round of validation and the median with 95% quantiles across all 50 rounds was calculated. The ICC varies between 0 and 1, with an ICC of less than 0.40 representing a poor model, 0.40–0.59 representing a fair model, 0.60–0.74 representing a good model, and 0.75–1 representing an excellent model (Cicchetti, 1994).
Exploratory subgroup analyses distinguishing viruses firstly discovered in regions and those that had been discovered elsewhere in the world were performed. We used the same BRT modelling approach as we described above, and relative contribution of each predictor was calculated for each subgroup. We were unable to perform subgroup analysis for China because only nine human-infective RNA viruses have been firstly discovered in it, and the BRT model cannot be fitted to a sample as small as 9.
R software, version 3.6.3 (R Foundation for Statistical Computing, Vienna, Austria) was used for all statistical analyses. All maps were visualised by using ArcGIS Desktop 10.5.1 (Environmental Systems Research Institute).
Results
The numbers of human-infective virus species discovered in the United States, China, and Africa up to October 2019 were 95, 80, and 107, respectively (Appendix 1—table 1). Most first discoveries have been in eastern United States (especially in areas around Maryland, Washington, D.C., and New York), eastern China (developed cities including Beijing, Hong Kong, Shanghai, and Guangzhou), and southern and central Africa (Pretoria and Johannesburg, South Africa; Borno State and Ibadan, Nigeria) (Figure 1). A total of 60 virus species were previously reported in all three regions, and 27, 12, 37 species were only found in the United States, China, and Africa, respectively (Figure 2). In all three regions, smaller proportions of viruses were vector-borne [United States: 23.2% (22/95); China: 21.3% (17/80); Africa: 27.1% (29/107)] and strictly zoonotic [United States: 30.5% (29/95); China: 16.3% (13/80); Africa: 33.6% (36/107)], compared to large proportions for both virus types at the global scale [vector-borne: 41.7% (93/223) and strictly zoonotic: 58.7% (131/223)] (Figure 2). The 60 shared species were also disproportionally vector-borne [11.7% (7/60)] and strictly zoonotic [7% (4/60), Figure 2].
Figure 1
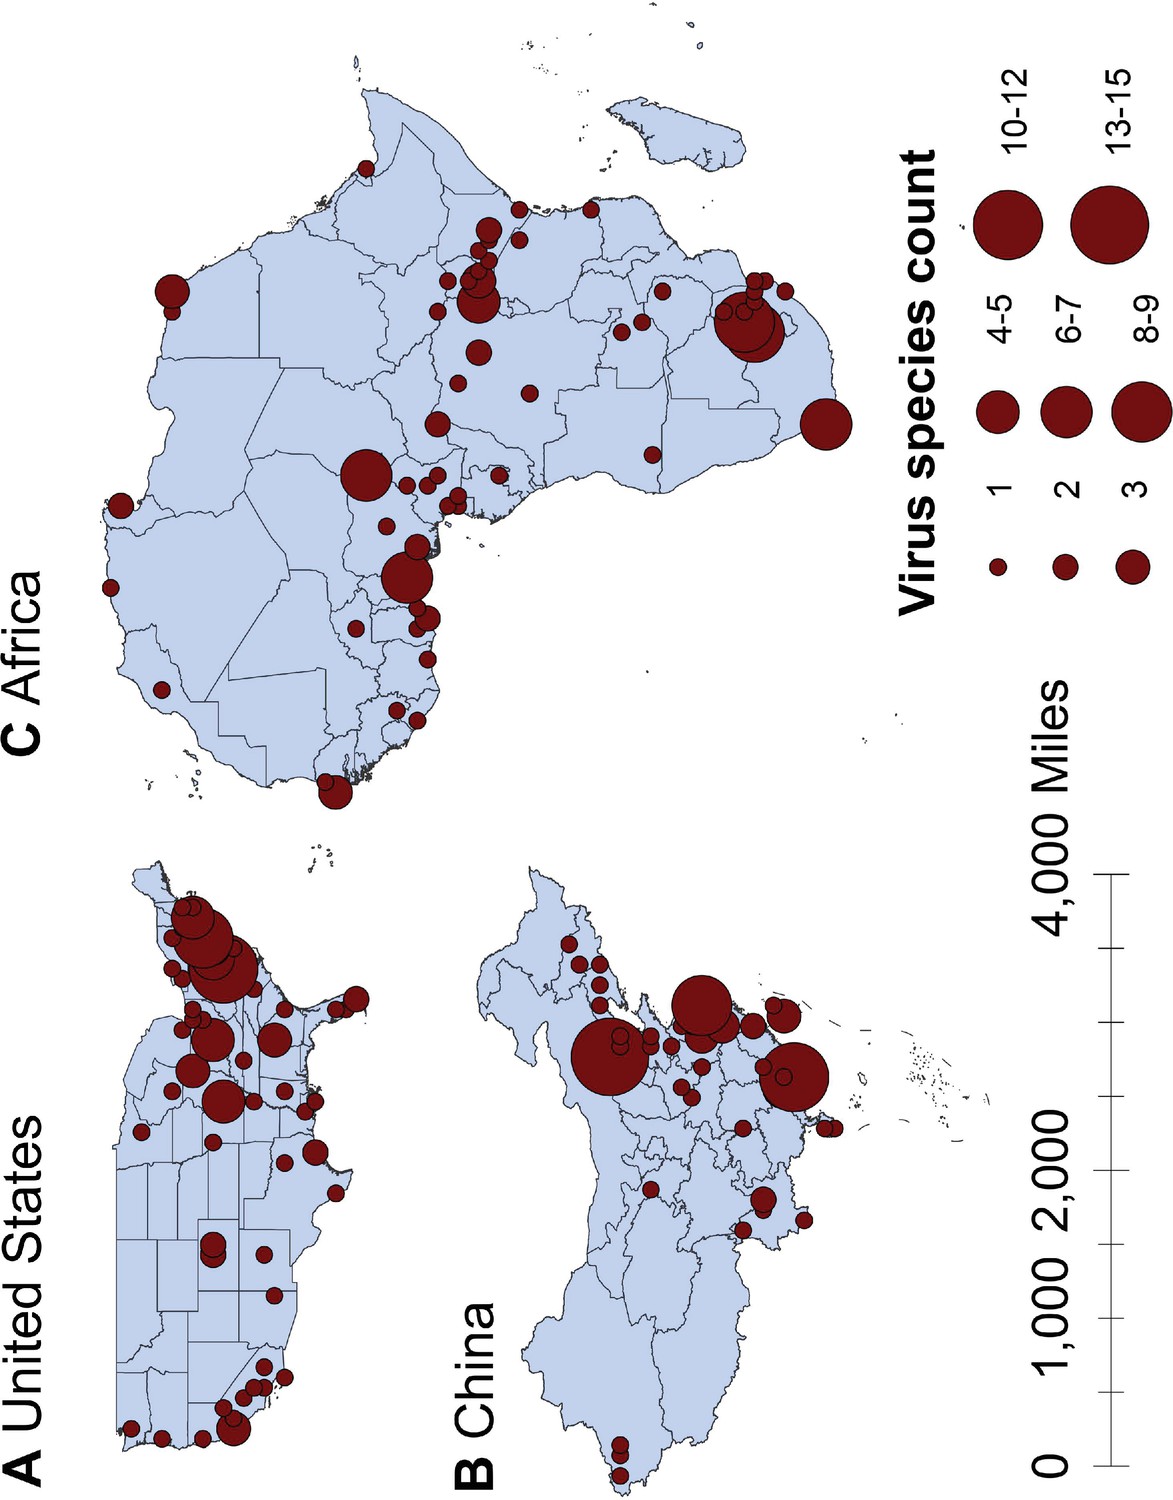
Spatial distribution of human-infective RNA virus discovery in three regions, 1901–2019.
(A) United States. (B) China. (C) Africa. Red dots represent discovery points or centroids of polygons, with the size representing the cumulative virus species count.
Figure 2
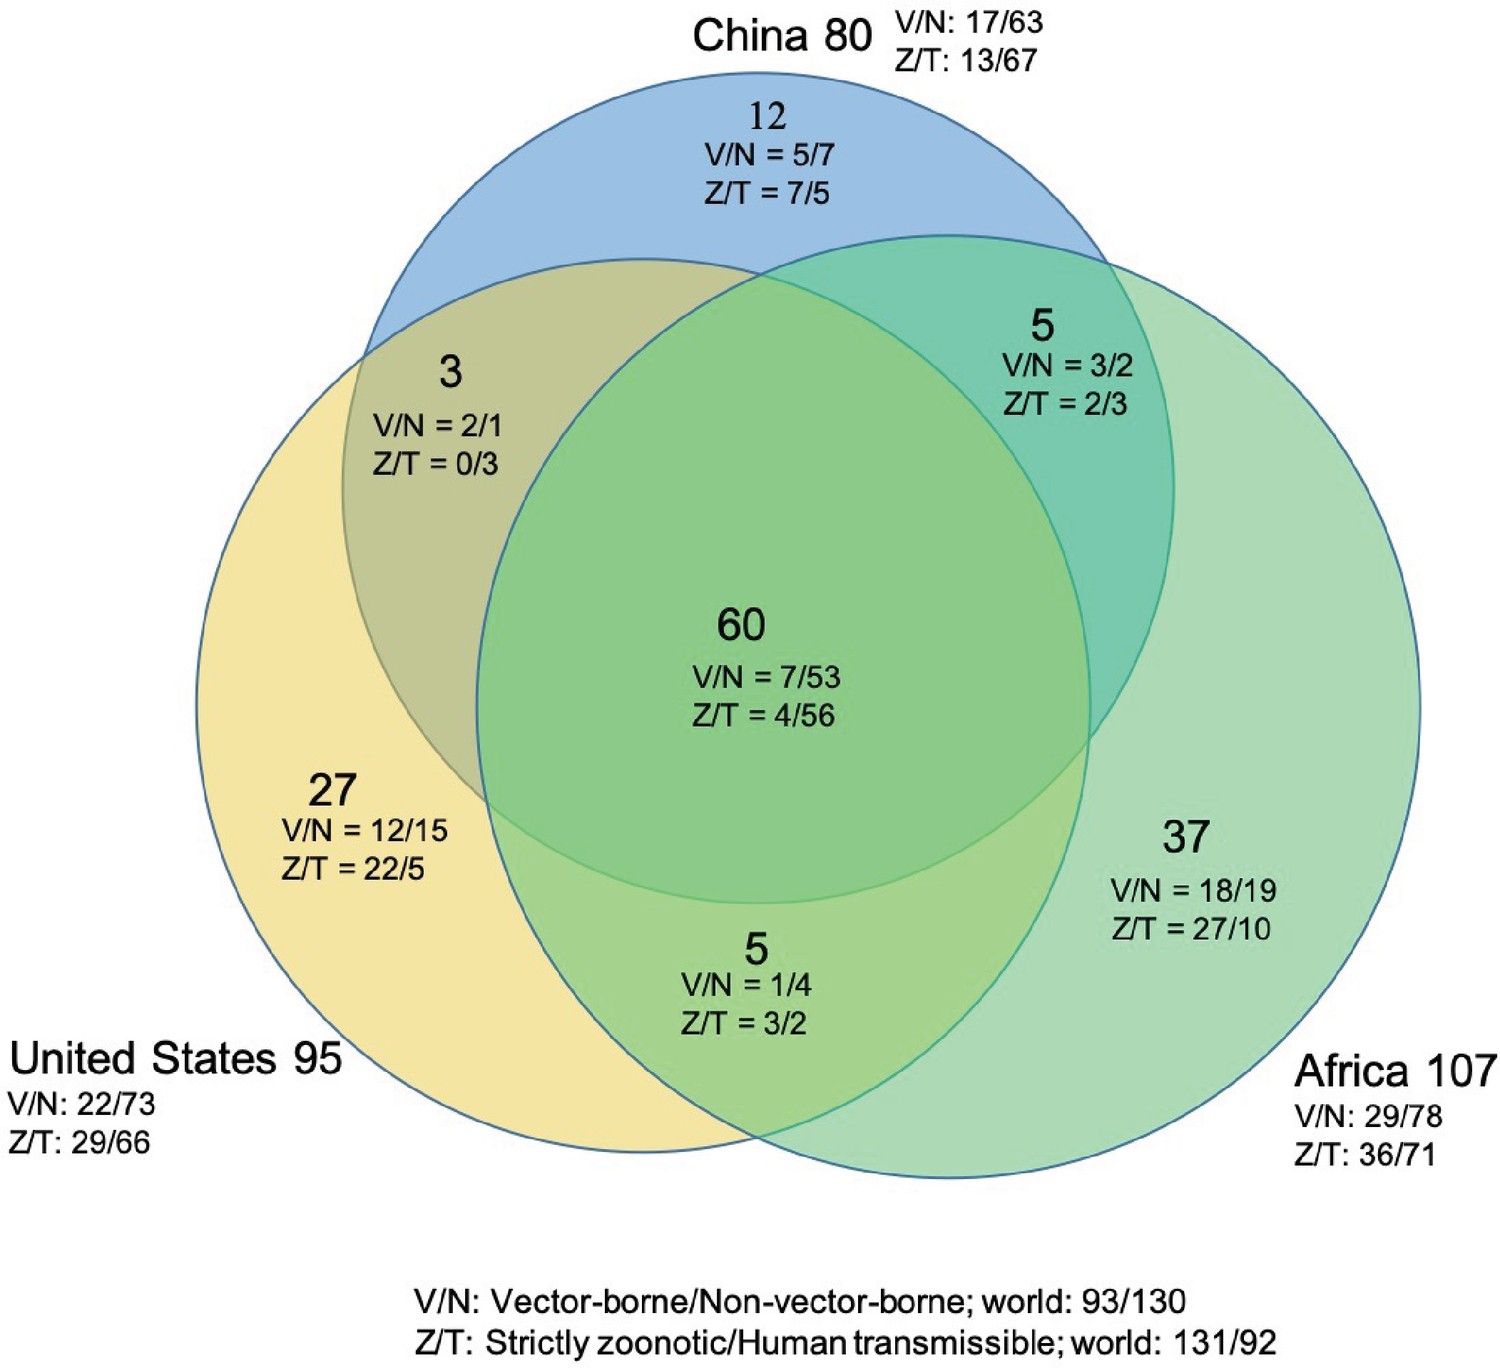
Shared human-infective RNA virus species count in three regions.
Under/By the species count the ratios of vector-borne (V) to non-vector-borne (N) viruses and strictly zoonotic (Z) to human transmissible (T) viruses were shown.
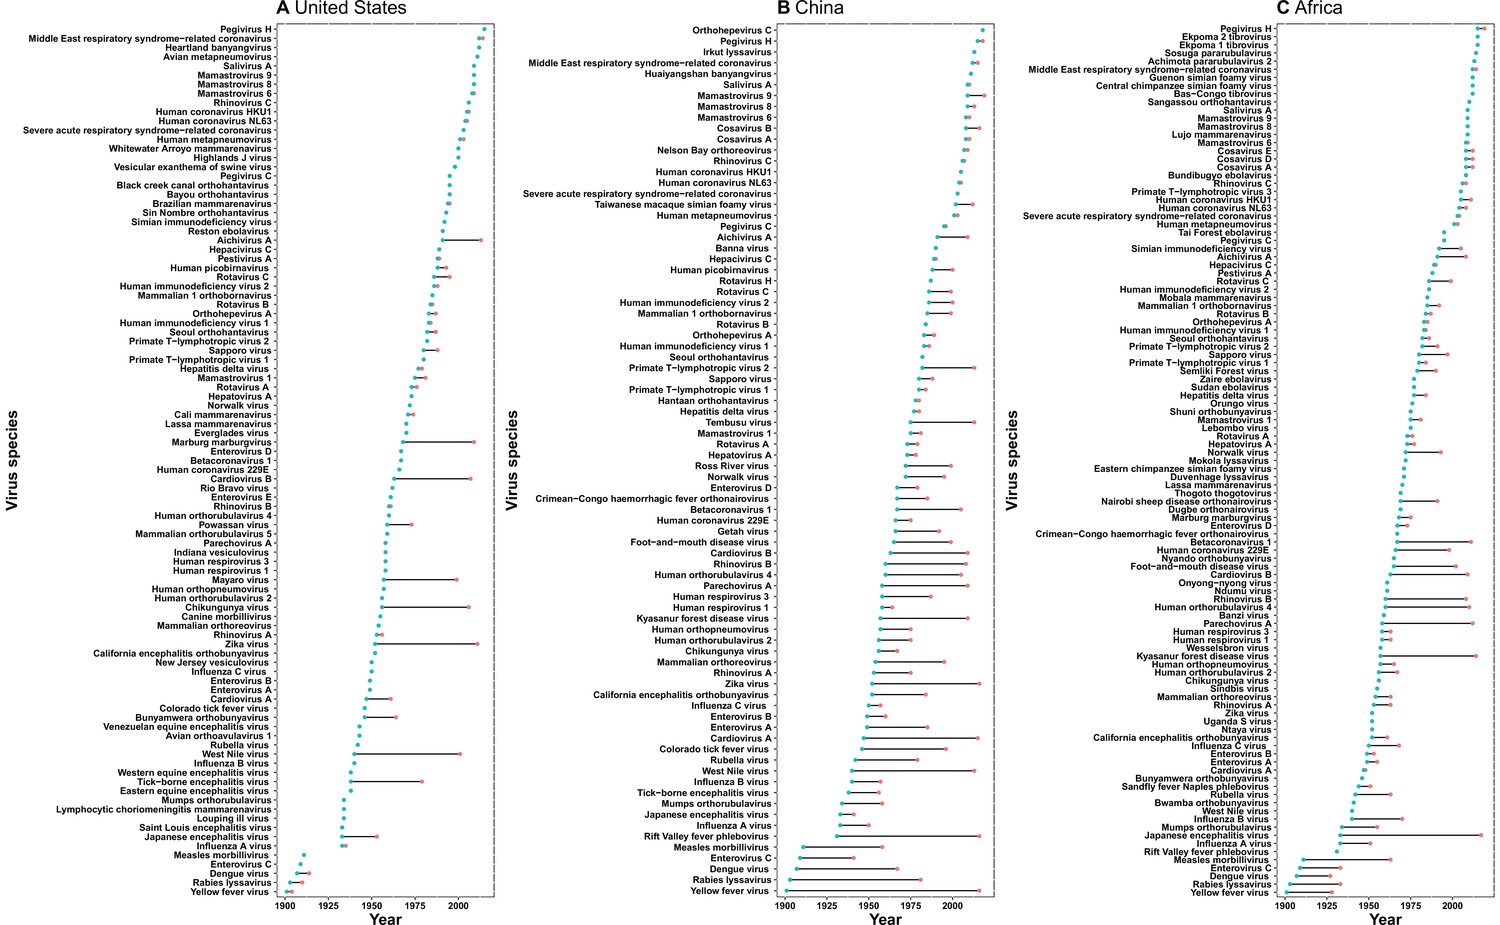
The discovery curves for the United States and Africa have seen a broadly similar pattern, with China lagging behind these two regions (Figure 3). The median time lag between the original discovery year of each virus in the world and the discovery year of each virus in each region was 0 [interquartile range (IQR): 2.5], 12 (IQR: 29.5), and 2 (IQR: 10.5) years in the United States, China, and Africa, respectively (Appendix 3—figure 2). In China, the time lag was noticeably shorter for viruses discovered after 1975 [before 1975: a median lag of 30.5 (IQR: 30.5) years; after 1975: 2.5 (IQR: 7) years, p value of Wilcoxon rank sum test < 0.001].
Figure 3
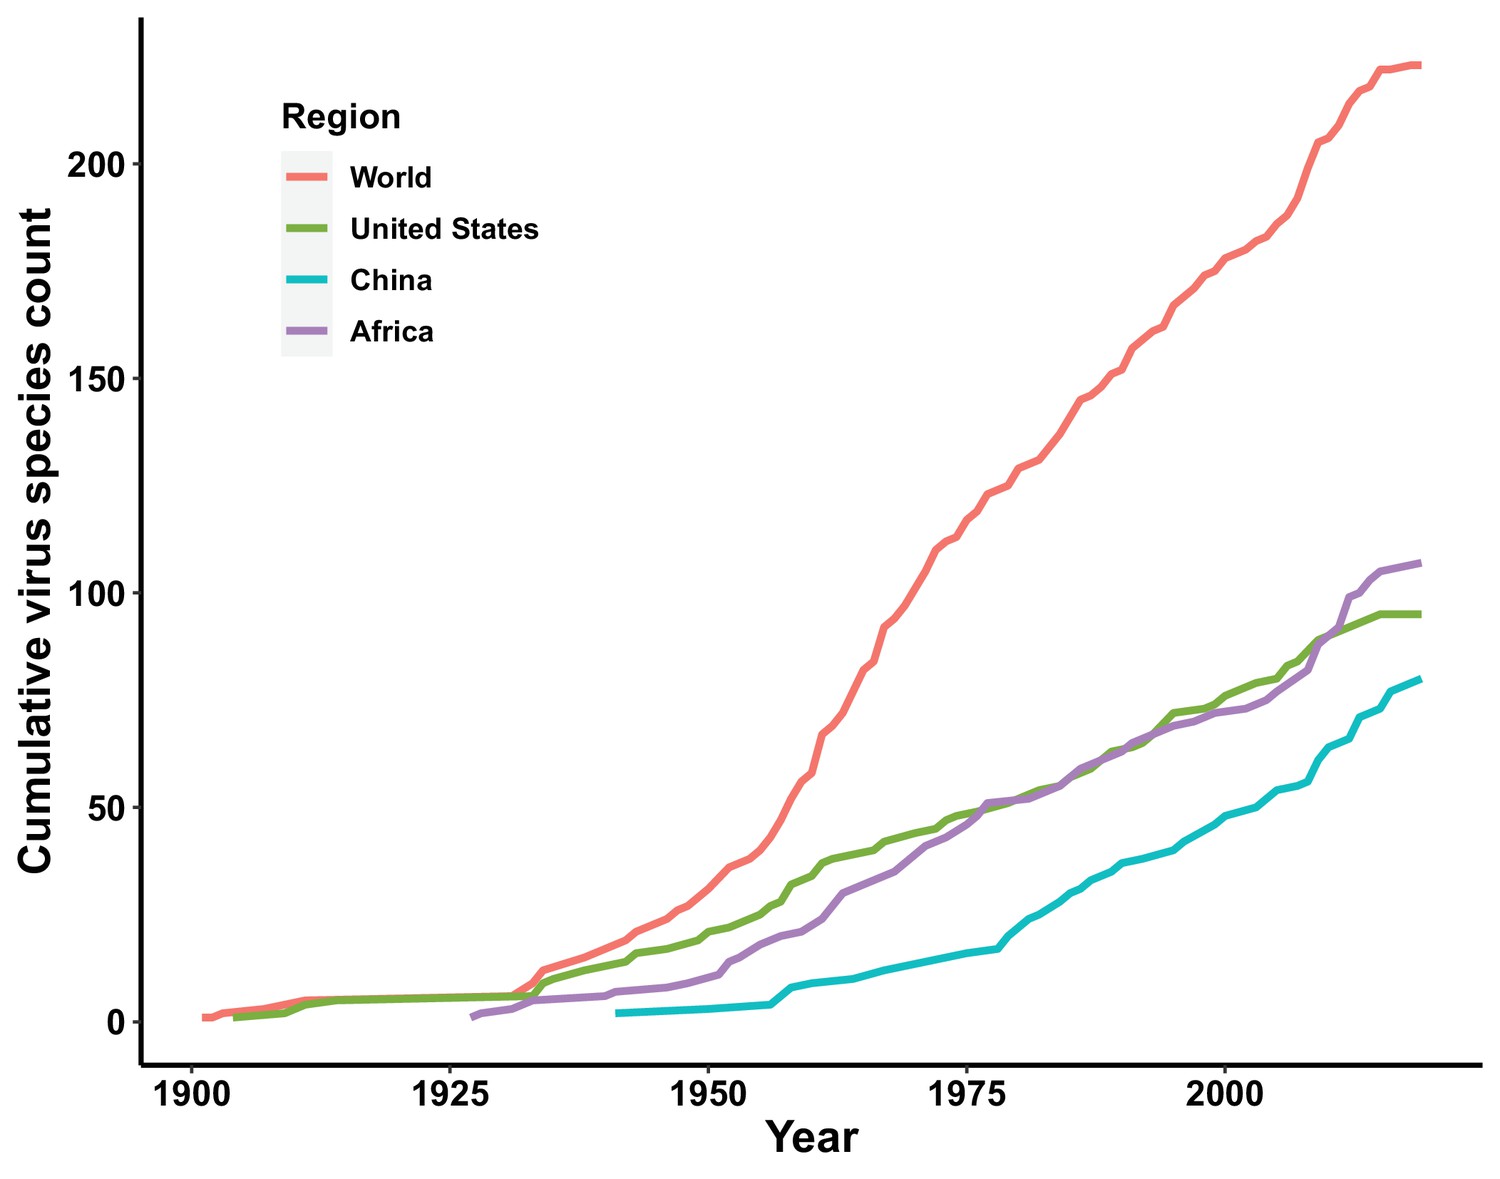
Discovery curve of human-infective RNA virus species in three regions and the world.
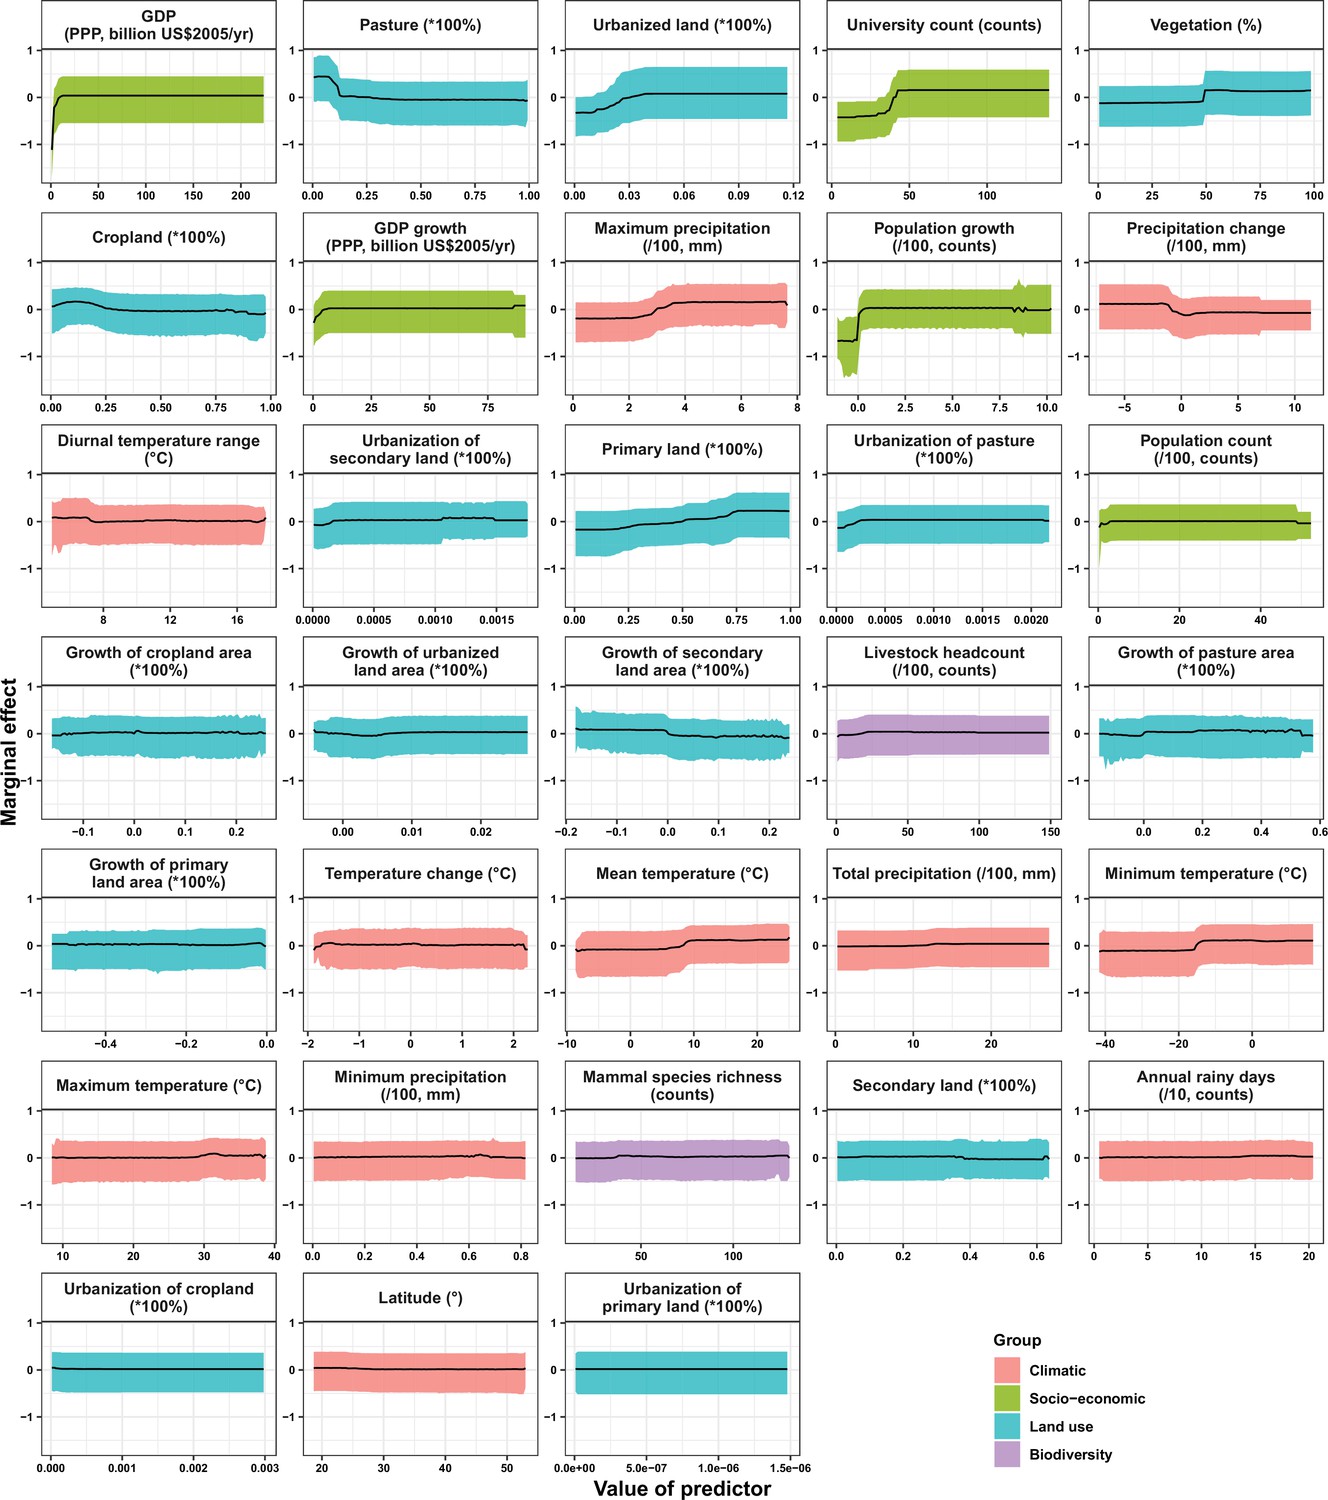
In the United States, six variables including three predictors related to land use [urbanized land: relative contribution of 35.8%, urbanization of cropland (i.e. the percentage of land area change from cropland to urban land): 8.0%, growth of urbanized land: 4.1%], two socio-economic variables (GDP growth: 10.0%; GDP: 5.7%), and one climatic variable (diurnal temperature change: 4.9%) were identified as important predictors for discriminating between locations with and without virus discovery (Figure 4A). The partial dependence plots shown in Appendix 3—figure 3 suggested non-linear relationships between the probability of virus discovery and most predictors. All important predictors presented a positive trend over narrow ranges at lower values.
Figure 4
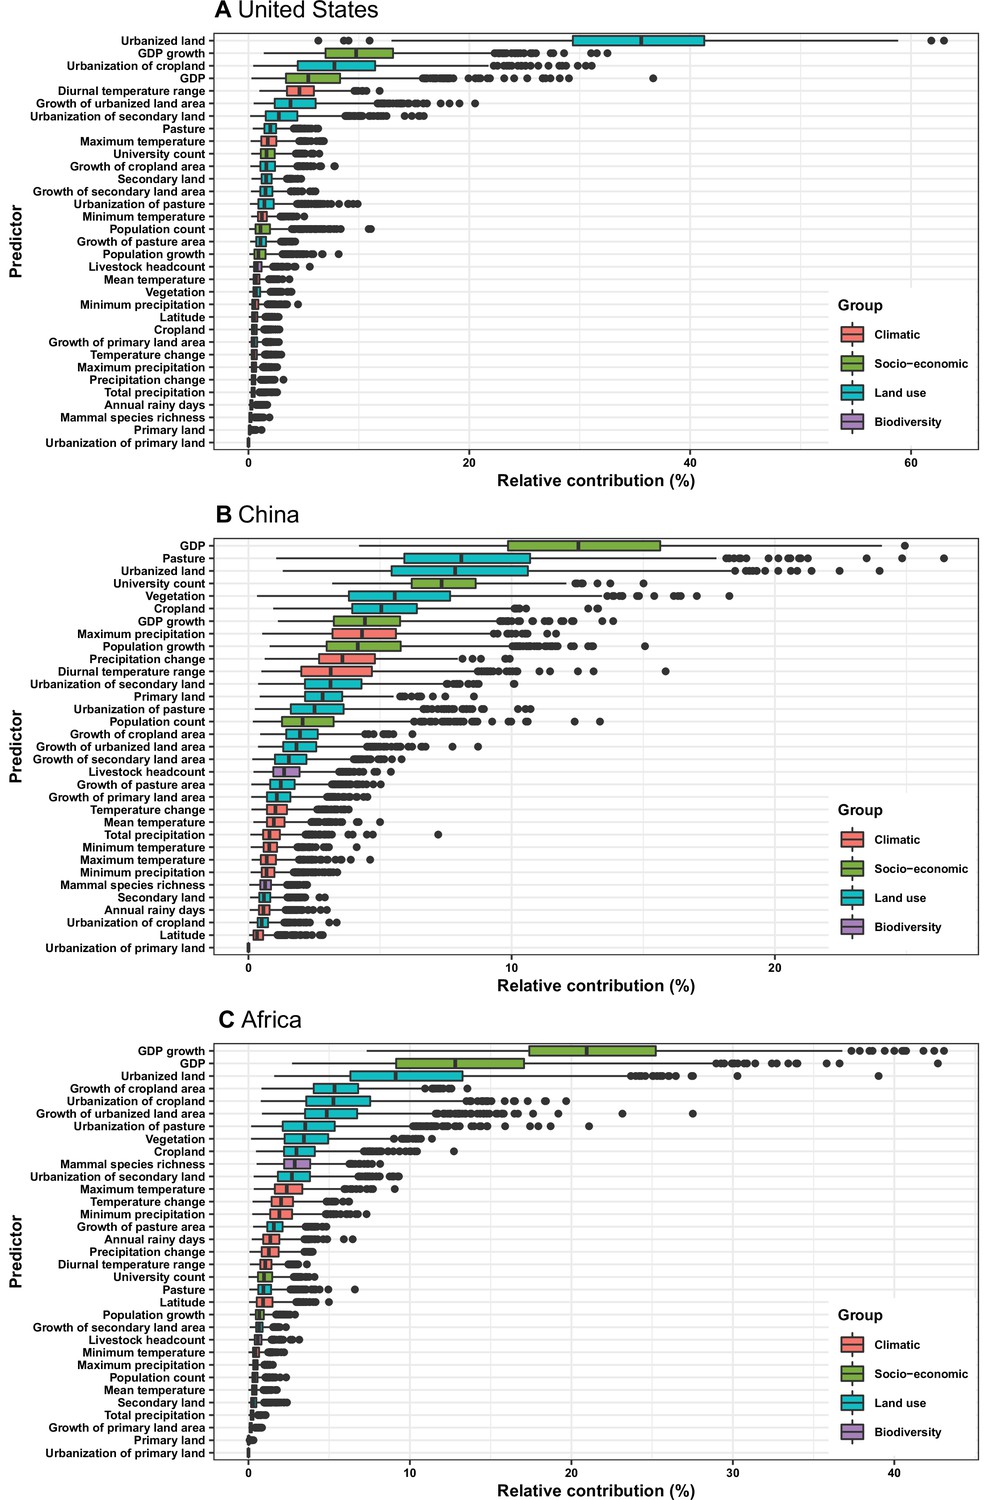
Relative contribution of predictors to human-infective RNA virus discovery in three regions.
(A) United States. (B) China. (C) Africa. The boxplots show the median (black bar) and interquartile range (box) of the relative contribution across 1000 replicate boosted regression tree models, with whiskers indicating minimum and maximum and black dots indicating outliers.
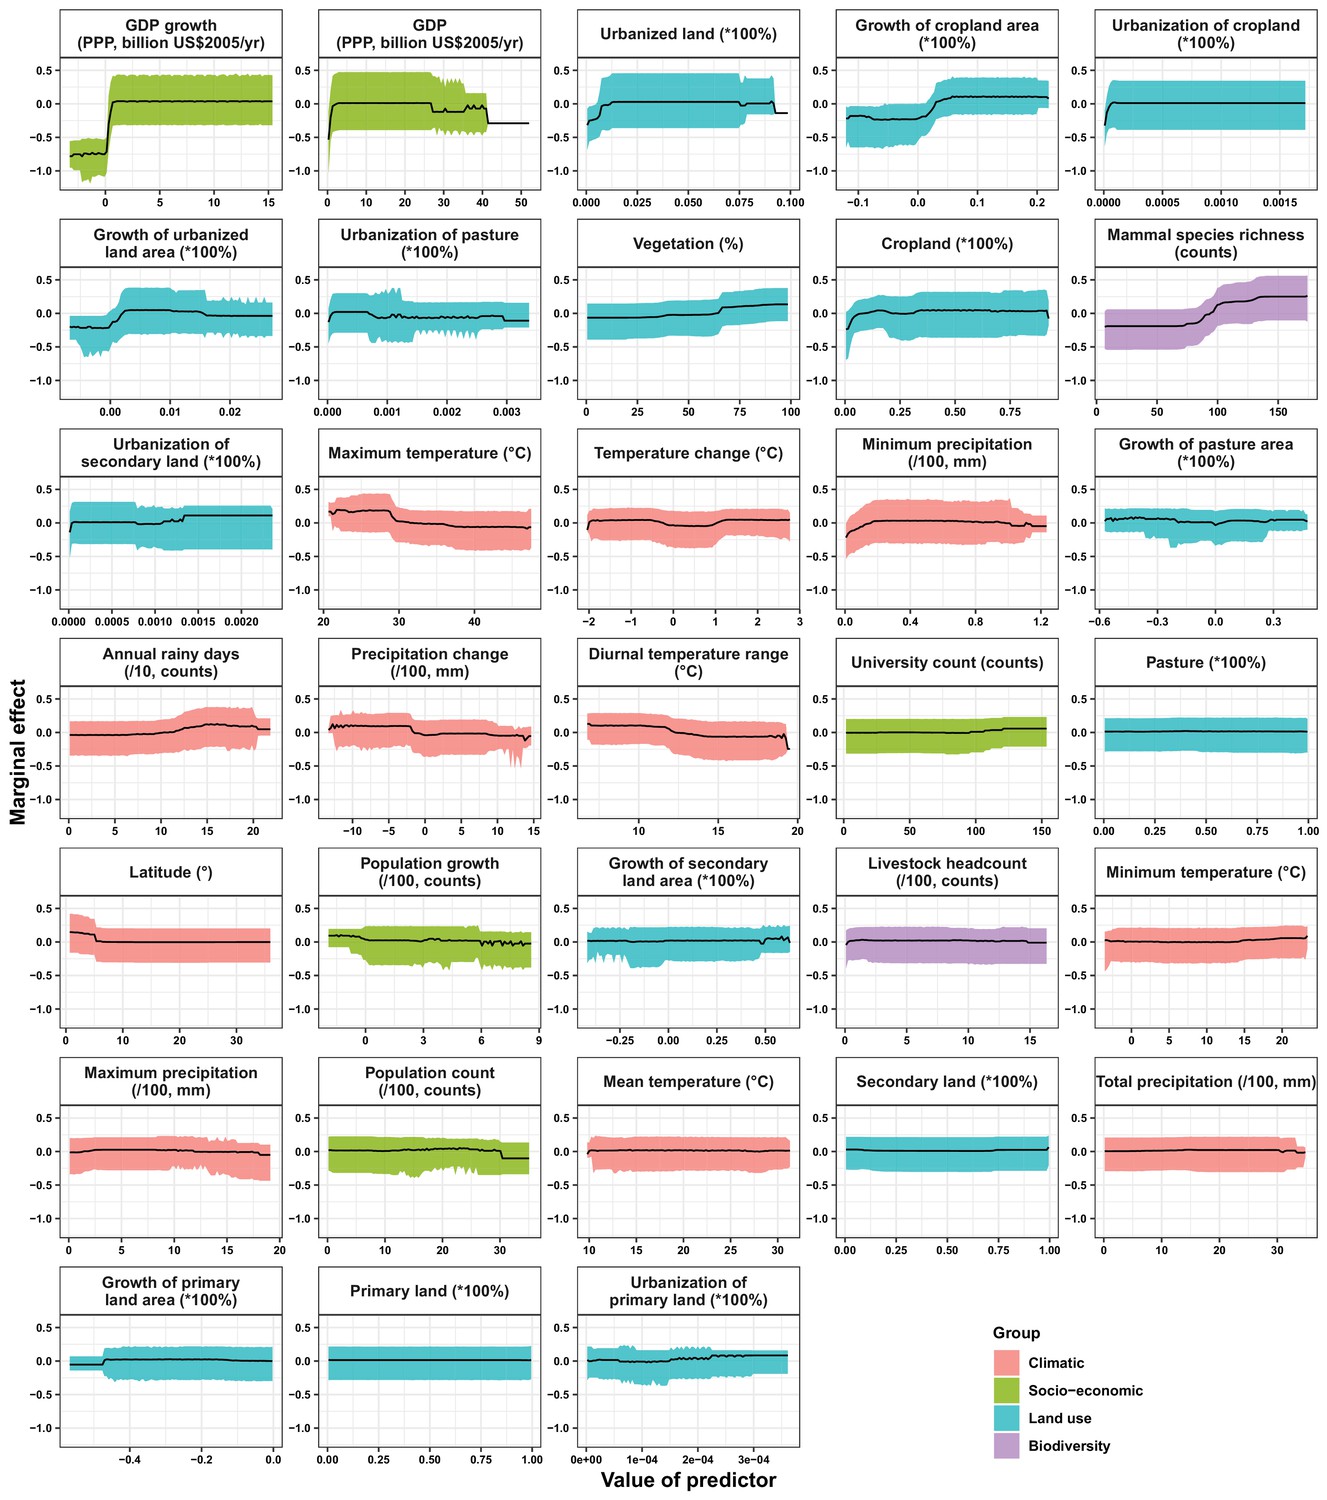
In China, twelve variables including four socio-economic variables (GDP: 12.7%, university count: 7.5%, GDP growth: 4.6%, population growth: 4.4%), five predictors involving land use [pasture: 8.3%, urbanized land: 8.1%, vegetation: 5.8%, cropland: 5.3%, urbanization of secondary land (the percentage of land area change from secondary land to urban land; secondary land is natural vegetation that is recovering from previous human disturbance): 3.3%], and three climatic variables (maximum precipitation: 4.5%, precipitation change: 3.8%, diurnal temperature range: 3.3%) were identified as important predictors for discriminating between locations with and without virus discovery (Figure 4B). GDP, urbanized land, university count, vegetation, GDP growth, maximum precipitation, population growth, and urbanization of secondary land presented a positive trend over narrow ranges at lower levels; pasture, cropland, precipitation change, and diurnal temperature range had non-monotonic/ negative impacts, with highest risks at lower values (Appendix 3—figure 4).
In Africa, ten variables including two socio-economic variables (GDP growth: 21.2%, GDP: 13.0%), seven predictors related to land use (urbanized land: 9.4%, growth of cropland area: 5.6%, urbanization of cropland: 5.5%, growth of urbanized land: 5.1%, urbanization of pasture: 3.8%, vegetation, 3.7%, cropland: 3.2%), and one biodiversity variable (mammal species richness: 3.1%) were identified as important predictors for discriminating between locations with and without virus discovery (Figure 4C). All important predictors presented a positive trend over narrow ranges at lower positive values, except mammal species over a large range (Appendix 3—figure 5).
Our BRT models reduced Moran’s I value below 0.15 in all three regions (Appendix 3—figure 6), suggesting that BRT models with 33 predictors have adequately accounted for spatial autocorrelations in the raw virus data in all three regions. The model validation statistics for each region are shown in Appendix 1—table 4. Combining these measures, our BRT model predictions range from fair to good (Cicchetti, 1994). In our sensitivity analyses based on data matched by year (Appendix 3—figure 7) and 1–5 year lag (results of 1 year lag shown in Appendix 3—figure 8), though there were several changes of relative contribution, the top predictors were broadly consistent with our main model based on data matched by decade (Figure 4).
In comparison with the whole world, human-infective RNA virus discovery was more associated with land use and socio-economic variables than climatic variables and biodiversity in all three regions (Figure 5). The comparison of four groups of predictors between three regions showed that: the greatest contribution of climatic variables to the discovery of human-infective RNA viruses was in China; the greatest contribution of land use was in the United States; the greatest contribution of socio-economic variables and biodiversity was in Africa and least in the United States.
Figure 5
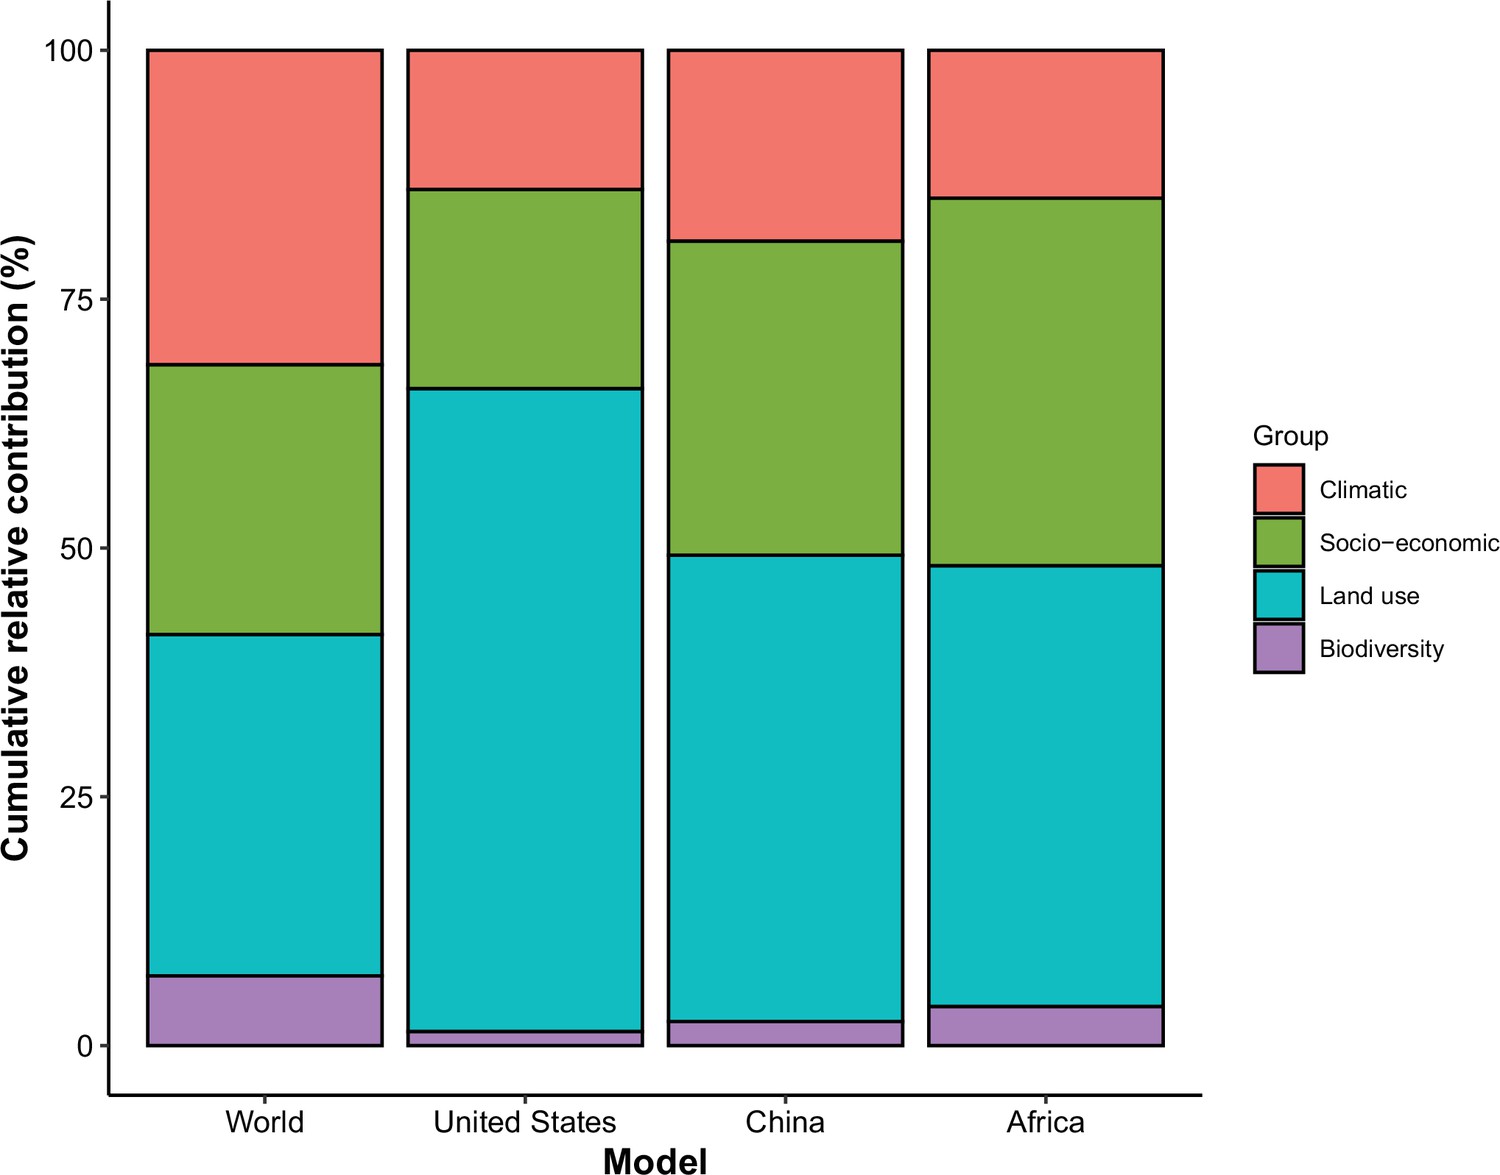
Cumulative relative contribution of predictors to human-infective RNA virus discovery by group in each model of different regions.
The relative contributions of all explanatory factors sum to 100% in each model, and each colour represents the cumulative relative contribution of all explanatory factors within each group.
We mapped human-infective RNA virus discovery probability in 2010–2019 for the three regions, based on the fitted BRT models and values of all 33 predictors in 2015 (Appendix 3—figure 9 to Appendix 3—figure 11). Outside contemporary risk areas where human-infective RNA viruses were previously discovered in the United States (Figure 1A), we predicted high probabilities of virus discovery across southern Michigan, central-Northern Carolina, central Oklahoma, southern Nevada, and north-eastern Utah (Figure 6A). Outside contemporary risk areas where human-infective RNA viruses were previously discovered in China (Figure 1B), we predicted high probabilities of virus discovery across other eastern China area as well as two western areas including south-central Shaanxi and north-eastern Sichuan (Figure 6B). Outside contemporary risk areas where human-infective RNA viruses were previously discovered in Africa (Figure 1C), we predicted high probabilities of virus discovery across northern Morocco, northern Algeria, northern Libya, south-eastern Sudan, central Ethiopia and western Democratic Republic of the Congo (Figure 6C). Most new virus species since 2010 in each region (6/6 in the United States, 19/19 in China, 12/19 in Africa) were discovered in high-risk areas (85% percentiles of predicted probability across each region) as predicted by our model. Of all the 37 (United States: 6; China: 19; Africa: 12) viruses discovered in high-risk areas in 2010–2019, 13 (United States: 2; China: 7; Africa: 4) viruses were discovered at the potential new hotspots where there have not been any virus discoveries before 2010.
Figure 6
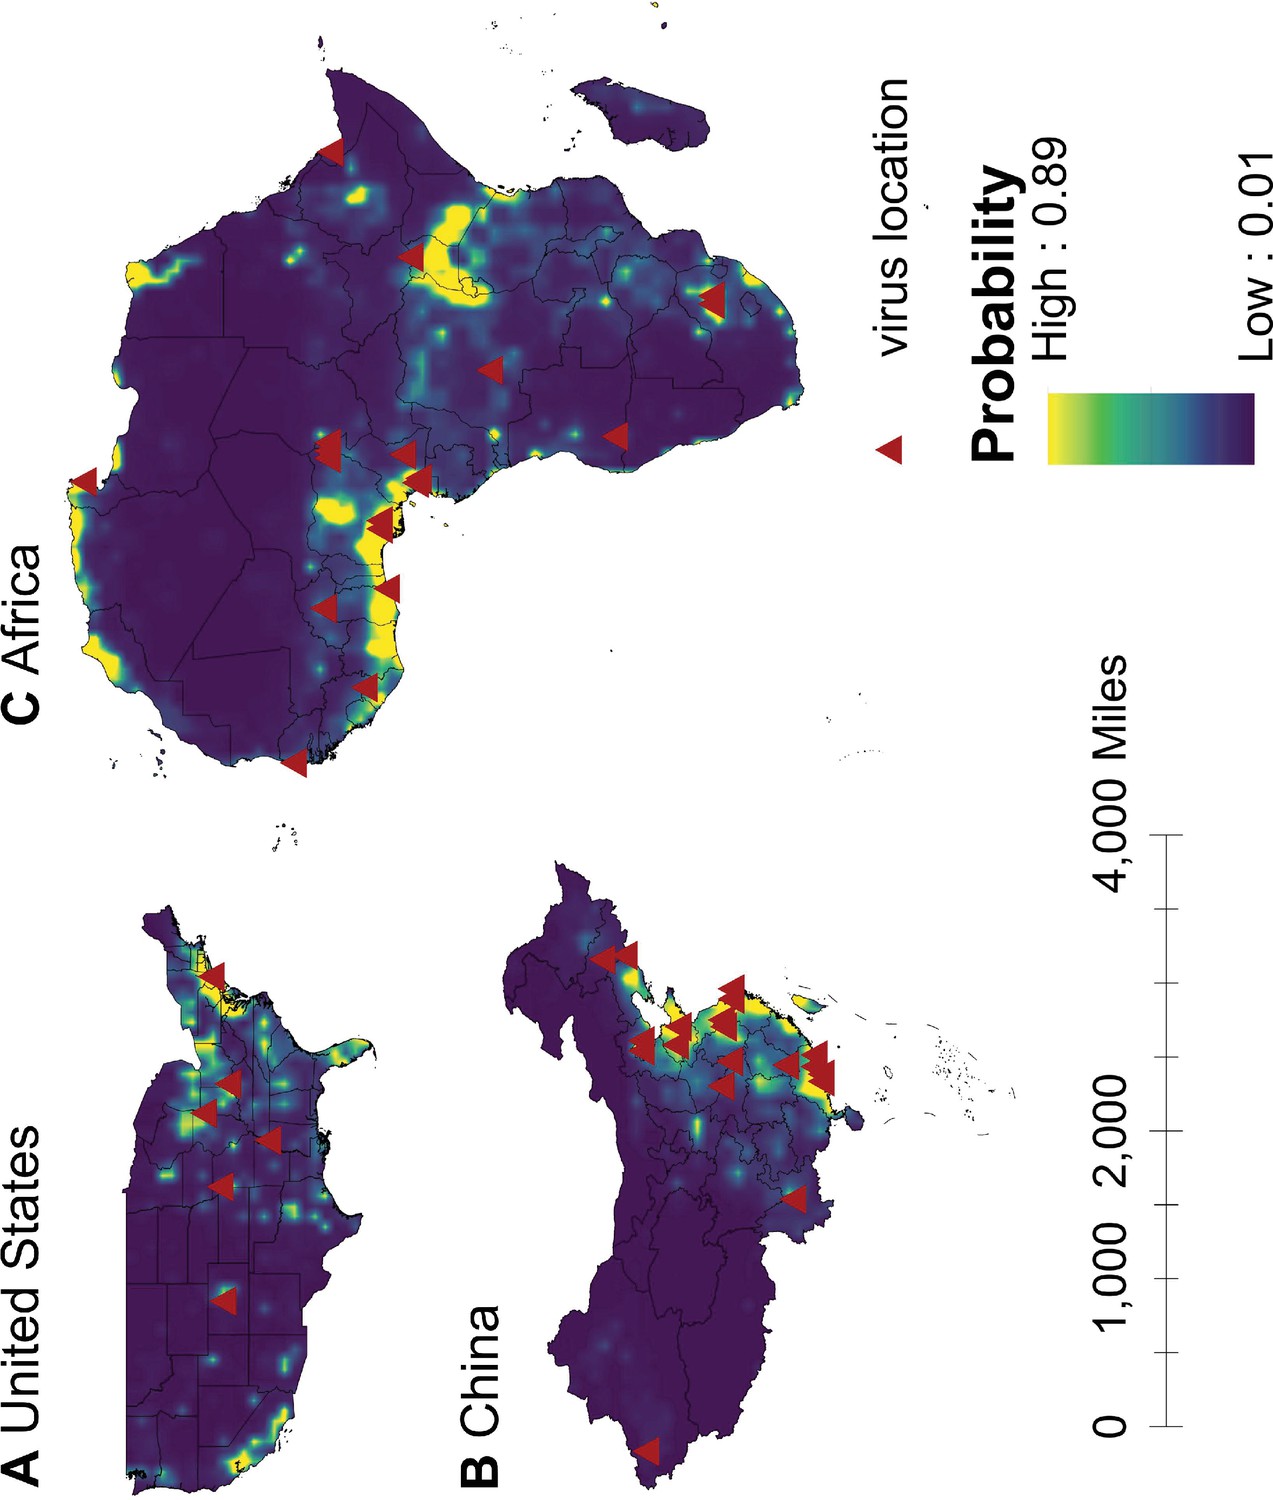
Predicted probability of human-infective RNA virus discovery in three regions in 2010–2019.
(A) United States. (B) China. (C) Africa. The triangles represented the actual discovery sites from 2010 to 2019, and the background colour represented the predicted discovery probability.
Based on our subgroup analysis distinguishing viruses firstly discovered in regions and those that had been discovered elsewhere in the world, discoveries of human-infective RNA viruses first discovered from either United States or Africa were better predicted by climatic and biodiversity variables, while discoveries of viruses that had been discovered from elsewhere in the world were better predicted by socio-economic variables (Appendix 3—figure 12).
Discussion
To our knowledge, this analysis represents the first investigation of human-infective RNA virus discovery in three large regions of the world which have experienced distinct socio-economic, ecological and environmental changes over the last 100 years. In total, 95 human-infective RNA virus species had been found in the United States; 80 in China; 107 in Africa. The discovery maps of human-infective RNA virus in the three regions indicated areas with historically high discovery counts: eastern and western United States, eastern China, and central and southern Africa. BRT modelling suggested that the relative contribution of 33 predictors to human-infective RNA virus discovery varied across three regions, though climatic and biodiversity variables were consistently less important in all three regions than at a global scale. We mapped the probability of human-infective RNA virus discovery in 2010–2019 which would continue to be high in historical hotspots but, in addition, we identified several new hotspots in central-eastern and southwestern United States, eastern and western China, and northern Africa. These results offer a tool for public health practitioners and policymakers to better understand local patterns of virus discovery and to invest efficiently in surveillance systems at the local level.
In recent decades, factors that drive pathogen discovery have been comprehensively studied, e.g., (Morse, 2012). In general, evidence has come from three forms of analyses: analysis of single emergence event such as SARS, AIDS, and Ebola (Parrish et al., 2008), quantifying the spillover (or host switching/cross-host transmission) risk using traits of both hosts and viruses (Kreuder Johnson et al., 2015; Olival et al., 2017; Pulliam and Dushoff, 2009), and record of first emergence/discovery event in humans globally over time (Allen et al., 2017; Jones et al., 2008; Zhang et al., 2020). Of these, the latter form of analyses have linked the distribution of emerging infectious diseases across the globe to ecological, environmental, and socio-economic factors, predicted the high-risk areas for discovery of emerging zoonoses, and helped identify priority regions for investment in surveillance systems for new human viruses (Allen et al., 2017; Jones et al., 2008; Zhang et al., 2020). In addition to these analyses, our current regional analyses identified more precise hotspots for virus discovery in three large regions of the world. Because zoonotic viruses are responsible for most historical endemics and epidemic diseases, several projects such as the Global Virome project (GVP), the PREDICT project, and the Vietnam Initiative on Zoonotic Infections (VIZIONS) were launched to construct a comprehensive data set of unknown viruses with epidemic potential from specific animals likely to harbour high-risk viruses, humans having a high contacting rate with animals, and animal-human interfaces with high spill-over probability (Carroll et al., 2018; Morse, 2012; Rabaa, 2015). These hotspots analyses indicate priority regions for surveillance for new viruses for these projects.
In all three regions, GDP and/or GDP growth were identified as important predictors for virus discovery. This is consistent with our previous analysis that GDP and GDP growth play a major role in discovering viruses (Zhang et al., 2020). In general, sufficient economic, human and material resources, the availability of advanced infrastructure and technology, and greater research capabilities in the relative higher income areas enable the virus discovery (Rosenberg et al., 2013). That this effect applied both within one continent and within single countries such as the United States and China suggested that most virus discoveries were likely passive, that is, the viruses were detected when they arrived in a location with the resources to detect them. This is plausible because in all regions in our study, human-transmissible viruses accounted for the larger proportion, and our previous analysis suggested richer areas were more likely to first capture transmissible viruses (e.g. Influenza virus, Rhinovirus, Rabies lyssavirus, Measles morbillivirus, Mumps orthorubulavirus, Rubella virus, and Norwalk virus) capable of spreading to multiple areas (Zhang et al., 2020). Temporally, in China the rate of discovery increased after economic growth accelerated in the 1980s (Figure 3). We note in publications describing first virus discoveries that most historical virus discoveries in Africa received support from the United States and Europe, and this may explain why Africa saw an increased number of virus discoveries after 1950—30 years earlier than China (Figure 3). Notably, in contrast to Africa, university count was found to be associated with virus discovery in China, suggesting virus discovery likely being a significant area of research in Chinese universities. Our model also suggested the overall socio-economic factors contributed less in the United States than other two regions. The possible explanation is that the socio-economic level across the whole United States is relatively high and homogenous.
Predictors other than GDP and university count are likely to be linked to virus natural history. In all three regions, the area of urban land and further urbanization made great contribution to virus discovery. This reinforced previous studies that urbanization was linked to the detection of new human pathogens through the denser urban population, increased human-wildlife contact rate, spill-over of human infection from enzootic cycle, and the contamination of the urban environment with microbial agents (Hassell et al., 2017; Olival et al., 2017; Weaver, 2013). In the United States, land use contributed more to virus discovery than in other regions—urbanized land, urbanization of cropland, and growth of urbanized land alone had a relative contribution of 47.9%. It is possible that land use change in the US is driving both the emergence of novel viruses and their discovery, as has been suggested for Heartland virus (Mansfield et al., 2017; Savage et al., 2013) and several hantaviruses (Hassell et al., 2017).
Climate had less influence on human-infective RNA virus discovery in all three regions in comparison to other predictors, in contrast to virus discovery at a global scale (Zhang et al., 2020). The underlying reason may be that the proportion of vector-borne viruses—whose distribution and abundance is strongly associated with the impact of climate on vector populations (Li et al., 2014)—in all three regions (United States: 23.2%; China: 21.3%; Africa: 27.1%) were less than that in the world (41.7%) (Figure 3). Vector-borne viruses tend to have more restricted global ranges, so are less likely to appear in a study of any one region (Zhang et al., 2020).
In addition, a relatively smaller proportion of strictly zoonotic viruses in three regions (United States: 30.5%; China: 16.3%; Africa: 33.6%) than that in the world (58.7%) (Figure 2) made biodiversity contribute less to virus discovery in the three regions than in the world (Zhang et al., 2020). With exposure to a higher density of mammals played a slightly larger role in virus discovery in Africa than in China and the United States (Appendix 3—figure 9 to Appendix 3—figure 11).
Our discovery probability maps for 2010–2019 in three regions captured most historical hotspots, though several small new areas in central-eastern and southwestern United States, eastern and western China, as well as northern Africa would also make greater contribution to virus discovery (Figure 6). Our model has a good predictive ability, given 84% (37/44) new virus species in 2010–2019 were discovered in high-risk areas we have defined—85% percentiles of discovery probability within each region. Further, 35% (13/37) of those viruses discovered in high-risk areas since 2010 were discovered at the potential new hotspots where there had not been any virus discoveries in the past.
Our subgroup analyses distinguishing viruses firstly discovered in regions and those that had been discovered elsewhere in the world suggested in both the United States and Africa, discoveries of viruses firstly discovered in regions were more likely to be associated with climatic and biodiversity variables while discoveries of viruses had been discovered elsewhere in the world were more likely to be associated with socio-economic variables. This is plausible, again because after a novel virus was discovered elsewhere in the world, it is usually areas with a higher socio-economic level that first capture the virus in the local region.
This study had limitations. First, one common problem for data collected from literature review is the time lag between virus discovery and publication, in which case the virus data are likely to be matched to covariates in later decades. Second, we acknowledge that it is possible we have not identified the earliest report for some well-known viruses such as yellow fever virus, measles virus, especially in the post-vaccination era. Third, we were unable to identify robust and comprehensive data for all three regions on virus discovery effort (e.g. government transparency, laboratory infrastructure and technology), although we interpret GDP and university count as being an indirect measure of resources available for this activity. Previous studies have tried to use the bibliographic data to correct for the discovery effort (; ). However, this strategy worked less well for our data as the frequency of published paper from virus-related scientific journals has only a weak link to publications on novel human-infective RNA virus (Appendix 3—figure 1).
The study adds to our previous study (Zhang et al., 2020) in several ways. First, we firstly construct data sets of human-infective RNA virus discovery reflecting the viral richness in three broad regions of the world. Second, we reduced the heterogeneity of the predictors by focusing on regions, including those predictors reflecting the research effort. Research effort is less variable within restricted regions and therefore has less effect on virus detection. This implies our predicted hotspots stand closer to the virus geographic distribution in nature. Third, the predicted hotspots derived from regional analysis have a higher precision than at a global scale, for example, specific areas in the United States and China were identified as hotspots from regional analysis, rather than the whole eastern area from the global analysis. This helps target areas for future surveillance.
In conclusion, a heterogeneous pattern of virus discovery-driver relationships was identified across three regions and the globe. Within regions virus discovery is driven more by land use and socio-economic variables; climate and biodiversity variables are consistently less important predictors than at a global scale. We mapped with good accuracy that in 2010–2019 three regions where human-infective RNA viruses had previously been discovered would continue to be the discovery hotspots, but in addition, several new areas in each region would make great contribution to virus discovery. Results from the study could guide active surveillance for new human-infective viruses in high-risk areas.
Appendix 1
Appendix 1—table 1
Summary of the human-infective RNA virus data sets in the United States, Africa, and China.
| Species | Original discovery year | United States | China | Africa | ||||||||||||
|---|---|---|---|---|---|---|---|---|---|---|---|---|---|---|---|---|
| Reported? | Discovery year | location | Lat | Lon | Reported? | Discovery year | location | Lat | Lon | Reported? | Discovery year | location | Lat | Lon | ||
| Argentinian mammarenavirus | 1958 | No | No | No | ||||||||||||
| Brazilian mammarenavirus | 1994 | Yes Barry et al., 1995 | 1995 | New Haven, Connecticut | 41.31 | --72.93 | No | No | ||||||||
| Cali mammarenavirus | 1971 | Yes Buchmeier et al., 1974 | 1974 | Houston, Texas | 29.76 | --95.37 | No | No | ||||||||
| Chapare mammarenavirus | 2008 | No | No | No | ||||||||||||
| Guanarito mammarenavirus | 1991 | No | No | No | ||||||||||||
| Lassa mammarenavirus | 1970 | Yes Buckley and Casals, 1970 | 1970 | New Haven, Connecticut | 41.31 | --72.93 | No | Yes Buckley and Casals, 1970 | 1970 | Lassa, Borno State, Nigeria | 10.69 | 13.27 | ||||
| Lujo mammarenavirus | 2009 | No | No | Yes Briese et al., 2009 | 2009 | Lusaka, Zambia | --15.39 | 28.32 | ||||||||
| Lymphocytic choriomeningitis mammarenavirus | 1934 | Yes Armstrong and Lillie, 1934 | 1934 | St. Louis county, Missouri | 38.61 | --90.41 | No | No | ||||||||
| Machupo mammarenavirus | 1964 | No | No | No | ||||||||||||
| Mobala mammarenavirus | 1985 | No | No | Yes Georges et al., 1985 | 1985 | Bouboui and Gomoka village, Boali town, Central African Republic | 4.89 | 18.14 | ||||||||
| Whitewater Arroyo mammarenavirus | 2000 | Yes Enserink, 2000 | 2000 | Alameda County, California | 37.60 | --121.72 | No | No | ||||||||
| Mamastrovirus 1 | 1975 | Yes Oshiro et al., 1981 | 1981 | Martin County, California | 40.22 | --123.10 | Yes Xu et al., 1981 | 1981 | Guangzhou, Guangdong | 23.13 | 113.26 | Yes Dowling and Wynne, 1981 | 1981 | Lebowa, South Africa | --23.5 | 29.5 |
| Mamastrovirus 6 | 2008 | Yes Finkbeiner et al., 2009c | 2009 | St. Louis, Missouri | 38.63 | --90.20 | Yes Chu et al., 2010 | 2010 | Hong Kong | 22.40 | 114.11 | Yes Kapoor et al., 2009 | 2009 | Maiduguri, Borno State, Nigeria | 11.83 | 13.15 |
| Mamastrovirus 8 | 2009 | Yes Finkbeiner et al., 2009a | 2009 | St. Louis, Missouri | 38.63 | --90.20 | Yes Wang et al., 2013 | 2013 | Nanjing, Jiangsu and Lanzhou, Gansu | 31.95 | 118.78 | Yes Kapoor et al., 2009 | 2009 | Maiduguri, Borno State, Nigeria | 11.83 | 13.15 |
| Mamastrovirus 9 | 2009 | Yes Finkbeiner et al., 2009b | 2009 | Accomack and Northampton Counties, Virginia | 37.71 | --75.81 | Yes Tao et al., 2019 | 2019 | Jinan, Shandong | 36.68 | 117.11 | Yes Kapoor et al., 2009 | 2009 | Maiduguri, Borno State, Nigeria | 11.83 | 13.15 |
| Mammalian 1 orthobornavirus | 1985 | Yes Rott et al., 1985 | 1985 | Philadelphia, Pennsylvania | 39.95 | --75.17 | Yes Chen et al., 1999 | 1999 | Taiwan | 23.70 | 120.96 | Yes Bode et al., 1992 | 1992 | Rural area of East Africa | --1.28 | 34.53 |
| Mammalian 2 orthobornavirus | 2015 | No | No | No | ||||||||||||
| Norwalk virus | 1972 | Yes Kapikian et al., 1972 | 1972 | Norwalk, Ohio | 41.24 | --82.62 | Yes Fang et al., 1995 | 1995 | Henan | 33.88 | 113.48 | Yes Taylor et al., 1993 | 1993 | Pretoria, Gauteng province, South Africa | --25.75 | 28.23 |
| Sapporo virus | 1980 | Yes Nakata et al., 1988 | 1988 | Houston, Texas | 29.76 | --95.37 | Yes Nakata et al., 1988 | 1988 | Shanghai | 31.23 | 121.47 | Yes Wolfaardt et al., 1997 | 1997 | Pretoria, Gauteng province, South Africa | --25.75 | 28.23 |
| Vesicular exanthema of swine virus | 1998 | Yes Smith et al., 1998 | 1998 | Corvallis, Oregon | 44.56 | --123.26 | No | No | ||||||||
| Alphacoronavirus 1 | 2007 | No | No | No | ||||||||||||
| Human coronavirus 229E | 1966 | Yes Hamre and Procknow, 1966 | 1966 | Chicago, Illinois | 41.88 | --87.63 | Yes Virus Research Group of Kun Number 323 Unit, The Chinese People’s Liberation Army, 1975 | 1975 | Kunming, Yunnan | 25.07 | 102.68 | Yes Hays and Myint, 1998 | 1998 | Kumasi, Ghana | 6.70 | --1.62 |
| Human coronavirus NL63 | 2004 | Yes Esper et al., 2005 | 2005 | New Haven, Connecticut | 41.31 | --72.93 | Yes Chan et al., 2005 | 2005 | Hong Kong | 22.40 | 114.11 | Yes Smuts et al., 2008 | 2008 | Cape Town, Western Cape Province, South Africa | --33.90 | 18.57 |
| Betacoronavirus 1 | 1967 | Yes McIntosh et al., 1967 | 1967 | Bethesda, Maryland | 38.98 | --77.09 | Yes Chan et al., 2005 | 2005 | Hong Kong | 22.40 | 114.11 | Yes Venter et al., 2011 | 2011 | Pretoria, Gauteng province, South Africa | --25.75 | 28.23 |
| Human coronavirus HKU1 | 2005 | Yes Esper et al., 2006 | 2006 | New Haven, Connecticut | 41.31 | --72.92 | Yes Woo et al., 2005 | 2005 | Hong Kong | 22.40 | 114.11 | Yes Venter et al., 2011 | 2011 | Pretoria, Gauteng province, South Africa | --25.75 | 28.23 |
| Middle East respiratory syndrome-related coronavirus | 2012 | Yes* Bialek et al., 2014 | 2014 | Lake county, Indiana | 41.45 | --87.37 | Yes* Gao and Song, 2015 | 2015 | Huizhou, Guangdong | 23.09 | 114.40 | Yes* Abroug et al., 2014 | 2014 | Monastir, Tunisia | 35.79 | 10.82 |
| Severe acute respiratory syndrome-related coronavirus | 2003 | Yes* Charles M, 2003 | 2003 | Atlanta, Georgia | 33.75 | --84.39 | Yes Peiris et al., 2003a | 2003 | Hong Kong | 22.40 | 114.11 | Yes Chiu et al., 2004 | 2004 | Pretoria, Gauteng province, South Africa | --25.75 | 28.23 |
| Human torovirus (been abolished) | 1984 | No | No | No | ||||||||||||
| Bundibugyo ebolavirus | 2008 | No | No | Yes Smuts et al., 2008 | 2008 | Bundibugyo and Kikyo town, Bundibugyo District, Western Uganda | 0.71 | 30.06 | ||||||||
| Reston ebolavirus | 1991 | Yes Miranda et al., 1991 | 1991 | Reston, Fairfax County, Virginia | 38.96 | --77.35 | No | No | ||||||||
| Sudan ebolavirus | 1977 | No | No | Yes Bowen et al., 1977 | 1977 | Maridi, South Sudan | 4.91 | 29.45 | ||||||||
| Tai Forest ebolavirus | 1995 | No | No | Yes Le Guenno et al., 1995 | 1995 | Abidjan, Cote-d’lvoire | 5.36 | --4.01 | ||||||||
| Zaire ebolavirus | 1977 | No | No | Yes Johnson et al., 1977 | 1977 | Yambuku village, Democratic Republic of the Congo | 2.83 | 22.22 | ||||||||
| Marburg marburgvirus | 1968 | Yes* Centers for Disease Control and Prevention, 2009 | 2009 | Denver county, Colorado | 39.55 | --105.78 | No | Yes Gear et al., 1975 | 1975 | Johannesburg, South Africa | --26.20 | 27.90 | ||||
| Aroa virus | 1971 | No | No | No | ||||||||||||
| Bagaza virus | 2009 | No | No | No | ||||||||||||
| Banzi virus | 1959 | No | No | Yes Smithburn et al., 1959 | 1959 | Maponde's Kraal(Usutu river), South Africa | --26.52 | 31.67 | ||||||||
| Cacipacore virus | 2011 | No | No | No | ||||||||||||
| Dengue virus | 1907 | Yes Lavinder and Francis, 1914 | 1914 | Savannah, Georgia | 32.02 | --81.12 | Yes Clarke et al., 1967 | 1967 | Southwest Taiwan | 23.06 | 120.59 | Yes Edington, 1927 | 1927 | Durban, KwaZulu-Natal Province, South Africa | --29.86 | 31.02 |
| Edge Hill virus | 1985 | No | No | No | ||||||||||||
| Gadgets Gully virus | 1991 | No | No | No | ||||||||||||
| Ilheus virus | 1947 | No | No | No | ||||||||||||
| Japanese encephalitis virus | 1933 | Yes* Perex-Pina and Merikangas, 1953 | 1953 | Waltham, Massachusetts | 42.38 | --71.24 | Yes Yen, 1941 | 1941 | Beijing | 40.01 | 116.41 | Yes Simon-Loriere et al., 2017 | 2017 | Cunene, Angola | --16.28 | 15.28 |
| Kokobera virus | 1964 | No | No | No | ||||||||||||
| Kyasanur forest disease virus | 1957 | No | Yes Wang et al., 2009 | 2009 | Hengduanshan Mountain, Yunnan | 27.50 | 99.00 | Yes Andayi et al., 2014 | 2014 | Djibouti, Republic of Djibouti | 11.57 | 43.15 | ||||
| Langat virus | 1956 | No | No | No | ||||||||||||
| Louping ill virus | 1934 | Yes Rivers and Schwentker, 1934 | 1934 | New York | 40.71 | --74.01 | No | No | ||||||||
| Murray Valley encephalitis virus | 1952 | No | No | No | ||||||||||||
| Ntaya virus | 1952 | No | No | Yes Smithburn, 1952 | 1952 | Bwamba county, Uganda | 0.75 | 30.02 | ||||||||
| Omsk hemorrhagic fever virus | 1948 | No | No | No | ||||||||||||
| Powassan virus | 1959 | Yes Goldfield et al., 1973 | 1973 | Middlesex County, New Jersey | 40.54 | --74.37 | No | No | ||||||||
| Rio Bravo virus | 1962 | Yes Suklin et al., 1962 | 1962 | Dallas city, Texas | 32.78 | --96.80 | No | No | ||||||||
| Saint Louis encephalitis virus | 1933 | Yes Webster and Fite, 2009 | 1933 | St. Louis City, Missouri | 38.63 | --90.20 | No | No | ||||||||
| Tembusu virus | 1975 | No | Yes Tang et al., 2013 | 2013 | Shandong | 36.40 | 118.77 | No | ||||||||
| Tick-borne encephalitis virus | 1938 | Yes* Cruse et al., 1979 | 1979 | Cleveland, Ohio | 41.51 | --81.69 | Yes Wang and Zhao, 1956 | 1956 | Bali village, Wuchang, Heilongjiang | 44.91 | 127.16 | No | ||||
| Uganda S virus | 1952 | No | No | Yes Dick and Haddow, 1952 | 1952 | Bwamba county, Uganda | 0.75 | 30.02 | ||||||||
| Usutu virus | 2009 | No | No | No | ||||||||||||
| Wesselsbron virus | 1957 | No | No | Yes Smithburn et al., 1957 | 1957 | Lake Simbu region, Maputaland, KwaZulu-Natal, South Africa | --27.36 | 32.32 | ||||||||
| West Nile virus | 1940 | Yes Nash et al., 2001 | 2001 | New York | 40.71 | --74.01 | Yes Li et al., 2013 | 2013 | Jiashi County, Xinjiang | 39.58 | 77.18 | Yes Smithburn et al., 1940 | 1940 | Omogo, West Nile district, Uganda | 0.42 | 33.21 |
| Yellow fever virus | 1901 | Yes Guiteras, 1904 | 1904 | Laredo, Texas | 27.51 | --99.51 | Yes* Chen and Lu, 2016 | 2016 | Beijing | 40.01 | 116.41 | Yes Stokes et al., 1928 | 1928 | Larteh, Ghana | 5.94 | --0.07 |
| Zika virus | 1952 | Yes* Foy et al., 2011 | 2011 | Northern Colorado | 39.55 | --105.78 | Yes* Sun et al., 2016 | 2016 | Gan County, Ganzhou city, Jiangxi | 25.86 | 115.02 | Yes Dick, 1952 | 1952 | Zika, Uganda | 0.12 | 32.53 |
| Hepacivirus C | 1989 | Yes Choo et al., 1989 | 1989 | Emeryville, California | 37.83 | --122.29 | Yes Xu et al., 1990a | 1990 | Qidong county, Jiangsu | 31.88 | 121.72 | Yes Kew et al., 1990 | 1990 | Johannesburg, South Africa | --26.20 | 27.90 |
| Pegivirus C | 1995 | Yes Simons et al., 1995 | 1995 | Chapel Hill, North Carolina; Rochester, Minnesota; Dallas, Texas | 35.91 | --79.06 | Yes Wang et al., 1996 | 1996 | Beijing | 40.01 | 116.41 | Yes Simons et al., 1995 | 1995 | Cairo, Egypt | 30.04 | 31.24 |
| Pegivirus H | 2015 | Yes Kapoor et al., 2015 | 2015 | New York city, New York | 40.71 | --74.01 | Yes Wang et al., 2018 | 2018 | Guangzhou, Guangdong | 23.13 | 113.26 | Yes Rodgers et al., 2019 | 2019 | Ebolowa, Cameroon | 2.92 | 11.15 |
| Pestivirus A | 1988 | Yes Yolken et al., 1989 | 1989 | Whiteriver, Arizona | 33.83 | --109.97 | No | Yes Giangaspero et al., 1988 | 1988 | Zambia | --13.13 | 27.85 | ||||
| Andes orthohantavirus | 1996 | No | No | No | ||||||||||||
| Bayou orthohantavirus | 1995 | Yes Morzunov et al., 1995 | 1995 | Louisiana | 30.98 | --91.96 | No | No | ||||||||
| Black creek canal orthohantavirus | 1995 | Yes Ravkov et al., 1995 | 1995 | Miami-Dade County, Florida | 25.76 | --80.34 | No | No | ||||||||
| Choclo orthohantavirus | 2000 | No | No | No | ||||||||||||
| Dobrava-Belgrade orthohantavirus | 1992 | No | No | No | ||||||||||||
| Hantaan orthohantavirus | 1978 | No | Yes Lee et al., 1980 | 1980 | Zhejiang | 29.14 | 119.79 | No | ||||||||
| Laguna Negra orthohantavirus | 1997 | No | No | No | ||||||||||||
| Puumala orthohantavirus | 1980 | No | No | No | ||||||||||||
| Sangassou orthohantavirus | 2010 | No | No | Yes Klempa et al., 2010 | 2010 | Sangassou village, Macenta district, Forest Guinea | 8.24 | --9.32 | ||||||||
| Seoul orthohantavirus | 1982 | Yes Forthal et al., 1987 | 1987 | Mississippi | 32.57 | --89.88 | Yes Song et al., 1982 | 1982 | Jiangsu | 33.14 | 119.79 | Yes Tomori et al., 1986 | 1986 | Jos, Nigeria | 9.90 | 8.86 |
| Sin Nombre orthohantavirus | 1993 | Yes Nichol et al., 1993 | 1993 | New Mexico | 34.52 | --105.87 | No | No | ||||||||
| Thailand orthohantavirus | 2006 | No | No | No | ||||||||||||
| Thottopalayam thottimvirus | 2007 | No | No | No | ||||||||||||
| Tula orthohantavirus | 1996 | No | No | No | ||||||||||||
| Orthohepevirus A | 1983 | Yes* De Cock et al., 1987 | 1987 | Los Angeles County, California | 34.05 | --118.24 | Yes Huang et al., 1989 | 1989 | Kashi county, Kashi city, Xinjiang | 39.46 | 75.99 | Yes Belabbes et al., 1985 | 1985 | Medea town, Algeria | 36.26 | 2.75 |
| Orthohepevirus C | 2018 | No | Yes Sridhar et al., 2018 | 2018 | Hong Kong | 22.40 | 114.11 | No | ||||||||
| Crimean-Congo haemorrhagic fever orthonairovirus | 1967 | No | Yes Yen et al., 1985 | 1985 | Bachu, southern Xinjiang | 39.79 | 78.55 | Yes Simpson et al., 1967 | 1967 | Kisangani, Tshopo province, Democratic Republic of the Congo | 0.53 | 25.19 | ||||
| Dugbe orthonairovirus | 1969 | No | No | Yes Causey et al., 1969 | 1969 | Ibadan, Nigeria | 7.35 | 3.88 | ||||||||
| Nairobi sheep disease orthonairovirus | 1969 | No | No | Yes Morrill et al., 1991 | 1991 | Mombasa; Malindi; and Kilifi, Coast Province, Kenya | --3.34 | 39.57 | ||||||||
| Thiafora orthonairovirus | 1989 | No | No | No | ||||||||||||
| Influenza A virus | 1933 | Yes Francis and Magill, 1935 | 1935 | Philadelphi, Pennsylvania | 39.95 | --75.17 | Yes Chang and Chiang, 1950 | 1950 | Beijing | 40.01 | 116.41 | Yes Isaacs and Andrews, 1951 | 1951 | Johannesburg, South Africa and Cape Town, South Africa | --26.20 | 27.90 |
| Influenza B virus | 1940 | Yes Francis, 1940 | 1940 | Irvington village, Greenburgh town, Westchester County, New York | 41.03 | --73.87 | Yes Wen and Chu, 1957 | 1957 | Beijing | 40.01 | 116.41 | Yes Montefiore et al., 1970 | 1970 | Arusha, Arusha Region, Tanzania | --3.37 | 36.69 |
| Influenza C virus | 1950 | Yes Francis et al., 1950 | 1950 | Ann Arbor city, Michigan | 42.28 | --83.74 | Yes Zhang, 1957 | 1957 | Beijing | 40.01 | 116.41 | Yes Joosting et al., 1968 | 1968 | Johannesburg, South Africa | --26.20 | 27.90 |
| Dhori thogotovirus | 1985 | No | No | No | ||||||||||||
| Thogoto thogotovirus | 1969 | No | No | Yes Causey et al., 1969 | 1969 | Ibadan, Nigeria | 7.35 | 3.88 | ||||||||
| Avian orthoavulavirus 1 | 1943 | Yes Burnet, 1943 | 1943 | Washington, D. C. | 38.91 | --77.04 | No | No | ||||||||
| Hendra henipavirus | 1995 | No | No | No | ||||||||||||
| Nipah henipavirus | 1999 | No | No | No | ||||||||||||
| Canine morbillivirus | 1955 | Yes Karzon, 1955 | 1955 | Buffalo, New York | 42.89 | --78.88 | No | No | ||||||||
| Measles morbillivirus | 1911 | Yes Goldberger and Anderson, 1911 | 1911 | Washington, D. C. | 38.91 | --77.04 | Yes Tang et al., 1958 | 1958 | Beijing | 40.01 | 116.41 | Yes Baylet et al., 1963 | 1963 | Dakar, Senegal | 14.72 | --17.47 |
| Human respirovirus 1 | 1958 | Yes Chanock et al., 1958 | 1958 | Washington, D. C. | 38.91 | --77.04 | Yes Chen et al., 1964 | 1964 | Zhejiang | 29.14 | 119.79 | Yes Taylor-Robinson and Tyrrell, 1963 | 1963 | Cape Town, Western Cape Province, South Africa | --33.90 | 18.57 |
| Human respirovirus 3 | 1958 | Yes Chanock et al., 1958 | 1958 | Washington, D. C. | 38.91 | --77.04 | Yes Yu et al., 1987 | 1987 | Guangzhou, Guangdong | 23.13 | 113.26 | Yes Taylor-Robinson and Tyrrell, 1963 | 1963 | Cape Town, Western Cape Province, South Africa | --33.90 | 18.57 |
| Achimota pararubulavirus 2 | 2013 | No | No | Yes Baker et al., 2013 | 2013 | Volta, Ghana | 6.05 | 0.37 | ||||||||
| Human orthorubulavirus 2 | 1956 | Yes Chanock, 1956 | 1956 | Cincinnati, Ohio | 39.10 | --84.51 | Yes Pathogen biology research group, Jiangsu new medical college, 1975 | 1975 | Nanjing, Jiangsu | 31.95 | 118.78 | Yes Balestrieri et al., 1967 | 1967 | Accra, Ghana | 5.60 | --0.19 |
| Human orthorubulavirus 4 | 1960 | Yes Johnson et al., 1960 | 1960 | Bethesda, Maryland | 38.98 | --77.09 | Yes Lau et al., 2005 | 2005 | Hong Kong | 22.40 | 114.11 | Yes Niang et al., 2010 | 2010 | Ndiop village, Sine Saloum region, Senegal | 15.18 | --16.74 |
| Mammalian orthorubulavirus 5 | 1959 | Yes Schultz and Habel, 1959 | 1959 | Stanford, California | 37.42 | --122.17 | No | No | ||||||||
| Menangle pararubulavirus | 1998 | No | No | No | ||||||||||||
| Mumps orthorubulavirus | 1934 | Yes Johnson and Goodpasture, 1934 | 1934 | Nashville, Tennessee | 36.16 | --86.78 | Yes Wang et al., 1958 | 1958 | Beijing | 40.01 | 116.41 | Yes Bayer and Gear, 1955 | 1955 | Johannesburg, South Africa | --26.20 | 27.90 |
| Simian orthorubulavirus | 1968 | No | No | No | ||||||||||||
| Sosuga pararubulavirus | 2014 | No | No | Yes Albariño et al., 2014 | 2014 | ˉ | 3.76 | 32.82 | ||||||||
| Tioman pararubulavirus | 2007 | No | No | No | ||||||||||||
| Bunyamwera orthobunyavirus | 1946 | Yes Work, 1964 | 1964 | Southern Florida | 26.92 | --81.21 | No | Yes Smithburn et al., 1946 | 1946 | Bwamba County, Uganda | 0.75 | 30.02 | ||||
| Bwamba orthobunyavirus | 1941 | No | No | Yes Smithburn et al., 1941 | 1941 | Bwamba county, Western Province of Uganda | 0.75 | 30.02 | ||||||||
| California encephalitis orthobunyavirus | 1952 | Yes Hammon and Reeves, 1952 | 1952 | Kern county, California | 35.49 | --118.86 | Yes Gu et al., 1984 | 1984 | Longhua, Shanghai | 31.22 | 121.43 | Yes Bardos and Sefcovicova, 1961 | 1961 | Uganda | 1.37 | 32.29 |
| Caraparu orthobunyavirus | 1961 | No | No | No | ||||||||||||
| Catu orthobunyavirus | 1961 | No | No | No | ||||||||||||
| Guama orthobunyavirus | 1961 | No | No | No | ||||||||||||
| Guaroa orthobunyavirus | 1959 | No | No | No | ||||||||||||
| Kairi orthobunyavirus | 1967 | No | No | No | ||||||||||||
| Madrid orthobunyavirus | 1964 | No | No | No | ||||||||||||
| Marituba orthobunyavirus | 1961 | No | No | No | ||||||||||||
| Nyando orthobunyavirus | 1965 | No | No | Yes Williams et al., 1965 | 1965 | Kisumu, Kenya | --0.09 | 34.77 | ||||||||
| Oriboca orthobunyavirus | 1961 | No | No | No | ||||||||||||
| Oropouche orthobunyavirus | 1961 | No | No | No | ||||||||||||
| Patois orthobunyavirus | 1972 | No | No | No | ||||||||||||
| Shuni orthobunyavirus | 1975 | No | No | Yes Moore et al., 1975 | 1975 | Ibadan, Nigeria | 7.38 | 3.95 | ||||||||
| Tacaiuma orthobunyavirus | 1967 | No | No | No | ||||||||||||
| Wyeomyia orthobunyavirus | 1965 | No | No | No | ||||||||||||
| Candiru phlebovirus | 1983 | No | No | No | ||||||||||||
| Punta Toro phlebovirus | 1970 | No | No | No | ||||||||||||
| Rift Valley fever phlebovirus | 1931 | No | Yes* Liu et al., 2016 | 2016 | Beijing | 40.01 | 116.41 | Yes Daubney et al., 1931 | 1931 | Rift Valley of Kenya Colony | --0.28 | 36.07 | ||||
| Sandfly fever Naples phlebovirus | 1944 | No | No | Yes Sabin, 1951 | 1951 | Cairo, Egypt | 30.04 | 31.24 | ||||||||
| Heartland banyangvirus | 2012 | Yes McMullan et al., 2012 | 2012 | Andrew and Nodaway Counties, Missouri | 39.82 | --94.59 | No | No | ||||||||
| Huaiyangshan banyangvirus | 2011 | No | Yes Zhang et al., 2011 | 2011 | Huaiyangshan | 31.37 | 115.39 | No | ||||||||
| Uukuniemi phlebovirus | 1970 | No | No | No | ||||||||||||
| Human picobirnavirus | 1988 | Yes Grohmann et al., 1993 | 1993 | Atlanta, Georgia | 33.75 | --84.39 | Yes Rosen et al., 2000 | 2000 | Lulong County, Hebei | 39.94 | 116.94 | No | ||||
| Equine rhinitis A virus | 1962 | No | No | No | ||||||||||||
| Foot-and-mouth disease virus | 1965 | No | Yes Luo et al., 1999 | 1999 | Guangzhou | 23.13 | 113.26 | Yes Donia and Youssef, 2002 | 2002 | Alexandria Governorate, Egypt | 30.74 | 29.74 | ||||
| Cardiovirus A | 1947 | Yes Jonkers, 1961 | 1961 | New Orleans, Louisiana | 29.95 | --90.07 | Yes Feng et al., 2015 | 2015 | Changchun, Jilin | 43.87 | 125.34 | Yes Dick and Best, 1948 | 1948 | Entebbe, Uganda | 0.05 | 32.46 |
| Cardiovirus B | 1963 | Yes Jones et al., 2007 | 2007 | San Diego, California | 32.72 | --117.16 | Yes Cheng et al., 2009a | 2009 | Lanzhou, Gansu | 36.06 | 103.79 | Yes Zoll et al., 2009 | 2009 | Cameroon | 5.03 | 12.40 |
| Cosavirus A | 2008 | No | Yes Dai et al., 2010 | 2010 | Shanghai | 31.23 | 121.47 | Yes Kapusinszky et al., 2012 | 2012 | Maiduguri, Borno State, Nigeria | 11.83 | 13.15 | ||||
| Cosavirus B | 2008 | No | Yes Yang et al., 2016 | 2016 | Zhenjiang, Jiangsu | 32.19 | 119.43 | No | ||||||||
| Cosavirus D | 2008 | No | No | Yes Kapusinszky et al., 2012 | 2012 | Maiduguri, Borno State, Nigeria | 11.83 | 13.15 | ||||||||
| Cosavirus E | 2008 | No | No | Yes Kapusinszky et al., 2012 | 2012 | Maiduguri, Borno State, Nigeria | 11.83 | 13.15 | ||||||||
| Cosavirus F | 2012 | No | No | No | ||||||||||||
| Enterovirus A | 1949 | Yes Sickles and Dalldorf, 1949 | 1949 | New York | 43.30 | --74.22 | Yes Xiao et al., 1985 | 1985 | Tianjin | 39.34 | 117.36 | Yes Bayer and Gear, 1955 | 1955 | Johannesburg, South Africa | --26.20 | 27.90 |
| Enterovirus B | 1949 | Yes Sickles and Dalldorf, 1949 | 1949 | Wilmington | 39.74 | --75.54 | Yes Wu et al., 1960 | 1960 | Fuzhou, Fujian | 26.07 | 119.30 | Yes Patz et al., 1953 | 1953 | Middelburg, Transvaal, South Africa | --25.77 | 29.46 |
| Enterovirus C | 1909 | Yes Flexner and Lewis, 1909 | 1909 | New York city, New York | 40.71 | --74.01 | Yes Yen and Hsü, 1941 | 1941 | Bejing | 39.90 | 116.41 | Yes Hudson and Lennette, 1933 | 1933 | Monrovia, Liberia | 6.29 | --10.76 |
| Enterovirus D | 1967 | Yes Schieble et al., 1967 | 1967 | Berkeley, California | 37.87 | --122.27 | Yes Shanghai Eye and Skin Disease Prevention and Treatment Institute, 1979 | 1979 | Shanghai | 31.23 | 121.47 | Yes Mirkovic et al., 1973 | 1973 | Morocco | 31.79 | --7.09 |
| Enterovirus E | 1961 | Yes Moscovivci et al., 1961 | 1961 | Denver, Colorado | 39.74 | --104.99 | No | No | ||||||||
| Enterovirus H | 1965 | No | No | No | ||||||||||||
| Rhinovirus A | 1953 | Yes Price, 1956 | 1956 | Baltimore, Maryland | 39.29 | --76.61 | Yes Guangzhou Institute of Medicine and Health, 1975 | 1975 | Guangzhou, Guangdong | 23.13 | 113.26 | Yes Taylor-Robinson, 1963 | 1963 | Cape Town, Western Cape Province, South Africa | --33.90 | 18.57 |
| Rhinovirus B | 1960 | Yes Hamre and Procknow, 1961 | 1961 | Chicago, Illinois | 41.88 | --87.63 | Yes Xiang et al., 2008 | 2008 | Beijing | 40.01 | 116.41 | Yes Briese et al., 2008 | 2008 | Pretoria, Gauteng province, South Africa | --25.75 | 28.23 |
| Rhinovirus C | 2006 | Yes Lamson et al., 2006 | 2006 | New York city, New York | 40.71 | --74.01 | Yes Lau et al., 2007 | 2007 | Hong Kong | 22.40 | 114.11 | Yes Briese et al., 2008 | 2008 | Pretoria, Gauteng province, South Africa | --25.75 | 28.23 |
| Erbovirus A | 2005 | No | No | No | ||||||||||||
| Hepatovirus A | 1973 | Yes Feinstone et al., 1973 | 1973 | Bethesda, Maryland | 38.98 | --77.09 | Yes Microbiology Research Group of Shanghai First Medical College and Laboratory of Shanghai Sixth People’s Hospital, 1978 | 1978 | Shanghai | 31.23 | 121.47 | Yes Szmuness et al., 1977 | 1977 | Dakar, Senegal | 14.72 | --17.47 |
| Aichivirus A | 1991 | Yes Chhabra et al., 2013 | 2013 | Cincinnati, Ohio | 39.10 | --84.51 | Yes Yang et al., 2009 | 2009 | Shanghai | 31.23 | 121.47 | Yes Sdiri-Loulizi et al., 2008 | 2008 | Monastir, Tunisia | 35.77 | 10.82 |
| Parechovirus A | 1958 | Yes Ramoz-alverz and Sabin, 1958 | 1958 | Cincinnati, Ohio | 39.10 | --84.51 | Yes Shan et al., 2009 | 2009 | Shanghai | 31.23 | 121.47 | Yes Kapusinszky et al., 2012 | 2012 | Ouagadougou, Burkina Faso | 12.24 | --1.56 |
| Parechovirus B | 2003 | No | No | No | ||||||||||||
| Salivirus A | 2009 | Yes Greninger et al., 2009 | 2009 | Northern California | 38.84 | --120.90 | Yes Shan et al., 2010 | 2010 | Shanghai | 31.23 | 121.47 | Yes Li et al., 2009 | 2009 | Maiduguri, Borno State, Nigeria | 11.83 | 13.15 |
| Avian metapneumovirus | 2011 | Yes Kayali et al., 2011 | 2011 | Memphis, Tennessee | 35.15 | --90.05 | No | No | ||||||||
| Human metapneumovirus | 2001 | Yes Falsey et al., 2003 | 2003 | Rochester, New York | 43.16 | --77.61 | Yes Peiris et al., 2003b | 2003 | Hong Kong | 22.40 | 114.11 | Yes Madhi et al., 2003 | 2003 | Johannesburg, South Africa | --26.20 | 27.90 |
| Human orthopneumovirus | 1957 | Yes Chanock et al., 1957 | 1957 | Baltimore, Maryland | 39.29 | --76.61 | Yes Kun Number 323 Unit, the Chinese People’s Liberation Army, 1975 | 1975 | Kunming, Yunnan | 25.07 | 102.68 | Yes Doggett, 1965 | 1965 | Cape Town, Western Cape Province, South Africa | --33.90 | 18.57 |
| Colorado tick fever virus | 1946 | Yes Florio et al., 1946 | 1946 | Denver, Colorado | 39.74 | --104.99 | Yes Yang et al., 1996 | 1996 | Nanjing, Jiangsu | 31.95 | 118.78 | No | ||||
| Eyach virus | 1980 | No | No | No | ||||||||||||
| Corriparta virus | 1967 | No | No | No | ||||||||||||
| Great Island virus | 1963 | No | No | No | ||||||||||||
| Lebombo virus | 1975 | No | No | Yes Moore et al., 1975 | 1975 | lbadan, Nigeria | 7.38 | 3.95 | ||||||||
| Orungo virus | 1976 | No | No | Yes Tomori et al., 1976 | 1976 | Ibadan, Nigeria | 7.38 | 3.95 | ||||||||
| Mammalian orthoreovirus | 1954 | Yes Ramos-Alvarez and Sabin, 1954 | 1954 | Cincinnati, Ohio | 39.10 | --84.51 | Yes Zhao et al., 1995 | 1995 | Xuzhou, Jiangsu | 34.26 | 117.19 | Yes Malherbe et al., 1963 | 1963 | Johannesburg, South Africa | --26.20 | 27.90 |
| Nelson Bay orthoreovirus | 2007 | No | Yes* Cheng et al., 2009b | 2009 | Hong Kong | 22.40 | 114.11 | No | ||||||||
| Rotavirus A | 1973 | Yes Kapikian et al., 1976 | 1976 | Washington, D. C. | 38.90 | --77.04 | Yes PaPa et al., 1979 | 1979 | Beijing | 40.01 | 116.41 | Yes Tomori et al., 1976 | 1976 | Johannesburg, South Africa | --26.20 | 27.90 |
| Rotavirus B | 1984 | Yes Eiden et al., 1985 | 1985 | Baltimore, Maryland | 39.29 | --76.61 | Yes Hung et al., 1984 | 1984 | Jinzhou, Liaoning | 41.10 | 121.13 | Yes Nakata et al., 1987 | 1987 | Kenya | --0.02 | 37.91 |
| Rotavirus C | 1986 | Yes Jiang et al., 1995 | 1995 | Providence, Rhode Island | 41.82 | --71.41 | Yes Qiao et al., 1999 | 1999 | Beijing | 40.01 | 116.41 | Yes Sebata and Steele, 1999 | 1999 | Pretoria, Gauteng province, South Africa | --25.75 | 28.23 |
| Rotavirus H | 1987 | No | Yes Wang et al., 1987 | 1987 | Huaihua, Hunan Province | 27.55 | 109.96 | No | ||||||||
| Banna virus | 1990 | No | Yes Xu et al., 1990b | 1990 | Xishuangbanna, Yunnan Province | 21.90 | 100.80 | No | ||||||||
| Primate T-lymphotropic virus 1 | 1980 | Yes Poiesz et al., 1980 | 1980 | Bethesda, Maryland | 38.98 | --77.09 | Yes Hung et al., 1984 | 1984 | Shenyang, Liaoing | 41.80 | 123.38 | Yes Williams et al., 1984 | 1984 | Ibadan, Nigeria | 7.38 | 3.95 |
| Primate T-lymphotropic virus 2 | 1982 | Yes Kalyanaraman et al., 1982 | 1982 | Seattle, Washington | 47.61 | --122.33 | Yes Ma et al., 2013 | 2013 | Henan and Hubei | 32.21 | 112.96 | Yes Delaporte et al., 1991 | 1991 | Franceville, Gabon | --1.63 | 13.60 |
| Primate T-lymphotropic virus 3 | 2005 | No | No | Yes Calattini et al., 2005 | 2005 | Océan department, South Province, Cameroon | 2.50 | 10.50 | ||||||||
| Human immunodeficiency virus 1 | 1983 | Yes Safai et al., 1984 | 1984 | Washington, D. C. | 38.90 | --77.04 | Yes Chang et al., 1986 | 1986 | Hong Kong | 22.40 | 114.11 | Yes Brun-Vézinet et al., 1984 | 1984 | Kisangani, Tshopo province, Democratic Republic of the Congo | 0.53 | 25.19 |
| Human immunodeficiency virus 2 | 1986 | Yes* Centers for Disease Control, 1988 | 1988 | New Jersey | 40.06 | --74.41 | Yes* Yan et al., 2000 | 2000 | Fuzhou, Fujian | 26.07 | 119.30 | Yes Kanki et al., 1986 | 1986 | Dakar, Senegal | 14.72 | --17.47 |
| Simian immunodeficiency virus | 1992 | Yes Khabbaz et al., 1992 | 1992 | Atlanta, Georgia | 33.75 | --84.39 | No | Yes Calattini et al., 2005 | 2005 | Cameroon | 7.37 | 12.35 | ||||
| Central chimpanzee simian foamy virus | 2012 | No | No | Yes Rua et al., 2012 | 2012 | Near Dja Nature Reserves, Southern Cameroon | 4.50 | 13.50 | ||||||||
| Eastern chimpanzee simian foamy virus | 1971 | No | No | Yes Achong et al., 1971 | 1971 | Kenya | --0.02 | 37.91 | ||||||||
| Grivet simian foamy virus | 1997 | No | No | No | ||||||||||||
| Guenon simian foamy virus | 2012 | No | No | Yes Rua et al., 2012 | 2012 | Near lolodrof, Southern Cameroon | 3.23 | 10.73 | ||||||||
| Taiwanese macaque simian foamy virus | 2002 | No | Yes Huang et al., 2012 | 2012 | Yunnan | 25.18 | 101.86 | No | ||||||||
| Australian bat lyssavirus | 1998 | No | No | No | ||||||||||||
| Duvenhage lyssavirus | 1971 | No | No | Yes Meredith et al., 1971 | 1971 | Pretoria, Gauteng province, South Africa | --25.75 | 28.23 | ||||||||
| European bat Yeslyssavirus | 1989 | No | No | No | ||||||||||||
| European bat 2 lyssavirus | 1986 | No | No | No | ||||||||||||
| Irkut lyssavirus | 2013 | No | Yes Liu et al., 2013 | 2013 | Tonghua county, Jilin | 41.68 | 125.76 | No | ||||||||
| Mokola lyssavirus | 1972 | No | No | Yes Familusi et al., 1972 | 1972 | Ibadan, Nigeria | 7.38 | 3.95 | ||||||||
| Rabies lyssavirus | 1903 | Yes Black and Powers, 1910 | 1910 | Southern California | 34.57 | --116.76 | Yes Wu, 1981 | 1981 | Beijing | 40.01 | 116.41 | Yes Wilhelm and Alexis, 1933 | 1933 | Carolina, Mpumalanga, South Africa | --26.07 | 30.12 |
| Bas-Congo tibrovirus | 2012 | No | No | Yes Grard et al., 2012 | 2012 | Mangala village, Boma Bungu Health Zone, Democratic Republic of Congo (DRC) | --4.04 | 21.76 | ||||||||
| Ekpoma Yestibrovirus | 2015 | No | No | Yes Stremlau et al., 2015 | 2015 | Irrua, Edo State, Nigeria | 6.74 | 6.22 | ||||||||
| Ekpoma 2 tibrovirus | 2015 | No | No | Yes Stremlau et al., 2015 | 2015 | Irrua, Edo State, Nigeria | 6.74 | 6.22 | ||||||||
| Alagoas vesiculovirus | 1967 | No | No | No | ||||||||||||
| Chandipura vesiculovirus | 1967 | No | No | No | ||||||||||||
| Cocal vesiculovirus | 1964 | No | No | No | ||||||||||||
| Indiana vesiculovirus | 1958 | Yes Patterson et al., 1958 | 1958 | Beltsville, Prince George's County, Maryland | 39.05 | --76.90 | No | No | ||||||||
| Isfahan vesiculovirus | 1977 | No | No | No | ||||||||||||
| Maraba vesiculovirus | 1984 | No | No | No | ||||||||||||
| New Jersey vesiculovirus | 1950 | Yes Hanson et al., 1950 | 1950 | Madison, Wisconsin | 43.07 | --89.40 | No | No | ||||||||
| Piry vesiculovirus | 1974 | No | No | No | ||||||||||||
| Barmah Forest virus | 1986 | No | No | No | ||||||||||||
| Chikungunya virus | 1956 | Yes* Centers for Disease Control and Prevention, 2006 | 2006 | Minnesota | 46.44 | --93.36 | Yes Clarke et al., 1967 | 1967 | Southwest Taiwan | 23.06 | 120.59 | Yes Ross, 1956 | 1956 | Newala district, Tanzania | --10.64 | 39.24 |
| Eastern equine encephalitis virus | 1938 | Yes Howitt, 1938 | 1938 | Southwestern Massachusetts | 42.19 | --73.09 | No | No | ||||||||
| Everglades virus | 1970 | Yes Ehrenkranz et al., 1970 | 1970 | Homestead, Florida | 25.47 | --80.48 | No | No | ||||||||
| Getah virus | 1966 | No | Yes Li et al., 1992 | 1992 | Baoting County, Hainan | 18.98 | 109.83 | No | ||||||||
| Highlands J virus | 2000 | Yes Meehan et al., 2000 | 2000 | Florida | 27.66 | --81.52 | No | No | ||||||||
| Madariaga virus | 1972 | No | No | No | ||||||||||||
| Mayaro virus | 1957 | Yes* Tesh et al., 1999 | 1999 | Ohio | 40.42 | --82.91 | No | No | ||||||||
| Mosso das Pedras virus | 2013 | No | No | No | ||||||||||||
| Mucambo virus | 1965 | No | No | No | ||||||||||||
| Ndumu virus | 1961 | No | No | Yes Kokernot et al., 1961 | 1961 | Ndumu, Maputaland, KwaZulu-Natal, South Africa | --26.93 | 32.26 | ||||||||
| Onyong-nyong virus | 1961 | No | No | Yes Williams and Woodall, 1961 | 1961 | Entebbe, Uganda | 0.05 | 32.46 | ||||||||
| Pixuna virus | 1991 | No | No | No | ||||||||||||
| Rio Negro virus | 1993 | No | No | No | ||||||||||||
| Ross River virus | 1972 | No | Yes Xu et al., 1999 | 1999 | Hainan | 19.16 | 109.94 | No | ||||||||
| Semliki Forest virus | 1979 | No | No | Yes Mathiot et al., 1990 | 1990 | Bangui, Central Africa | 4.36 | 18.58 | ||||||||
| Sindbis virus | 1955 | No | No | Yes Taylor et al., 1955 | 1955 | Cairo, Egypt | 30.04 | 31.24 | ||||||||
| Tonate virus | 1976 | No | No | No | ||||||||||||
| Una virus | 1963 | No | No | No | ||||||||||||
| Venezuelan equine encephalitis virus | 1943 | Yes Casals et al., 1943 | 1943 | New York | 40.71 | --74.01 | No | No | ||||||||
| Western equine encephalitis virus | 1938 | Yes Howitt, 1938 | 1938 | Fresno, California | 36.75 | --119.77 | No | No | ||||||||
| Whataroa virus | 1964 | No | No | No | ||||||||||||
| Rubella virus | 1942 | Yes Habel, 1942 | 1942 | Washington, D. C. | 38.91 | --77.04 | Yes He et al., 1979 | 1979 | Hangzhou, Zhejiang | 29.87 | 119.33 | Yes Selzer, 1963 | 1963 | Cape Town, Western Cape Province, South Africa | --33.90 | 18.57 |
| Hepatitis delta virus | 1977 | Yes Rizzetto et al., 1979 | 1979 | New Jersey | 40.06 | --74.41 | Yes Rizzetto et al., 1980 | 1980 | Taipei, Taiwan | 24.96 | 121.51 | Yes Crocchiolo et al., 1984 | 1984 | Harare, Zimbabwe | --17.83 | 31.03 |
-
Notes: Yes denotes the virus was ever discovered from the region; * denotes the virus was ever discovered from the region, but imported from other regions; No denotes the virus species has never been discovered from the region; The lat and long denote the coordidate of discovery points or centroids of polygons
Appendix 1—table 2
Resolution and covered grid cells for virus discovery data.
| Polygon data | Point data | Total | ||||
|---|---|---|---|---|---|---|
| Country level | State/Province level | City/County level | ||||
| United States | Virus counts | NA | 14 (14.7%) | 11 (11.6%) | 70 (73.7%) | 95 |
| Gridded cell counts | NA | 189 | 12 | 72* | 273 | |
| China | Virus counts | NA | 22 (27.5%) | 47 (58.7%) | 11 (13.8%) | 80 |
| Gridded cell counts | NA | 161 | 70 | 12* | 243 | |
| Virus counts | 7 (6.5%) | 5 (4.7%) | 15 (14.0%) | 80 (74.8%) | 107 | |
| Africa | Gridded cell counts | 307 | 22 | 17 | 80 | 426 |
-
*
Grid cell counts here include viruses first detected in multiple points from the literature, NA, not applicable
Appendix 1—table 3
Model parameters.
| Model | Tree complexity | Learning rate | Bag fraction | No. of trees |
|---|---|---|---|---|
| United States | 2 | 0.0020 | 0.5 | 1430 |
| China | 2 | 0.0035 | 0.5 | 1473 |
| Africa | 2 | 0.0030 | 0.5 | 1446 |
Appendix 1—table 4
Model validation statistics for analyses in three regions.
| Model | % of deviance explained (95% quantiles) | ICC (95% quantiles) |
|---|---|---|
| United States | 50.5% (44.3%–56.8%) | 0.66 (0.60–0.70) |
| China | 42.0% (32.4%–50.8%) | 0.52 (0.41–0.60) |
| Africa | 42.4% (34.2%–50.0%) | 0.51 (0.44–0.62) |
-
ICC, intraclass correlation coefficient
Appendix 2
We considered using bibliographic data to adjust for discovery effort, but rejected this strategy after some exploratory tests. Jones et al., 2008 estimated the discovery effort for emerging infectious diseases (EID) by calculating the number of papers published by each country (denoted by the address for every author) in the Journal of Infectious Diseases (JID) since 1973. The hypothesis is that countries publishing more papers in JID are likely to discover more EID events. We tested whether this method worked for our analysis by plotting the relationship between published human-infective RNA virus count and total number of papers from all journals which published on human-infective RNA viruses in Web of Science (as of 21 Feb 2018). Both the total number of papers (Appendix 3—figure 1A) and total number of papers on viruses (Appendix 3—figure 1B) were weakly linked to the published human virus count in our database, though the number of papers did have a positive relationship with the number of papers on viruses (Appendix 3—figure 1C). We also noted that papers in JID (highlighted in blue in Appendix 3—figure 1) may not be able to fully explain the discovery efforts for newly discovered viruses. Olival et al., 2017 adjust for the discovery effort by searching the number of publications for each of 586 virus species they have studied using a keyword search by virus name in PubMed and Web of Science. We found the results using this method were similar to that of Jones et al., 2008. Allen et al., 2017 derived a different index for discovery bias, based on the spatial distribution of place names in peer-reviewed biomedical literature. The disadvantage of this method is that it may not represent the discovery effort, as many place names are not related to zoonotic viruses.
Appendix 3
Appendix 3—figure 1

Relationship between published human-infective RNA virus count and total number of papers from the journals which published all human-infective RNA viruses in Web of Science.
(A) Total number of papers vs. published human virus count; (B) Total number of papers on viruses vs. published human virus count; (C) Total number of papers vs. total number of papers on viruses; (D) Percent of papers on viruses in each journal. Journal of Infectious Diseases (JID) is highlighted in blue.
Appendix 3—figure 2
Time lag of human-infective RNA virus discovery between the three regions and the world.
(A) United States. (B) China. (C) Africa. The blue dots represent the original discovery year of each virus in the world; the red dots represent the discovery year of each virus in three regions; and the segments between them represent the time lag.
Appendix 3—figure 3
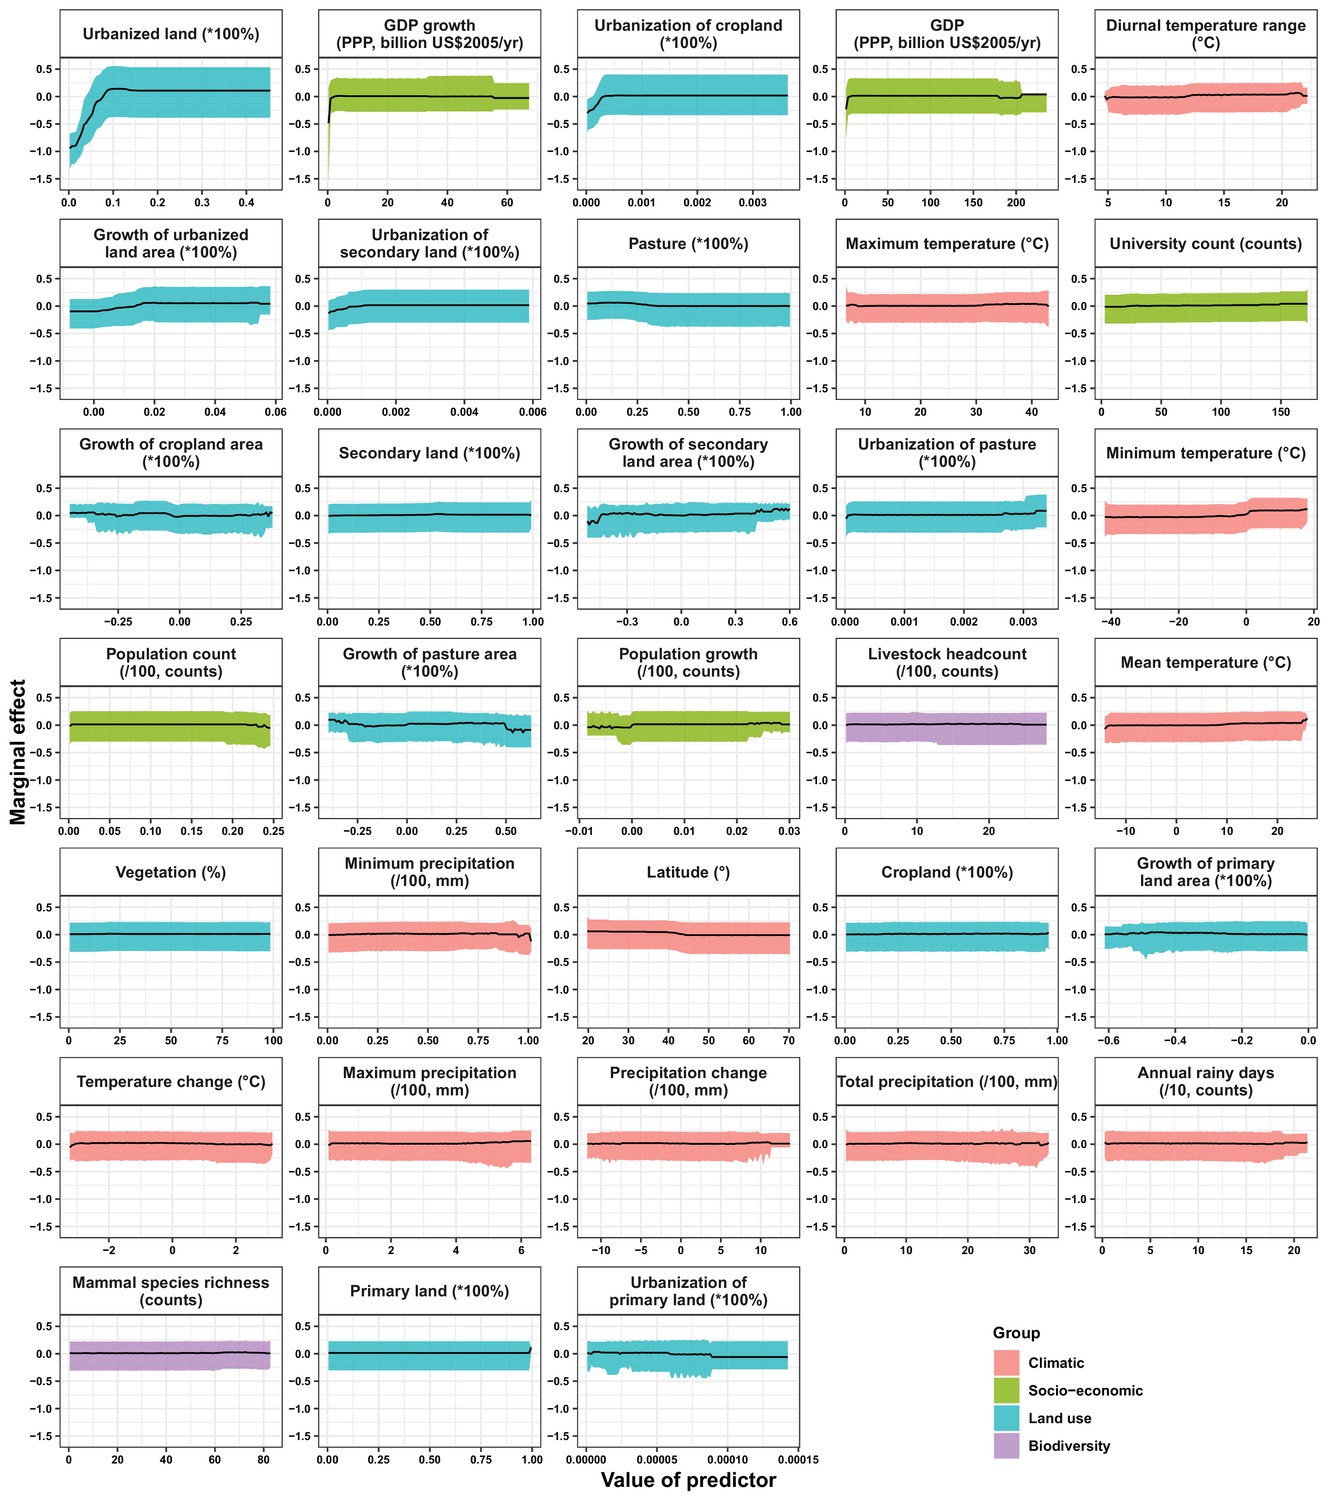
Partial dependence plots showing the influence on human-infective RNA virus discovery for all predictors in the Unites States.
Partial dependence plots show the effect of an individual predictor over its range on the response after factoring out other predictors. Fitted lines represent the median (black) and 95% quantiles (coloured) based on 1000 replicated boosted regression tree models. Y axes are centred around the mean without scaling. X axes show the range of sampled values of predictors.
Appendix 3—figure 4
Partial dependence plots showing the influence on human-infective RNA virus discovery for predictors in China.
Partial dependence plots show the effect of an individual predictor over its range on the response after factoring out other predictors. Fitted lines represent the median (black) and 95% quantiles (coloured) based on 1000 replicated boosted regression tree models. Y axes are centred around the mean without scaling. X axes show the range of sampled values of predictors.
Appendix 3—figure 5
Partial dependence plots showing the influence on human-infective RNA virus discovery for all predictors in Africa.
Partial dependence plots show the effect of an individual predictor over its range on the response after factoring out other predictors. Fitted lines represent the median (black) and 95% quantiles (coloured) based on 1000 replicated boosted regression tree models. Y axes are centred around the mean without scaling. X axes show the range of sampled values of predictors.
Appendix 3—figure 6

Moran’s I across different spherical distances.
(A) United States; (B) China; (C) Africa. The solid line and dots represented the median Moran’s I value, and the grey area represented its 95% quantiles generated from 1000 samples (Blue: Raw virus data) or replicate boosted regression tree (BRT) models (Red: Model residuals). We used the fixed spherical distance as the neighbourhood weights—as there is no general consensus for selecting cut-off values, we chose spherical distances ranging from one time to fifteen times of distance of 1° grid cell at the equator, i.e. 110km to 1650km, considering the area of three regions. Our BRT models reduced Moran’s I value from a range of 0.19–0.50 for the raw virus data to 0.009–0.04 for the model residuals in the United States (A), 0.11–0.45 to –0.01–0.09 in China (B), 0.05–0.31 to –0.004–0.15 in Africa (C), suggesting that BRT models with 33 predictors have adequately accounted for spatial autocorrelations in the raw virus data in all three regions.
Appendix 3—figure 7
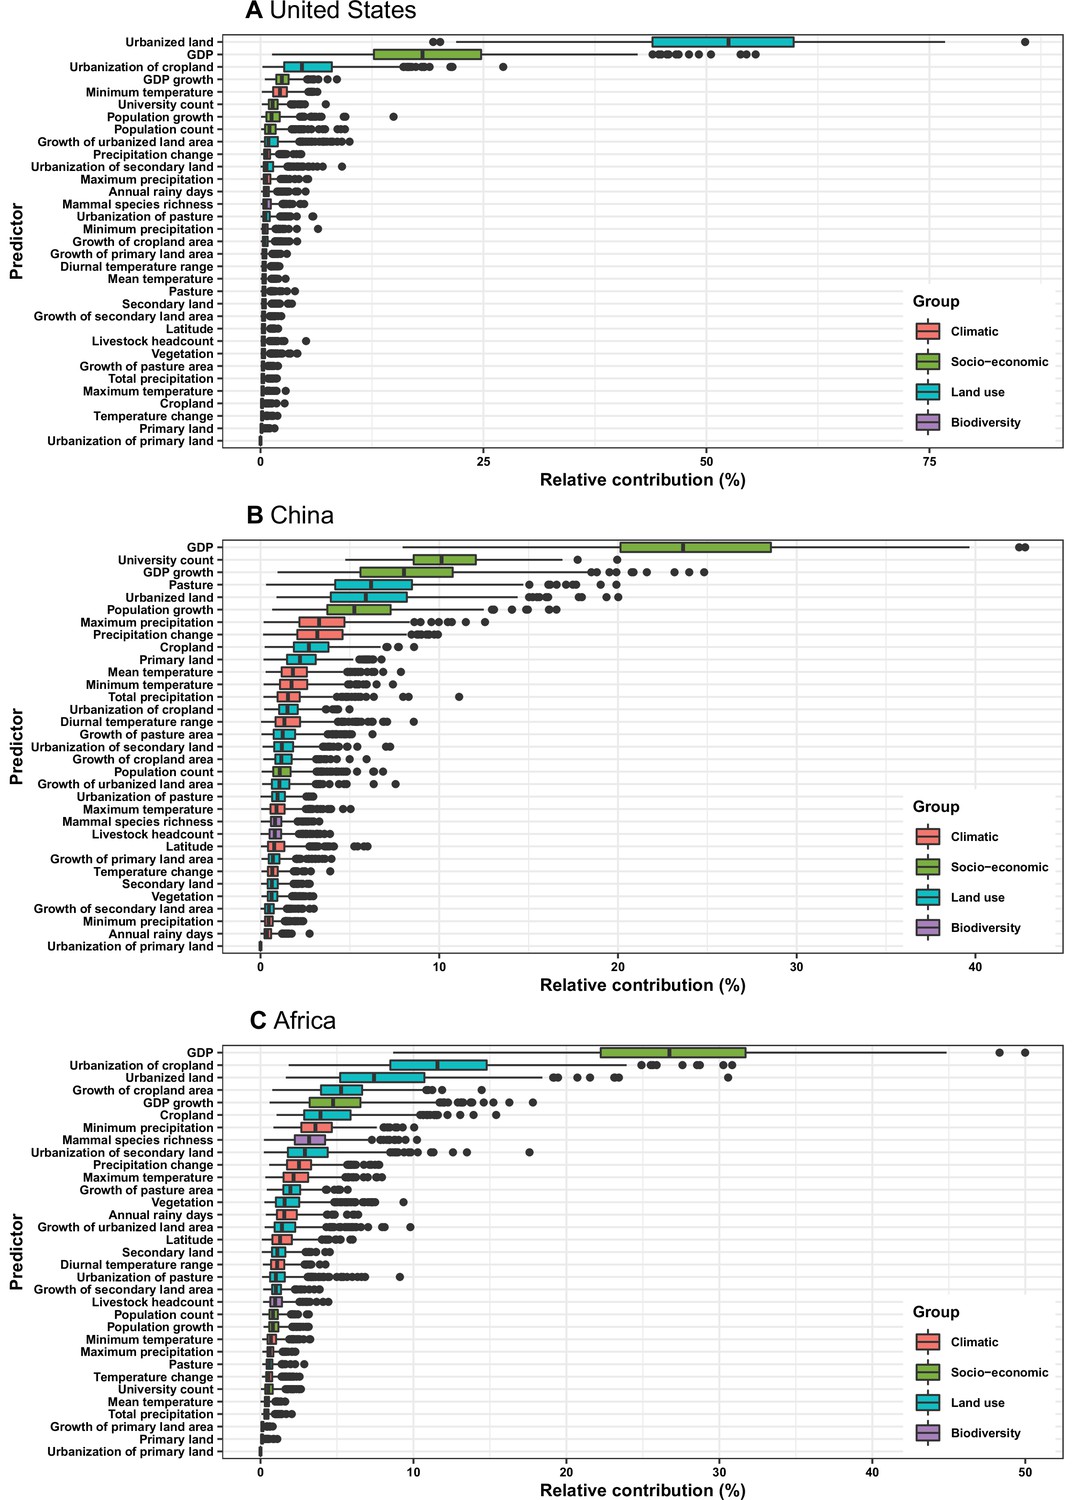
Relative contribution of predictors to human-infective RNA virus discovery in three regions.
Virus discovery data were matched to time-varying covariate data by year. (A) United States. (B) China. (C) Africa. The boxplots show the median (black bar) and interquartile range (box) of the relative contribution across 1000 replicate boosted regression tree models, with whiskers indicating minimum and maximum and black dots indicating outliers.
Appendix 3—figure 8

Relative contribution of predictors to human-infective RNA virus discovery in three regions.
Virus discovery data at year t were matched to time-varying covariate data at year t-1. (A) United States. (B) China. (C) Africa. The boxplots show the median (black bar) and interquartile range (box) of the relative contribution across 1000 replicate boosted regression tree models, with whiskers indicating minimum and maximum and black dots indicating outliers.
Appendix 3—figure 9
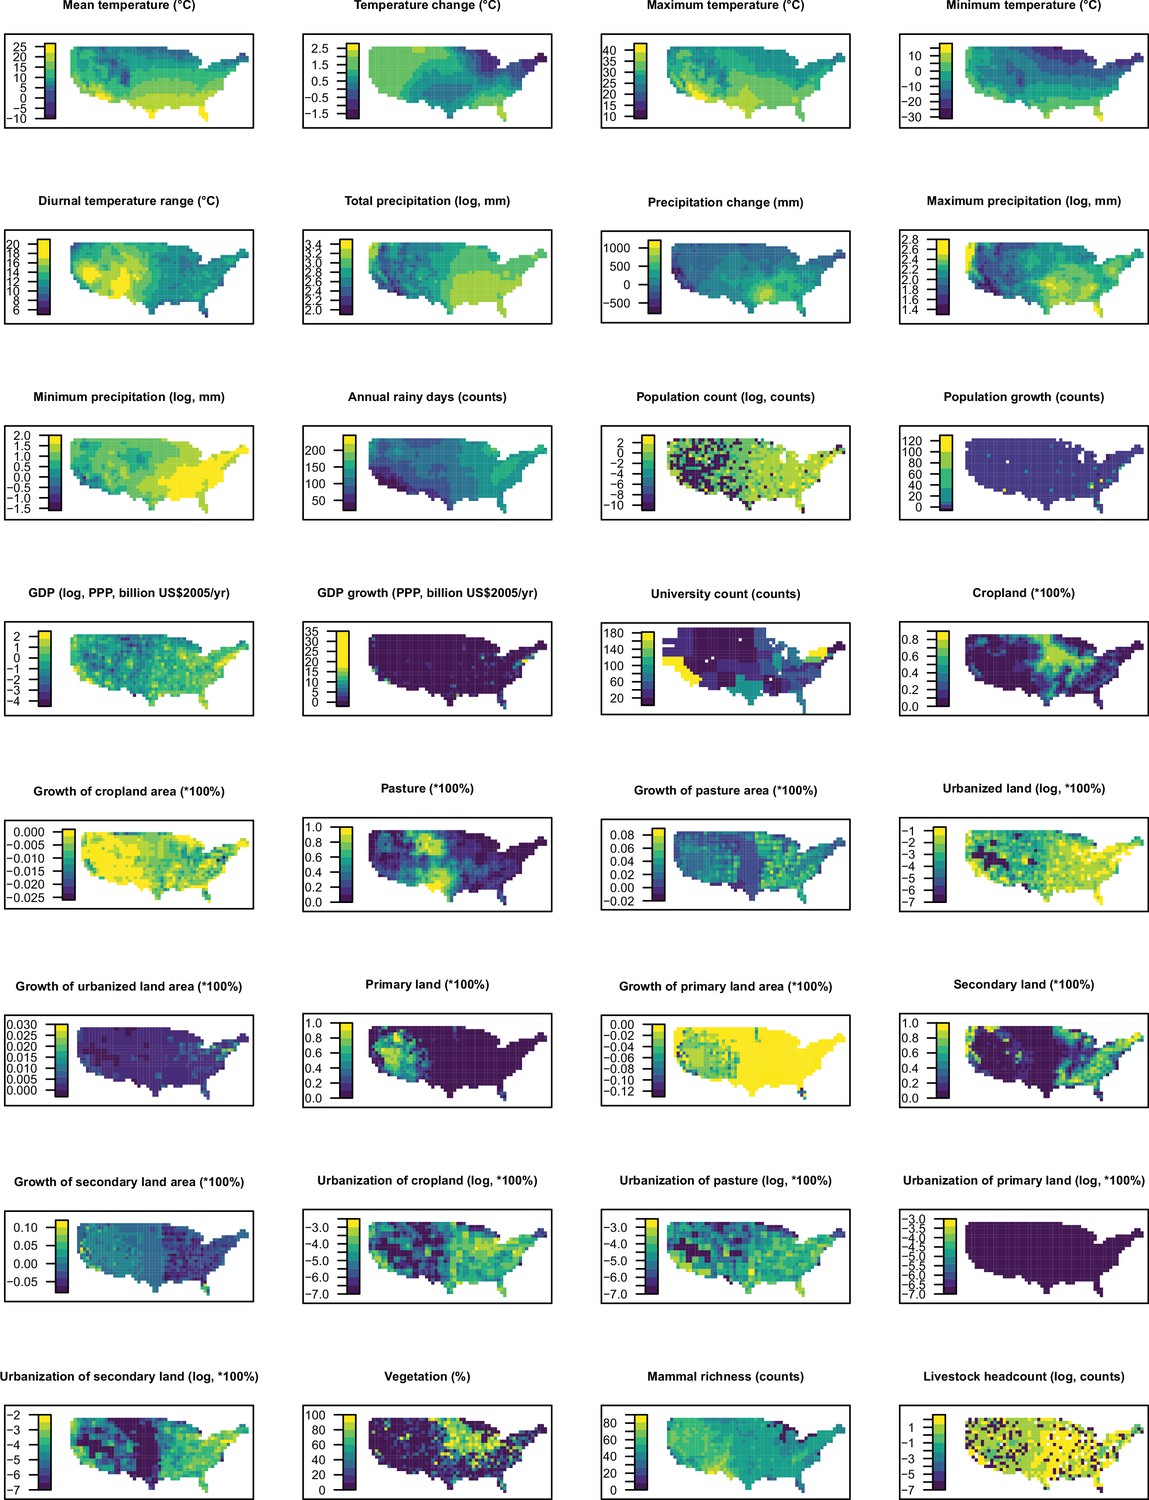
Distribution maps for 32 predictors in 2015 in the United States.
The values of these explanatory variables and latitude in each grid cell were used to predict the virus discovery in the corresponding grid cell in the Unites States in 2010–2019. Explanatory variables were log transformed where necessary to get better visualization, not meaning they entered the model by logged values.
Appendix 3—figure 10
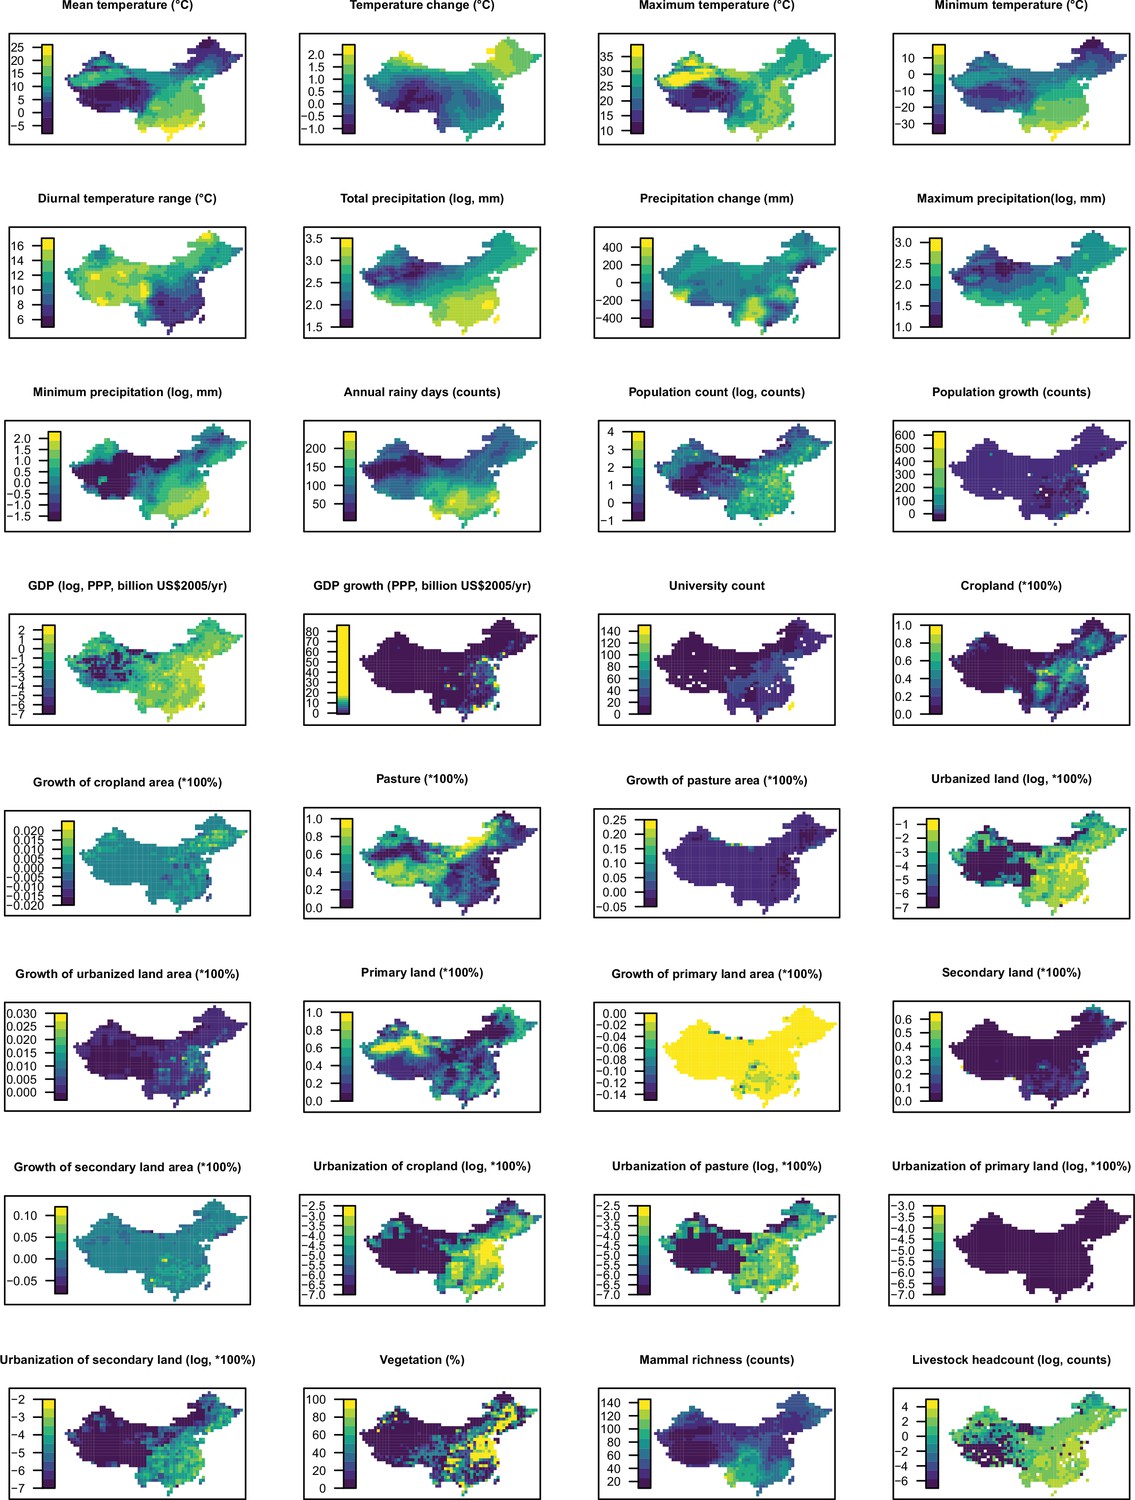
Distribution maps for 32 predictors in 2015 in China.
The values of these explanatory variables and latitude in each grid cell were used to predict the virus discovery in the corresponding grid cell in China in 2010–2019. Explanatory variables were log transformed where necessary to get better visualization, not meaning they entered the model by logged values.
Appendix 3—figure 11
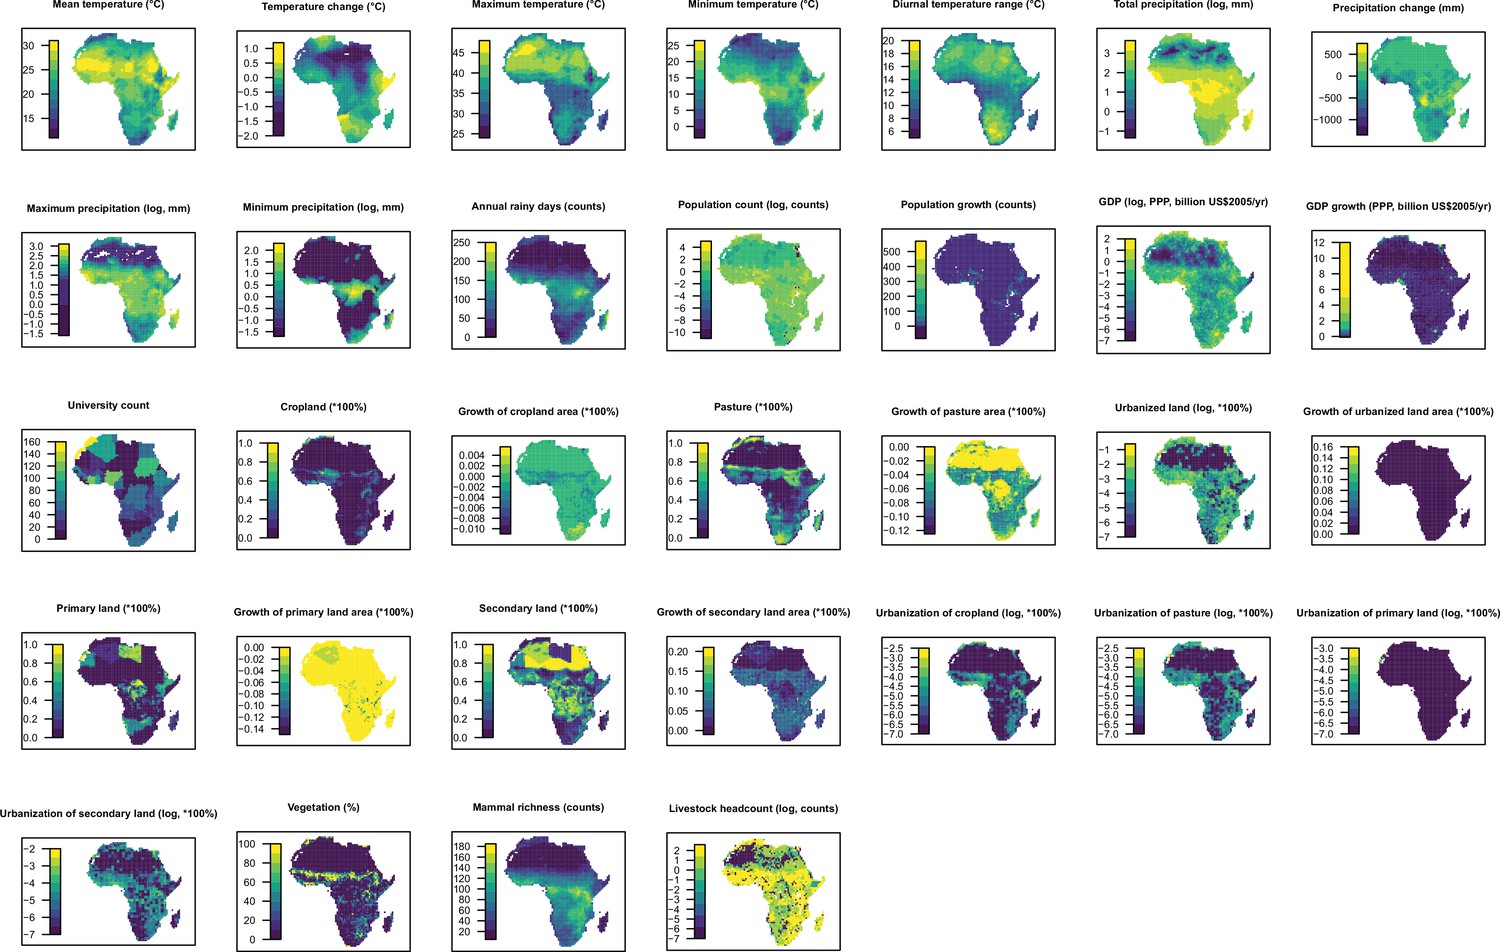
Distribution maps for 32 predictors in 2015 in Africa.
The values of these explanatory variables and latitude in each grid cell were used to predict the virus discovery in the corresponding grid cell in Africa in 2010–2019. Explanatory variables were log transformed where necessary to get better visualization, not meaning they entered the model by logged values.
Appendix 3—figure 12
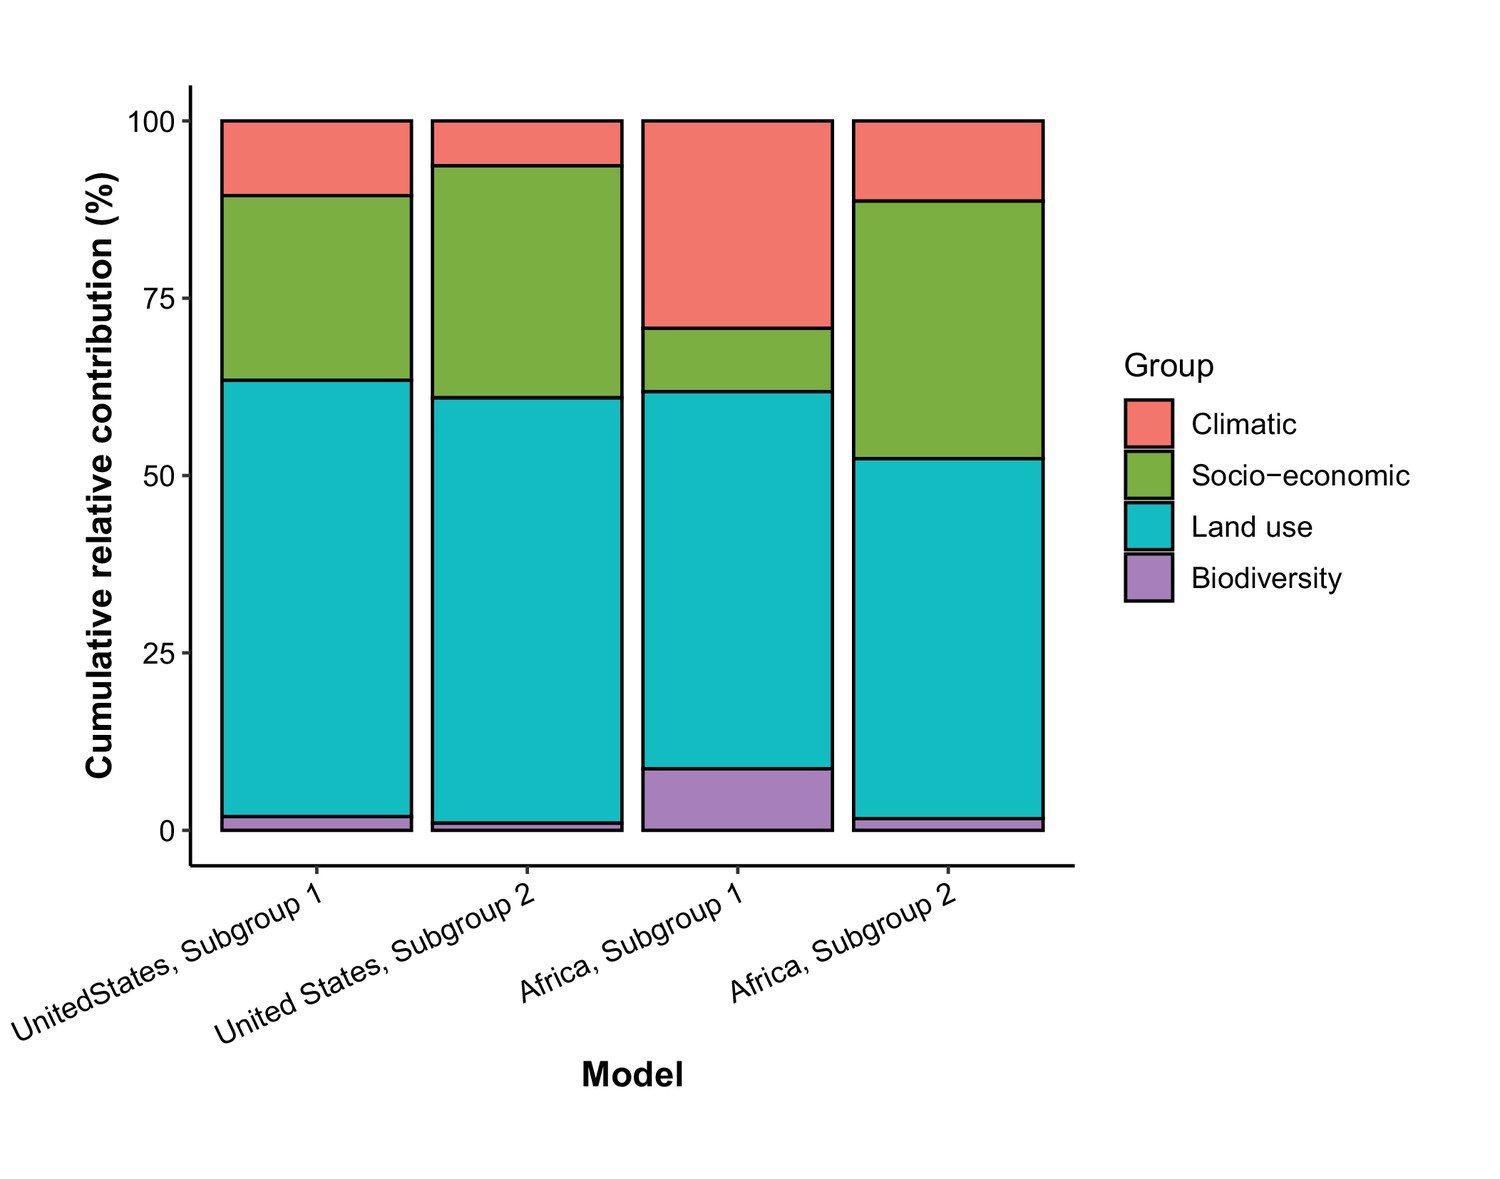
Cumulative relative contribution of predictors to human-infective RNA virus discovery by group in each model of subgroups.
Subgroup 1 represents viruses firstly discovered from the region (United States or Africa); Subgroup 2 represents viruses firstly discovered elsewhere in the world. In the United States, virus count of Subgroup 1 and Subgroup 2 were 52 and 43, respectively. In Africa, virus count of Subgroup 1 and Subgroup 2 were 39 and 68, respectively. The relative contributions of all explanatory factors sum to 100% in each model, and each colour represents the cumulative relative contribution of all explanatory factors within each group.
Appendix 4
As covariates may vary within a decade and their effects on virus discovery were likely not immediate, we performed two further sensitivity analyses by (i) matching virus discovery data and time-varying covariate data by year and (ii) testing for lag effects by matching virus discovery at year t and predictors at t-1 to t-5 year. We collected yearly data for climatic variables and land use from the same sources used in the main analysis. Yearly population data at grid level before 1970 and GDP data before 1980 are not available, so we extrapolated them back to 1901 using the yearly growth rate at country level (Source: Our World in Data). For population, the WorldPop Project provides yearly gridded data for 2000-2020 (https://www.arcgis.com/home/item.html?id=56eb0f050c61434782f008a08331d23a), and we used the growth rate by grid to extrapolate values after 2000.
Data availability
The authors confirm that all data or the data sources are provided in the paper and its Supplementary Materials. The final datasets and codes used for the analyses are available via figshare at https://doi.org/10.6084/m9.figshare.15101979.
-
figshareSupporting data and R scripts for: Predictors of human RNA virus discovery in the United States, China and Africa.https://doi.org/10.6084/m9.figshare.15101979
-
Edinburgh DataShareEpidemiological characteristics of human-infective RNA viruses.https://doi.org/10.7488/ds/2265
References
-
Family cluster of Middle East respiratory syndrome coronavirus infections, Tunisia, 2013Emerging Infectious Diseases 20:1527–1530.https://doi.org/10.3201/eid2009.140378
-
A new human virus in cultures from A nasopharyngeal carcinomaThe Journal of Pathology 103:P18.
-
Novel paramyxovirus associated with severe acute febrile disease, South Sudan and Uganda, 2012Emerging Infectious Diseases 20:211–216.https://doi.org/10.3201/eid2002.131620
-
Global hotspots and correlates of emerging zoonotic diseasesNature Communications 8:1124.https://doi.org/10.1038/s41467-017-00923-8
-
A sero-epidemiological study of arboviral fevers in Djibouti, Horn of AfricaPLOS Neglected Tropical Diseases 8:e3299.https://doi.org/10.1371/journal.pntd.0003299
-
Serum haemagglutination-inhibiting antibodies for haemadsorbing viruses types 1 and 3 and croup-associated in persons in Accra, GhanaArch Ital Sci Med Trop e Parassit 48:299–306.
-
The presence of antibodies neutralizing Tahyna virus in the sera of inhabitants of some European, Asian, African and Australian countriesJournal of Hygiene, Epidemiology, Microbiology, and Immunology 5:501–504.
-
Brief report: treatment of a laboratory-acquired Sabiá virus infectionThe New England Journal of Medicine 333:294–296.https://doi.org/10.1056/NEJM199508033330505
-
Virus meningo-encephalitis in South Africa; a study of the cases admitted to the Johannesburg Fever HospitalSouth African Journal of Laboratory and Clinical Medicine. Suid-Afrikaanse Tydskrif Vir Laboratorium- En Kliniekwerk 1:22–35.
-
Age-Grouping in Measles in an Urban Environment (A Serological StudyBulletin de La Societe Medicale d’Afrique Noire de Langue Francaise 8:771–778.
-
Epidemic non-A, non-B viral hepatitis in Algeria: strong evidence for its spreading by waterJournal of Medical Virology 16:257–263.https://doi.org/10.1002/jmv.1890160306
-
First confirmed cases of Middle East respiratory syndrome coronavirus (MERS-CoV) infection in the United States, updated information on the epidemiology of MERS-CoV infection, and guidance for the public, clinicians, and public health authorities - May 2014MMWR. Morbidity and Mortality Weekly Report 63:431–436.
-
History of Rabies in Southern CaliforniaCalifornia State Journal of Medicine 8:369–372.
-
Global distribution of novel rhinovirus genotypeEmerging Infectious Diseases 14:944–947.https://doi.org/10.3201/eid1406.080271
-
Prevalence of antibodies to lymphadenopathy-associated retrovirus in African patients with AIDSScience (New York, N.Y.) 226:453–456.https://doi.org/10.1126/science.6238406
-
Serological evidence of infection by Pichinde virus among laboratory workersInfection and Immunity 9:821–823.https://doi.org/10.1128/iai.9.5.821-823.1974
-
Lassa fever, a new virus disease of man from West Africa. 3. Isolation and characterization of the virusThe American Journal of Tropical Medicine and Hygiene 19:680–691.https://doi.org/10.4269/ajtmh.1970.19.680
-
HUMAN INFECTION WITH THE VIRUS OF NEWCASTLE DISEASE OF FOWLSMedical Journal of Australia 2:313–314.https://doi.org/10.5694/j.1326-5377.1943.tb51217.x
-
The Global Virome ProjectScience (New York, N.Y.) 359:872–874.https://doi.org/10.1126/science.aap7463
-
VENEZUELAN EQUINE ENCEPHALOMYELITIS IN MANThe Journal of Experimental Medicine 77:521–530.https://doi.org/10.1084/jem.77.6.521
-
Arbovirus surveillance in Nigeria, 1964-1967Bulletin de La Societe de Pathologie Exotique et de Ses Filiales 62:249–253.
-
AIDS due to HIV-2 infection--New JerseyMMWR. Morbidity and Mortality Weekly Report 37:33–35.
-
Chikungunya fever diagnosed among international travelers--United States, 2005-2006MMWR. Morbidity and Mortality Weekly Report 55:1040–1042.
-
Imported case of Marburg hemorrhagic fever - Colorado, 2008MMWR. Morbidity and Mortality Weekly Report 58:1377–1381.
-
Serological responses in patients with severe acute respiratory syndrome coronavirus infection and cross-reactivity with human coronaviruses 229E, OC43, and NL63Clinical and Diagnostic Laboratory Immunology 12:1317–1321.https://doi.org/10.1128/CDLI.12.11.1317-1321.2005
-
Studies on an epidemic of influenza in PekingChinese Medical Journal 68:185–192.
-
Association of a new type of cytopathogenic myxovirus with infantile croupThe Journal of Experimental Medicine 104:555–576.https://doi.org/10.1084/jem.104.4.555
-
RECOVERY FROM INFANTS WITH RESPIRATORY ILLNESS OF A VIRUS RELATED TO CHIMPANZEE CORYZA AGENT (CCAAmerican Journal of Epidemiology 66:281–290.https://doi.org/10.1093/oxfordjournals.aje.a119901
-
Newly recognized myxoviruses from children with respiratory diseaseThe New England Journal of Medicine 258:207–213.https://doi.org/10.1056/NEJM195801302580502
-
Isolation of parainfluenza type I virus by tissue culture and adsorption-hemagglutination test [Article in Chinese]Journal of Zhejiang University (Medical Sciences) pp. 9–14.
-
Yellow fever in China is still an imported diseaseBioscience Trends 10:158–162.https://doi.org/10.5582/bst.2016.01051
-
New Saffold cardiovirus in children, ChinaEmerging Infectious Diseases 15:993–994.https://doi.org/10.3201/eid1506.090109
-
A novel reovirus isolated from A patient with acute respiratory diseaseJournal of Clinical Virology 45:79–80.https://doi.org/10.1016/j.jcv.2009.03.001
-
Etiology of viral gastroenteritis in children <5 years of age in the United States, 2008-2009The Journal of Infectious Diseases 208:790–800.https://doi.org/10.1093/infdis/jit254
-
Isolation of A cDNA clone derived from A blood-borne non-A, non-B viral hepatitis genomeScience (New York, N.Y.) 244:359–362.https://doi.org/10.1126/science.2523562
-
Detection of novel astroviruses in urban brown rats and previously known astroviruses in humansThe Journal of General Virology 91:2457–2462.https://doi.org/10.1099/vir.0.022764-0
-
A serological survey of arboviruses in the human population of SenegalTropical and Geographical Medicine 19:326–332.
-
The aetiology of acute hepatitis in ZimbabweTransactions of the Royal Society of Tropical Medicine and Hygiene 78:514–518.https://doi.org/10.1016/0035-9203(84)90074-9
-
Central European Tick-borne Encephalitis: An Ohio Case With a History of Foreign TravelArchives of Pediatrics & Adolescent Medicine 133:1070.https://doi.org/10.1001/archpedi.1979.02130100094021
-
Human cosavirus infections in children in ChinaJournal of Clinical Virology 48:228–229.https://doi.org/10.1016/j.jcv.2010.03.024
-
Enzootic hepatitis or rift valley fever: An undescribed virus disease of sheep cattle and man from east africaThe Journal of Pathology and Bacteriology 34:545–579.https://doi.org/10.1002/path.1700340418
-
Epidemic non-A, non-B hepatitis in patients from PakistanAnnals of Internal Medicine 106:227–230.https://doi.org/10.7326/0003-4819-106-2-227
-
Evidence of HTLV-II infection in central AfricaAIDS (London, England) 5:771–772.
-
Mengo encephalomyelitis; a hitherto unknown virus affecting manLancet (London, England) 2:286–289.https://doi.org/10.1016/S0140-6736(48)90652-7
-
Zika virusII. Pathogenicity and Physical Properties. Transactions of the Royal Society of Tropical Medicine and Hygiene 46:521–534.https://doi.org/10.1016/0035-9203(52)90043-6
-
Uganda S virus. A hitherto unrecorded virus isolated from mosquitoes in Uganda. I. Isolation and PathogenicityTransactions of the Royal Society of Tropical Medicine and Hygiene 46:600–618.https://doi.org/10.1016/0035-9203(52)90021-7
-
Antibodies to respiratory syncytial virus in human sera from different regions of the worldBulletin of the World Health Organization 32:849–853.
-
Foot and mouth disease (FMD): serological investigation in some farms of Alexandria Governorate of EgyptThe Journal of the Egyptian Public Health Association 77:371–382.
-
Role of enteric adenoviruses and rotaviruses in infantile gastroenteritisLancet (London, England) 2:305–306.https://doi.org/10.1016/s0140-6736(81)90549-3
-
The natural occurrence of Venezuelan equine encephalitis in the United StatesThe New England Journal of Medicine 282:298–302.https://doi.org/10.1056/NEJM197002052820603
-
A working guide to boosted regression treesThe Journal of Animal Ecology 77:802–813.https://doi.org/10.1111/j.1365-2656.2008.01390.x
-
Emerging diseases: New arenavirus blamed for recent deaths in CaliforniaScience (New York, N.Y.) 289:842–843.https://doi.org/10.1126/science.289.5481.842
-
Evidence of a novel human coronavirus that is associated with respiratory tract disease in infants and young childrenThe Journal of Infectious Diseases 191:492–498.https://doi.org/10.1086/428138
-
Coronavirus HKU1 infection in the United StatesEmerging Infectious Diseases 12:775–779.https://doi.org/10.3201/eid1205.051316
-
Human metapneumovirus infections in young and elderly adultsThe Journal of Infectious Diseases 187:785–790.https://doi.org/10.1086/367901
-
A fatal human infection with Mokola virusThe American Journal of Tropical Medicine and Hygiene 21:959–963.https://doi.org/10.4269/ajtmh.1972.21.959
-
Norwalk-like virus infection found in diarrhea patients in China [Article in ChineseChinese Journal of Virology 11:215–219.
-
Hepatitis A: detection by immune electron microscopy of A viruslike antigen associated with acute illnessScience (New York, N.Y.) 182:1026–1028.https://doi.org/10.1126/science.182.4116.1026
-
National serosurvey of encephalomyocarditis virus in healthy people and pigs in ChinaArchives of Virology 160:2957–2964.https://doi.org/10.1007/s00705-015-2591-z
-
Detection of newly described astrovirus MLB1 in stool samples from childrenEmerging Infectious Diseases 15:441–444.https://doi.org/10.3201/eid1503.081213
-
THE TRANSMISSION OF ACUTE POLIOMYELITIS TO MONKEYSJournal of the American Medical Association LIII:1639.https://doi.org/10.1001/jama.1909.92550200027002g
-
The etiology of Colorado tick feverThe Journal of Experimental Medicine 83:1–10.https://doi.org/10.1084/jem.83.1.1
-
Antibody to hemorrhagic fever with renal syndrome viruses (Hantaviruses) in the United StatesAmerican Journal of Epidemiology 126:1210–1213.https://doi.org/10.1093/oxfordjournals.aje.a114760
-
Probable non-vector-borne transmission of Zika virus, Colorado, USAEmerging Infectious Diseases 17:880–882.https://doi.org/10.3201/eid1705.101939
-
IMMUNOLOGICAL STUDIES WITH THE VIRUS OF INFLUENZAThe Journal of Experimental Medicine 62:505–516.https://doi.org/10.1084/jem.62.4.505
-
Differentiation of Influenza A and Influenza B by the Complement-Fixation ReactionExperimental Biology and Medicine 45:861–863.https://doi.org/10.3181/00379727-45-11862P
-
Identification of another epidemic respiratory diseaseScience (New York, N.Y.) 112:495–497.https://doi.org/10.1126/science.112.2913.495
-
Outbreake of Marburg virus disease in JohannesburgBritish Medical Journal 4:489–493.https://doi.org/10.1136/bmj.4.5995.489
-
Antibodies to Lassa and Lassa-like viruses in man and mammals in the Central African RepublicTransactions of the Royal Society of Tropical Medicine and Hygiene 79:78–79.https://doi.org/10.1016/0035-9203(85)90242-1
-
Bovine viral diarrhoeaLancet (London, England) 2:110.https://doi.org/10.1016/s0140-6736(88)90047-5
-
THE NATURE OF THE VIRUS OF MEASLESJournal of the American Medical Association LVII:971.https://doi.org/10.1001/jama.1911.04260090193009
-
A non-fatal human case of Powassan virus encephalitisThe American Journal of Tropical Medicine and Hygiene 22:78–81.https://doi.org/10.4269/ajtmh.1973.22.78
-
Enteric viruses and diarrhea in HIV-infected patients: Enteric Opportunistic Infections Working GroupThe New England Journal of Medicine 329:14–20.https://doi.org/10.1056/NEJM199307013290103
-
Serological evidence of infection with California serogroup viruses (family Bunyaviridae) in residents of Long Hua, suburb of Shanghai, People’s Republic of ChinaTransactions of the Royal Society of Tropical Medicine and Hygiene 78:780–781.https://doi.org/10.1016/0035-9203(84)90018-x
-
Investigation report on virus types in patients with cold in Guangzhou [Article in ChineseGuangdong Medical Journal pp. 2–6.
-
Transmission of Rubella to Macacus mulatta MonkeysPublic Health Reports (1896-1970) 57:1126.https://doi.org/10.2307/4584176
-
California encephalitis virus, a newly described agentCalifornia Medicine 77:303–309.
-
Viruses isolated from natural common colds in the U.S.ABritish Medical Journal 2:1382–1385.https://doi.org/10.1136/bmj.2.5264.1382
-
A New Virus Isolated from the Human Respiratory TractExperimental Biology and Medicine 121:190–193.https://doi.org/10.3181/00379727-121-30734
-
Human infection with the virus of vesicular stomatitisThe Journal of Laboratory and Clinical Medicine 36:754–758.
-
Urbanization and Disease Emergence: Dynamics at the Wildlife-Livestock-Human InterfaceTrends in Ecology & Evolution 32:55–67.https://doi.org/10.1016/j.tree.2016.09.012
-
PCR sequencing of the spike genes of geographically and chronologically distinct human coronaviruses 229EJournal of Virological Methods 75:179–193.https://doi.org/10.1016/s0166-0934(98)00116-5
-
Isolation of rubella virus [Article in ChineseJournal of Zhejiang University (Medical Sciences) 8:169–172.
-
Recovery of the Virus of Equine Encephalomyelitis from the Brain of a ChildScience (New York, N.Y.) 88:455–456.https://doi.org/10.1126/science.88.2289.455
-
Isolation of A small RNA virus from feces of A patient with enterically transmitted Non-A Non-B hepatitis in China [Article in ChineseJournal of Academy of Military Medical Sciences 13:273–277.
-
Simian foamy virus prevalence in Macaca mulatta and zookeepersAIDS Research and Human Retroviruses 28:591–593.https://doi.org/10.1089/AID.2011.0305
-
THE NEUTRALIZATION OF POLIOMYELITIS VIRUS BY THE SERUM OF LIBERIAN NEGROES*American Journal of Epidemiology 17:581–586.https://doi.org/10.1093/oxfordjournals.aje.a117926
-
Waterborne outbreak of rotavirus diarrhoea in adults in China caused by a novel rotavirusLancet (London, England) 1:1139–1142.https://doi.org/10.1016/S0140-6736(84)91391-6
-
The spread of influenza; evidence from 1950-1951British Medical Journal 2:921–927.https://doi.org/10.1136/bmj.2.4737.921
-
First detection of group C rotavirus in fecal specimens of children with diarrhea in the United StatesThe Journal of Infectious Diseases 172:45–50.https://doi.org/10.1093/infdis/172.1.45
-
AN INVESTIGATION OF THE ETIOLOGY OF MUMPSThe Journal of Experimental Medicine 59:1–19.https://doi.org/10.1084/jem.59.1.1
-
STUDIES OF A NEW HUMAN HEMADSORPTION VIRUSAmerican Journal of Epidemiology 71:81–92.https://doi.org/10.1093/oxfordjournals.aje.a120092
-
Discovery of a novel human picornavirus in a stool sample from a pediatric patient presenting with fever of unknown originJournal of Clinical Microbiology 45:2144–2150.https://doi.org/10.1128/JCM.00174-07
-
Serosurvey of encephalomyocarditis virus neutralizing antibodies in southern Louisiana and Peruvian Indian populationsThe American Journal of Tropical Medicine and Hygiene 10:593–598.https://doi.org/10.4269/ajtmh.1961.10.593
-
Production of common colds in human volunteers by influenza C virusBritish Medical Journal 4:153–154.https://doi.org/10.1136/bmj.4.5624.153
-
New human T-lymphotropic retrovirus related to simian T-lymphotropic virus type III (STLV-IIIAGMScience (New York, N.Y.) 232:238–243.https://doi.org/10.1126/science.3006256
-
Recent advances in the aetiology of viral gastroenteritisCiba Foundation Symposium 42:273–309.https://doi.org/10.1002/9780470720240.ch16
-
Multiple novel astrovirus species in human stoolThe Journal of General Virology 90:2965–2972.https://doi.org/10.1099/vir.0.014449-0
-
Serologic evidence of avian metapneumovirus infection among adults occupationally exposed to TurkeysVector Borne and Zoonotic Diseases (Larchmont, N.Y.) 11:1453–1458.https://doi.org/10.1089/vbz.2011.0637
-
Hepatitis C virus antibodies in southern African blacks with hepatocellular carcinomaLancet (London, England) 335:873–874.https://doi.org/10.1016/0140-6736(90)90474-j
-
Simian immunodeficiency virus needlestick accident in a laboratory workerLancet (London, England) 340:271–273.https://doi.org/10.1016/0140-6736(92)92358-m
-
Serological evidence of human hantavirus infections in Guinea, West AfricaThe Journal of Infectious Diseases 201:1031–1034.https://doi.org/10.1086/651169
-
Ndumu virus, a hitherto unknown agent, isolated from culicine mosouitoes collected in northern Natal: Union of South AfricaThe American Journal of Tropical Medicine and Hygiene 10:383–386.https://doi.org/10.4269/ajtmh.1961.10.383
-
A novel coronavirus associated with severe acute respiratory syndromeThe New England Journal of Medicine 348:1953–1966.https://doi.org/10.1056/NEJMoa030781
-
Studies on the isolation and growth characteristics of respiratory syncytial virus [Article in ChineseActa Microbiologica Sinica 15:125–132.
-
Human parainfluenza virus 4 outbreak and the role of diagnostic testsJournal of Clinical Microbiology 43:4515–4521.https://doi.org/10.1128/JCM.43.9.4515-4521.2005
-
Clinical features and complete genome characterization of a distinct human rhinovirus (HRV) genetic cluster, probably representing a previously undetected HRV species, HRV-C, associated with acute respiratory illness in childrenJournal of Clinical Microbiology 45:3655–3664.https://doi.org/10.1128/JCM.01254-07
-
The Etiology of Dengue: An Attempt to Produce the Disease in the Rhesus Monkey by the Inoculation of Defibrinated BloodJournal of Infectious Diseases 15:341–346.https://doi.org/10.1093/infdis/15.2.341
-
Isolation and partial characterisation of a new strain of Ebola virusLancet (London, England) 345:1271–1274.https://doi.org/10.1016/s0140-6736(95)90925-7
-
Isolation of Getah virus from mosquitos collected on Hainan Island, China, and results of a serosurveyThe Southeast Asian Journal of Tropical Medicine and Public Health 23:730–734.https://doi.org/10.1186/1471-2180-12-305
-
A novel picornavirus associated with gastroenteritisJournal of Virology 83:12002–12006.https://doi.org/10.1128/JVI.01241-09
-
West nile virus infection in Xinjiang, ChinaVector Borne and Zoonotic Diseases (Larchmont, N.Y.) 13:131–133.https://doi.org/10.1089/vbz.2012.0995
-
Viral surveillance and discoveryCurrent Opinion in Virology 3:199–204.https://doi.org/10.1016/j.coviro.2013.03.010
-
Isolation of Irkut virus from a Murina leucogaster bat in ChinaPLOS Neglected Tropical Diseases 7:e2097.https://doi.org/10.1371/journal.pntd.0002097
-
Rift Valley fever virus imported into China from AngolaThe Lancet Infectious Diseases 16:1226.https://doi.org/10.1016/S1473-3099(16)30401-7
-
Report of one case of hand-foot-mouth disease in human [Article in ChineseNew Medicine 30:37–38.
-
The Role of Enteropathogenic Bacteria and Viruses in Acute Diarrhoeal Disorders of Infancy and Childhood in Johannesburg. II. “Non-Specific” Gastro-EnteritisSouth African Medical Journal = Suid-Afrikaanse Tydskrif Vir Geneeskunde 37:259–261.
-
Emerging Tick-Borne Viruses in the Twenty-First CenturyFrontiers in Cellular and Infection Microbiology 7:298.https://doi.org/10.3389/fcimb.2017.00298
-
An outbreak of human Semliki Forest virus infections in Central African RepublicThe American Journal of Tropical Medicine and Hygiene 42:386–393.https://doi.org/10.4269/ajtmh.1990.42.386
-
A new phlebovirus associated with severe febrile illness in MissouriThe New England Journal of Medicine 367:834–841.https://doi.org/10.1056/NEJMoa1203378
-
Epidemiological features of and public health response to a St Louis encephalitis epidemic in Florida, 1990-1Epidemiology and Infection 125:181–188.https://doi.org/10.1017/s0950268899004227
-
An unusual case of human rabies thought to be of chiropteran originSouth African Medical Journal = Suid-Afrikaanse Tydskrif Vir Geneeskunde 45:767–769.
-
Preliminary report on the examination of hepatitis A antigen particles by immunoelectron microscopy [Article in ChineseShanghai Medical Journal pp. 13–15.
-
Seroepidemiological study of filovirus related to Ebola in the PhilippinesLancet (London, England) 337:425–426.https://doi.org/10.1016/0140-6736(91)91199-5
-
Enterovirus type 70: the etiologic agent of pandemic acute haemorrhagic conjunctivitisBulletin of the World Health Organization 49:341–346.
-
Influenza in East Africa, 1969-70Bulletin of the World Health Organization 43:269–273.
-
Arthropod-borne viral infections of man in Nigeria, 1964-1970Annals of Tropical Medicine and Parasitology 69:49–64.https://doi.org/10.1080/00034983.1975.11686983
-
Serological evidence of arboviral infections among humans of coastal KenyaThe Journal of Tropical Medicine and Hygiene 94:166–168.https://doi.org/10.4269/ajtmh.2011.10-0203
-
Prediction and prevention of the next pandemic zoonosisLancet (London, England) 12:1956–1965.https://doi.org/10.1016/S0140-6736(12)61684-5
-
Studies of bovine enterovirusesAmerican Journal of Veterinary Research 22:852–863.
-
Detection of antibody to group B adult diarrhea rotaviruses in humansJournal of Clinical Microbiology 25:812–818.https://doi.org/10.1128/jcm.25.5.812-818.1987
-
Detection of human calicivirus antigen and antibody by enzyme-linked immunosorbent assaysJournal of Clinical Microbiology 26:2001–2005.https://doi.org/10.1128/jcm.26.10.2001-2005.1988
-
The outbreak of West Nile virus infection in the New York City area in 1999The New England Journal of Medicine 344:1807–1814.https://doi.org/10.1056/NEJM200106143442401
-
Genetic identification of a hantavirus associated with an outbreak of acute respiratory illnessScience (New York, N.Y.) 262:914–917.https://doi.org/10.1126/science.8235615
-
A 27-nm virus isolated during an outbreak of acute infectious nonbacterial gastroenteritis in A convalescent hospital: A possible new serotypeThe Journal of Infectious Diseases 143:791–795.https://doi.org/10.1093/infdis/143.6.791
-
Rotavirus-the source of acute gastroenteritis in infants in autumn [Article in ChineseBulletin of Medical Research pp. 26–27.
-
Cross-species virus transmission and the emergence of new epidemic diseasesMicrobiology and Molecular Biology Reviews 72:457–470.https://doi.org/10.1128/MMBR.00004-08
-
Pathogen biology research group Jnmc: Virus isolation in 535 elderly patients with chronic bronchitis and other respiratory infections and antibody tests in some cases [Article in ChineseJiangsu Medical Journal pp. 47–53.
-
A study of vesicular stomatitis in manJournal of the American Veterinary Medical Association 133:57–62.
-
Bornholm disease, pleurodynia or epidemic myalgia; an outbreak in the Transvaal associated with Coxsackie virus infectionSouth African Medical Journal = Suid-Afrikaanse Tydskrif Vir Geneeskunde 27:397–402.
-
Coronavirus as a possible cause of severe acute respiratory syndromeLancet (London, England) 361:1319–1325.https://doi.org/10.1016/s0140-6736(03)13077-2
-
Children with respiratory disease associated with metapneumovirus in Hong KongEmerging Infectious Diseases 9:628–633.https://doi.org/10.3201/eid0906.030009
-
Japanese B encephalitis in an American soldier returning from KoreaThe New England Journal of Medicine 249:531–532.https://doi.org/10.1056/NEJM195309242491305
-
Laboratory medicine in Africa: A barrier to effective health careClinical Infectious Diseases 42:377–382.https://doi.org/10.1086/499363
-
Ability to replicate in the cytoplasm predicts zoonotic transmission of livestock virusesThe Journal of Infectious Diseases 199:565–568.https://doi.org/10.1086/596510
-
Viral diarrhea in children in Beijing, ChinaJournal of Medical Virology 57:390–396.https://doi.org/10.1002/(SICI)1096-9071(199904)57:4<390::AID-JMV11>3.0.CO;2-0
-
A Strategic Approach to Studying Emerging Zoonotic Infectious Diseases: EcohealthThe Vietnam Initiative on Zoonotic Infections (VIZIONS 1:726–735.https://doi.org/10.1007/s10393-015-1061-0
-
Characteristics of Poliomyelitis and Other Enteric Viruses Recovered in Tissue Culture from Healthy American ChildrenExperimental Biology and Medicine 87:655–661.https://doi.org/10.3181/00379727-87-21474
-
Enteropathogenic viruses and bacteria; role in summer diarrheal diseases of infancy and early childhoodJournal of the American Medical Association 167:147–156.https://doi.org/10.1001/jama.1958.02990190001001
-
Louping Ill in ManThe Journal of Experimental Medicine 59:669–685.https://doi.org/10.1084/jem.59.5.669
-
Incidence and significance of antibodies to delta antigen in hepatitis B virus infectionLancet (London, England) 2:986–990.https://doi.org/10.1016/s0140-6736(79)92561-3
-
Hepatitis C virus surveillance and identification of human pegivirus 2 in a large Cameroonian cohortJournal of Viral Hepatitis 26:30–37.https://doi.org/10.1111/jvh.12996
-
Detecting the emergence of novel, zoonotic viruses pathogenic to humansCellular and Molecular Life Sciences 72:1115–1125.https://doi.org/10.1007/s00018-014-1785-y
-
The Newala epidemicIII. The Virus: Isolation, Pathogenic Properties and Relationship to the Epidemic. The Journal of Hygiene 54:177–191.https://doi.org/10.1017/S0022172400044442
-
Detection of serum antibodies to Borna disease virus in patients with psychiatric disordersScience (New York, N.Y.) 228:755–756.https://doi.org/10.1126/science.3922055
-
Genetic characterization of simian foamy viruses infecting humansJournal of Virology 86:13350–13359.https://doi.org/10.1128/JVI.01715-12
-
Experimental studies on Phlebotomus (pappataci, sandfly) fever during World War IIArchiv Fur Die Gesamte Virusforschung 4:367–410.https://doi.org/10.1007/BF01241161
-
First detection of heartland virus (Bunyaviridae: Phlebovirus) from field collected arthropodsThe American Journal of Tropical Medicine and Hygiene 89:445–452.https://doi.org/10.4269/ajtmh.13-0209
-
A probable new human picornavirus associated with respiratory diseasesAmerican Journal of Epidemiology 85:297–310.https://doi.org/10.1093/oxfordjournals.aje.a120693
-
SA virus; a new member of the myxovirus groupJournal of Immunology (Baltimore, Md 82:274–278.
-
Acute infantile gastroenteritis associated with human enteric viruses in TunisiaJournal of Clinical Microbiology 46:1349–1355.https://doi.org/10.1128/JCM.02438-07
-
Human group C rotavirus identified in South AfricaSouth African Medical Journal = Suid-Afrikaanse Tydskrif Vir Geneeskunde 89:1073–1074.
-
VIRUS ISOLATION, INCLUSION BODIES, AND CHROMOSOMES IN A RUBELLA-INFECTED HUMAN EMBRYOLancet (London, England) 2:336–337.https://doi.org/10.1136/bmj.2.5402.166
-
The first detection of human parechovirus infections in ChinaJournal of Clinical Virology 45:371–372.https://doi.org/10.1016/j.jcv.2009.05.033
-
Picornavirus salivirus/klassevirus in children with diarrhea, ChinaEmerging Infectious Diseases 16:1303–1305.https://doi.org/10.3201/eid1608.100087
-
Isolation and identification of acute hemorrhagic conjunctivitis virus in 1975 [Article in ChineseChinese Journal of Ophthalmology 15:90.
-
Existing and potential infection risk zones of yellow fever worldwide: a modelling analysisThe Lancet Global Health 6:e270–e278.https://doi.org/10.1016/S2214-109X(18)30024-X
-
Serologic differences among strains of the Coxsackie group of virusesProceedings of the Society for Experimental Biology and Medicine. Society for Experimental Biology and Medicine (New York, N.Y.) 72:30.https://doi.org/10.3181/00379727-72-17321
-
Autochthonous Japanese Encephalitis with Yellow Fever Coinfection in AfricaThe New England Journal of Medicine 376:1483–1485.https://doi.org/10.1056/NEJMc1701600
-
Congo virus: a hitherto undescribed virus occurring in AfricaI. Human Isolations-Clinical Notes. East African Medical Journal 44:86–92.
-
In vitro isolation and characterization of a calicivirus causing a vesicular disease of the hands and feetClinical Infectious Diseases 26:434–439.https://doi.org/10.1086/516311
-
A Neurotropic Virus Isolated from the Blood of A Native of Uganda 1The American Journal of Tropical Medicine and Hygiene s1-20:471–492.https://doi.org/10.4269/ajtmh.1940.s1-20.471
-
Bwamba Fever and Its Causative VirusThe American Journal of Tropical Medicine and Hygiene s1-21:75–90.https://doi.org/10.4269/ajtmh.1941.s1-21.75
-
A neurotropic virus isolated from Aedes mosquitoes caught in the Semliki forestThe American Journal of Tropical Medicine and Hygiene 26:189–208.https://doi.org/10.4269/ajtmh.1946.s1-26.189
-
Neutralizing antibodies against certain recently isolated viruses in the sera of human beings residing in East AfricaJournal of Immunology 69:223–234.
-
Studies on arthropod-borne viruses of TongalandIX. Isolation of Wesselsbron Virus from a Naturally Infected Human Being and from Aedes (Banksinella) Circumluteolus Theo. The South African Journal of Medical Sciences 22:113–120.https://doi.org/10.4269/ajtmh.1958.7.579
-
An agent related to Uganda S virus from man and mosquitoes in South AfricaSouth African Medical Journal = Suid-Afrikaanse Tydskrif Vir Geneeskunde 33:959–962.
-
Etiological studies of epidemic hemorrhagic fever I. Virus Isolation in Apodemus Agrarius from Non-Endemic Area and Its Antigenic Characterization [Article in ChineseZhongguo Yi Xue Ke Xue Yuan Xue Bao Acta Academiae Medicinae Sinicae 4:73–77.
-
Rat Hepatitis E Virus as Cause of Persistent Hepatitis after Liver TransplantEmerging Infectious Diseases 24:2241–2250.https://doi.org/10.3201/eid2412.180937
-
THE TRANSMISSION OF YELLOW FEVER TO MACACUS RHESUSJournal of the American Medical Association 90:253.https://doi.org/10.1001/jama.1928.02690310005002
-
Discovery of novel rhabdoviruses in the blood of healthy individuals from West AfricaPLOS Neglected Tropical Diseases 9:e0003631.https://doi.org/10.1371/journal.pntd.0003631
-
Bat salivary gland virus: infections of man and monkeyTexas Reports on Biology and Medicine 20:113–127.
-
Research progress and epidemic situation of the Zika Virus [Article in ChineseChin J Diagnostics (Electronic Edition) 04:66–69.
-
The prevalence of antibody to hepatitis A antigen in various parts of the world: A pilot studyAmerican Journal of Epidemiology 106:392–398.https://doi.org/10.1093/oxfordjournals.aje.a112481
-
Research on the isolation of measles virus [Article in ChineseChinese Science Bulletin pp. 314–315.
-
Tembusu virus in human, ChinaTransboundary and Emerging Diseases 60:193–196.https://doi.org/10.1111/tbed.12085
-
Sindbis virus: a newly recognized arthropodtransmitted virusThe American Journal of Tropical Medicine and Hygiene 4:844–862.https://doi.org/10.4269/ajtmh.1955.4.844
-
Two successive outbreaks of SRSV-associated gastroenteritis in South AfricaJournal of Medical Virology 41:18–23.https://doi.org/10.1002/jmv.1890410105
-
Studies on some viruses (rhinoviruses) isolated from common coldsArchiv Fur Die Gesamte Virusforschung 13:281–293.https://doi.org/10.1007/BF01243854
-
Virus diseases on Tristan da CunhaTransactions of the Royal Society of Tropical Medicine and Hygiene 57:19–22.https://doi.org/10.1016/0035-9203(63)90005-1
-
Mayaro virus disease: an emerging mosquito-borne zoonosis in tropical South AmericaClinical Infectious Diseases 28:67–73.https://doi.org/10.1086/515070
-
Characterization of Orungo virus, an orbivirus from Uganda and NigeriaArchives of Virology 51:285–298.https://doi.org/10.1007/BF01317932
-
Antibody to Japanese strain of haemorrhagic fever with renal syndrome (HFRS) virus in Nigerian seraTransactions of the Royal Society of Tropical Medicine and Hygiene 80:1008–1009.https://doi.org/10.1016/0035-9203(86)90307-x
-
Contribution of common and recently described respiratory viruses to annual hospitalizations in children in South AfricaJournal of Medical Virology 83:1458–1468.https://doi.org/10.1002/jmv.22120
-
Isolation, identification and serological studies of a coronavirus strain [Article in ChineseActa Microbiologica Sinica 15:231–235.
-
Isolation and identification of forest encephalitis virus [Article in ChineseJournal of Harbin Medical University pp. 44–49.
-
Etiology of Mumps in Beijing [Article in ChineseNational Medical Journal of China 44:18–29.
-
A novel discovered rotavirus from adult acute diarrhoeal patients in China [Article in ChineseChinese Journal of Virology 03:321–325.
-
Infection of hepatitis G virus among blood donors in China [Article in ChineseJournal of Beijing Medical University 28:97.
-
Isolation of kyasanur forest disease virus from febrile patient, yunnan, chinaEmerging Infectious Diseases 15:326–328.https://doi.org/10.3201/eid1502.080978
-
Recently identified novel human astroviruses in children with diarrhea, ChinaEmerging Infectious Diseases 19:1333–1335.https://doi.org/10.3201/eid1908.121863
-
A Virus Encountered in the Study of Material from Cases of Encephalitis N the StLouis and Kansas City Epidemics Of 1933:463–465.https://doi.org/10.1126/science.78.2029.463
-
Survey of influenza antibodies in normal human sera in PekingChinese Medical Journal (Peking, China) 75:792–801.
-
Rabies in South Africa: Occurrence and Distribution of Cases During 1932Onderstepoort Journal of Veterinary Science and Animal Industry 1:51–56.
-
O’nyong-nyong fever: An epidemic virus disease in East AfricaTransactions of the Royal Society of Tropical Medicine and Hygiene 55:135–141.https://doi.org/10.1016/0035-9203(61)90017-7
-
Nyando Virus: a Hitherto Undescribed Virus Isolated from Anopheles Funestus Giles Collected in KenyaArchiv Fur Die Gesamte Virusforschung 15:422–427.https://doi.org/10.1007/BF01241769
-
Human T cell leukaemia virus associated lymphoproliferative disease: report of two cases in NigeriaBritish Medical Journal (Clinical Research Ed.) 288:1495–1496.https://doi.org/10.1136/bmj.288.6429.1495
-
Assessing the Epidemic Potential of RNA and DNA VirusesEmerging Infectious Diseases 22:2037–2044.https://doi.org/10.3201/eid2212.160123
-
SEROLOGICAL EVIDENCE OF ARBOVIRUS INFECTION IN THE SEMINOLE INDIANS OF SOUTHERN FLORIDAScience (New York, N.Y.) 145:270–272.https://doi.org/10.1126/science.145.3629.270
-
Investigation on Coxsackie Virus Disease in Fujian Province [Article in ChineseNational Medical Journal of China 46:40–48.
-
Human rhinovirus group C infection in children with lower respiratory tract infectionEmerging Infectious Diseases 14:1665–1667.https://doi.org/10.3201/eid1410.080545
-
An epidemic of hand-foot-and-mouth disease due to Coxsackie A16 in Tianjin City [Article in ChineseTianjin Medical Journal 06:355–357.
-
Detection of astrovirus in faeces of infants with gastroenteritis in autumn [Article in ChineseJournal of Medical Research 32.
-
HCV infection and primary liver cell cancer [Article in ChineseTumor (Shanghai) 10:105–115.
-
New orbiviruses isolated from patients with unknown fever and encephalitis in Yunnan Province [Article in ChineseChinese Journal of Virology 06:27–33.
-
Seroepidemiological survey of arbovirus in Hainan Province in 1998 [Article in ChineseChinese Journal of Epidemiology 20:20.
-
Confirmation of the first HIV-2 case in China [Article in ChineseJournal of Chinese AIDS&STD Prevention and Control 06:16–18.
-
Superinfection of colti virus and Japanese encephalitis virus [Article in ChineseJournal of Nanjing Railway Medical College 15:29.
-
Aichi virus strains in children with gastroenteritis, ChinaEmerging Infectious Diseases 15:1703–1705.https://doi.org/10.3201/eid1510.090522
-
Isolation of a Virus from an Acute Encephalitis Case in PeipingExperimental Biology and Medicine 46:609–611.https://doi.org/10.3181/00379727-46-12080P
-
ISOLATION OF A VIRUS FROM A CASE OF ACUTE POLIOMYELITIS IN PEIPING: WITH HISTOPATHOLOGICAL STUDIESChinese Medical Journal 60:201–206.
-
Characteristics of Crimean-Congo hemorrhagic fever virus (Xinjiang strain) in ChinaThe American Journal of Tropical Medicine and Hygiene 34:1179–1182.https://doi.org/10.4269/ajtmh.1985.34.1179
-
Infantile gastroenteritis associated with excretion of pestivirus antigensLancet (London, England) 1:517–520.https://doi.org/10.1016/s0140-6736(89)90066-4
-
Serological study of 722 infants with viral pneumonia [Article in ChineseGuangdong Medical Journal 08:32–34.
-
Process of isolating influenza virus in 1956 [Article in ChineseBiological Products Newsletter 2:80.
-
Hemorrhagic fever caused by a novel tick-borne Bunyavirus in Huaiyangshan, ChinaZhonghua Liu Xing Bing Xue Za Zhi = Zhonghua Liuxingbingxue Zazhi 32:209–220.
-
Detection of diarrhoea viruses in children with acute gastroenteritis [Article in ChineseChinese Journal of Experimental and Clinical Virology pp. 45–49.
Article and author information
Author details
Funding
Darwin Trust of Edinburgh
- Feifei Zhang
European Union's Horizon 2020 research and innovation programme (874735)
- Mark EJ Woolhouse
The funders had no role in study design, data collection and interpretation, or the decision to submit the work for publication.
Acknowledgements
We thank Liam Brierley (University of Liverpool, UK) for validating the data sets. We would like to thank all reviewers and editors (Benn Sartorius, Ben Cooper, George Perry etc.) for their constructive comments and suggestions.
Copyright
© 2022, Zhang et al.
This article is distributed under the terms of the Creative Commons Attribution License, which permits unrestricted use and redistribution provided that the original author and source are credited.
Metrics
-
- 1,024
- views
-
- 231
- downloads
-
- 2
- citations
Views, downloads and citations are aggregated across all versions of this paper published by eLife.
Citations by DOI
-
- 2
- citations for umbrella DOI https://doi.org/10.7554/eLife.72123
Download links
A two-part list of links to download the article, or parts of the article, in various formats.
Downloads (link to download the article as PDF)
Open citations (links to open the citations from this article in various online reference manager services)
Cite this article (links to download the citations from this article in formats compatible with various reference manager tools)
Predictors of human-infective RNA virus discovery in the United States, China, and Africa, an ecological study
eLife 11:e72123.
https://doi.org/10.7554/eLife.72123


