Covalent inhibition of endoplasmic reticulum chaperone GRP78 disconnects the transduction of ER stress signals to inflammation and lipid accumulation in diet-induced obese mice
- School of Chinese Medicine, Li Ka Shing Faculty of Medicine, University of Hong Kong, China
- Department of Pharmacology and Pharmacy, Li Ka Shing Faculty of Medicine, University of Hong Kong, China
- Colleage of Chemistry and Pharmacy, College of Chemistry & Pharmacy, Northwest A&F University, China
Figures
Figure 1
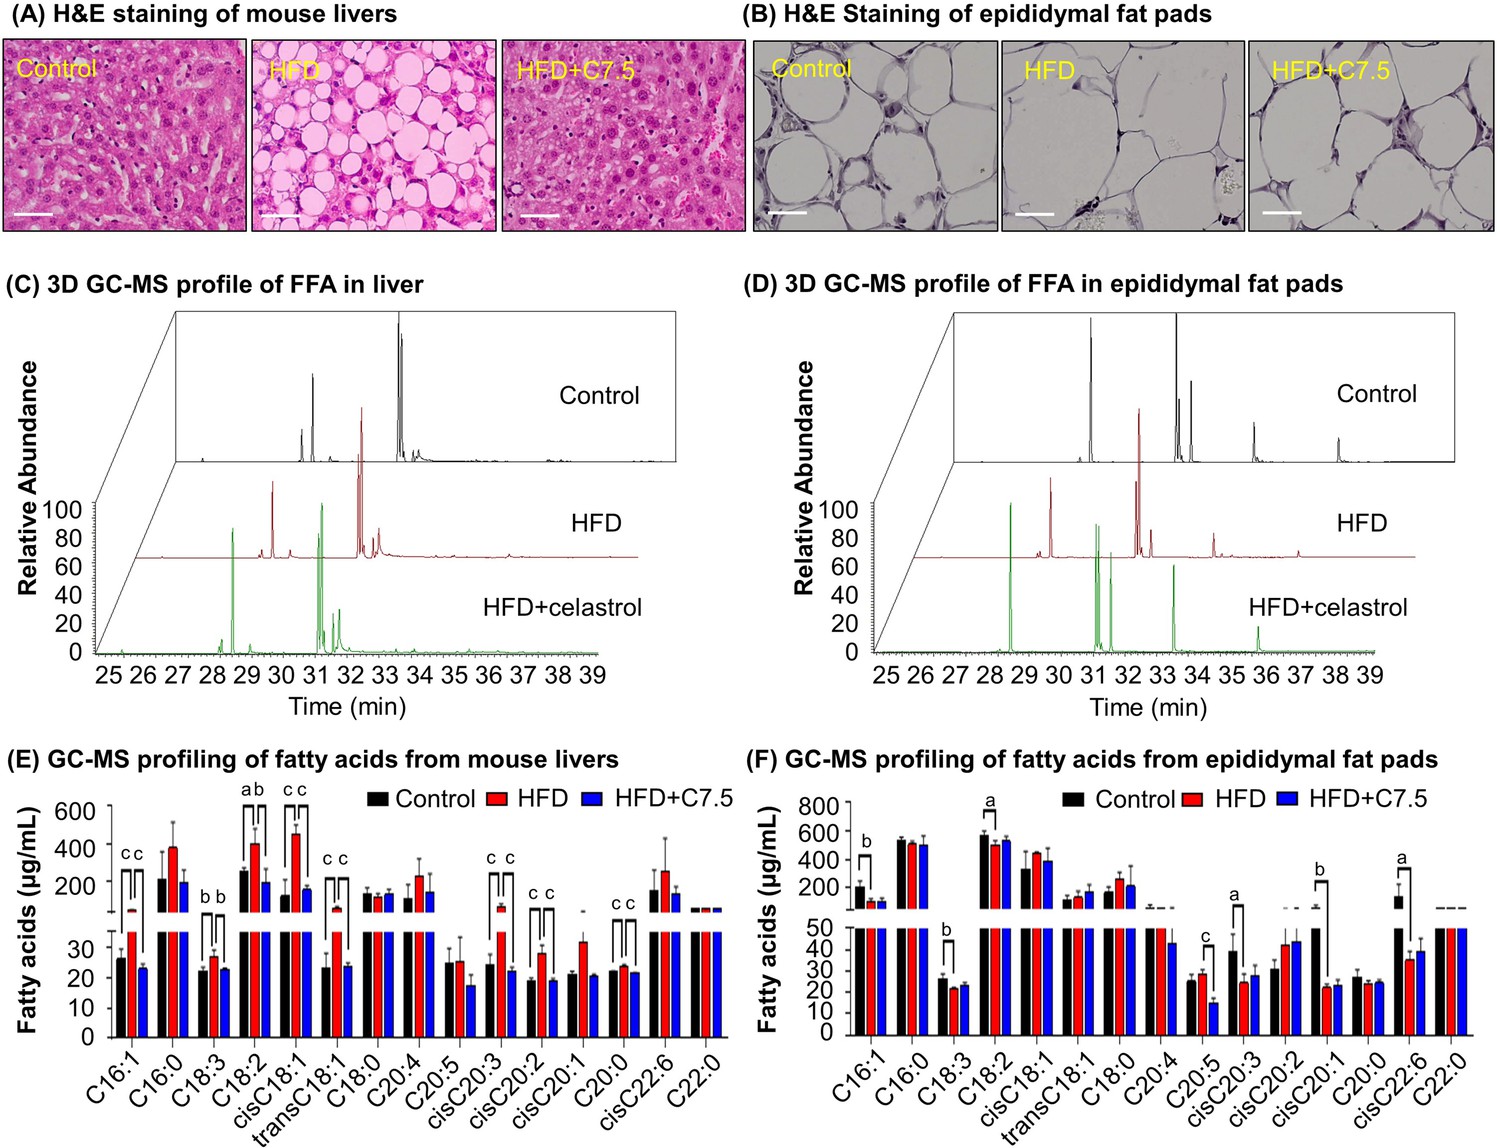
Celastrol ameliorates adipose hypertrophy and lipid metabolism.
(A, B) Hematoxylin and eosin (H&E) staining of mouse hepatic tissues and epididymal fat pads. After 21-day treatment with vehicle or celastrol, the livers and epididymal fat pads were recovered from four groups of C57/BL6 mice (i.e., Control, HFD, HFD + C5, HFD + C7.5) and stained with H&E stain. Representative images were shown. Scale bar represented 34 μm in length. (C, D) 3D gas chromatography–mass spectrometry (GC–MS) chromatograms of free fatty acids from murine livers and epididymal fat pads. After 21-day treatment with vehicle or celastrol, livers and epididymal fat pads were recovered from four groups of C57/BL6 mice (i.e., Control, HFD, HFD + C5, HFD + C7.5) for fatty acids extraction and GC–MS profiling. (E, F) GC–MS profiling of fatty acids from murine livers and epididymal fat pads. Free and conjugated fatty acids were profiled by GC–MS. Total amounts of individual fatty acids were quantified. The results were presented as mean ± standard deviation (SD) of three independent experiments. a, p < 0.05; b, p < 0.01; c, p < 0.001.
-
Figure 1—source data 1
Data for Figure 1A–D.
- https://cdn.elifesciences.org/articles/72182/elife-72182-fig1-data1-v1.zip
-
Figure 1—source data 2
Data for Figure 1E, F.
- https://cdn.elifesciences.org/articles/72182/elife-72182-fig1-data2-v1.xlsx
Figure 2
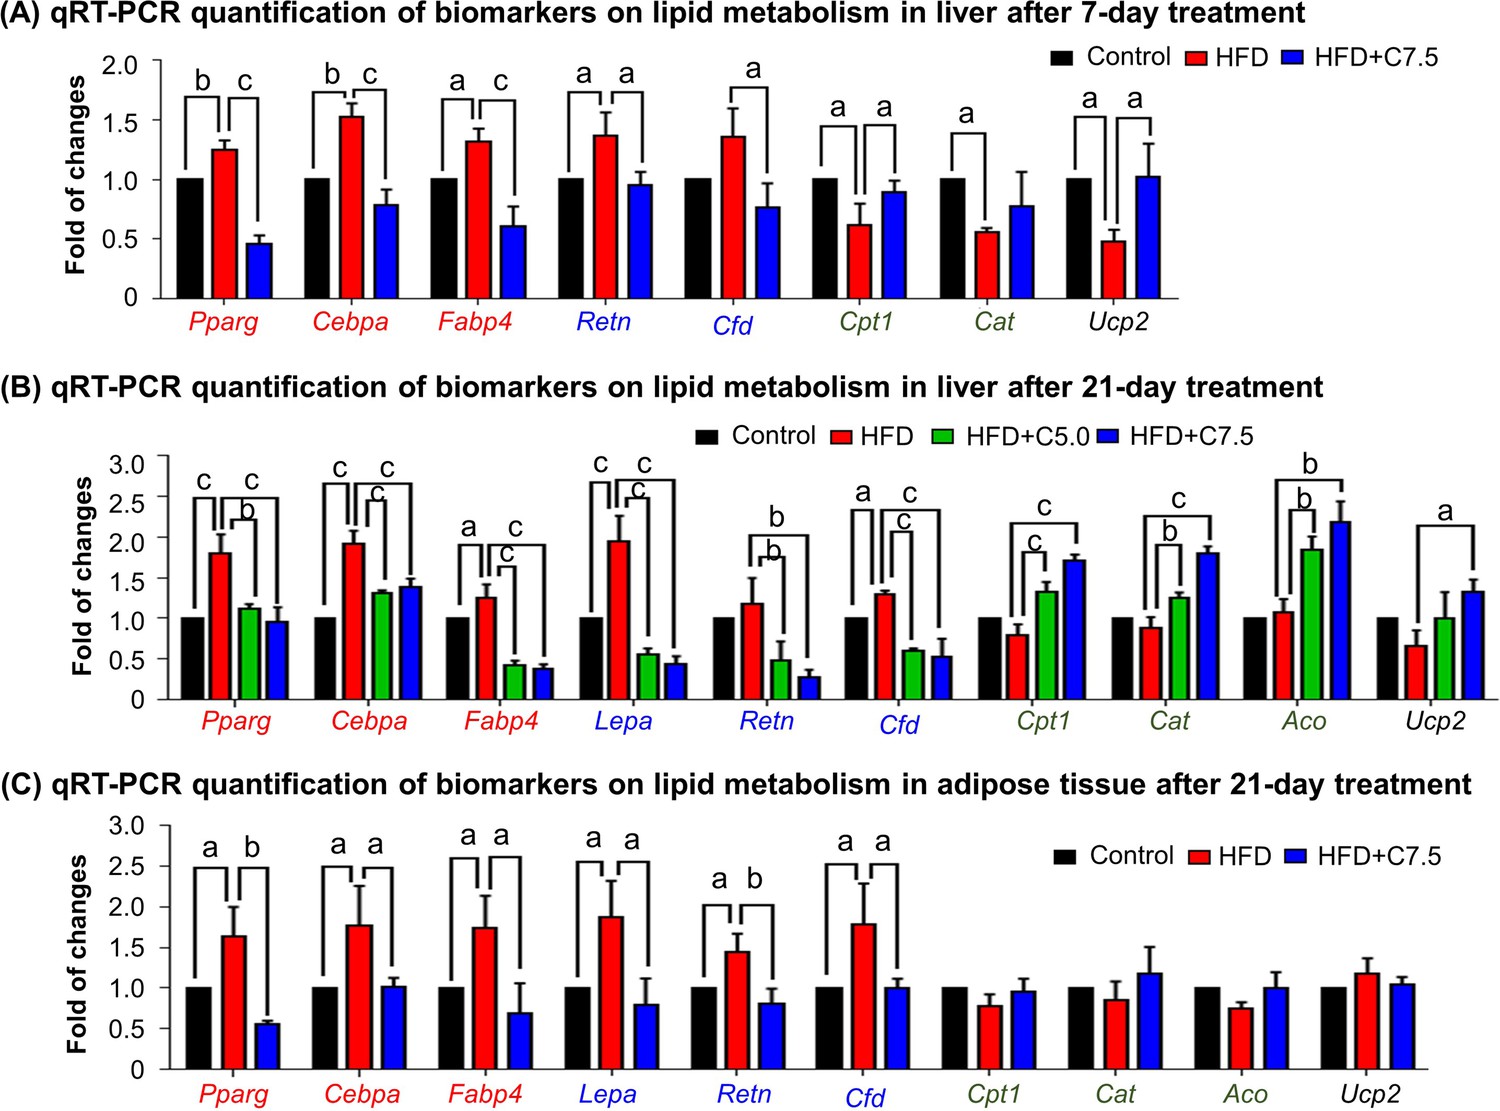
Celastrol restores the expression of the biomarkers in lipid metabolism in livers and epididymal adipose tissues.
(A) One-week effects of celastrol on the biomarkers of lipid metabolism in liver tissues. After 7-day treatment, total RNAs were extracted from livers and analyzed by quantitative real-time PCR (qRT-PCR) technique using Qiagen QuantiTect SYBR Green PCR Kit and specific DNA primers. N = 3. (B) Three-week effects of celastrol on the biomarkers in lipid metabolism in liver tissues. After 21-day treatment, total RNAs were extracted from livers and analyzed by qRT-PCR technique using Qiagen QuantiTect SYBR Green PCR Kit and specific DNA primers. N = 3. (C) Three-week effects of celastrol the biomarkers in lipid metabolism in epididymal adipose tissues. After 21-day treatment, total RNAs were extracted from epididymal adipose tissues and analyzed by qRT-PCR technique using Qiagen QuantiTect SYBR Green PCR Kit and specific DNA primers. N = 3. HFD, HFD only; C5.0, celastrol (5 mg kg−1 d−1); C7.5, celastrol (7.5 mg kg−1 d−1); a, p < 0.05; b, p < 0.01; c, p < 0.001.
-
Figure 2—source data 1
Data for Figure 2A–C.
- https://cdn.elifesciences.org/articles/72182/elife-72182-fig2-data1-v1.xlsx
Figure 3
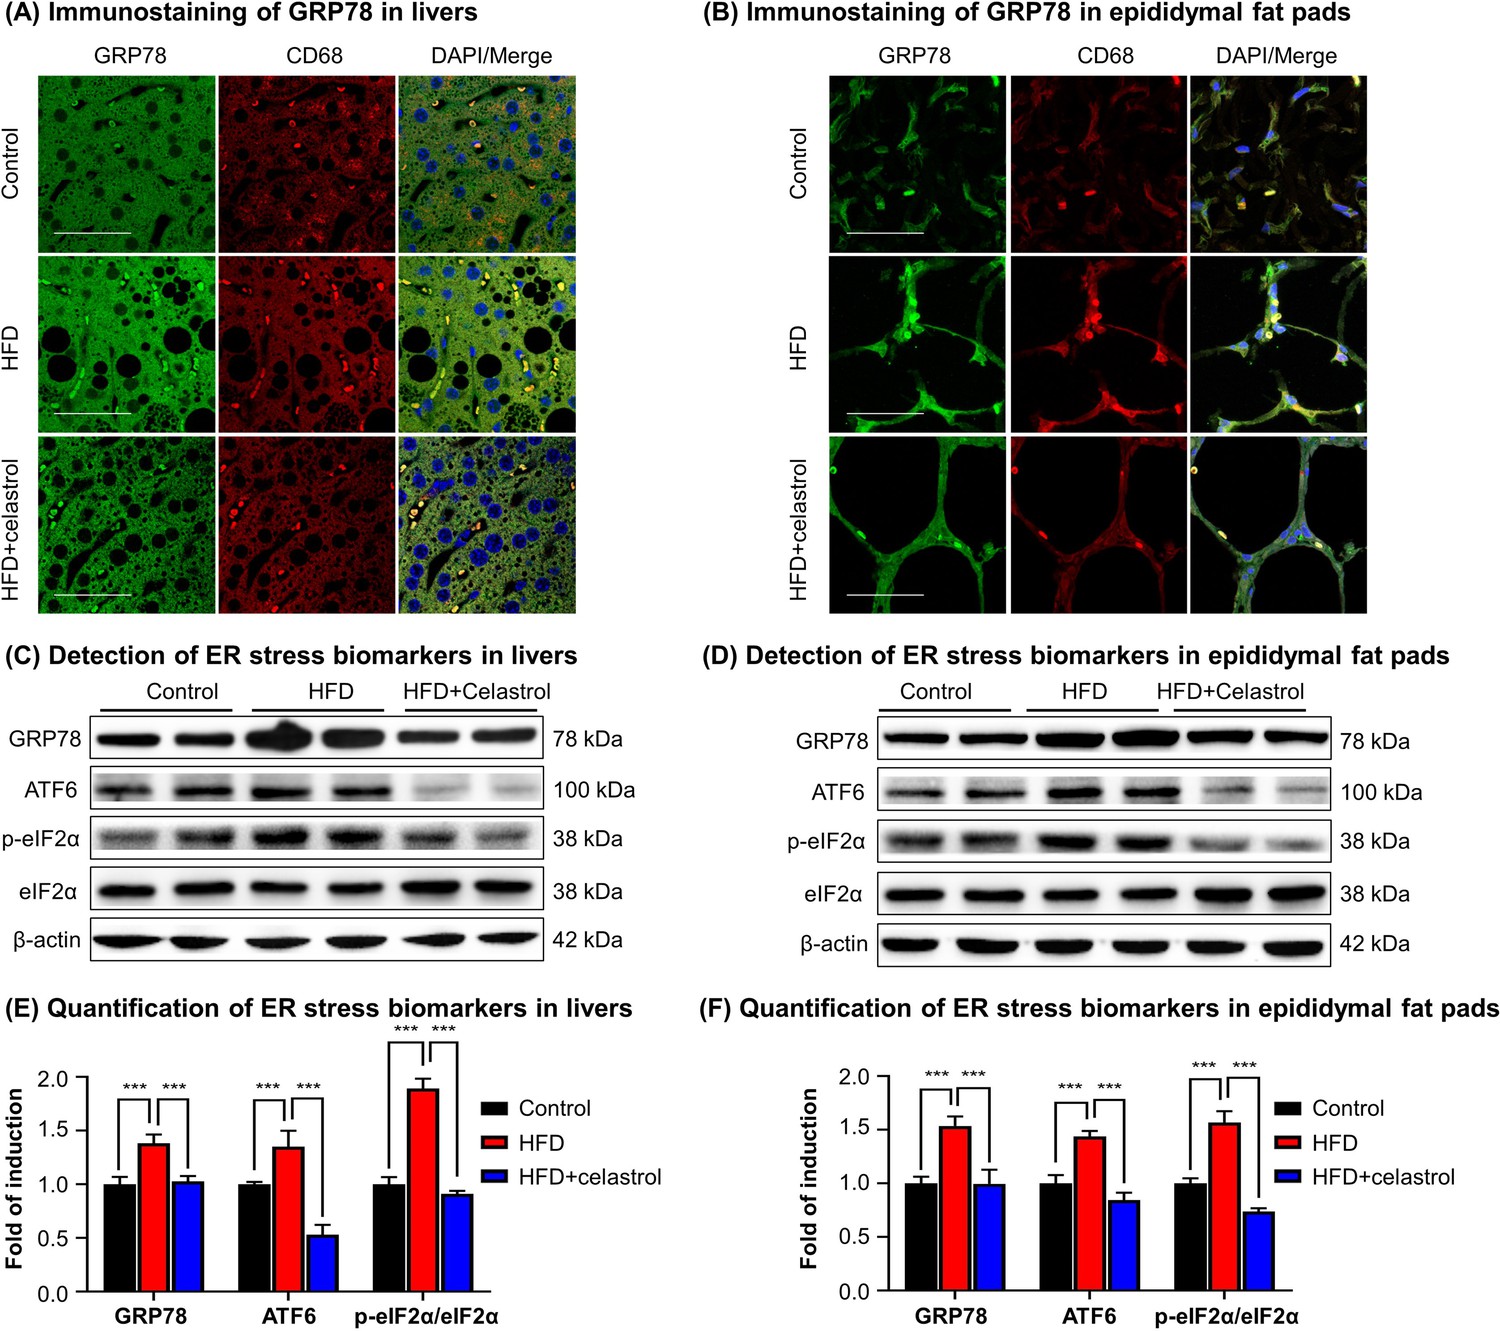
Celastrol suppresses endoplasmic reticulum (ER) stress signaling in livers and epididymal adipose tissues.
(A) Immunostaining of GRP78 in livers. After 21-day treatment, mouse livers were recovered and stained with antibodies against GRP78 and CD68, whereas 2-(4-Amidinophenyl)-6-indolecarbamidine dihydrochloride (DAPI) was used to stain cell nuclei. The sections were imaged under a Zeiss LSM 780 confocal microscope. Representative images were shown. Scale bar, 50 μm. (B) Immunosatining of GRP78 in epididymal adipose tissues. After 21-day treatment, mouse epididymal fat pads were recovered and stained with antibodies against GRP78 and CD68, whereas DAPI was used to stain cell nuclei. The sections were imaged under a Zeiss LSM 780 confocal microscope. Representative images were shown. Scale bar, 50 μm. (C) Detection of ER stress biomarkers in livers. After 21-day treatment, mouse livers were recovered and analyzed for the expression of ER stress biomarkers by Western blot analysis. Representative blots were shown. (D) Detection of ER stress biomarkers in epididymal fat pads. After 21-day treatment, epididymal fat pads were recovered and analyzed for the expression of ER stress biomarkers by Western blot analysis. Representative blots were shown. (E) Quantification of ER stress biomarkers in livers. The blots (n = 4) for ER stress biomarkers in livers were quantified by a densitometric method. (F) Quantification of ER stress biomarkers in epididymal fat pads. The blots (n = 4) for ER stress biomarkers in epididymal fat pads were quantified by a densitometric method. ***p < 0.001.
-
Figure 3—source data 1
Data for Figure 3A.
- https://cdn.elifesciences.org/articles/72182/elife-72182-fig3-data1-v1.zip
-
Figure 3—source data 2
Data for Figure 3B.
- https://cdn.elifesciences.org/articles/72182/elife-72182-fig3-data2-v1.zip
-
Figure 3—source data 3
Data for Figure 3C, D.
- https://cdn.elifesciences.org/articles/72182/elife-72182-fig3-data3-v1.zip
Figure 4
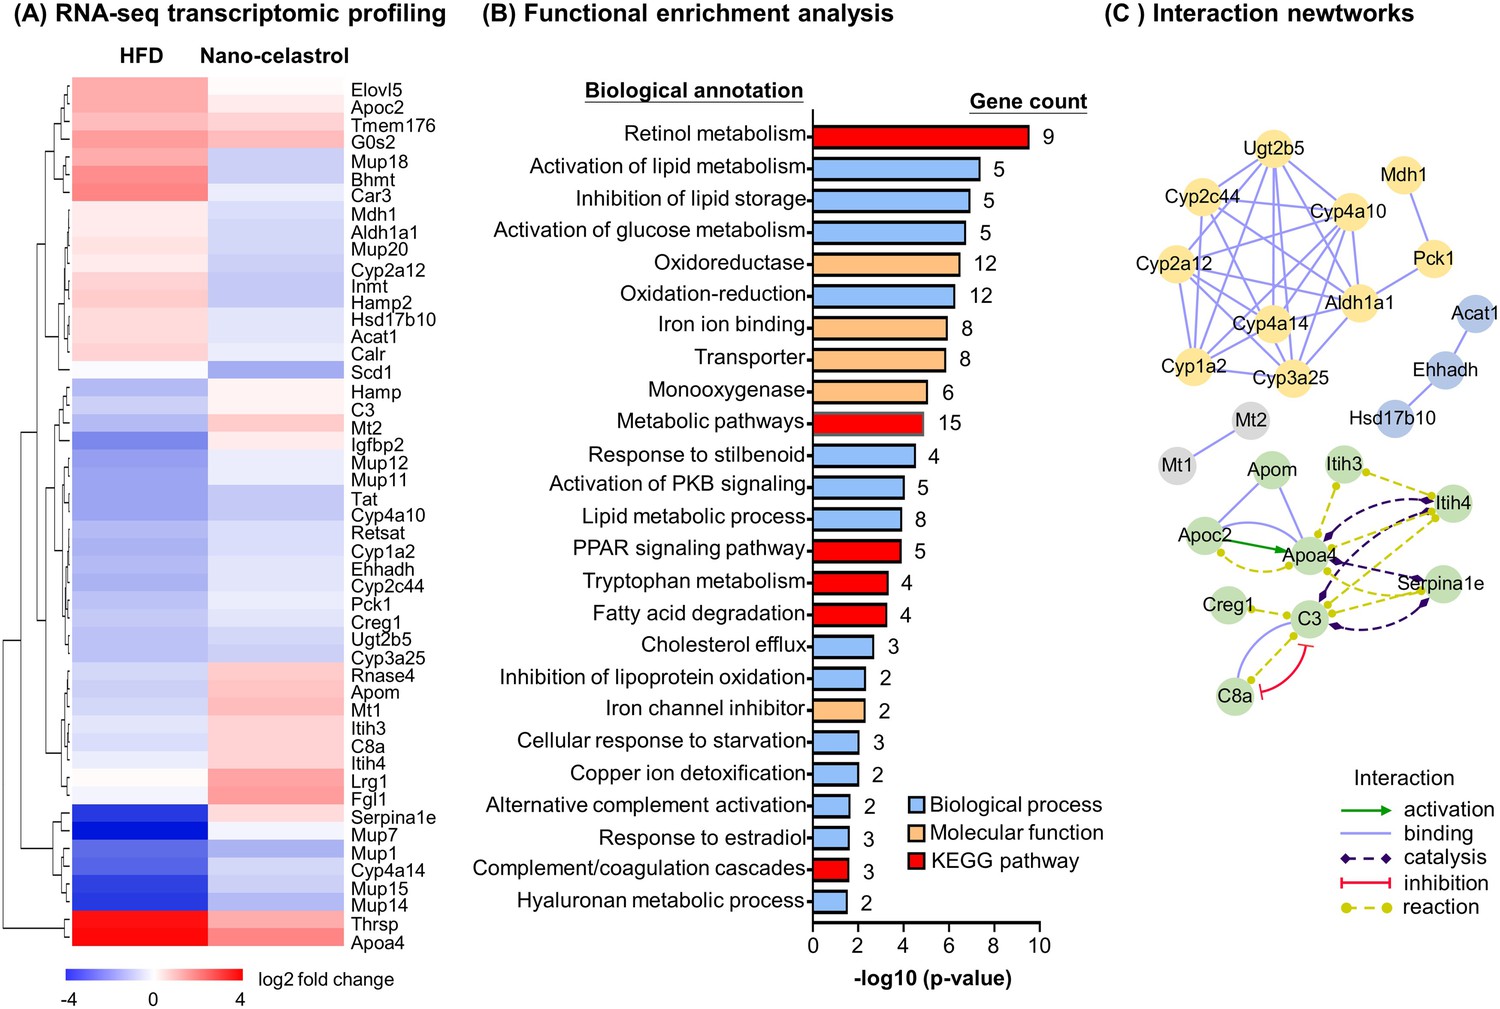
RNA-seq transcriptome profiling of celastrol-regulated genes.
(A) Hierarchical cluster analysis of celastrol-regulated differentially expressed genes (DEGs) in high-fat diet (HFD)-induced obese mice. Expression values are determined by next-generation RNA-seq technology on Illumina HiSeq2500 platform (https://www.genomics.cn/). Data were presented as the expression values (log2 fold change) of the genes in HFD group and HFD + Nano-celastrol group relative to that in Control group. Increases in log2 fold of change are indicated in red hues while decreases are in blue hues. (B) Functional enrichment analysis of celastrol-regulated DEGs. Celastrol-regulated DEGs were classified into different functional groups in terms of molecular function, biological process, and Kyoto Encyclopedia of Genes and Genomes (KEGG) pathway using online DAVID v6.8. The number of genes related to each term was shown next to the bar. (C) Protein–protein interaction networks of the DEGs. Protein–protein interactions were analyzed by online STRING tool. The interaction networks involving DEGs were represented in different colors and lines using Cytoscape.
-
Figure 4—source data 1
Data for Figure 4A–C.
- https://cdn.elifesciences.org/articles/72182/elife-72182-fig4-data1-v1.zip
-
Figure 4—source data 2
Differentially expressed genes list for comparison.
- https://cdn.elifesciences.org/articles/72182/elife-72182-fig4-data2-v1.zip
Figure 5
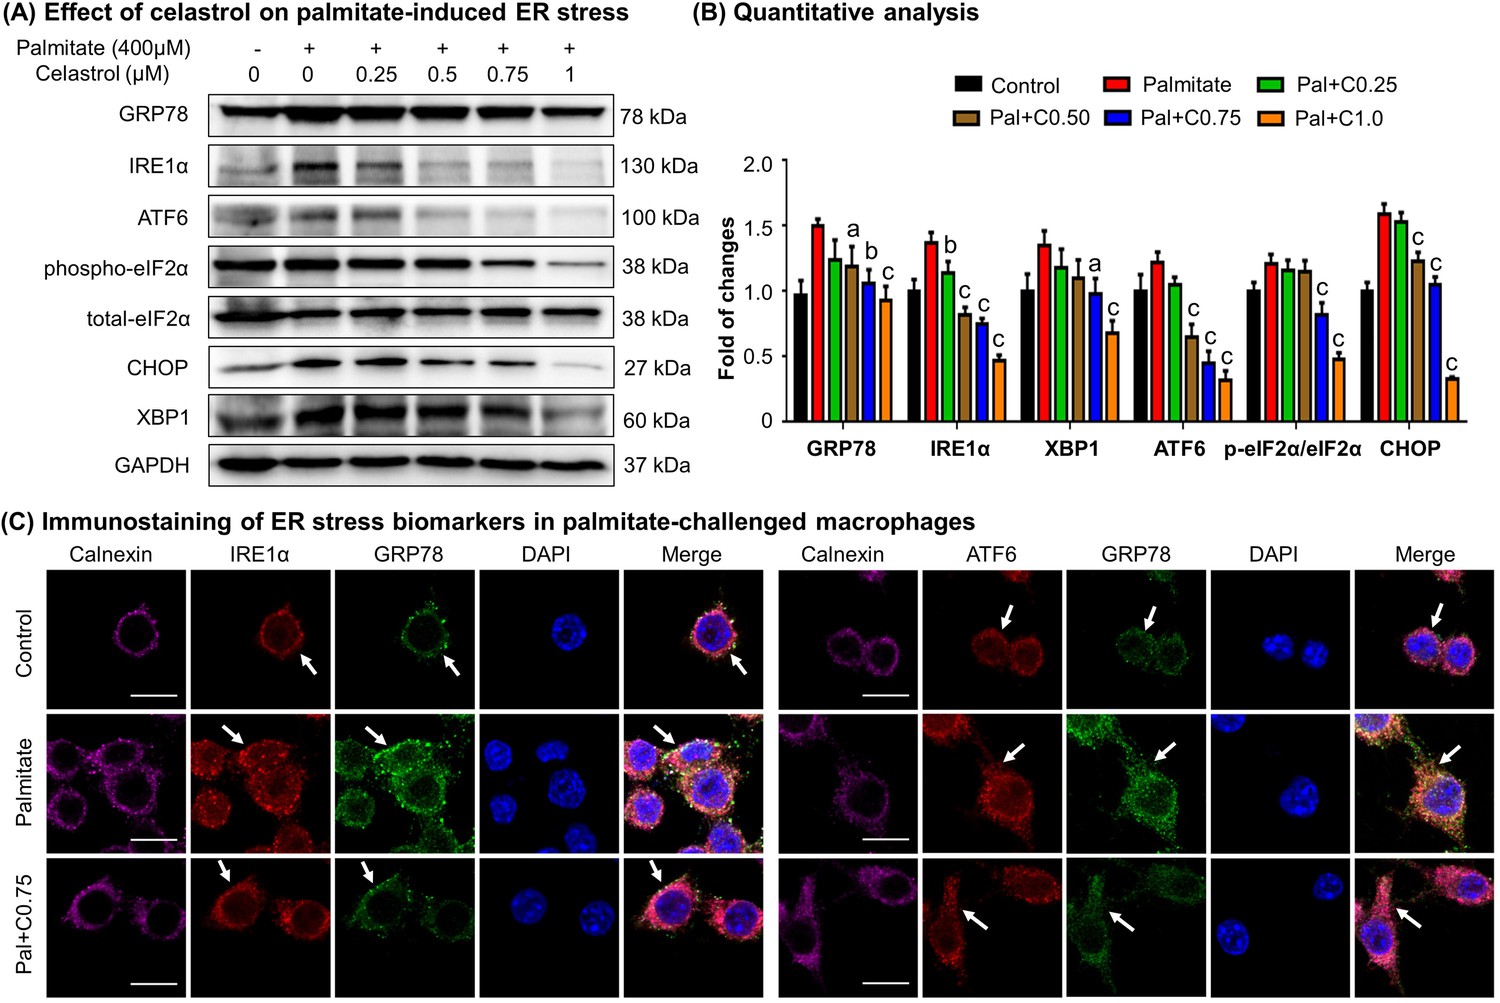
Celastrol attenuates palmitate-induced endoplasmic reticulum (ER) stress in RAW264.7 macrophages.
(A) Western blot analysis for the effects of celastrol on the ER stress biomarkers in palmitate-challenged RAW264.7 cells. RAW264.7 cells were treated with celastrol for 8 hr and subsequently with palmitate for another 16 hr. The cellular proteins were analyzed by Western blotting with specific antibodies. Representative blots were shown. (B) Quantitative analysis for the expression levels of ER stress biomarkers. The blots (n = 3) were quantified by a densitometric method. C0.25, celastrol (0.25 μM); C0.5, celastrol (0.5 μM); C0.75, celastrol (0.75 μM); C1.0, celastrol (1 μM); a, p < 0.05; b, p < 0.01; c, p < 0.001. (C) Colocalization of GRP78, IRE1α, and ATF6 in palmitate-challenged RAW264.7 cells. After the pretreatment with celastrol for 8 hr and subsequently with palmitate for another 16 hr, the cells were stained with antibodies against GRP78, IRE1α, ATF6, and calnexin, whereas DAPI was used to stain the cell nuclei. The cells were imaged under a Zeiss LSM 780 confocal microscope. Representative images were shown. C0.75, celastrol (0.75 μM); palmitate (400 μM). Scale bar, 10 μm.
-
Figure 5—source data 1
Original immunoblots.
- https://cdn.elifesciences.org/articles/72182/elife-72182-fig5-data1-v1.zip
-
Figure 5—source data 2
Data for Figure 5B.
- https://cdn.elifesciences.org/articles/72182/elife-72182-fig5-data2-v1.xlsx
Figure 6
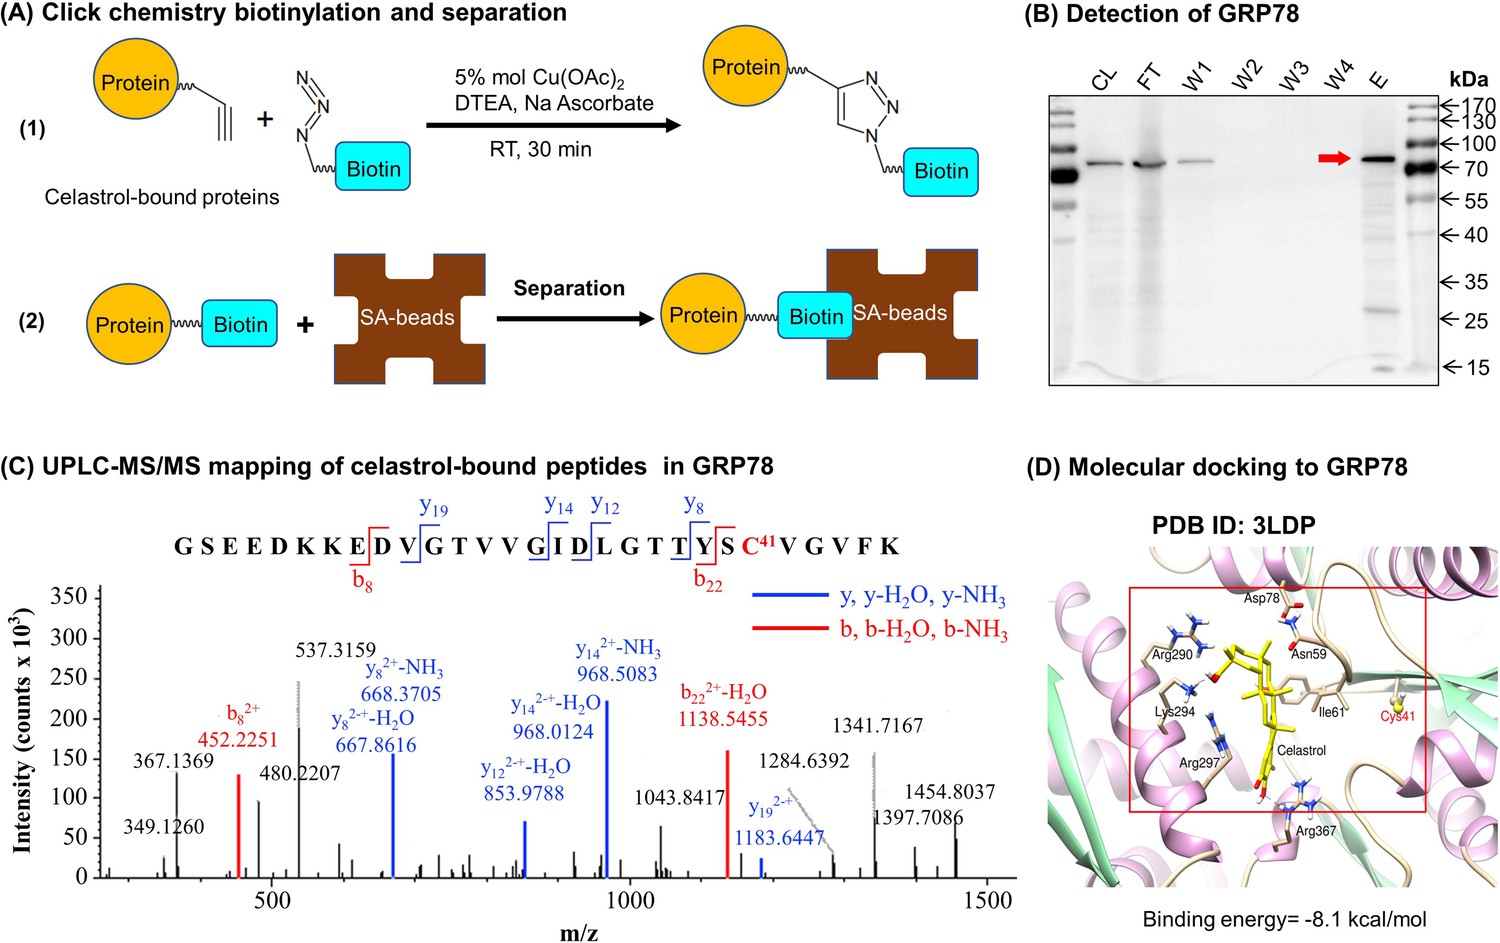
Celastrol forms covalent conjugate with endoplasmic reticulum (ER) chaperone GRP78.
(A) Click chemistry biotinylation and affinity isolation of celastrol-bound proteins. Following 24-hr treatment with celastrol-PEG4-alkyne, the cellular proteins were isolated from RAW264.7 cells and biotinylated with Azide-PEG3-Biotin under Click chemistry conditions. The biotinylated proteins were purified by binding to streptavidin-coated magnetic beads. (B) Western blot verification of celastrol-bound proteins. After Click chemistry biotinylation and affinity isolation, celastrol-bound proteins were resolved by 10% sodium dodecyl sulfate–polyacrylamide gel electrophoresis (SDS–PAGE) and visualized by immunoblotting with anti-GRP78 antibody. CL: cell lysate; FT: flow-through; W1: first wash; W2: second wash; W3: third wash; W4: fourth wash; E: elution. (C) Mapping of celastrol-binding site in GRP78. Recombinant mouse GRP78 was prepared from DE3 E. coli cells and incubated with celastrol in 50 mM sodium bicarbonate (NaHCO3) buffer containing 10% DMSO. After resolution by Clear-Native-PAGE and Coomassie blue staining, celastrol–GRP78 conjugate was digested with trypsin and analyzed by LC/MS/MS technology. (D) Molecular simulation of celastrol–GRP78 interactions. Celastrol was docked into the crystal structure of GRP78 (PDB ID: 3LDP) using Autodock vina in PyRx 0.8 (http://pyrx.sourceforge.net/downloads).
-
Figure 6—source data 1
Original immunoblots and figure with the uncropped blots with the relevant bands labeled.
- https://cdn.elifesciences.org/articles/72182/elife-72182-fig6-data1-v1.zip
-
Figure 6—source data 2
Data for Figure 6C.
- https://cdn.elifesciences.org/articles/72182/elife-72182-fig6-data2-v1.xlsx
Figure 7
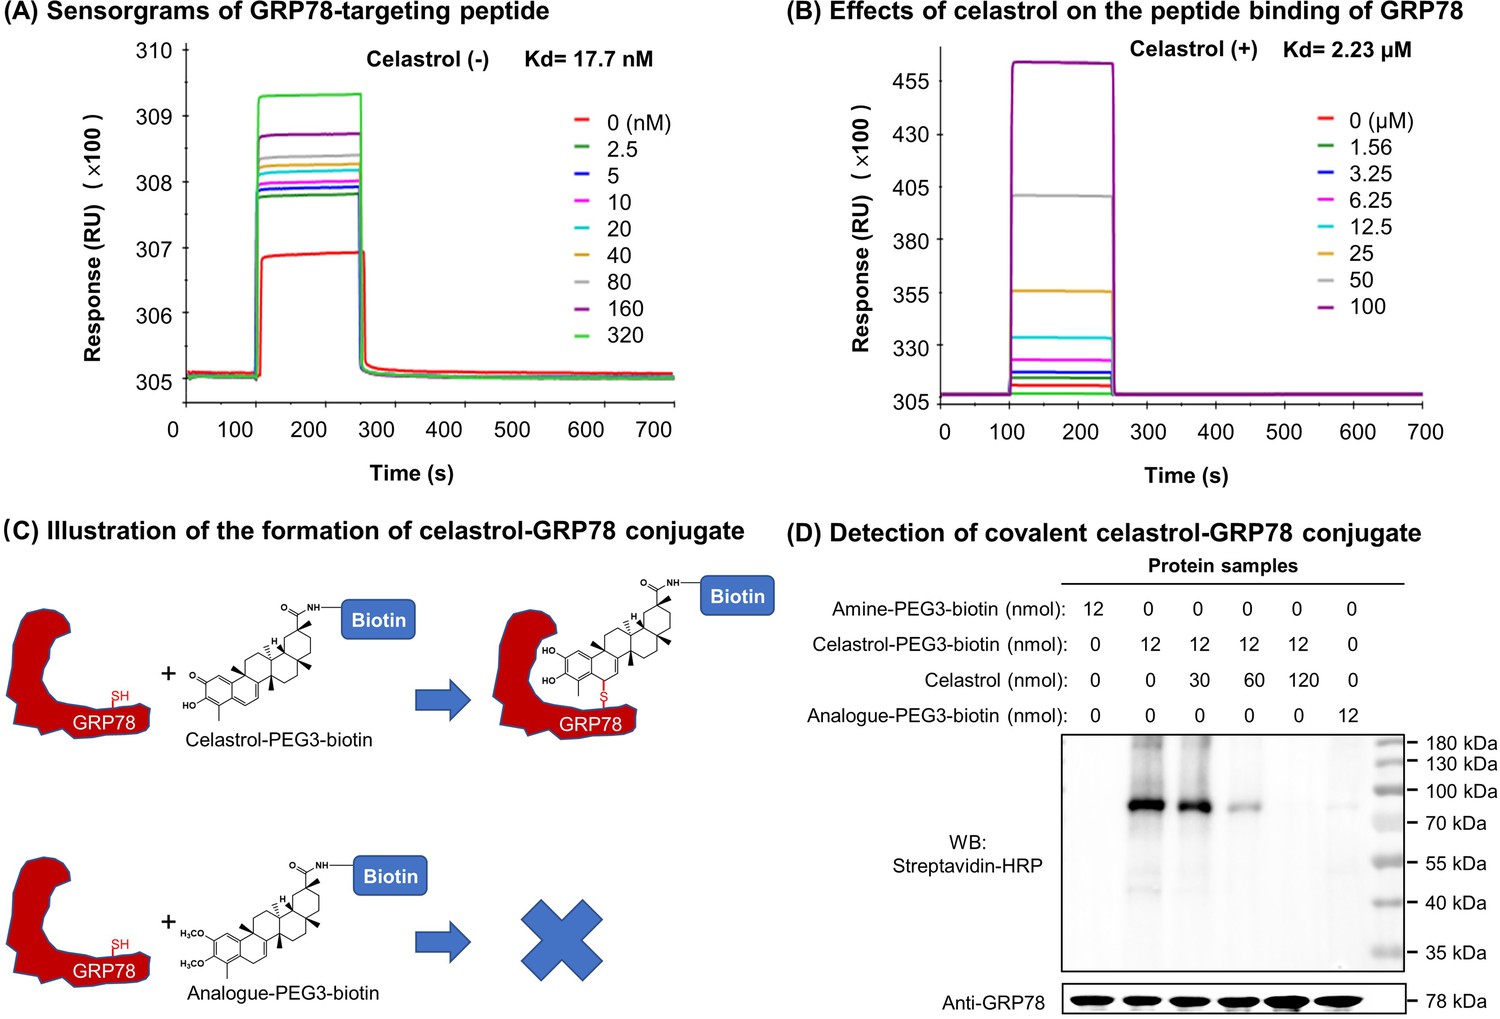
Covalent binding of celastrol attenuated the chaperone activity of GRP78 toward peptide.
(A) Validation of peptide binding to GRP78. After the immobilization of biotinylated GRP78 to the streptavidin-coated Sensor Chip SA, GRP78-targeting peptide (WDLAWMFRLPVG) was pumped into the Biacore X100 SPR system for evaluating the peptide binding to GRP78 under steady-state condition. After four runs, the average Kd value was calculated by Biacore X100 Evaluation Software. Representative sensorgram was shown. (B) Effects of celastrol on peptide binding to GRP78. After the saturation with 10 μM celastrol, GRP78-targeting peptide (WDLAWMFRLPVG) (n = 4) was pumped into the Biacore X100 SPR system for calculating the average Kd value for peptide binding to GRP78. Representative sensorgram was shown. (C) Scheme illustrating the formation of covalent celastrol–GRP78 conjugate. The cysteine of GRP78 reacts with quinone methide moiety of celastrol whereas the analog lacking quinone methide structure fails to form covalent conjugate with GRP78. (D) Detection of covalent celastrol–GRP78 conjugate. Following the incubation of recombinant GRP78 with celastrol-PEG3-biotin or analog-PEG3-biotin, the reaction mixtures were analyzed by Western blotting with streptavidin–HRP or anti-GRP78 antibody.
-
Figure 7—source data 1
Data for Figure 7A, B.
- https://cdn.elifesciences.org/articles/72182/elife-72182-fig7-data1-v1.xlsx
-
Figure 7—source data 2
Original immunoblots and figure with the uncropped blots with the relevant bands labelled.
- https://cdn.elifesciences.org/articles/72182/elife-72182-fig7-data2-v1.zip
-
Figure 7—source data 3
Data for the structures, HRMS spectrum, 1H NMR spectrum, and 13C NMR spectrum of celastrol analog.
- https://cdn.elifesciences.org/articles/72182/elife-72182-fig7-data3-v1.pptx
-
Figure 7—source data 4
Synthesis route of celastrol analog and data for the structures, HRMS spectrum, 1H NMR spectrum, and 13C NMR spectrum of intermediates.
- https://cdn.elifesciences.org/articles/72182/elife-72182-fig7-data4-v1.pptx
-
Figure 7—source data 5
Data for the structures, HRMS spectrum, 1H NMR spectrum, and 13C NMR spectrum of celastrol-PEG3-biotin.
- https://cdn.elifesciences.org/articles/72182/elife-72182-fig7-data5-v1.pptx
-
Figure 7—source data 6
Data for the structures, HRMS spectrum, 1H NMR spectrum, and 13C NMR spectrum of analog-PEG3-biotin.
- https://cdn.elifesciences.org/articles/72182/elife-72182-fig7-data6-v1.pptx
Figure 8
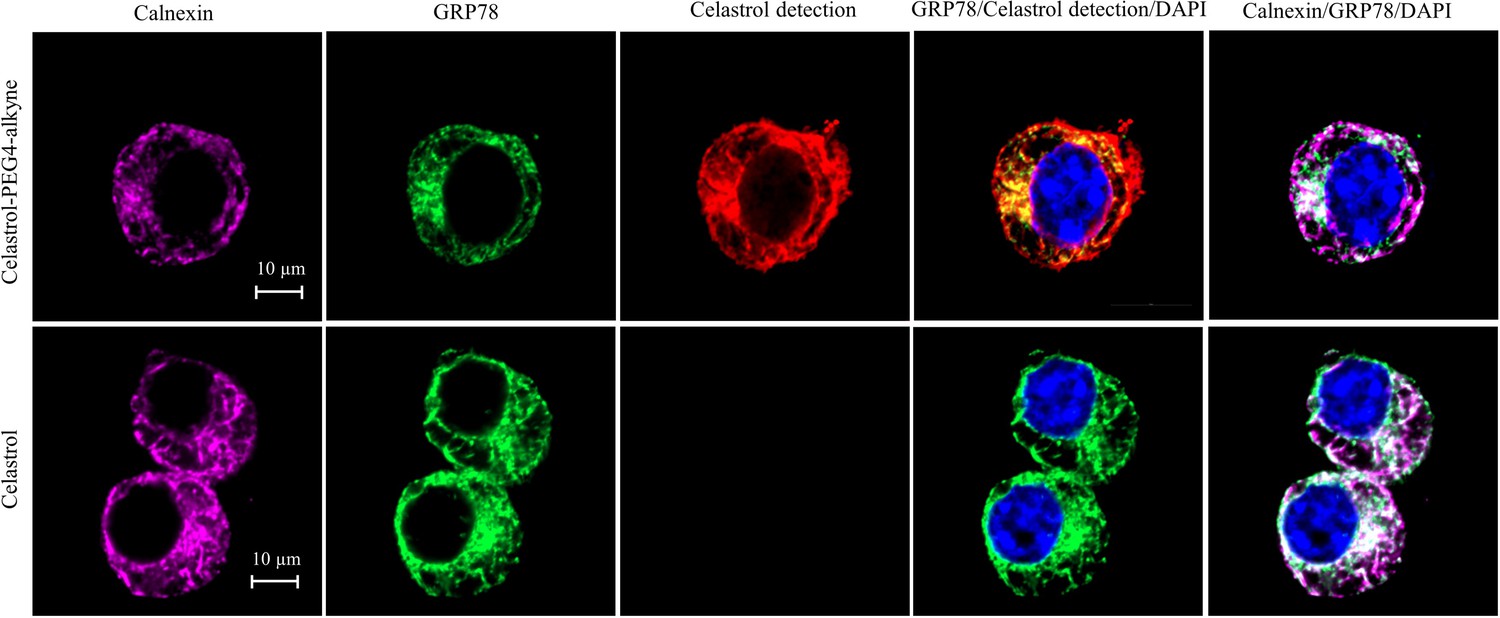
Intracellular colocalization of celastrol labeling and GRP78.
Following the challenge with palmitate, RAW264.7 cells were treated with celastrol or celastrol-PEG4-alkyne, washed, fixed, reacted with fluorescence dye AFDye555-picolyl azide. The cells were immunostained with antibodies against GRP78 and calnexin, fluorescent secondary antibodies whereas DAPI was used to stain the cell nuclei. The cells were imaged under a Zeiss LSM 780 confocal microscope. Representative images were shown. Scale bar, 10 μm.
-
Figure 8—source data 1
Original immunofluorescence staining result of RAW264.7 cells treated with celastrol-PEG4-alkyne.
- https://cdn.elifesciences.org/articles/72182/elife-72182-fig8-data1-v1.zip
-
Figure 8—source data 2
Original immunofluorescence staining result of RAW264.7 cells treated with celastrol.
- https://cdn.elifesciences.org/articles/72182/elife-72182-fig8-data2-v1.zip
-
Figure 8—source data 3
Data for the structures, HRMS spectrum, 1H NMR spectrum, and 13C NMR spectrum of celastrol-PEG4-alkyne.
- https://cdn.elifesciences.org/articles/72182/elife-72182-fig8-data3-v1.pptx
Figure 9
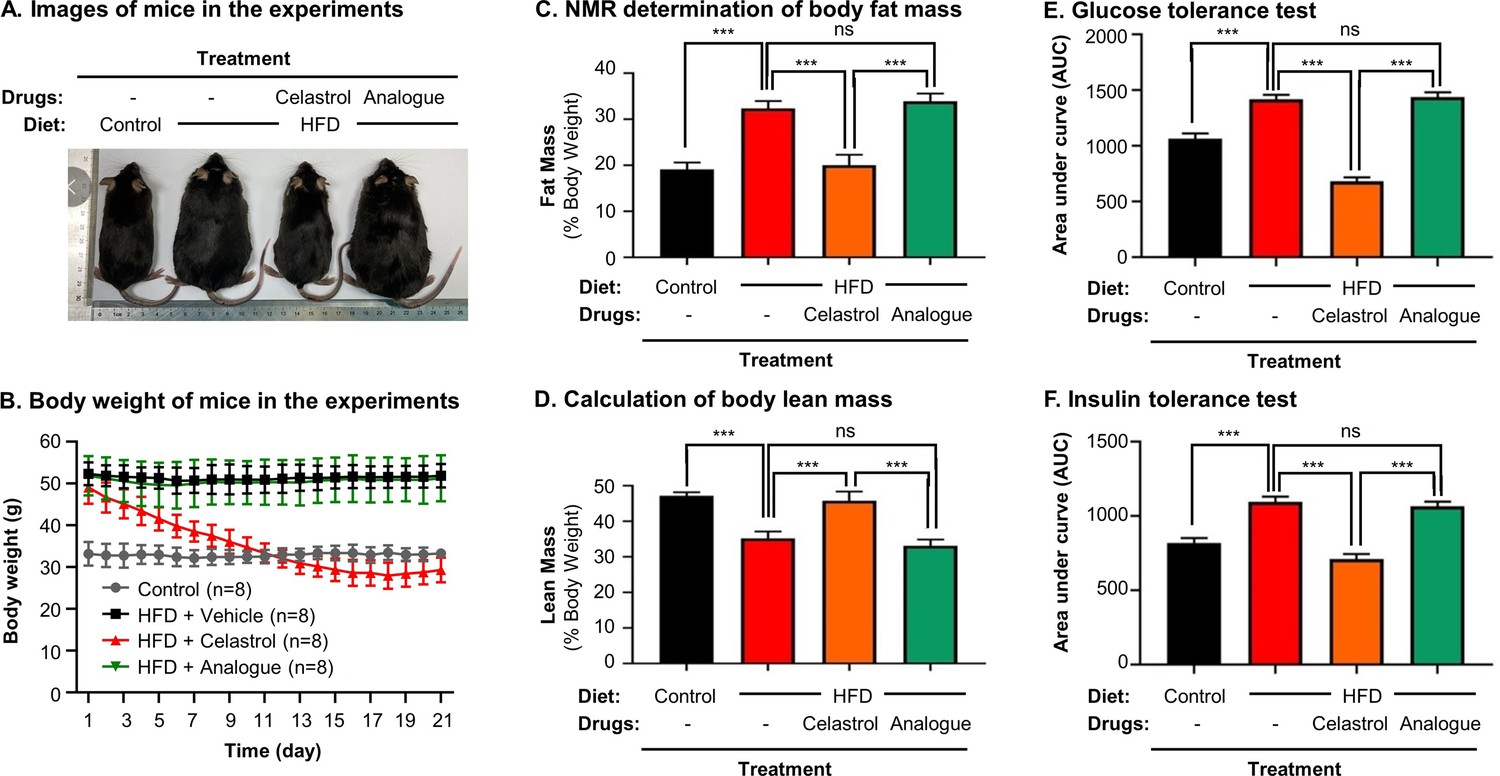
Quinone methide is essential to induce weight loss, reduce fat mass, and restore glucose tolerance and insulin tolerance in diet-induced obese C57BL/6N mice.
(A) Images of experimental mice. Diet-induced obese mice were treated with celastrol or analog at the dose of 5.0 mg kg−1 d−1 for 21 days, whereas control mice were fed with normal diet. Experimental mice were imaged at day 21. (B) Measurement of body weight. Body weight was daily measured (n = 8). (C) NMR determination of fat contents. After 21-day treatment, fat contents in living mice were analyzed by Bruker minispec NMR analyzer. (D) Calculation of body lean mass. Lean mass was calculated from NMR determination of body fat mass as described in (C). Body weight was daily measured. (E) Glucose tolerance test (GTT). After glucose injection, blood glucose levels were measured and plotted against time. The area under curve (AUC) for each group was calculated. (F) Insulin tolerance test (ITT). After insulin injection, blood glucose levels were measured and plotted against time. The AUC for each group was calculated. ***p < 0.001; ns, not significant.
-
Figure 9—source data 1
Data for Figure 9B–F.
- https://cdn.elifesciences.org/articles/72182/elife-72182-fig9-data1-v1.xlsx
Figure 10
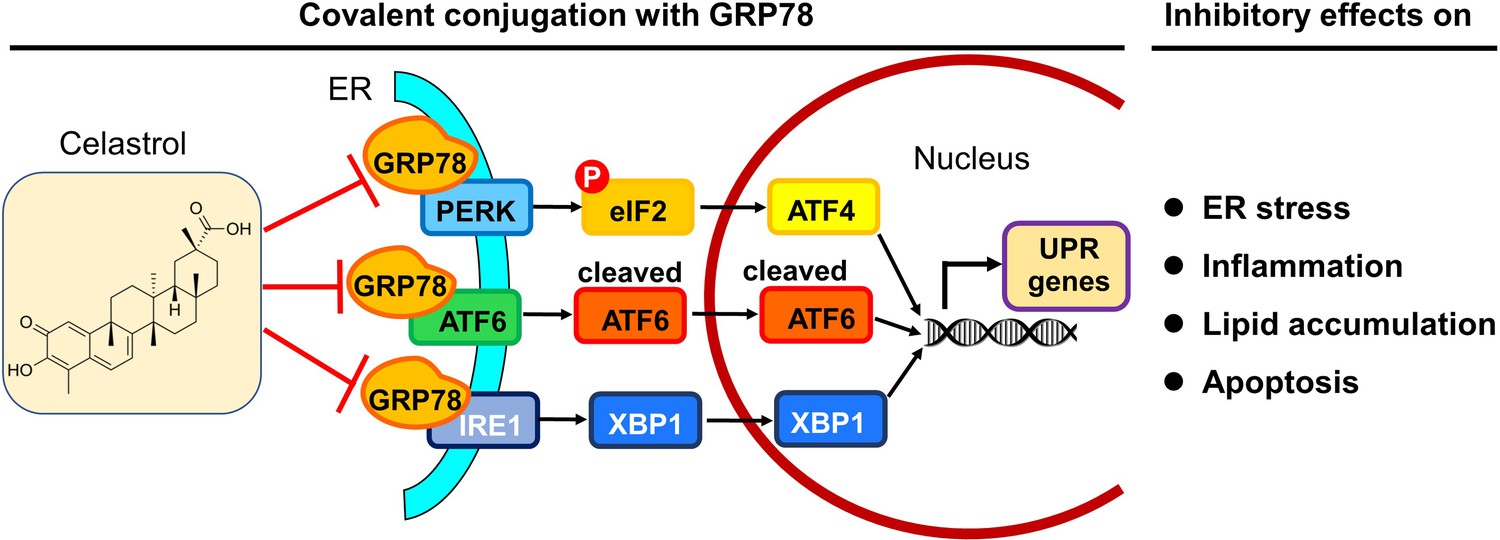
Potential mechanisms underlying the activities of celastrol against endoplasmic reticulum (ER) stress, inflammation, and lipid accumulations.
The in vitro and in vivo results from the present study suggest that celastrol covalently inhibits the chaperone activity of GRP78 and disconnects the transduction of ER stress signals to downstream inflammatory response and lipid metabolism toward rapid weight loss.
Author response image 1

Author response image 2
Author response image 3
Tables
Key resources table
| Reagent type (species) or resource | Designation | Source or reference | Identifiers | Additional information |
|---|---|---|---|---|
| Antibody | Anti-GRP78 (rabbit polyclonal) | Abcam | Cat. #: ab21685 | WB (1:1000)IF (1:500) |
| Antibody | Anti-IRE1α (rabbit monoclonal) | Cell Signaling Technology | Cat. #: 3294 | WB (1:1000) |
| Antibody | Anti-XBP1 (rabbit polyclonal) | Abcam | Cat. #: ab37152 | WB (1:1000) |
| Antibody | Anti-Calnexin (goat polyclonal) | Abcam | Cat. #: ab192439 | IF (1:500) |
| Antibody | Anti-ATF-6 (rabbit monoclonal) | Cell Signaling Technology | Cat. #: 65,880 | WB (1:1000) |
| Antibody | Anti-Phospho-eIF2α (rabbit monoclonal) | Cell Signaling Technology | Cat. #: 3398 | WB (1:1000) |
| Antibody | Anti-eIF2α (rabbit monoclonal) | Cell Signaling Technology | Cat. #: 5324 | WB (1:1000) |
| Antibody | Anti-GAPDH (rabbit monoclonal) | Cell Signaling Technology | Cat. #: 2118 | WB (1:1000) |
| Antibody | Anti-β-actin (rabbit polyclonal) | Thermo Fisher Scientific | Cat. #: PA1-183 | WB (1:1000) |
| Antibody | Anti-GRP78 (mouse monoclonal) | Abcam | Cat. #: ab212054 | IF (1:500) |
| Antibody | Anti-CD68 (rabbit polyclonal) | Abcam | Cat. #: ab125212 | IF (1:500) |
| Antibody | Anti-rabbit IgG (H + L) Alexa Fluor 594 (goat polyclonal) | Thermo Fisher Scientific | Cat. #: A-11012 | IF (1:500) |
| Antibody | Anti-mouse IgG (H + L) Alexa Fluor 488 (goat polyclonal) | Thermo Fisher Scientific | Cat. #: A-11001 | IF (1:500) |
| Antibody | Anti-goat IgG H&L Alexa Fluor 647 (donkey polyclonal) | Abcam | Cat. #: ab150131 | IF (1:500) |
| Antibody | Anti-rabbit HRP-conjugated IgG secondary antibody (goat polyclonal) | Sigma-Aldrich | Cat. #: A0545 | WB (1:10,000) |
| Chemical compound, drug | Celastrol | Nanjing Spring and Autumn Biological Engineering Co., Ltd | Purity >98% (HPLC) | |
| Chemical compound, drug | Lipopolysaccharides from Escherichia coli O111:B4 | Sigma-Aldrich | Cat #: L4391 | LPS |
| Chemical compound, drug | Sodium palmitate | Sigma-Aldrich | Cat #: P9767 | |
| Chemical compound, drug | Biotin-PEG3-amine | Hunan Huateng Pharmaceutical Company | Cat#: 11,025 | |
| Chemical compound, drug | Alkyne-PEG4-amine | Hunan Huateng Pharmaceutical Company | Cat#: 10,749 | |
| Cell line (Mus musculus) | RAW264.7 cells | ATCC | TIB-71 | Authenticated (STR profiling) and mycoplasma test (absent) (Genetic Testing Biotechnology Corporation, Suzhou, China) |
| Commercial assay or kit | TRIzol Reagent | Thermo Fisher Scientific | Cat. #: 15596026 | |
| Commercial assay or kit | RevertAid first-strand cDNA synthesis kit | Thermo Fisher Scientific | Cat. #: K1622 | |
| Commercial assay or kit | SYBR Green mix | QIAGEN | Cat. #: 204,056 | |
| Sequence-based reagent | Mm_Cfd_1_SG | QIAGEN | Cat. #: QT00250495 | Cfd |
| Sequence-based reagent | Mm_Fabp4_1_SG | QIAGEN | Cat. #: QT00091532 | Fabp4 |
| Sequence-based reagent | Mm_Cebpa_1_SG | QIAGEN | Cat. #: QT00311731 | Cebpa |
| Sequence-based reagent | Mm_Cpt1a_1_SG | QIAGEN | Cat. #: QT00106820 | Cpt1 |
| Sequence-based reagent | Mm_Lep_1_SG | QIAGEN | Cat. #: QT00164360 | Lepa |
| Sequence-based reagent | Mm_Pparg_1_SG | QIAGEN | Cat. #: QT00100296 | Pparg |
| Sequence-based reagent | Mm_Retn_1_SG | QIAGEN | Cat. #: QT00093450 | Retn |
| Sequence-based reagent | Mm_Ucp2_1_SG | QIAGEN | Cat. #: QT00138943 | Ucp2 |
| Sequence-based reagent | Mm_Crat_1_SG | QIAGEN | Cat. #: QT00111405 | Cat |
| Sequence-based reagent | Mm_Acox1_1_SG | QIAGEN | Cat. #:QT00174342 | Aco |
| Sequence-based reagent | Mm_Gapdh_3_SG | QIAGEN | Cat. #: QT01658692 | Gapdh |
| Strain, strain background (Escherichia coli) | BL21(DE3) | Thermo Fisher Scientific | Cat. #: EC0114 | Competent cells |
| Recombinant DNA reagent | pET-28a | Sigma-Aldrich | Cat. #: 69,864 | |
| Recombinant DNA reagent | pET28a-GRP78 plasmid | This manuscript | See Materials and methods | |
| Software, algorithm | Prism | GraphPad | https://www.graphpad.com/scientific-software/prism/ | |
| Software, algorithm | NIH Image J | NIH | http://imagej.net/ImageJ2 |
Additional files
Download links
A two-part list of links to download the article, or parts of the article, in various formats.
Downloads (link to download the article as PDF)
Open citations (links to open the citations from this article in various online reference manager services)
Cite this article (links to download the citations from this article in formats compatible with various reference manager tools)
Covalent inhibition of endoplasmic reticulum chaperone GRP78 disconnects the transduction of ER stress signals to inflammation and lipid accumulation in diet-induced obese mice
eLife 11:e72182.
https://doi.org/10.7554/eLife.72182


