Atmospheric particulate matter aggravates cns demyelination through involvement of TLR-4/NF-kB signaling and microglial activation
- Key Laboratory of Medicinal Resources and Natural Pharmaceutical Chemistry, The Ministry of Education; National Engineering Laboratory for Resource Development of Endangered Crude Drugs in Northwest China; College of Life Sciences, Shaanxi Normal University, China
- School of Geography and Tourism, Shaanxi Normal University, China
- Department of Neurology, the First Affiliated Hospital of Zhengzhou University, China
- Department of Neurology, Renji Hospital, Shanghai Jiaotong University School of Medicine, China
Figures
Figure 1 with 1 supplement
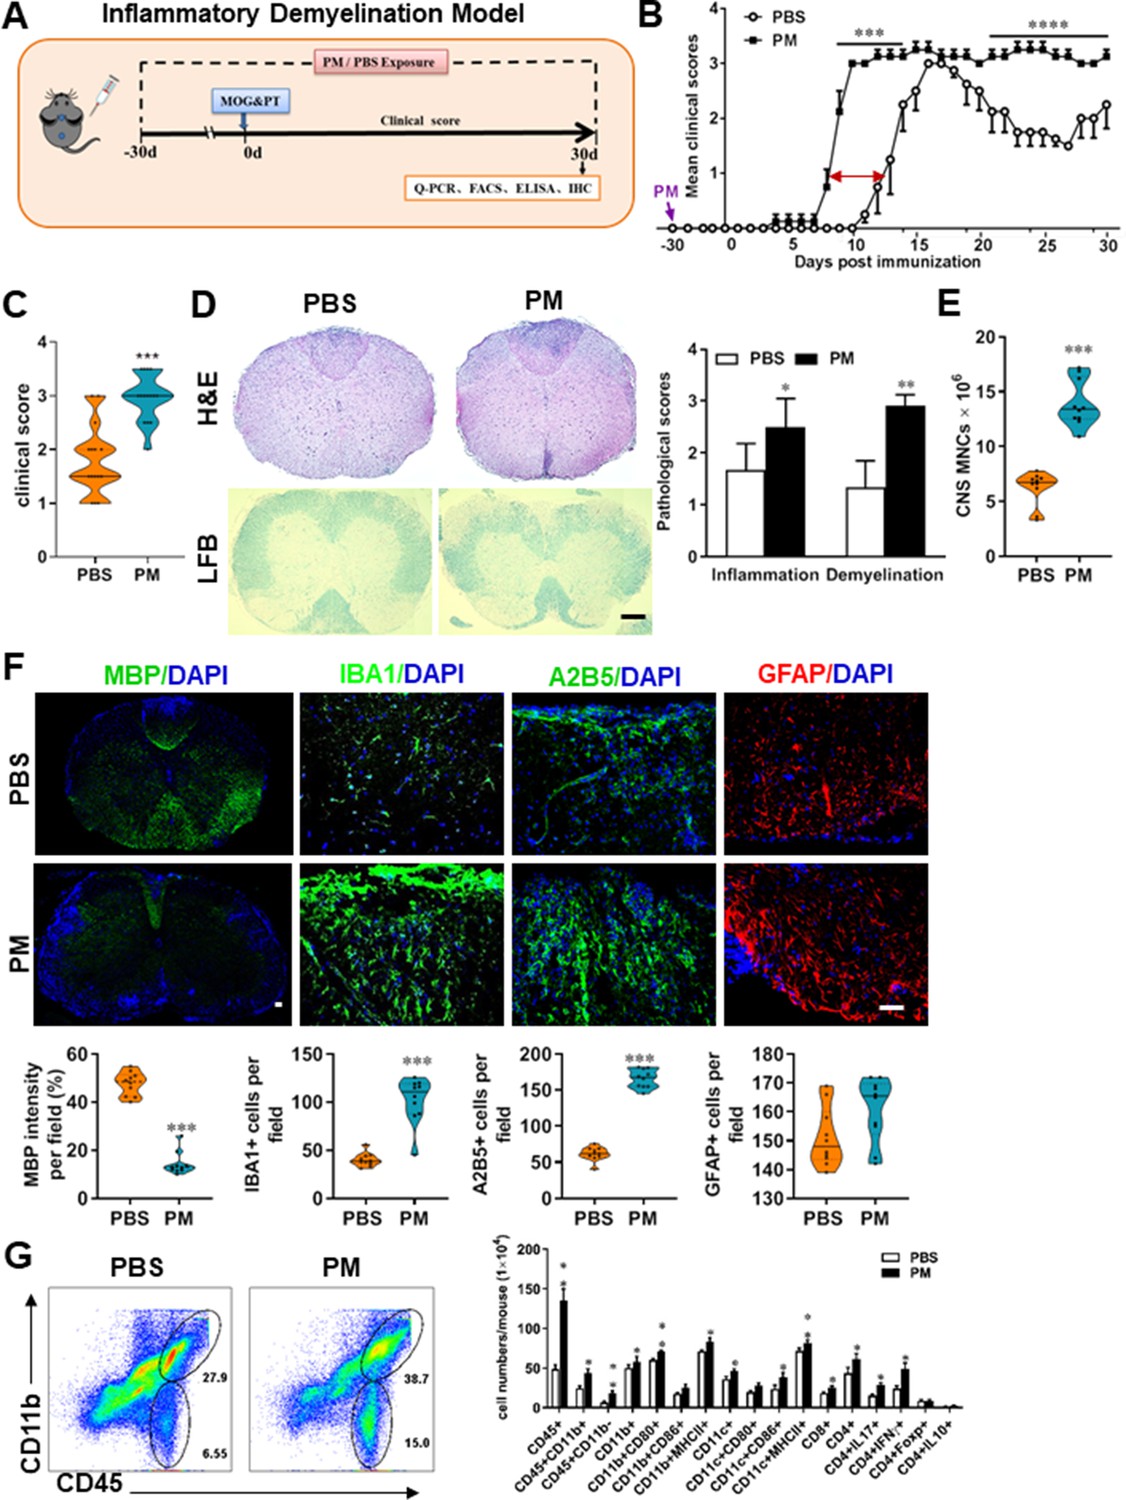
PM exposure aggravates myelin injury in an inflammatory demyelination model.
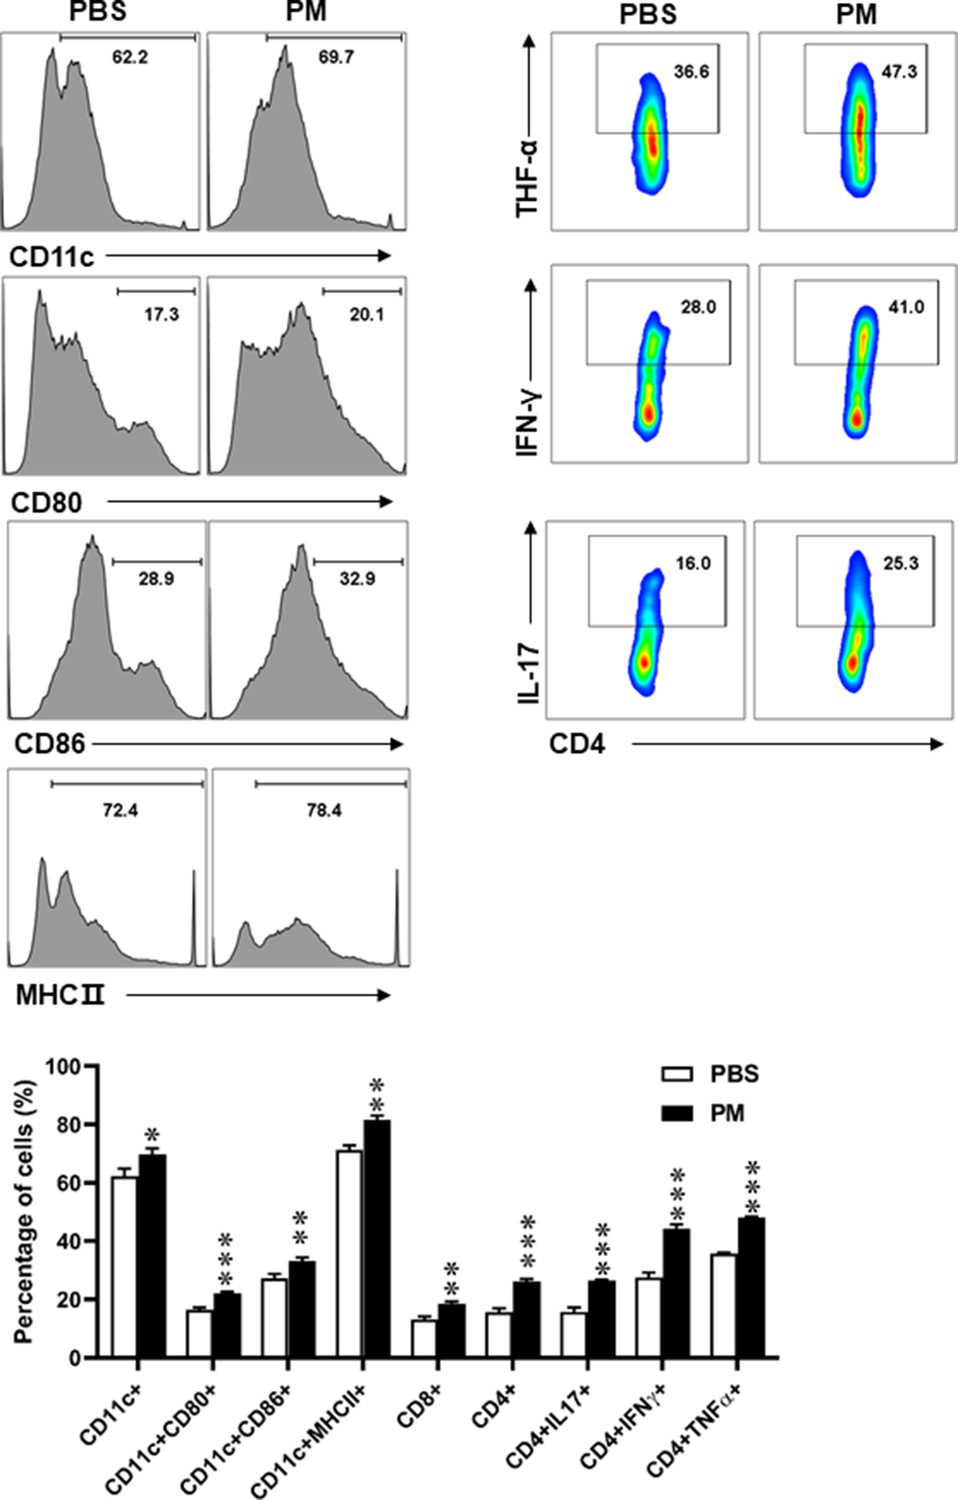
(A) Schematics of treatment strategies for EAE. Female, 8–10 week-old C57BL/6 mice were immunized with MOG35-55 and pre-treated with PBS or PM (nasopharyngeal inhalation, 5.0 mg/kg/d) daily, starting at day –30 (before immunization) until 30 p.i. All mice were sacrificed and their tissues (brain, spinal cord, draining lymph nodes, and spleen) were harvested for Q-PCR, flow cytometry, ELISA, or immunohistochemistry analysis at day 30 p.i. (B) EAE development was evaluated daily by two researchers blindly, following to a 0–5 scale. (C) Distribution of disease status at the end points of experiment (day 30 p.i.). (D) Thoracic spinal cord sections were assayed for inflammation by H&E and demyelination by Luxol fast blue (LFB), and CNS pathology was scored on a 0–3 scale. (E) Absolute number of CNS mononuclear cells (MNCs) in cell suspension of each mouse (brain and spinal cord) was counted. (F) Representative images of spinal cord sections of PBS- and PM-treated EAE mice in the dorsal funiculus. Quantitative analysis of MBP, IBA1, A2B5, and GFAP expression was assessed by using Image-Pro. The measured areas included 8–10 fields and covered virtually all the white matter of the spinal cord. Dorsal column at the thoracic spinal cord is shown as representative images. (G) Effects of PM treatment on the various inflammatory cells in the CNS. MNCs from spinal cords and brains were isolated at day 30 p.i., stimulated with MOG35–55 (10 μg/mL) for 24 h, and analyzed by flow cytometry. Cells were gated as CD45+CD11b+ (microglia and infiltrating macrophages) and CD45+CD11b- (other infiltrating immune cells), and their subsets were further defined. One representative of three independent experiments is shown. Symbols represent mean ± SD; n = 4–5 mice in each group. *p < 0.05; **p < 0.01; ***p < 0.001; ****p < 0.0001, compared to PBS-treated group, two-way ANOVA comparison with Multiple t’ tests. Scale bar = 40 µm in D, Scale bar = 10 µm in F.
Figure 1—figure supplement 1
Effects of PM exposure on different immune cells in periphery.
Splenocytes of EAE mice pre-treated with PBS or PM (nasopharyngeal inhalation, 5.0 mg/kg/d) daily described in (Figure 1) were harvested at day 30 p.i. Cells were stimulated with MOG35-55 (25 μg/ml) for 72 hr, and analyzed by flow cytometry. Quantitative data refer to mean ± SD (n = 5–8 in Figure 1). *p < 0.05; **p < 0.01; ***p < 0.001, compared to PBS-treated group, one-way ANOVA comparison with Tukey’s multiple comparisons test. One representative of three independent experiments is shown.
Figure 2
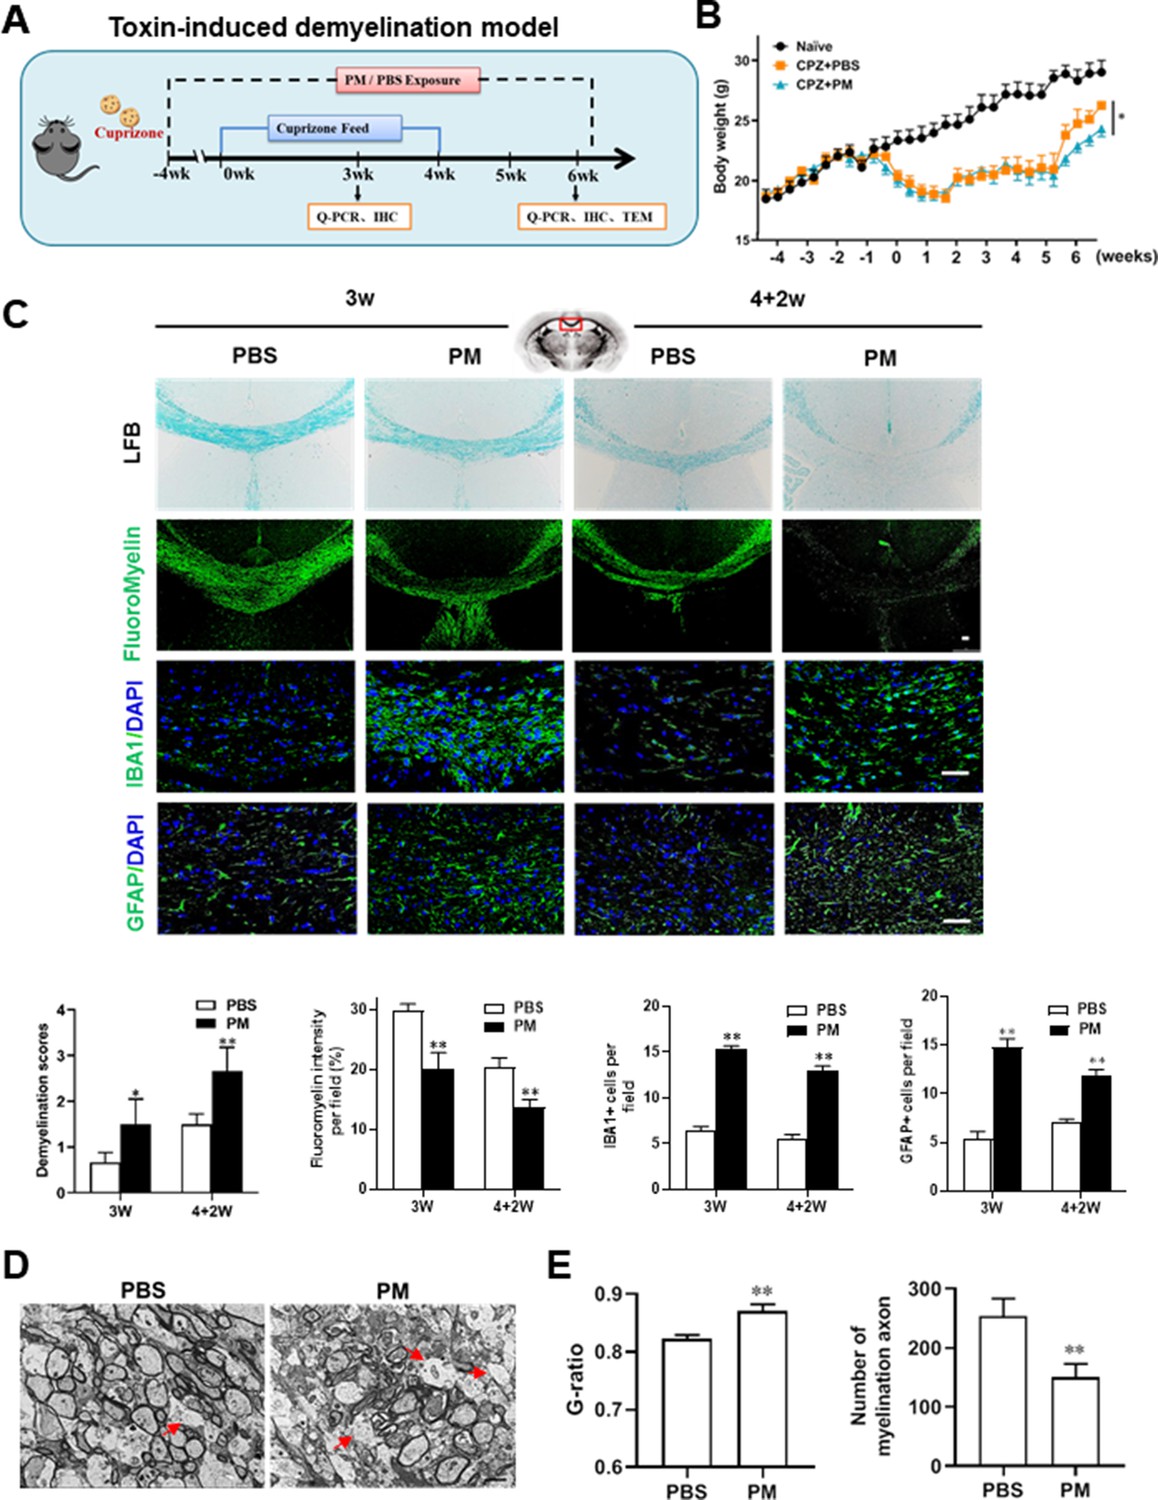
PM aspiration exacerbates demyelination and prevents remyelination in a toxin-induced demyelination model.
(A) Treatment paradigms. Male, 8–10 week-old C57BL/6 mice were pre-treated with PBS or PM (nasopharyngeal inhalation, 5.0 mg/kg/d) daily from week –4 to week 6. Standard rodent diet containing 0.2% copper chelator cuprizone (CPZ), which causes CNS demyelination, were fed for 4 weeks to achieve complete demyelination in the corpus callosum; cuprizone was then withdrawn and mice were again fed normal chow, allowing for spontaneous remyelination to occur within the next 2 weeks. (B) Body weights of mice from different groups were recorded every 2 days. (C) Representative images and quantitative analysis of LFB, FluoroMyelin, and immunohistochemistry (GFAP, IBA1) stains in the body of the corpus callosum of PM- or PBS-treated mice at different timepoints. (D) Representative electron microscopy images of the corpus callosum region isolated from PM- or PBS-treated mice at 2 weeks after cuprizone withdrawal. Arrows heads mark demyelinated axons. (E) Quantification of the myelinated axons shown in (D). The G-ratios (axon diameter divided by entire myelinated fiber diameter) of myelinated fibers and number of myelination axon were assessed by using Image-Pro. One representative of three independent experiments is shown. Symbols represent mean ± SD; n = 5–8 mice in each group. *p < 0.05; **p < 0.01; ***p < 0.001, compared to PBS-treated group, two-way ANOVA comparison with Tukey’s multiple comparisons test. Scale bar = 50 µm in C, Scale bar = 2 µm in D.
Figure 3
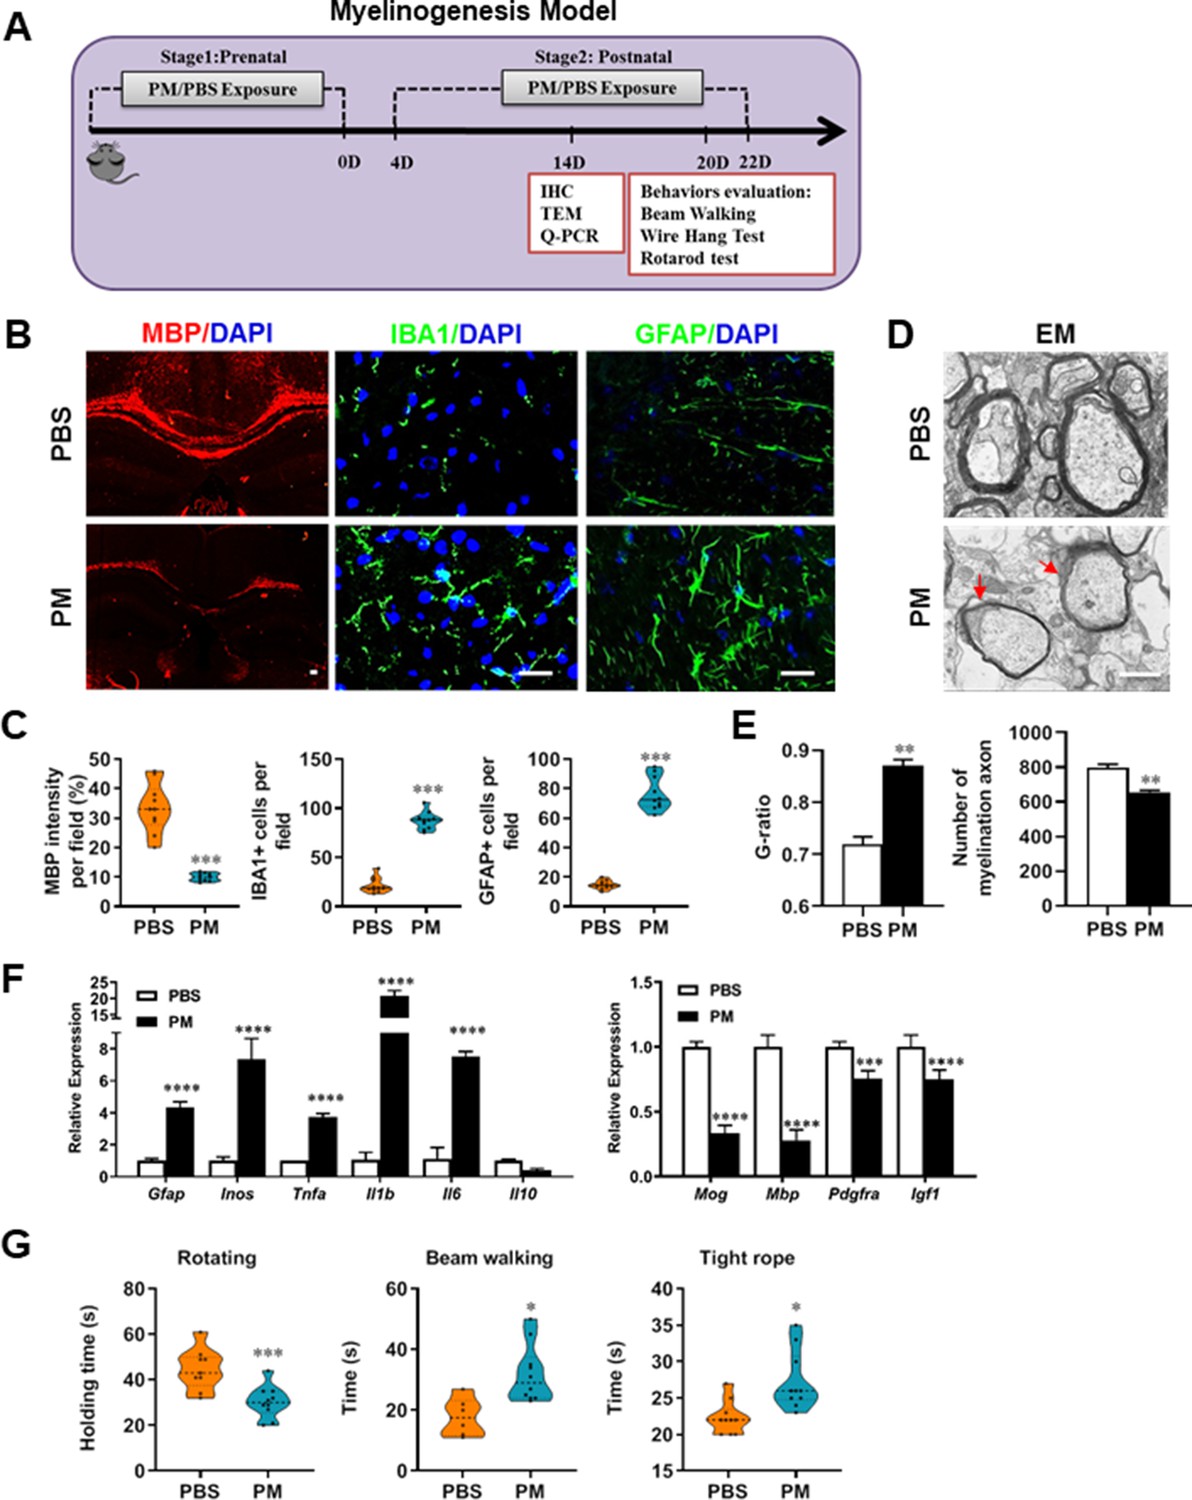
PM exposure during pregnant and postnatal delays myelinogenesis in the developing nervous system.
(A) Schematics of treatment strategies. In order to model a maternal PM exposure, pregnant mice were pre-treated with PBS or PM (nasopharyngeal inhalation, 5.0 mg/kg/d) daily until parturition. Pups from PBS- or PM-treated group with similar weights were subsequently exposed to PBS or PM at postnatal Days 4–21. Brain was harvested for Q-PCR, immunohistochemistry, or TEM analysis at postnatal day 14, and behavioral evaluation was processed at postnatal Days 20–22. (B) Representative images of myelin content (MBP staining), microgliosis (IBA1 staining), and astrogliosis (GFAP staining) in the body of the corpus callosum of PM- or PBS-treated mice. (C) Quantitative analysis of MBP, IBA1, and GFAP expression using Image-Pro. (D) Representative electron microscopy images of the corpus callosum region isolated from PM- or PBS-treated mice. Arrows heads mark myelin thinning and dysplasia. (E) Quantification of the G-ratios (axon diameter divided by entire myelinated fiber diameter) of myelinated fibers and number of myelination axon by Image-Pro. (F) mRNA relative expression of pro-inflammatory cytokines and myelin protein in corpus callosum of PM- or PBS-treated mice was detected by real-time PCR. (G) Effect of PM on motor balance and motor coordination were determined by behavioral evaluation (rotating rod, beam walking, and tight rope test). Data were collected from three to five separate mouse litters. Symbols represent mean ± SD; *p < 0.05; **p < 0.01; ***p < 0.001; ****p < 0.0001, compared to PBS-treated group, two-way ANOVA comparison with Tukey’s multiple comparisons test. Scale bar = 50 µm in B, Scale bar = 1 µm in D.
Figure 4 with 1 supplement
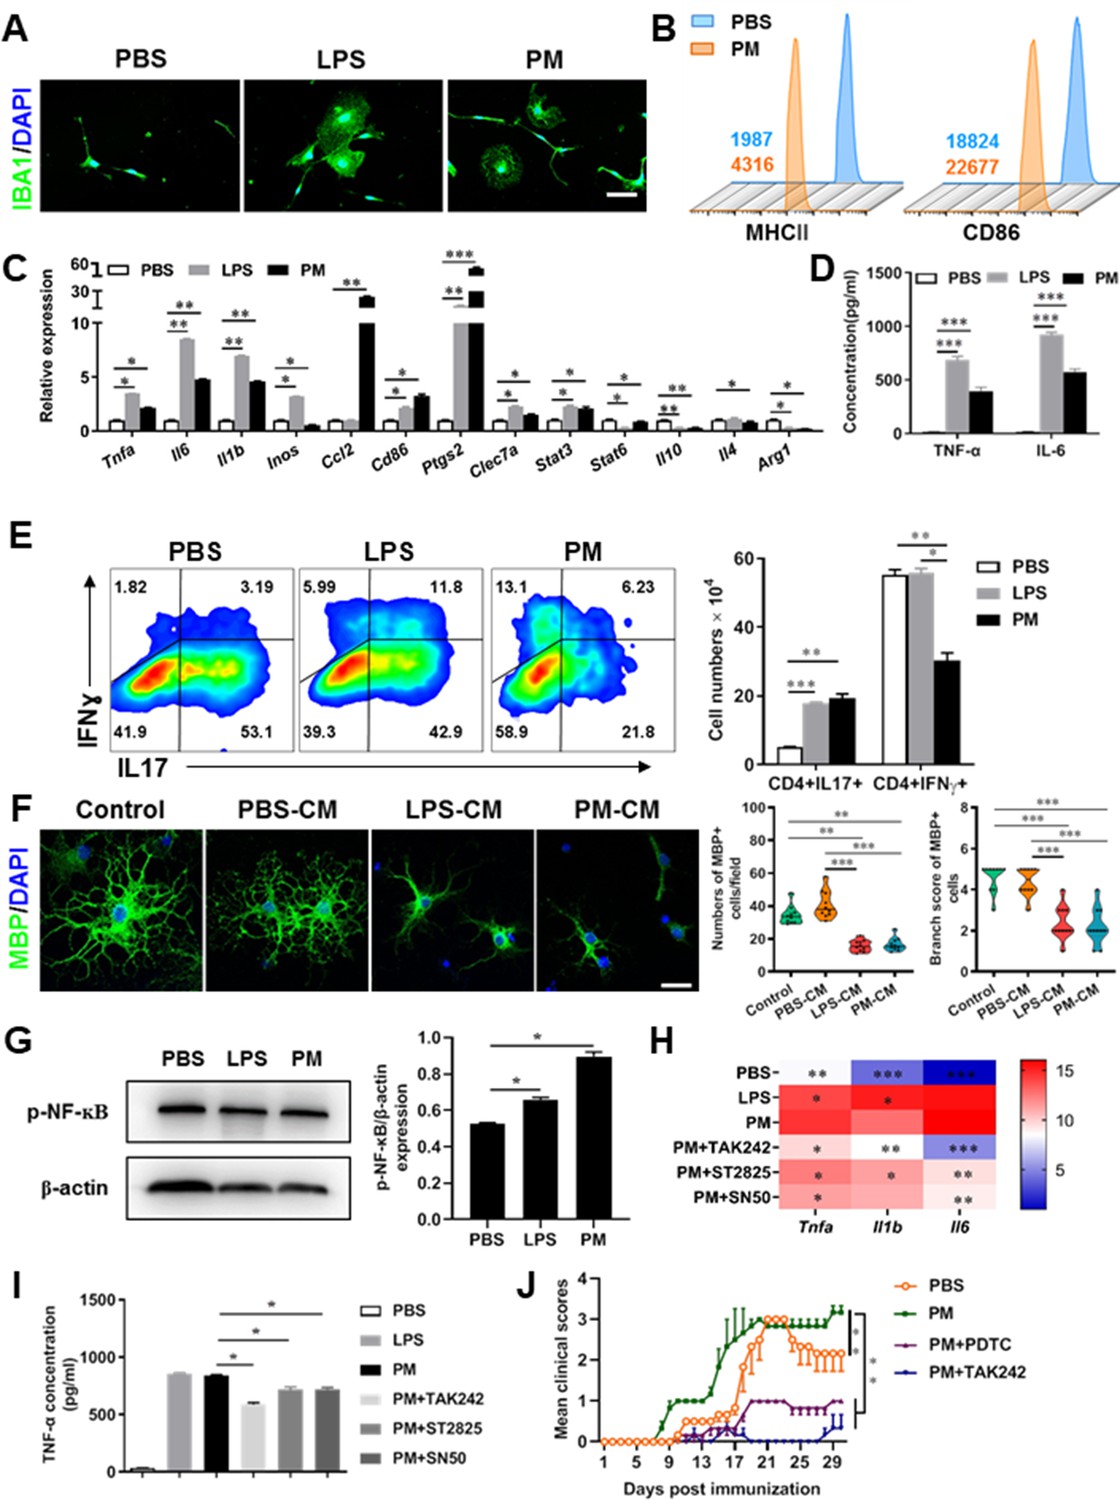
PM exposure boosts microglial activation and pathogenicity.
(A) Morphology of microglia under the treatment of PM or LPS. Primary microglia from newborn C57BL/6 mice were stimulated for 6 h with PBS, LPS (100 ng/mL) or PM (100 μg/mL). Microglia/macrophages were labeled with IBA1 (green) and nuclei stained with DAPI (blue). (B) Effects of PM treatment on the expression of MHC II and CD86 of microglia. Primary microglia were stimulated with LPS or PM for 24 h, and analyzed by flow cytometry. (C) mRNA relative expression of cytokines and cell surface markers of LPS- or PM-treated microglia was detected by real-time PCR. (D) ELISA analysis for production of pro-inflammatory cytokine TNF-α and IL-6 in culture medium under PM treatment. (E) Naїve CD4+ cells were cocultured with LPS- or PM-activated microglia under Th17-polarizing conditions. The percentage of Th17 and Th1 cells in the CD4 subset were analyzed by intracellular staining of IL-17 and IFN-γ, respectively. (F) Responses of primary OPCs to application of microglia-conditioned media (MCM) in vitro. OPCs (5000 cells/cm2) were cultured in differentiation medium for 3 days, and half of medium was replaced by culture supernatants of microglia treated with PBS (PBS-MCM), LPS (LPS-MCM), or PM (PM-MCM) for another 4 days. Mature oligodendrocytes were identified by specific markers MBP (green). Quantitative analysis of numbers or branch score of MBP+ mature oligodendrocytes was assessed by using Image-Pro.(G) Immunoblot analysis of the phosphorylation of NF-kB (p–NF–kB). (H) mRNA relative expression of pro-inflammatory cytokines (Tnfa, Il6, and Il1b) of LPS- or PM-stimulated microglia pre-treated with TAK242 (1 μg/mL), ST2825 (10 μM), or SN50 (10 μM) for 4 h. (I) ELISA analysis for production of TNF-α in LPS- or PM--stimulated microglia pre-treated with TAK242 (1 μg/mL), ST2825 (10 μM), and SN50 (10 μM) for 4 h. (J) EAE development was evaluated daily for PM- or PBS-treated group with or without TAK242 and PDTC administration by two researchers blindly, according to a 0–5 scale. Female, 8–10 week-old C57BL/6 mice were immunized with MOG35-55 and pre-treated with PBS or PM (nasopharyngeal inhalation, 5.0 mg/kg/d) daily, starting at day –30 (before immunization) until the end of the experiment. TAK242 (5.0 mg/kg/d) or PDTC (10.0 mg/kg/d) was given by intraperitoneal injection at day 0 p.i. Data were collected from 3 to 5 mice each group. Symbols represent mean ± SD; *p < 0.05; **p < 0.01; ***p < 0.001; two-way ANOVA comparison with Tukey’s multiple comparisons test. Scale bar = 100 µm in A, Scale bar = 50 µm in E.
Figure 4—figure supplement 1
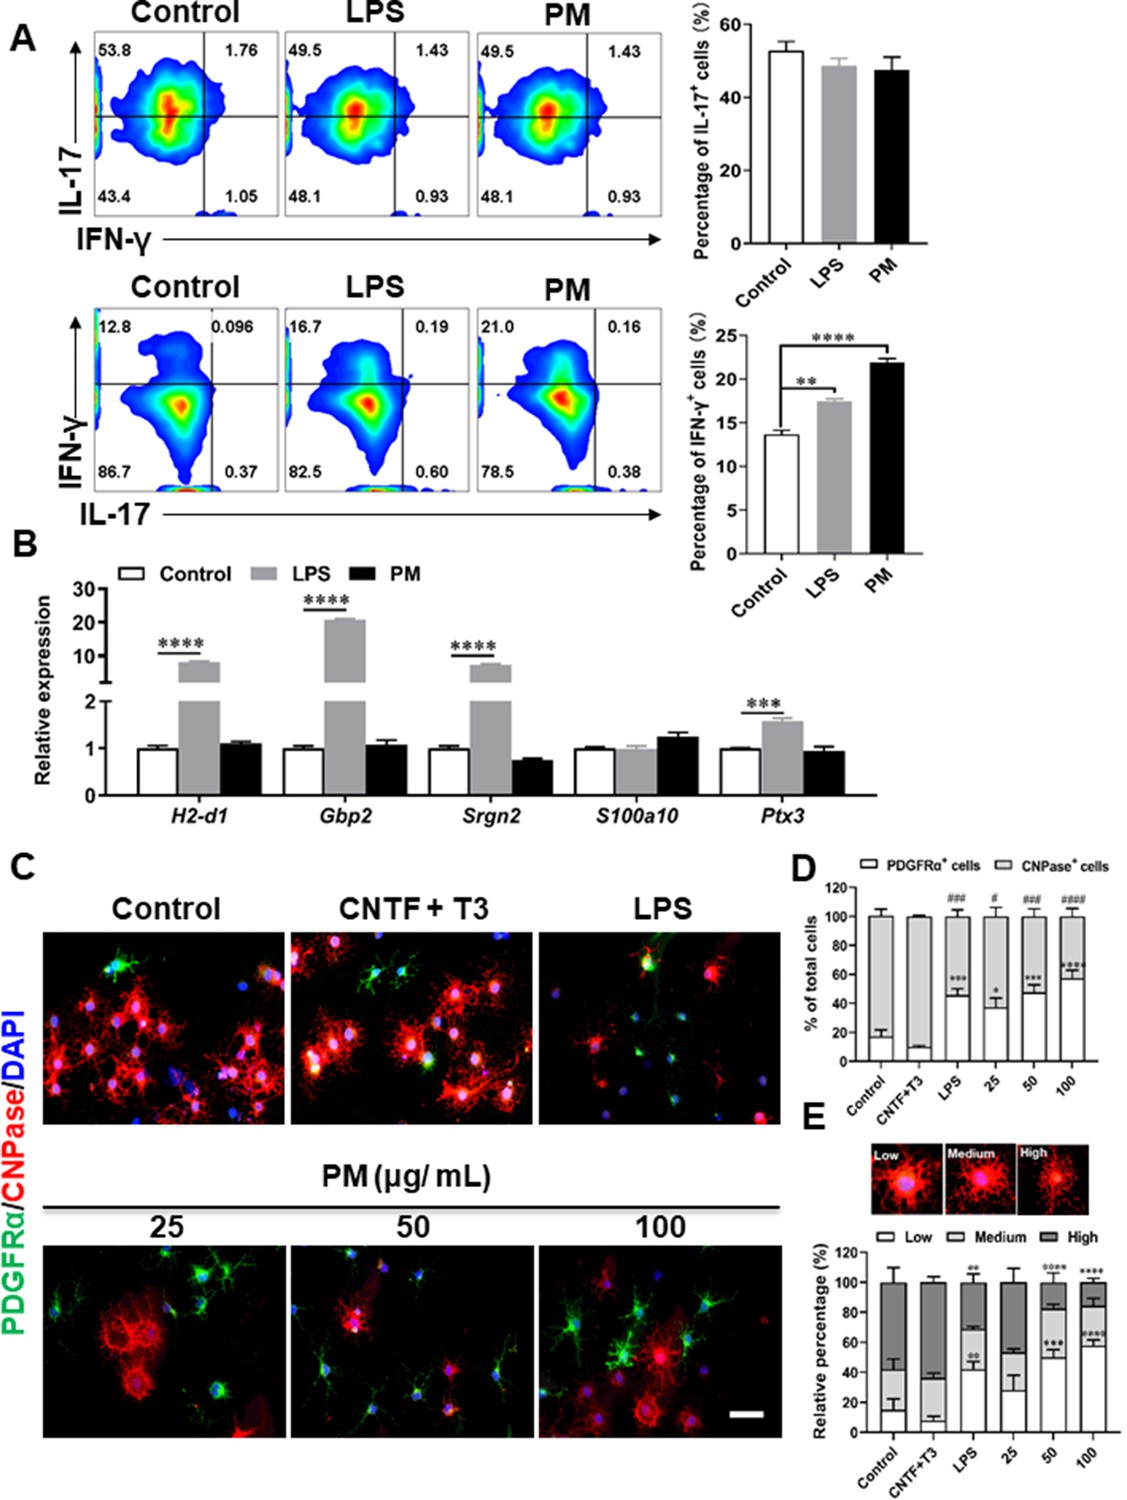
Effects of PM exposure on primary astrocytes, OPCs, and T cell subsets.
(A) CD4+ cells were isolated from the spleens of naïve C57BL/6 mice and cultured under Th17 and Th1 polarizing conditions and of different treatment concentrations of LPS (100 ng/mL) or PM (400 μg/mL) for 72 h, and analyzed by flow cytometry. (B) Primary astrocytes from newborn C57BL/6 mice were stimulated for 24 h with PBS, LPS (100 ng/mL), or PM (100 μg/mL). Expression of indicated genes from astrocytes were determined by Q-PCR. (C) Primary OPCs were either left unstimulated, stimulated with LPS (100 ng/mL), or with (25, 50, 100 μg/mL) PM for 3 days. OPCs was labeled with PDGFRα (green), OLGs with CNPase (red), and nuclei with DAPI (blue). (D) Quantitative analysis was poformed by calculating the proportion of PDGFRα+ OPCs or CNPase+ mature OLGs. (E) Morphological analysis of OPC mature was described in the methods section. Cells were divided into three categories: low, medium, and high, according to the complexity of their processes, and the percentage of cells in each category were shown. Symbols represent mean ± SEM (n = 3 each group). # indicates the significant differences of PDGFRα cells compared to the control group. * indicates significant differences of CNPase cells compared to the control group. # or *p < 0.05; **p < 0.01; ### or ***p < 0.001 and #### or ****p < 0.0001; determined by one-way or two-way ANOVA test. Scale bar = 50 µm.
Figure 5

PM-induced genomic regulation microglia activities by TLR-4/NF-kB signaling.
(A) Heatmap displaying the fold changes of genes (rows) in the PM perturbations (columns). Displayed are only genes that were differentially expressed (fold change >2; false discovery rate [FDR] < 0.001) in at least one condition. (B) Real-time qPCR analysis of PM-regulated genes in PM and PBS-treated microglia (n = 3). (C) The Gene Ontology (GO) analysis of the significantly regulated genes between PM and PBS-treated group. (D and E) Gene set enrichment analysis (D) and pathway analysis (E) of PM and PBS-treated microglia RNA-seq. (F) Fractions of ChIP-seq peaks in different regions of the genome. (G) GO of NF-kB-targeted genes. (H) ChIP-seq showing NF-kB binding at selected gene loci (Asamts7, Kcnh2, IL1f9, and Mmp2). (I) Venn diagram showing the overlap between NF-kB-bound genes and differentially expressed genes in PM and PBS-treated microglia. (J) GO functional categories analysis of NF-kB directly targeted genes.
Figure 6
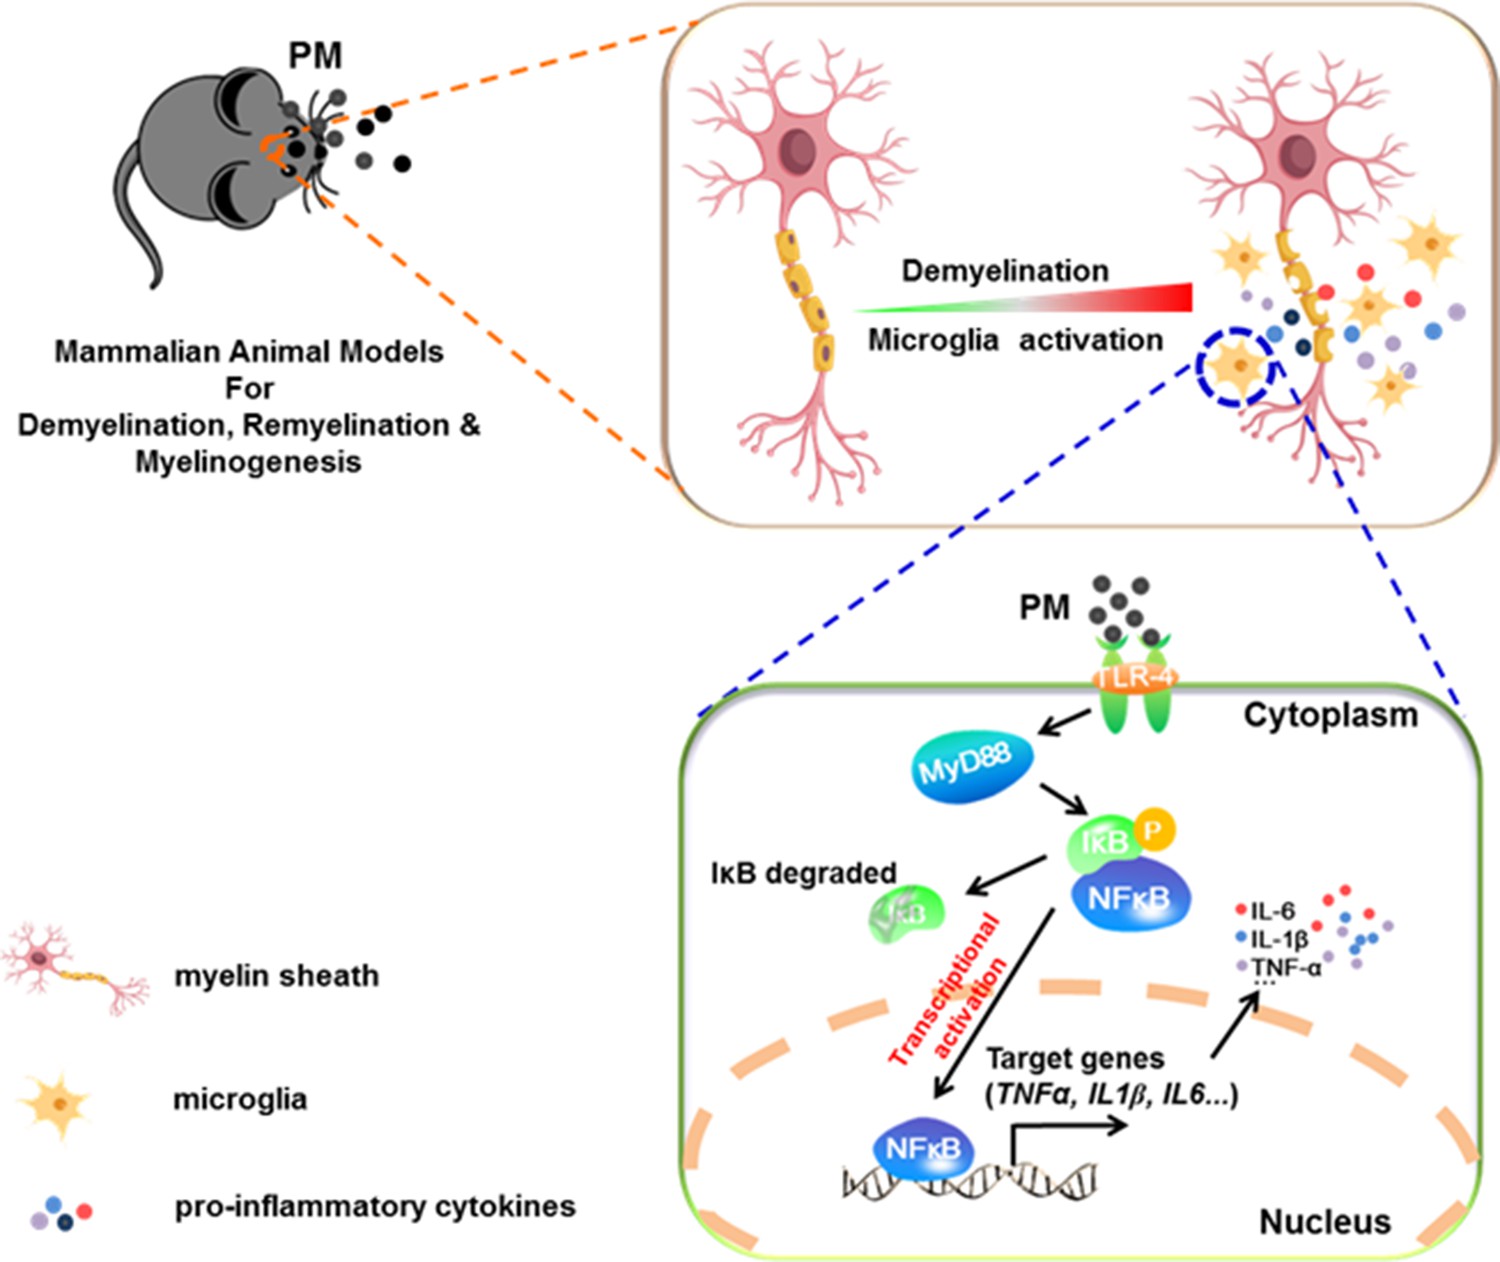
Model of PM aggravates CNS demyelination via TLR-4/NF-kB-mediated microglia pathogenic activities.
PM exposure definitely exacerbates CNS myelin injury, based on three complementary animal models: the immune-induced EAE model, the toxicity-induced de/remyelination model that under minimal or non-inflammatory microenvironments, and the myelinogenesis model during postnatal development. The cellular basis of this action is associated with the activation of microglial pro-inflammatory activities. Mechanistically, TLR-4/NF-kB signaling mediated a core network of genes that control PM-triggered microglia pathogenicity. Activated microglia, the resident CNS immune cells, respond to PM perturbation directly, release pro-inflammatory factors, and subsequently aggravate neuroinflammation, myelin injury, and dysfunction of movement coordination ability of mice.
Additional files
-
Transparent reporting form
- https://cdn.elifesciences.org/articles/72247/elife-72247-transrepform1-v2.docx
-
Source data 1
Data generated or analyzed during this study.
- https://cdn.elifesciences.org/articles/72247/elife-72247-data1-v2.zip
Download links
A two-part list of links to download the article, or parts of the article, in various formats.
Downloads (link to download the article as PDF)
Open citations (links to open the citations from this article in various online reference manager services)
Cite this article (links to download the citations from this article in formats compatible with various reference manager tools)
Atmospheric particulate matter aggravates cns demyelination through involvement of TLR-4/NF-kB signaling and microglial activation
eLife 11:e72247.
https://doi.org/10.7554/eLife.72247


