A mechanosensing mechanism controls plasma membrane shape homeostasis at the nanoscale
- Institute for Bioengineering of Catalonia, the Barcelona Institute of Technology (BIST), Spain
- Departament de Biomedicina, Unitat de Biofísica i Bioenginyeria, Facultat de Medicina i Ciències de la Salut, Universitat de Barcelona, Spain
- Department of Applied Mechanics, IIT Delhi, India
- IFOM ETS - The AIRC Institute of Molecular Oncology, Italy
- Departament de Biomedicina, Unitat de Biologia Cel·lular, Facultat de Medicina i Ciències de la Salut, Centre de Recerca Biomèdica CELLEX, Institut d’Investigacions Biomèdiques August Pi i Sunyer (IDIBAPS), Universitat de Barcelona, Spain
- Institute for Molecular Bioscience and Centre for Microscopy and Microanalysis, University of Queensland, Australia
- Institute for Molecular Biology of Barcelona (CSIC), Spain
- Department of Oncology and Haemato-Oncology, University of Milan, Italy
- Universitat Politècnica de Catalunya (UPC), Campus Nord, Carrer de Jordi Girona, Spain
- Centre Internacional de Mètodes Numèrics en Enginyeria (CIMNE), Spain
Figures
Figure 1
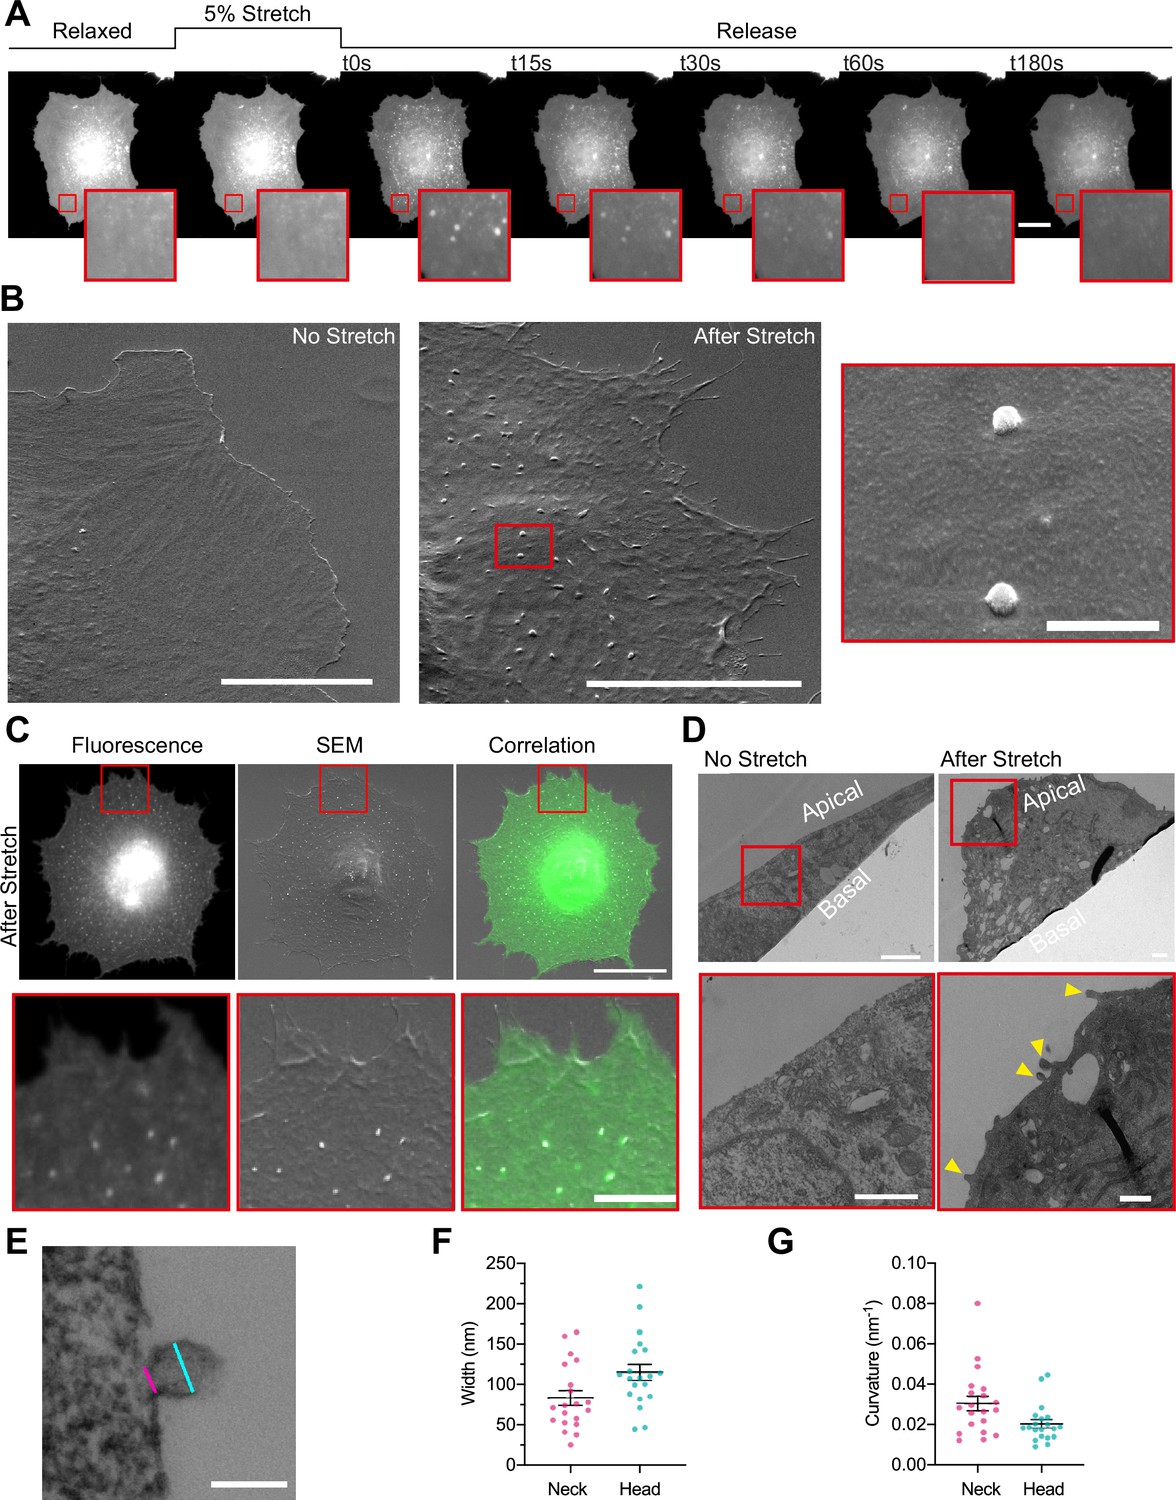
Cellular stretch generates plasma membrane (PM) evaginations with a defined curvature.
(A) Time course images of a normal human dermal fibroblast (NHDF) transfected with EGFP-membrane marker before, during, and after 5% constant stretch application. PM evaginations are seen as bright fluorescent spots after the release of the stretch due to compression of the PM. Scale bar is 20 μm. (B) NHDF imaged through scanning electron microscopy (SEM). A non-stretched cell (left), and a cell just after stretch release (right) are shown. Scale bars are 10 μm in main images, 500 nm in magnified image (framed in red). (C) Correlation between fluorescence and SEM images of a non-stretched and stretched-released NHDF. Matching was achieved by using a patterned substrate together with computational tools for alignment. Scale bar is 20 μm for the main images and 2 μm for the insets. (D) Transmission electron microscopy (TEM) images of a non-stretched and a stretched-released NHDF. Yellow arrows in magnified image point at PM evaginations formed at the apical side of the cell. Scale bars are 1 μm for the main images and 500 nm for the insets. (E) Detail of an evagination, cyan and magenta lines show evagination’s head and neck diameters, respectively. Scale bar is 100 nm. (F, G) Corresponding evagination neck and head diameters (F) and curvatures (G). N=22 evaginations from 3 independent experiments. Data show mean ± s.e.m. In A, C, D, and E, red-framed images show a magnification of the areas marked in red in the main image.
-
Figure 1—source data 1
Raw data of Figure 1 graphs and plots.
- https://cdn.elifesciences.org/articles/72316/elife-72316-fig1-data1-v2.xlsx
Figure 2 with 1 supplement
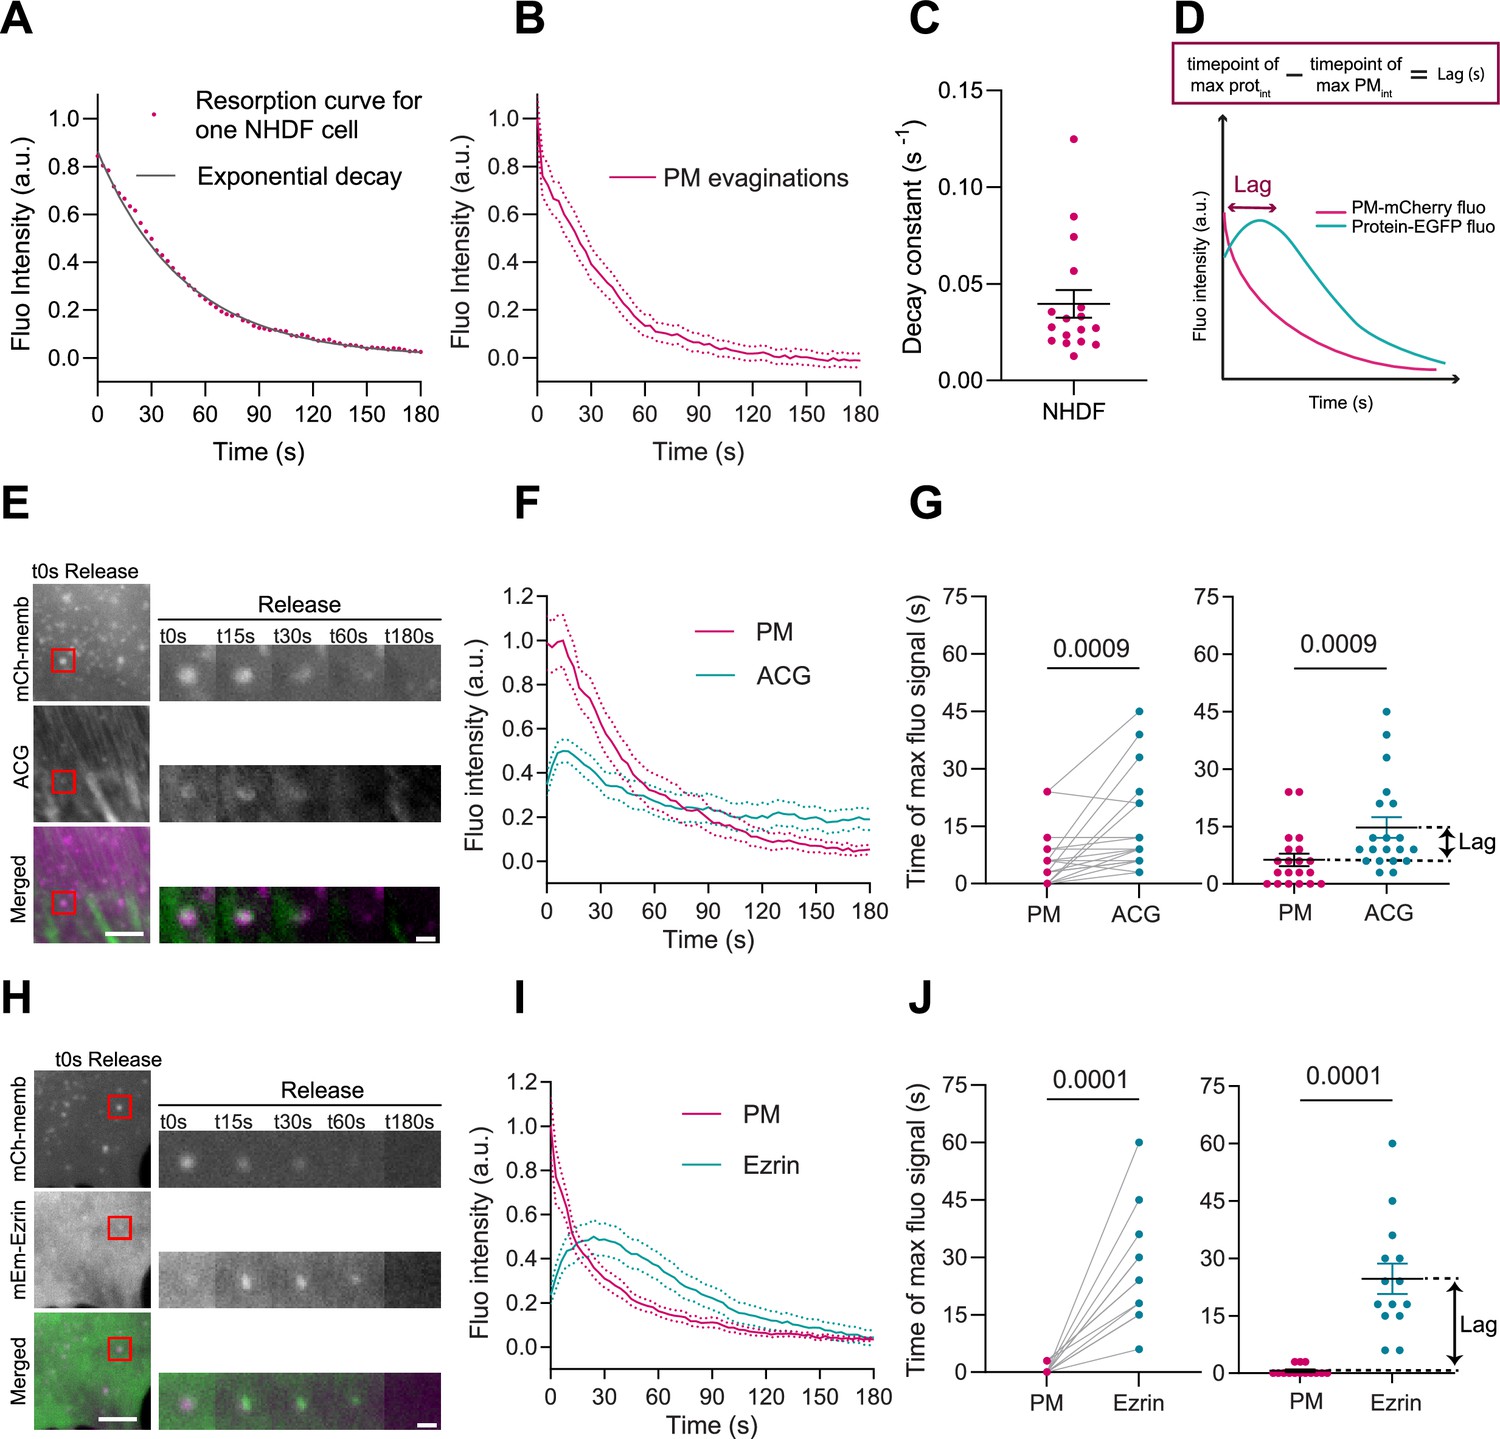
Plasma membrane (PM) evaginations trigger local actin recruitment.
(A) Dynamics of PM evaginations of one example cell after stretch release, quantified as the change in fluorescence of the structure with time (average of 10 evaginations). The black line corresponds to the plot of the corresponding decay curve fit. (B) Dynamics of PM evaginations quantified as the change in fluorescence of the structure with time. N=17 cells from 3 independent experiments. (C) Decay constants extracted from the fits of the PM evaginations dynamics of each cell. N=12 cells from 3 independent experiments. (D) Definition of lag time. (E) Time course images of mCherry-membrane and Actin Chromobody-GFP (ACG) marking PM evaginations in NHDF after stretch release. (F) Dynamics of PM evaginations quantified through mCh-membrane or ACG fluorescence markers during stretch release in NHDF. N=20 cells from 3 independent experiments. (G) Timepoint of maximal fluorescence intensity of PM and ACG (left, paired plot; right, dot plot with mean). Statistical significance was assessed through paired Wilcoxon test. N=20 cells from 3 independent experiments. (H) Time course images of mCherry-membrane and mEmerald-Ezrin marking PM evaginations in NHDF after the release of the stretch. (I) Dynamics of PM evaginations quantified through mCh-membrane and mEmerald-Ezrin fluorescence markers after stretch release in NHDF. N=14 cells from 2 independent experiments. (J) Timepoint of maximal fluorescence intensity of PM and Ezrin markers (left, paired plot; right, dot plot with mean). Statistical significance was assessed through paired Wilcoxon test. N=14 cells from 2 independent experiments. Data show mean ± s.e.m.
-
Figure 2—source data 1
Raw data of Figure 1 graphs and plots.
- https://cdn.elifesciences.org/articles/72316/elife-72316-fig2-data1-v2.xlsx
Figure 2—figure supplement 1
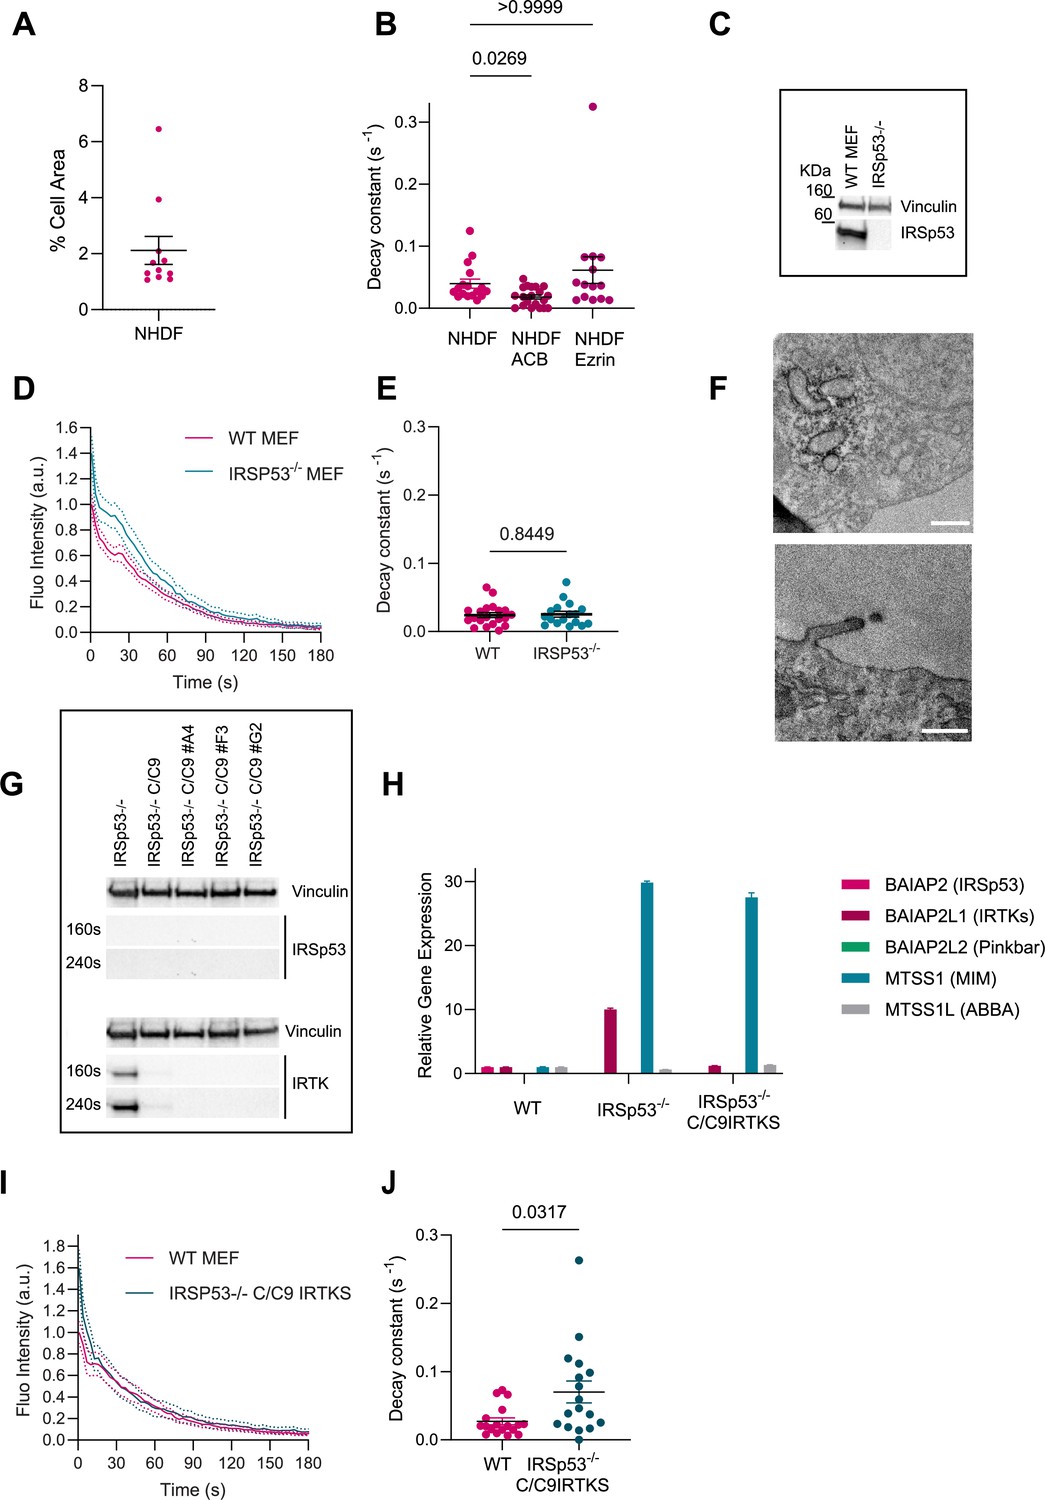
Effect of IRSp53 silencing in mouse embryonic fibroblast (MEF) cells.
(A) % of cell area stored in plasma membrane (PM) evaginations after stretch in NHDF. N=117 from 3 independent experiments. (B) Quantification of the decay constants of membrane-tagged PM evaginations in NHDF cells in absence or presence of ACB or Ezrin overexpression. Statistical significance was assessed through Kruskal-Wallis test. N=17, 20, and 14 cells from 3, 3, and 2 independent experiments respectively. (C) Western blot image of wild-type (WT) and IRSP53-/- cell lysates incubated with anti-IRSp53 antibody. Representative western blot from three experiments. (D) Quantification dynamics of mCherry-membrane-tagged PM evaginations after stretch release in WT or IRSp53-/- MEF cells. N=20 and 17 cells from 2 independent experiments in each case. (E) Corresponding quantification of the decay constants of WT or IRSp53-silenced MEF cells. Significance was calculated through Mann-Whitney test. N=20 and 17 cells from 2 independent experiments. (F) Transmission electron microscopy (TEM) images of IRSp53-/- cells co-transfected with csAPEX2-GBP together with (top) mito-GFP or (bottom) EGFP-IRSp53-FL. APEX staining can be observed around mitochondria (top), in the tips of filopodia and up to some extent in the PM of EGFP-IRSp53-FL-transfected cells (bottom), as expected. Scale bars are 500 nm. Data show mean ± s.e.m. (G) Western blot image from cell lysates of IRSP53-/-, IRSP53-/- silenced with IRTKs using CRISPR-Cas9 (different clones A4, F3 and G2). Clone F3 was subsequently used. 160 s and 240 s are exposure times. Representative western blot from three experiments. (H) RT-PCR from cell lysates of WT, IRSP53-/-, IRSP53-/- silenced with IRTKs using CRISPR-Cas9 (clone F3). (I) Quantification dynamics of mCherry-membrane-tagged PM evaginations after stretch release in WT or IRSP53-/- silenced with IRTKs using CRISPR-Cas9 MEF cells. N=18 and 17 cells from 2 independent experiments in each case. (J) Corresponding quantification of the decay constants of WT or IRSP53-/- silenced with IRTKs using CRISPR-Cas9. Significance was calculated through Mann-Whitney test. N=18 and 17 cells from 2 independent experiments. Data show mean ± s.e.m.
-
Figure 2—figure supplement 1—source data 1
Raw data of Figure 2—figure supplement 1 graphs and plots.
- https://cdn.elifesciences.org/articles/72316/elife-72316-fig2-figsupp1-data1-v2.xlsx
-
Figure 2—figure supplement 1—source data 2
Figure with the uncropped western blot of Figure 2—figure supplement 1C.
- https://cdn.elifesciences.org/articles/72316/elife-72316-fig2-figsupp1-data2-v2.pdf
-
Figure 2—figure supplement 1—source data 3
Original file of the full unedited western blot exposed 10 s of Figure 2—figure supplement 1C.
- https://cdn.elifesciences.org/articles/72316/elife-72316-fig2-figsupp1-data3-v2.zip
-
Figure 2—figure supplement 1—source data 4
Original file of the full unedited western blot exposed 10 s merged with marker of Figure 2—figure supplement 1C.
- https://cdn.elifesciences.org/articles/72316/elife-72316-fig2-figsupp1-data4-v2.zip
-
Figure 2—figure supplement 1—source data 5
Original file of the full unedited western blot exposed 80 s of Figure 2—figure supplement 1C.
- https://cdn.elifesciences.org/articles/72316/elife-72316-fig2-figsupp1-data5-v2.zip
-
Figure 2—figure supplement 1—source data 6
Original file of the full unedited western blot exposed 80 s merged with marker of Figure 2—figure supplement 1C.
- https://cdn.elifesciences.org/articles/72316/elife-72316-fig2-figsupp1-data6-v2.zip
-
Figure 2—figure supplement 1—source data 7
Figure with the uncropped western blot of Figure 2—figure supplement 1J.
- https://cdn.elifesciences.org/articles/72316/elife-72316-fig2-figsupp1-data7-v2.pdf
-
Figure 2—figure supplement 1—source data 8
Original file of the full unedited western blot exposed 10 s of Figure 2—figure supplement 1J.
- https://cdn.elifesciences.org/articles/72316/elife-72316-fig2-figsupp1-data8-v2.zip
-
Figure 2—figure supplement 1—source data 9
Original file of the full unedited western blot exposed 10 s merged with marker of Figure 2—figure supplement 1J.
- https://cdn.elifesciences.org/articles/72316/elife-72316-fig2-figsupp1-data9-v2.zip
-
Figure 2—figure supplement 1—source data 10
Original file of the full unedited western blot exposed 160 s of Figure 2—figure supplement 1J.
- https://cdn.elifesciences.org/articles/72316/elife-72316-fig2-figsupp1-data10-v2.zip
-
Figure 2—figure supplement 1—source data 11
Original file of the full unedited western blot exposed 160 s merged with marker of Figure 2—figure supplement 1J.
- https://cdn.elifesciences.org/articles/72316/elife-72316-fig2-figsupp1-data11-v2.zip
-
Figure 2—figure supplement 1—source data 12
Original file of the full unedited western blot exposed 240 s of Figure 2—figure supplement 1J.
- https://cdn.elifesciences.org/articles/72316/elife-72316-fig2-figsupp1-data12-v2.zip
-
Figure 2—figure supplement 1—source data 13
Original file of the full unedited western blot exposed 240 s merged with marker of Figure 2—figure supplement 1J.
- https://cdn.elifesciences.org/articles/72316/elife-72316-fig2-figsupp1-data13-v2.zip
Figure 3 with 2 supplements
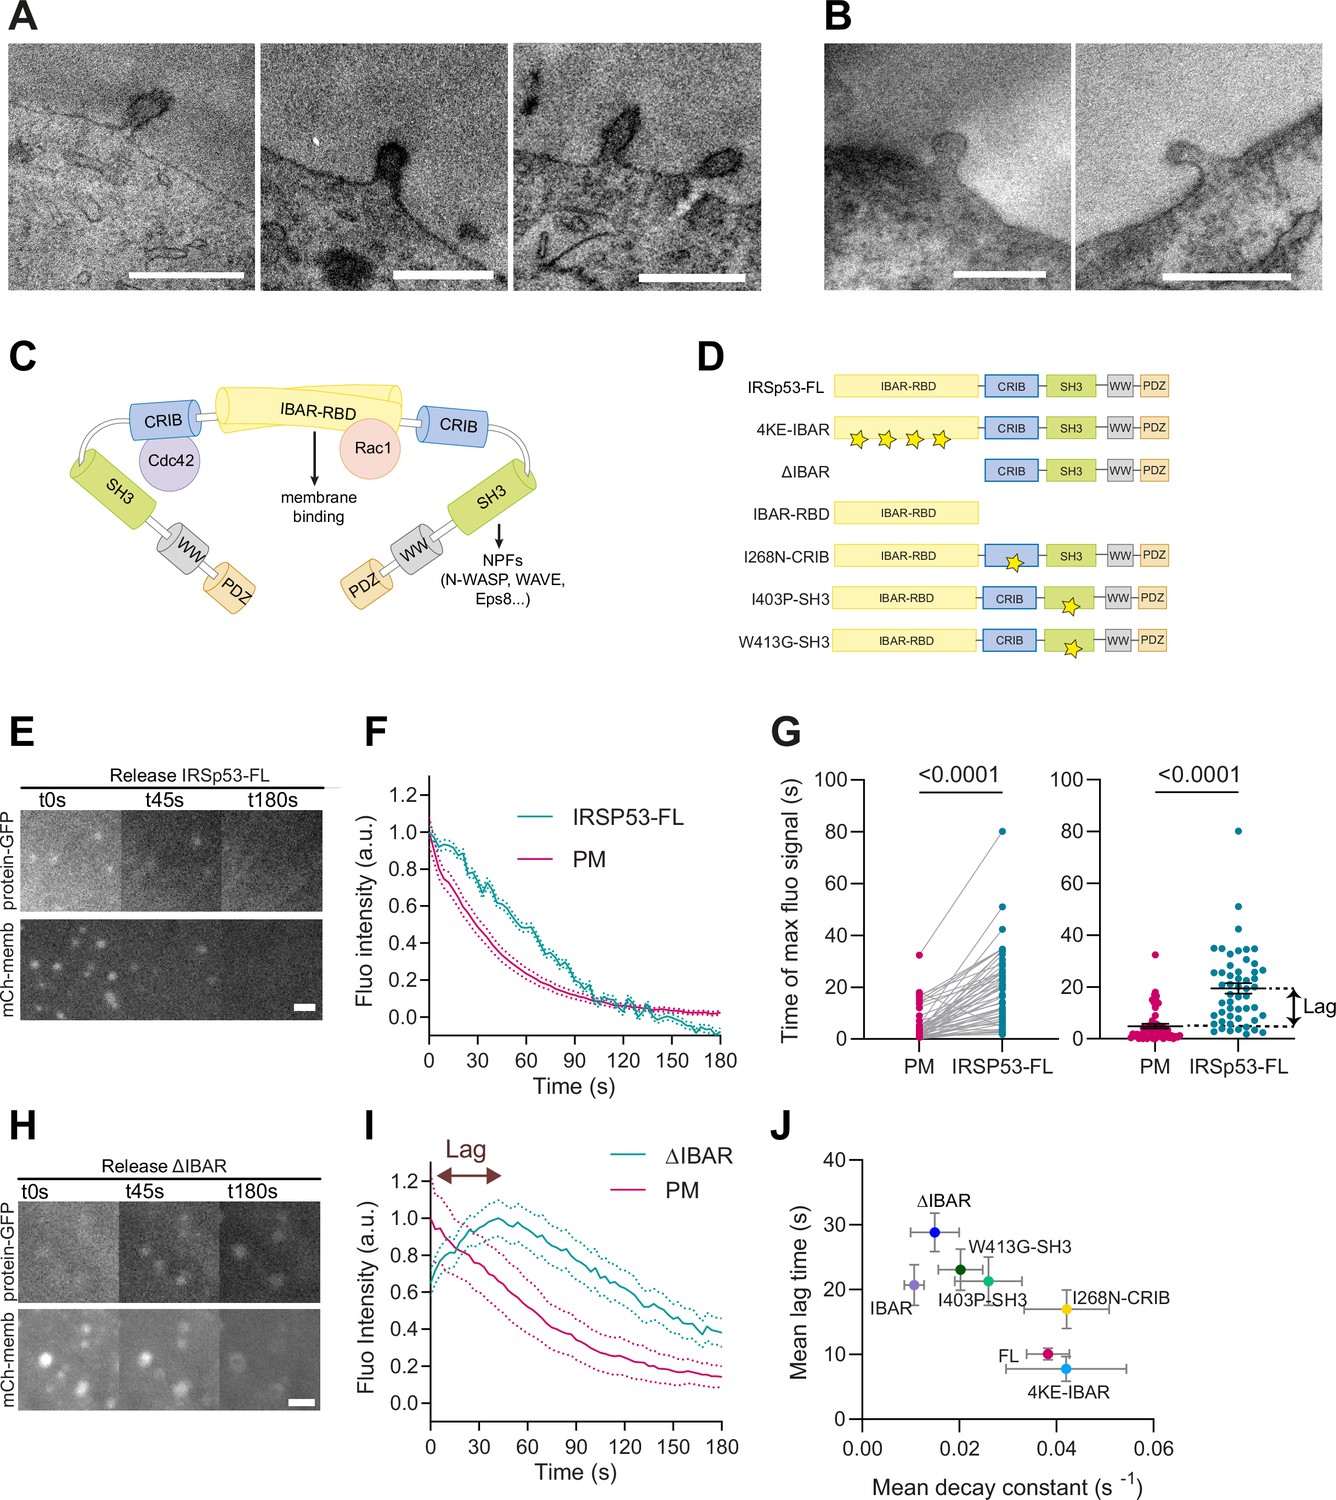
I-BAR and SH3 domains of IRSp53 regulate the resorption of plasma membrane (PM) evaginations.
(A, B) Transmission electron microscopy (TEM) images of PM evaginations coming from cells co-transfected with either APEX-GBP and (A) EGFP-IRSP53-FL or (B) control condition mito-GFP. APEX staining can be observed at the PM evaginations of EGFP-IRSp53-FL-transfected cells marking IRSp53 position. Scale bars are 500 nm. (C) Schematics representing the I-BAR protein IRSp53 and the different molecules interacting with its different domains. (D) Schematics of the IRSp53 mutants used in this study. Stars denote the location of mutations impairing the function of the different domains. (E–F) Images and dynamics of PM after stretch release of IRSp53-/-R cells transfected with mCh-membrane and FL form of IRSp53 coupled to EGFP. N=53 cells from 12 independent experiments. Scale bar is 2 μm. (G) Timepoint of maximal fluorescence intensity of PM and FL form of IRSp53 coupled to EGFP (left, paired plot; right, dot plot with mean). Statistical significance was assessed through paired Wilcoxon test. N=51 cells from 11 independent experiments. (H, I) Images and dynamics of PM after stretch release of IRSp53-/-R cells transfected with mCh-membrane and ΔI-BAR form of IRSp53 coupled to EGFP. The purple arrow indicates the lag between the PM and IRSp53 signals, that is, the time difference between the peaks of maximum intensity of both markers. N=12 cells from 3 independent experiments. Scale bar is 2 μm. (J) Time lag of FL or mutated IRSp53 plotted against the decay constant (see Figure 2—figure supplement 1 for n numbers, statistical analyses, and detailed data for each construct). Data show mean ± s.e.m.
-
Figure 3—source data 1
Raw data of Figure 3 graphs and plots.
- https://cdn.elifesciences.org/articles/72316/elife-72316-fig3-data1-v2.xlsx
Figure 3—figure supplement 1
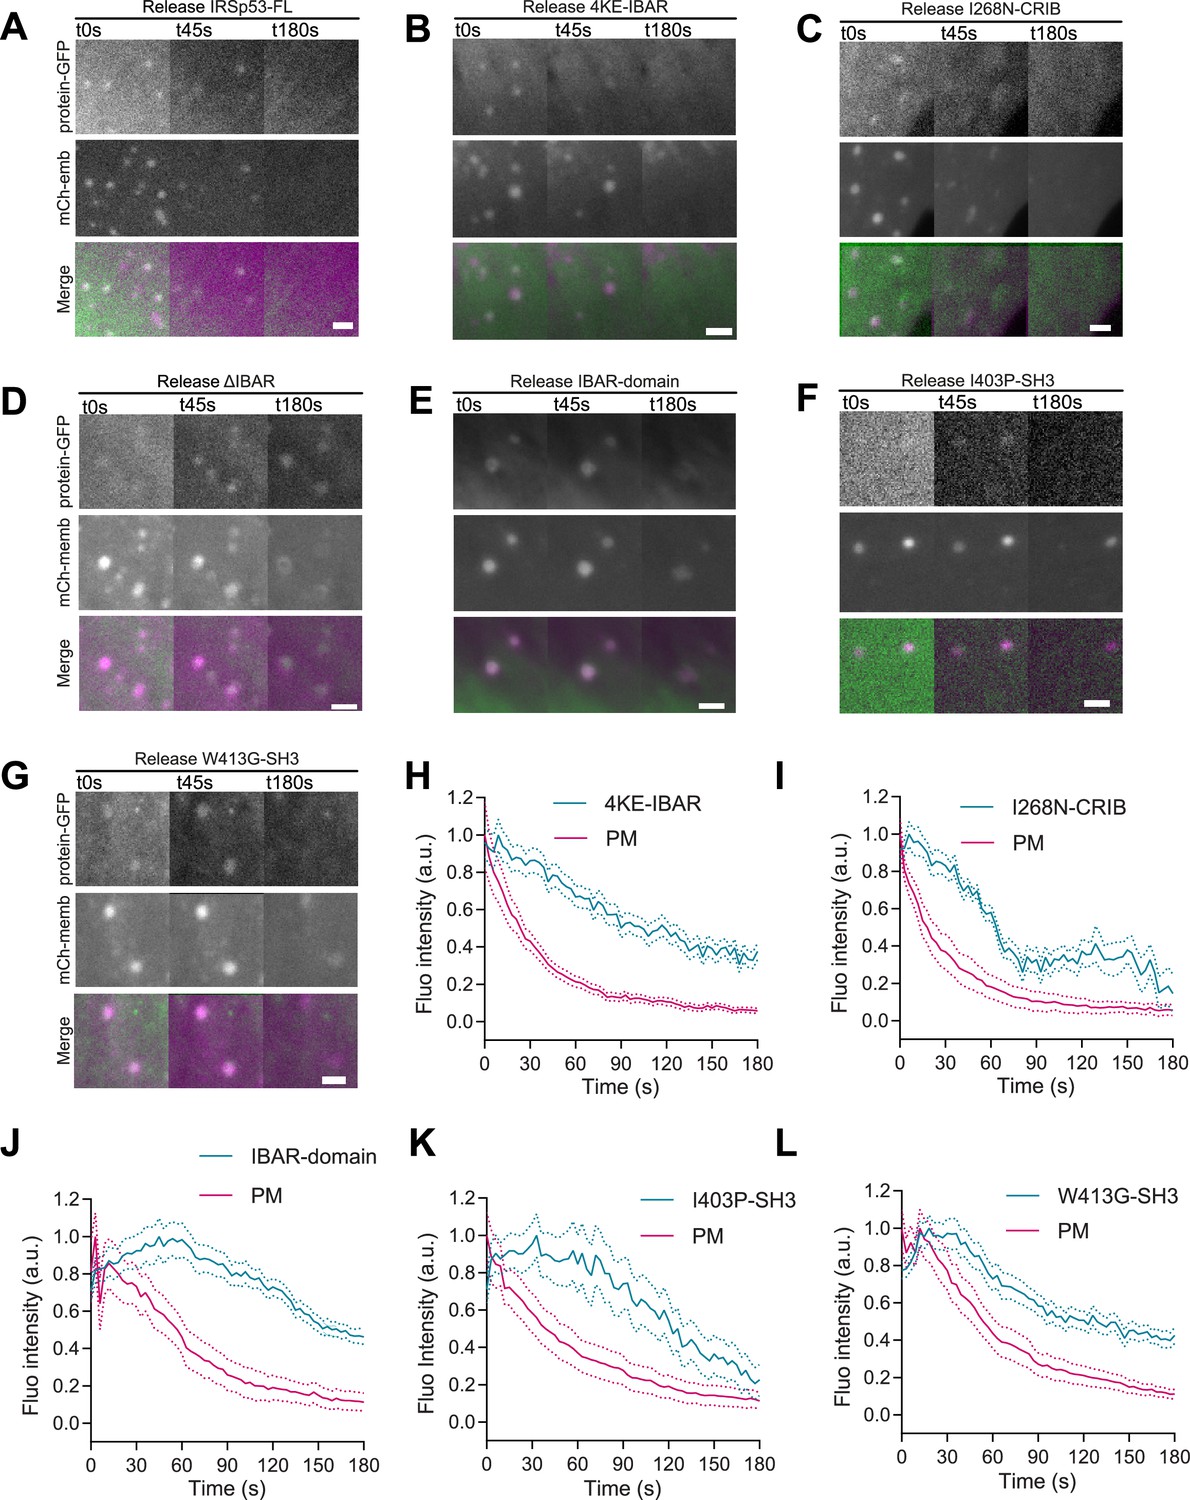
Additional data on IRSp53 mutants.
(A–G) Images of IRSp53-/- cells after stretch release transfected with mCh-membrane and either the FL form of IRSp53 or different mutant forms of the protein coupled to EGFP. Scale bars are 2 μm. (H–L) Corresponding dynamics of plasma membrane (PM) evaginations upon stretch release quantified through mCh-membrane or GFP coupled to the different IRSp53 mutants. N = 15, 13, 14, 9 12, and 16 cells from 3, 3, 2, 3, 3, and 3 independent experiments. Data show mean ± s.e.m.
-
Figure 3—figure supplement 1—source data 1
Raw data of Figure 3—figure supplement 1 graphs and plots.
- https://cdn.elifesciences.org/articles/72316/elife-72316-fig3-figsupp1-data1-v2.xlsx
Figure 3—figure supplement 2
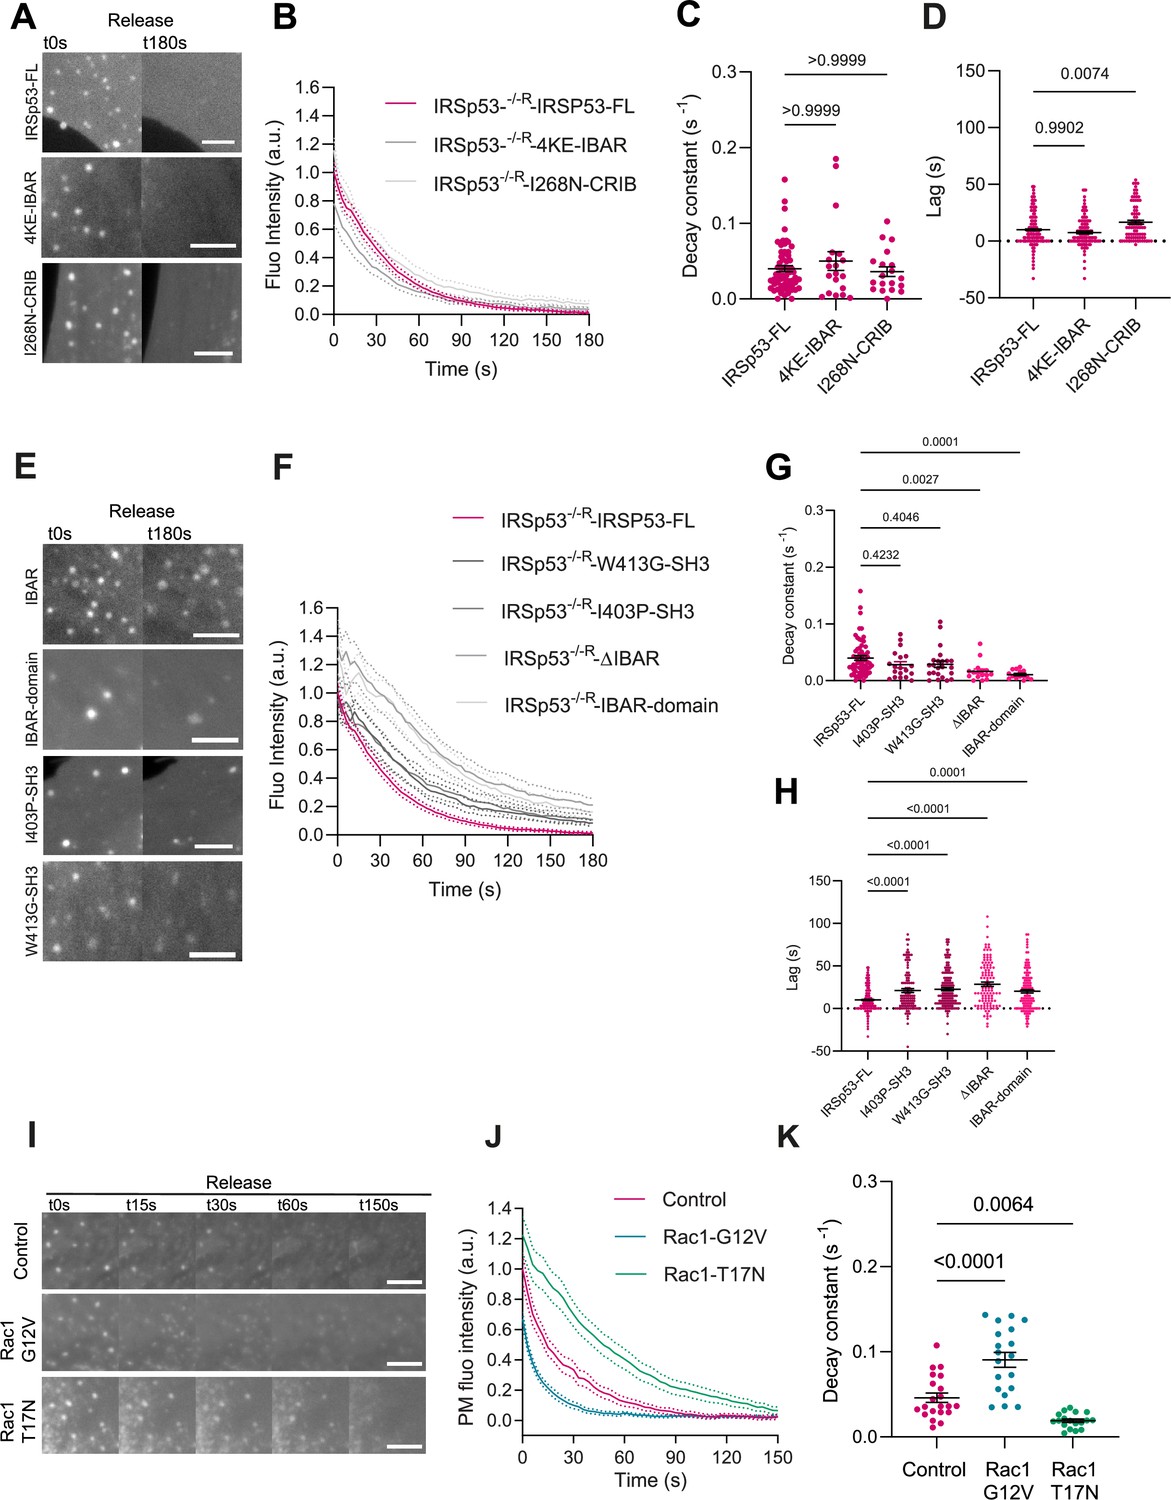
Additional data on IRSp53 mutants.
(A) Images of plasma membrane (PM) evaginations of IRSp53-/-R cells transfected with mCh-membrane in combination with the different full length or mutant forms of EGFP-IRSp53 that do not affect PM recovery after stretch. Images show the first (t0 s) and last (t180 s) timepoint of acquisition after stretch. Scale bars are 5 μm. (B) Corresponding time course dynamics corresponding to (A) of PM evaginations. (C, D) Quantification of the decay constants and lag times of (A) after the release of stretch. Statistical significance was assessed through Kruskal-Wallis tests. N = 62, 19, and 19 cells from 11, 3, and 3 independent experiments. (E) Images of PM evaginations of IRSp53-/-R cells transfected with mCh-membrane in combination with the different full length or mutant forms of EGFP-IRSp53 that do affect PM recovery after stretch. Images show the first (t0 s) and last (t180 s) timepoint of acquisition after stretch. Scale bars are 5 μm. (F) Corresponding time course dynamics corresponding to (E) of PM evaginations. (G, H) Quantification of the decay constants and lag times of (E) after the release of stretch. Statistical significance was assessed through Kruskal-Wallis tests. N=62, 16, 19, 14, and 23 cells from 11, 3, 3, 2, and 3 independent experiments. (I) Time course images of PM evaginations after stretch release on normal human dermal fibroblast (NHDF) expressing a PM marker alone, or a PM marker plus either a constitutively active (G12V) or a dominant negative (T17N) form of Rac1. PM was tagged with GFP-membrane marker. (J) Corresponding quantification of evagination resorption dynamics after stretch. (K) Time constants resulting from the exponential fitting of the curves in panel (J). Statistical significance was assessed through one-way ANOVA. N=21, 19, and 19 cells from 4 independent experiments. Data show mean ± s.e.m.
-
Figure 3—figure supplement 2—source data 1
Raw data of Figure 3—figure supplement 2 graphs and plots.
- https://cdn.elifesciences.org/articles/72316/elife-72316-fig3-figsupp2-data1-v2.xlsx
Figure 4 with 1 supplement
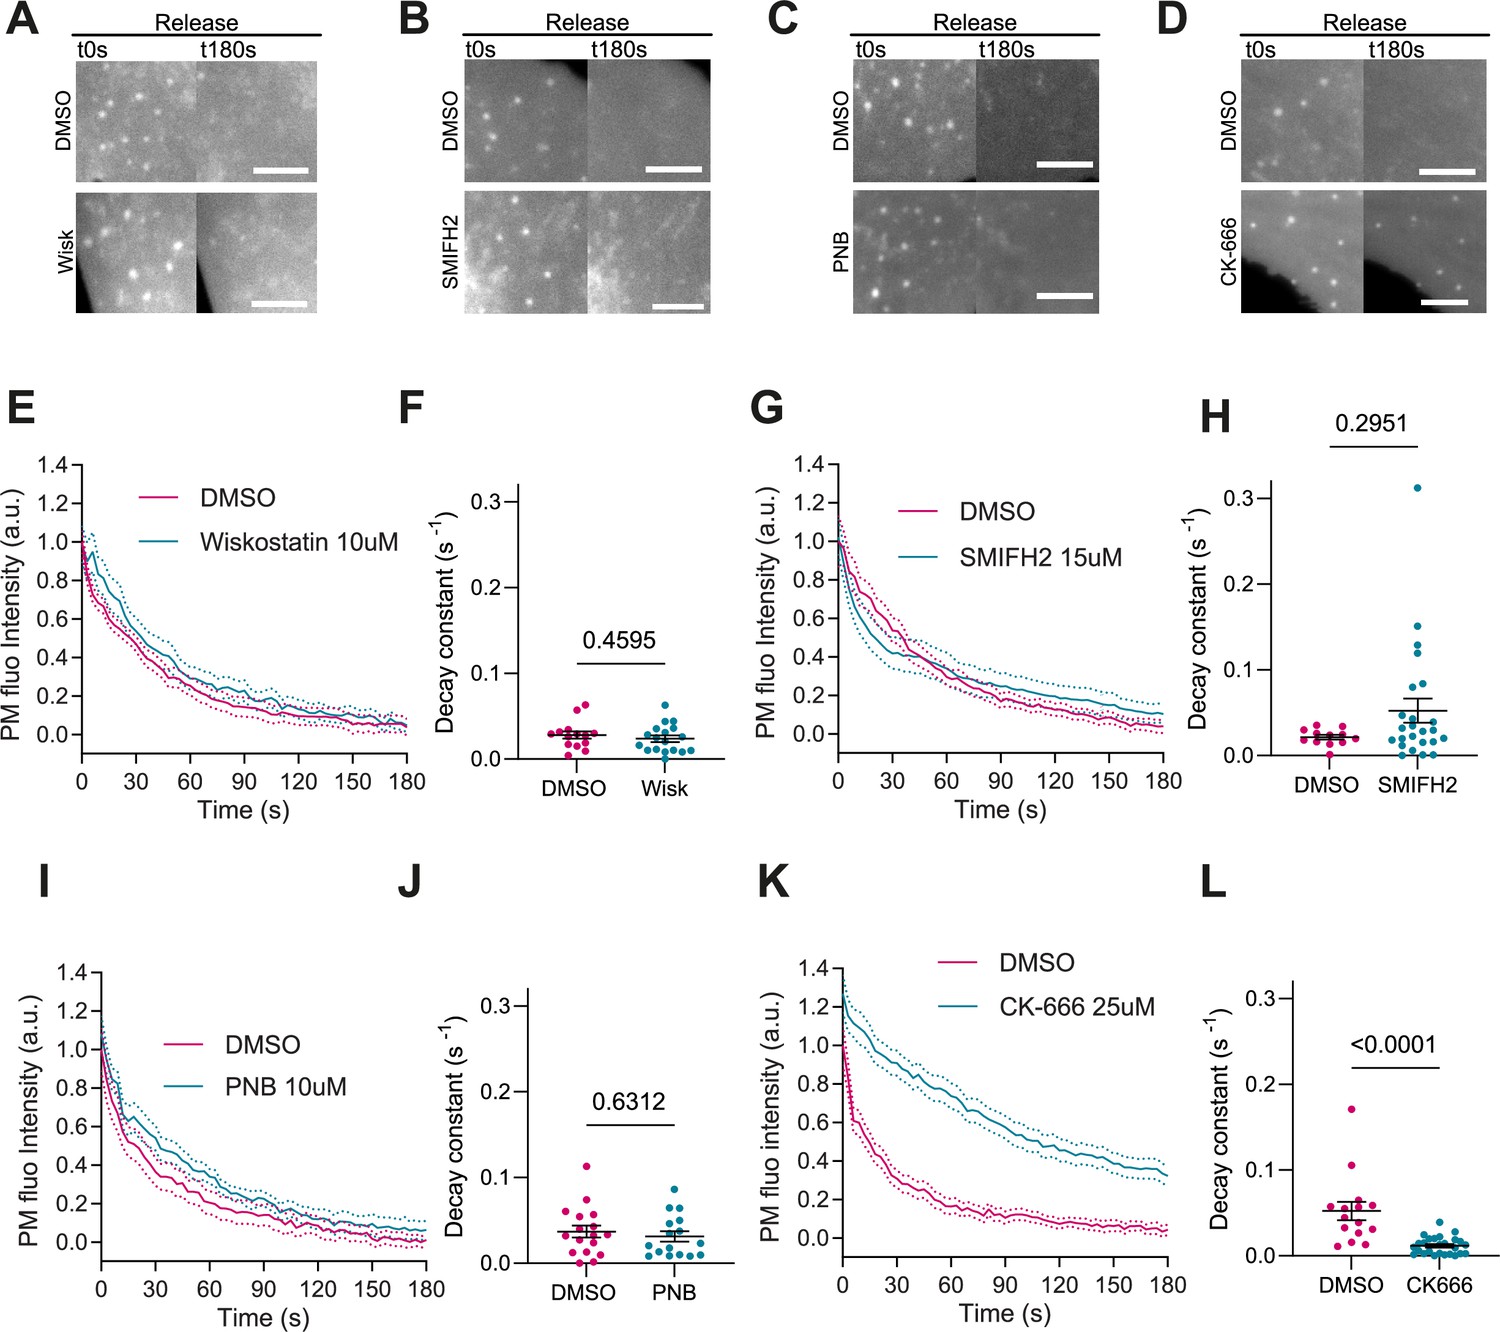
Actin polymerization is Arp2/3 dependent, myosin independent.
(A–D) Images after stretch release of plasma membrane (PM) evaginations, for IRSp53-/-R cells treated with either vehicle (DMSO) or 10 μM Wiskostatin, 15 μM SMIFH2, 10 μM PNB, and 25 μM CK-666, respectively. Scale bars are 5 μm. PM is marked with EGFP-membrane. (E–L) Corresponding dynamics of PM evaginations and quantification of the decay constants between DMSO-treated control cells and drug-treated cells. Statistical significance was assessed through unpaired t-test for Wiskostatin and PNB against their respective controls, and Mann-Whitney test for CK-666 and SMIFH2 against their respective controls. For Wiskostatin, N=18 and 14 cells, SMIFH2, N=24 and 12 cells, PNB, N=19 and 17 cells, and CK-666, N=26 and 15 cells from 3 independent experiments for all cases.
-
Figure 4—source data 1
Raw data of Figure 4 graphs and plots.
- https://cdn.elifesciences.org/articles/72316/elife-72316-fig4-data1-v2.xlsx
Figure 4—figure supplement 1
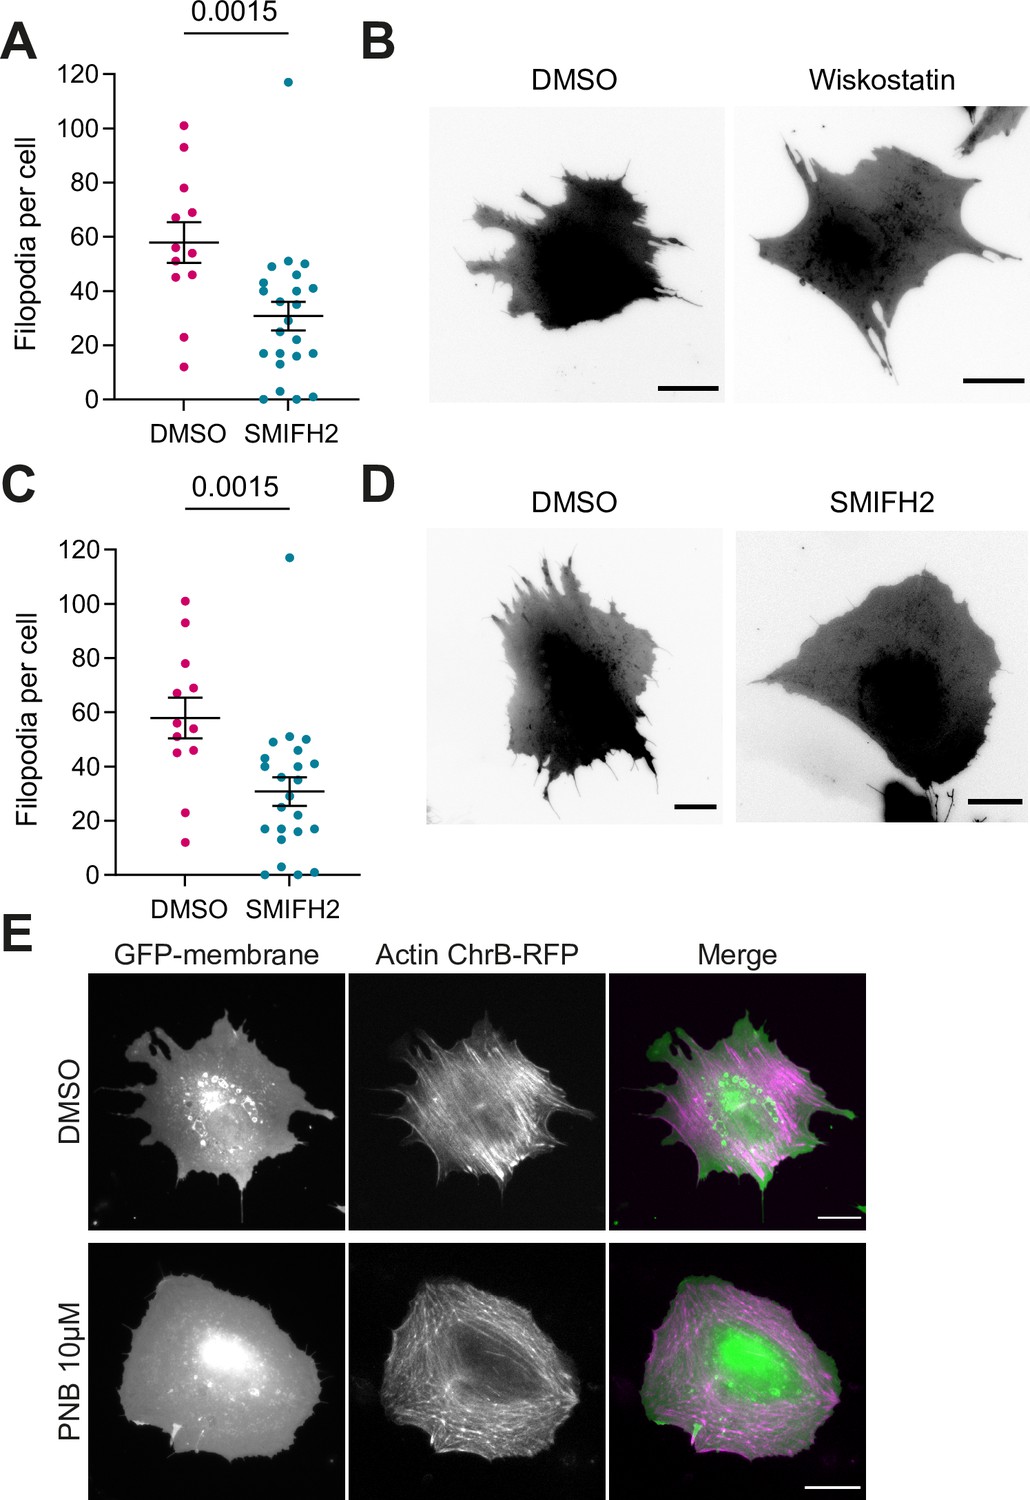
Controls of drug treatment in IRSp53-/-R mouse embryonic fibroblast (MEF).
(A) Number of filopodia per cell in 15 μM SMIFH2 or vehicle (DMSO)-treated cells. Compound was incubated for 1 hr at 37°C before experiments. N=24 and 13 cells form 4 independent experiments. Statistical significance was assessed through Mann-Whitney test. (B) Corresponding images of GPF-membrane-transfected cells. (C) Number of filopodia per cell in 10 μM Wiskostatin or vehicle (DMSO)-treated cells. Compound was incubated for 30 min at 37°C before experiments. N=18 and 14 cells respectively from 3 independent experiments. Statistical significance was assessed through unpaired t-test. (D) Corresponding images of GPF-membrane-transfected cells. (E) IRSp53-/-R MEF after 30 min incubation at 37°C with either 10 μM PNB or vehicle (DMSO)-treated cells. Cells were transfected with GFP-membrane and Actin Chromobody-RFP to mark both plasma membrane (PM) and actin. For all images scale bar is 20 μm. Data show mean ± s.e.m.
-
Figure 4—figure supplement 1—source data 1
Raw data of Figure 4—figure supplement 1 graphs and plots.
- https://cdn.elifesciences.org/articles/72316/elife-72316-fig4-figsupp1-data1-v2.xlsx
Figure 5 with 2 supplements
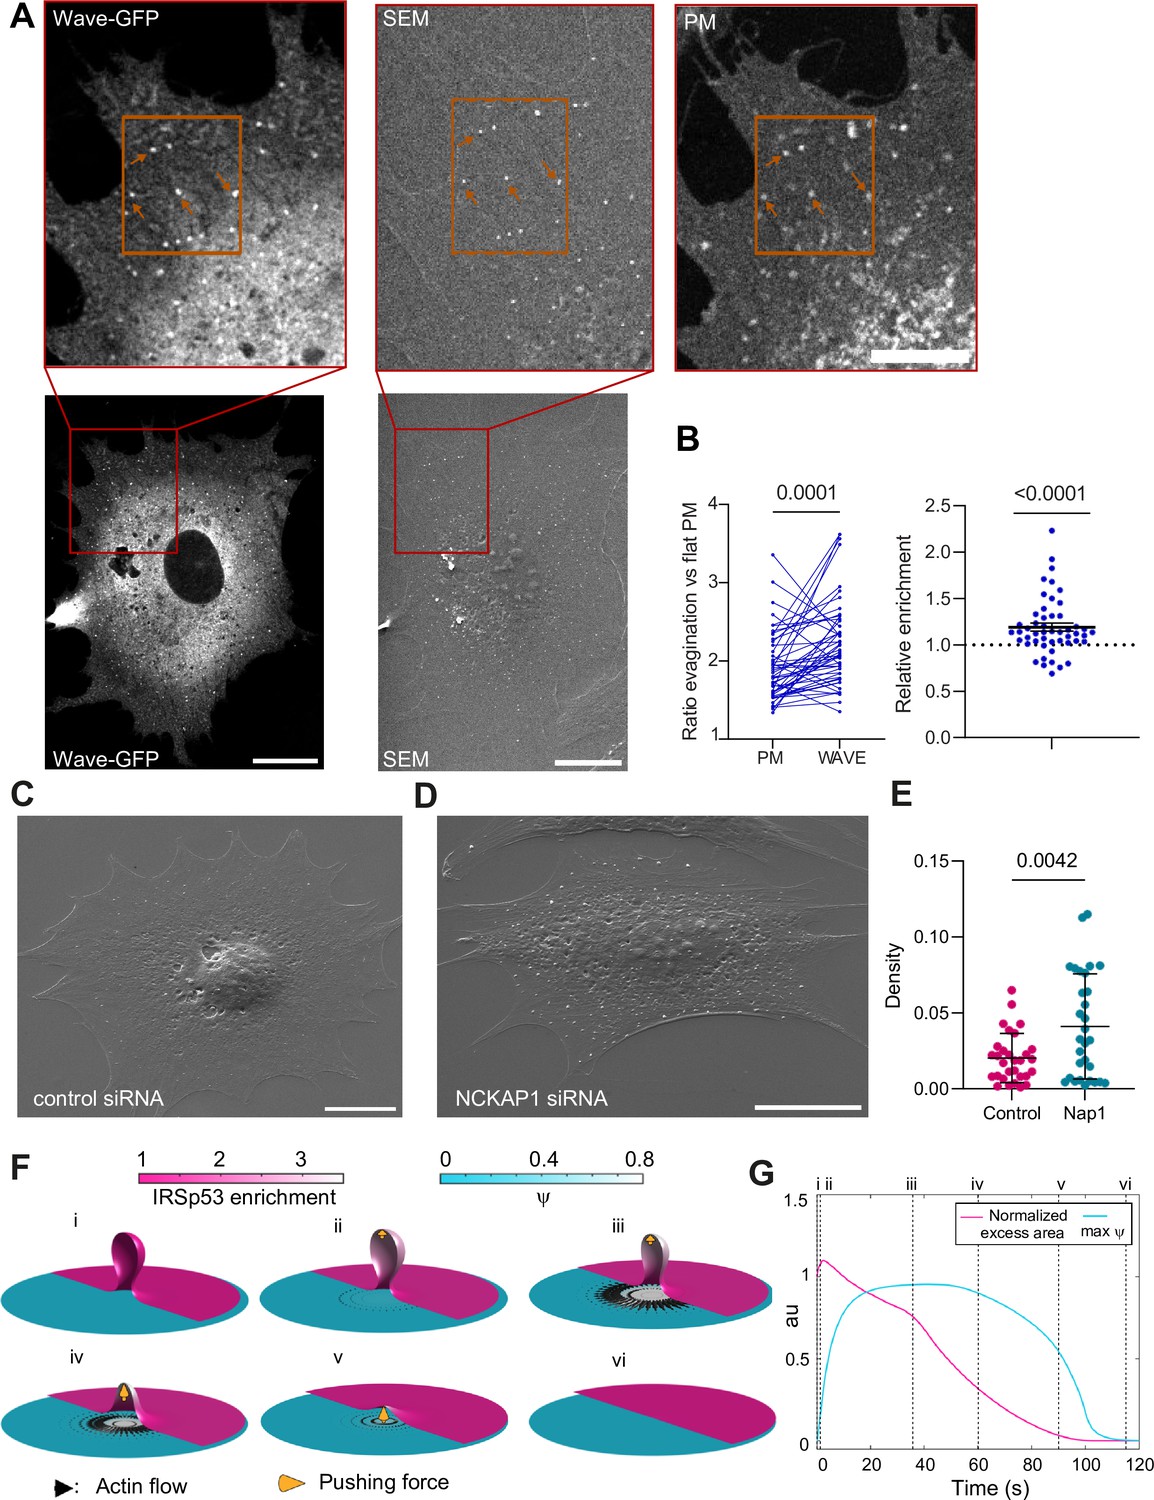
The WAVE regulatory complex (WRC) is enriched at the evagination.
(A) Correlated fluorescence and scanning electron microscopy (SEM) images of plasma membrane (PM) evaginations after stretch release, for IRSp53-/-R cells transfected with mCherry-membrane and WAVE-C-GFP. Scale bars are 10 μm in the full cell image, 5 μm in the inserts (red frame). (B) Left: Quantification of the evagination/flat membrane fluorescence ratio in WAVE-GFP and mCherry-membrane fluorescence channels. Right: Corresponding WRC enrichment in the evagination (ratio of ratios). Statistical significance was assessed through Wilcoxon and one-sample t-test respectively. N=50 evaginations. Data show mean ± s.e.m (C, D) SEM images of PM evaginations 25 s after stretch release for IRSp53-/-R cells respectively treated with a non-targeting siRNA or a siRNA against Nap1. Scale bars are 10 μm. (E) Quantification of the number of evaginations per µm2 of cell membrane area, on cells fixed 25 s after stretch release. The graph shows the density for IRSp53-/-R cells respectively treated with a non-targeting siRNA or a siRNA against Nap1. Statistical significance was assessed through unpaired t-test. N=30 cells from 3 independent experiments. Data show mean ± s.e.m (F) Dynamics of the model of chemo-mechanical signaling, showing the local enrichment of IRSp53 from a baseline value of 1 (magenta, right side of images) and the concentration of an actin regulator ψ (cyan, left side of images). After the formation of the evagination (i), IRSp53 becomes enriched in the bud, which triggers the local increase in the concentration of actin regulator ψ and free growth of branched network which contacts the membrane tip (indicated b yellow arrow) within 2 s (ii) followed by build-up of actin regulator ψ over 10 s, thus creating a tension gradient and subsequent centrifugal cortex flow dragging the membrane outward. Because this centrifugal flow flattens the evagination of the inextensible membrane, it is resisted by the pushing force from the branched network as it transits from a closed to an open neck (iii), (iv). As the bud snaps-open and reduces in curvature, the enrichment of IRSp53 in protrusion is lowered and hence leads to reduction in ψ (v). Once planarity is restored, the IRSp53 domain rapidly disassembles, the actin regulator recovers its steady state, and the flow ceases (vi). (G) Evolution of PM excess area contained in the evagination (where 0 corresponds to a flat membrane patch) and actin regulator concentration ψ. Timepoints corresponding to configurations shown in (F) are indicated in roman numerals. Excess area is normalized such that 1 corresponds to the initial state and ψ is normalized to a maximum of 1.
-
Figure 5—source data 1
Raw data of Figure 5 graphs and plots.
- https://cdn.elifesciences.org/articles/72316/elife-72316-fig5-data1-v2.xlsx
Figure 5—figure supplement 1
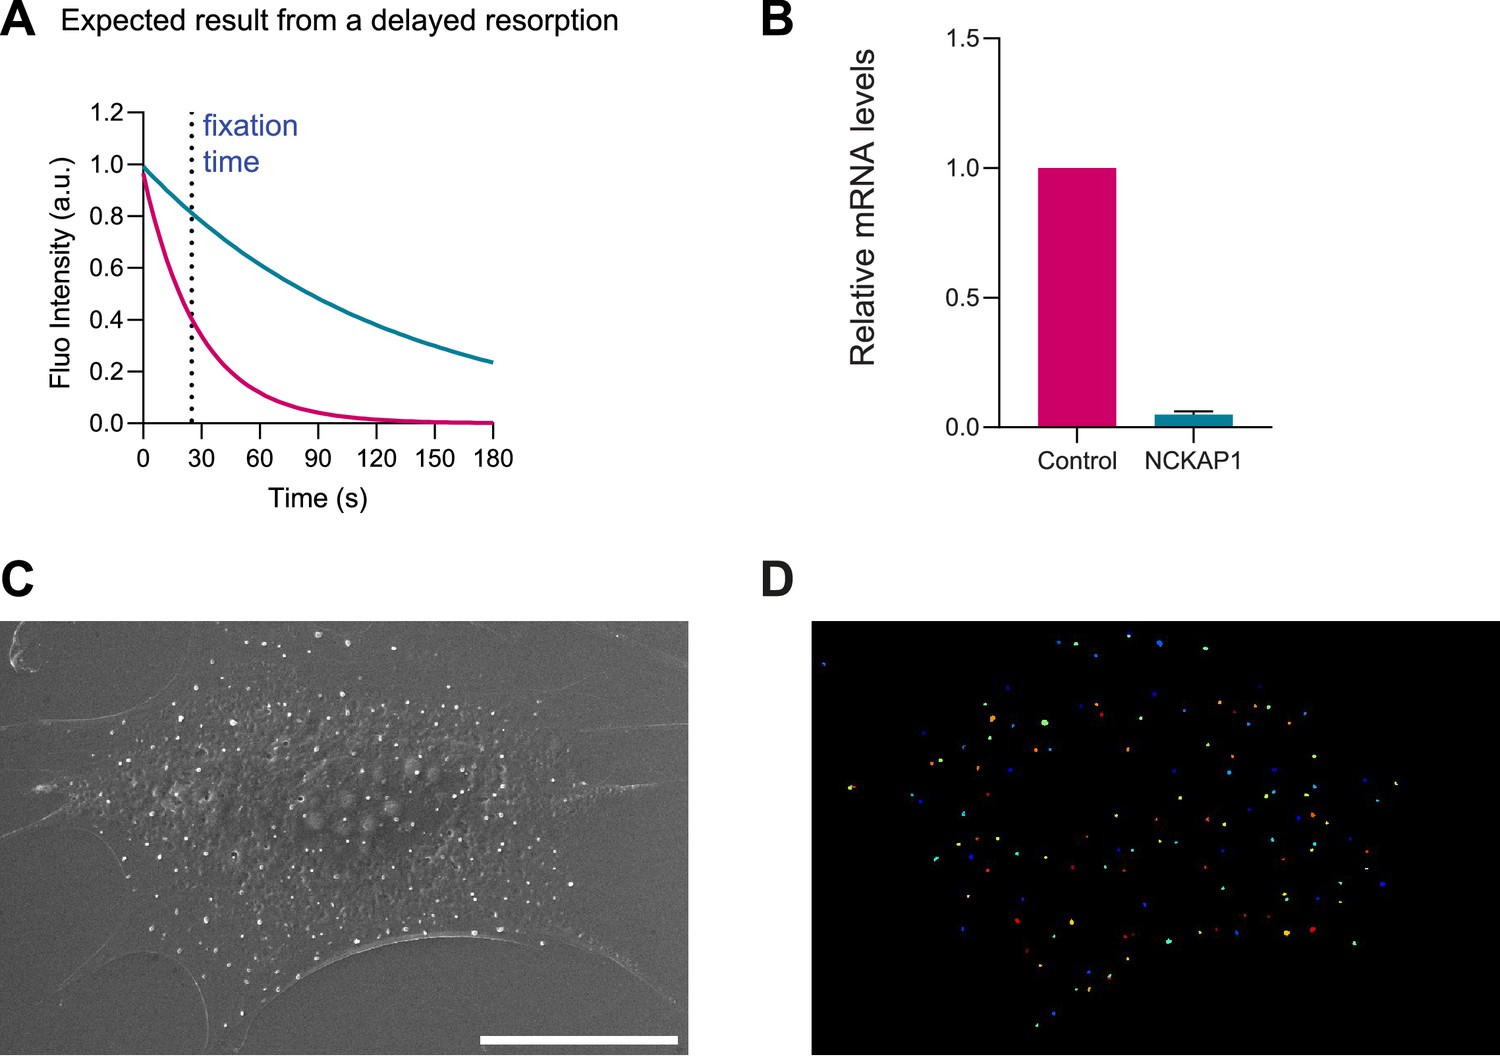
Controls of siRNA treatment with Nap 1 in IRSp53-/-R mouse embryonic fibroblast (MEF).
(A) Schematics of a putative impaired resorption (green line versus normal resorption in magenta), marking the fixation time chosen for scanning electron microscopy (SEM) imaging. (B) RT-PCR in controlled and Nap1 silenced cells. N=3 independent experiments. (C, D) Example of a SEM image and its corresponding particle identification to count the number of evaginations per cell. Scale bar is 10 μm. Data show mean ± s.e.m.
-
Figure 5—figure supplement 1—source data 1
Raw data of Figure 5—figure supplement 1 graphs and plots.
- https://cdn.elifesciences.org/articles/72316/elife-72316-fig5-figsupp1-data1-v2.xlsx
Figure 5—figure supplement 2
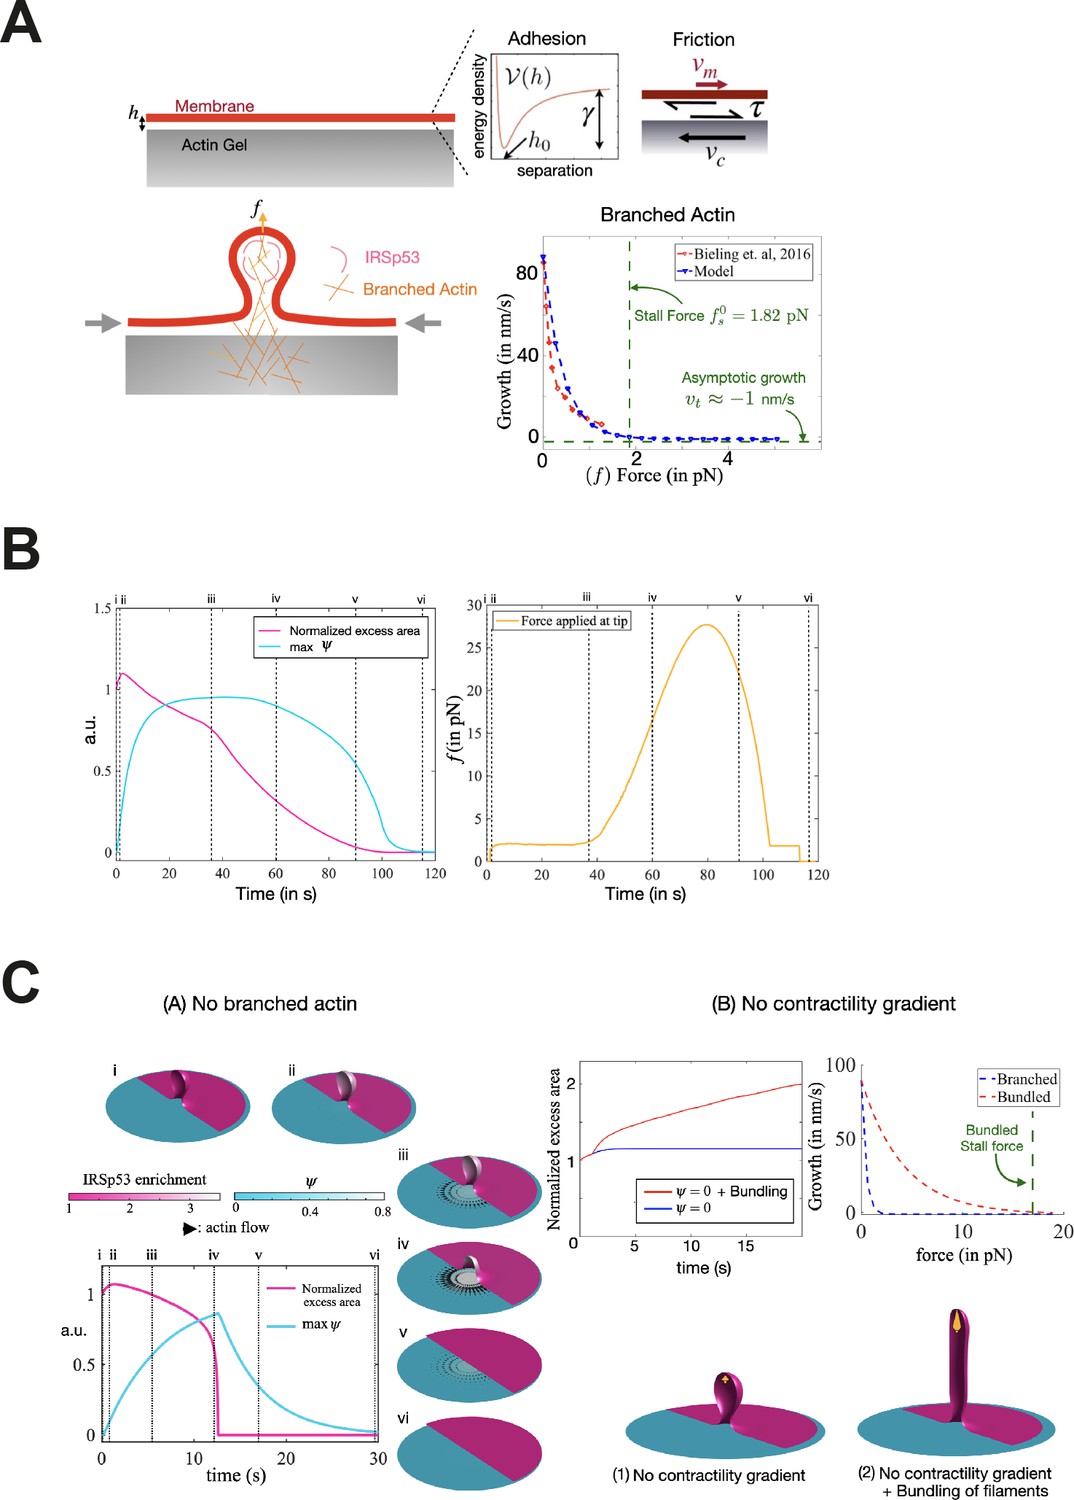
Considerations for the model.
(A) (Top) Schematic of the interaction between the membrane and the 2D underlying cortex, separated by a distance h before evaginations form. The interaction is modeled through an adhesion potential ν(h) with a minimum at separation h0, with adhesion tension γ and a tangential fictional traction τ in the adhered part of the membrane proportional to the slippage velocity vm – vc. (Bottom) The actin cortex is presumed to be a combination of contractile and branched extensile networks. A membrane protrusion becomes site for IRSp53-mediated signaling that leads to Arp2/3-mediated branched actin network polymerization, which locally reduces lateral network contractility. Concomittantly, this branched network grows perpendicular to the membrane plane with a force-dependent polymerization velocity fit to experimental data obtained from Bieling et al., 2016. (B) Evolution of plasma membrane (PM) excess area contained in the evagination (where 0 corresponds to a flat membrane patch), actin regulator concentration ψ, and pushing force in pN applied by the branched filaments onto the membrane tip. Timepoints corresponding to configurations shown in Figure 5F are indicated in roman numerals. Excess area is normalized such that 1 corresponds to the initial state and ψ is normalized to a maximum of 1. (C) Alternative scenarios for the interaction between local actin polymerization and membrane evagination. (A) In the absence of an outward pushing force due to polymerization of branched actin, the evaginated buds flatten flowing a similar mechanism as in Figure 5F but much faster due to a mechanical snapping of the bud. (B) In the absence of a gradient in contractility of the underlying cortex, the pushing forces are strong enough to sustain the evaginated bud (1). By considering a larger stall force, for example due to actin bundling (red curve in the growth-force relation), outward polymerization forces can elongate bud evaginations into elongated tubes.
Author response image 1
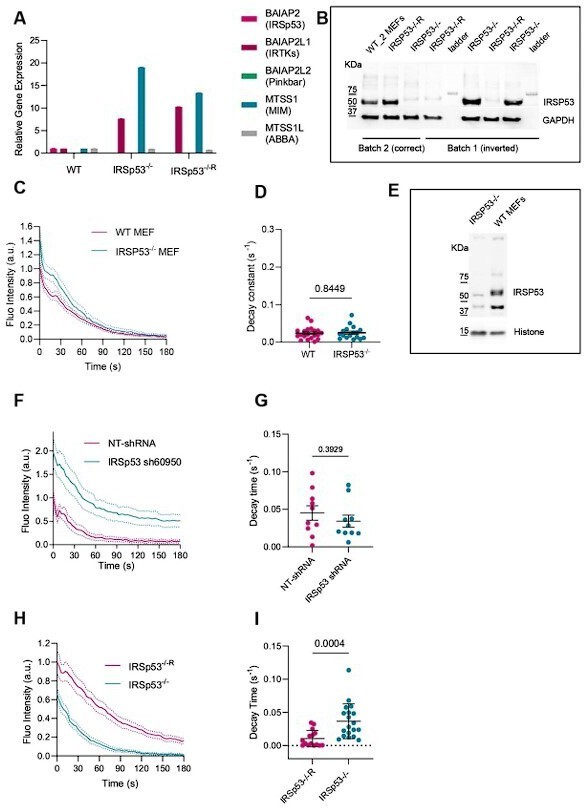
(A) RT-PCR from cell lysates of WT, IRSP53-/-, IRSP53-/- silenced with IRTKs using CRISPR-Cas9 (clone F3) (B) Western blot image from cell lysates incubated with anti-IRSp53 antibody of WT, IRSP53-/-, IRSP53-/-R from the different batches of MEF cells used. Representative images of 3 experiments. (C) Quantification dynamics of mCherry-membrane tagged PM evaginations after stretch release in WT or IRSp53-/- MEF cells. N = 18 and 17 cells from 2 independent experiments. (D) Corresponding quantification of the decay constants of WT or IRSp53-/- MEF cells. Significance was calculated through Mann-Whitney test. N = 20 and 17 cells from 2 independent experiments. (E) Western blot image of WT, IRSP53-/- cell lysates used in C, D. Representative western blot of 3 experiments. (F) Quantification dynamics of mCherry-membrane tagged PM evaginations after stretch release in NHDF stable cell lines transfected with non-targeting shRNA or IRSp53-shRNA. N = 10 cells in each case. (G) Corresponding quantification of the decay constants of NHDF stable cell lines transfected with non-targeting shRNA or IRSp53-shRNA. Significance was calculated through unpaired t-test. N = 10 in each case. (H) Quantification dynamics of mCherry-membrane tagged PM evaginations after stretch release in IRSp53-/- or IRSp53-/-R MEF cells. N = 15 and 19 cells from 3 independent experiments. (I) Corresponding quantification of the decay constants of IRSp53-/- or IRSp53-/-R MEF cells. Significance was calculated through Mann-Whitney test. N = 15 and 19 cells from 3 independent experiments. Data show mean ± s.e.m.
Videos
Video 1
Time lapse of a normal human dermal fibroblast (NHDF) cell labeled with GFP-membrane before, during, and after stretch application.
Images on the right side show a magnification of the areas marked in red on the left side.
Video 2
Time lapse of a normal human dermal fibroblast (NHDF) cell labeled with Actin Chromobody-GFP (ACG) and mCherry-membrane, before, during, and after stretch application.
Images on the right side show a magnification of the areas marked in red on the left side.
Video 3
Time lapse of a normal human dermal fibroblast (NHDF) cell labeled with mEmerald-Ezrin and mCherry-membrane, before, during, and after stretch application.
Images on the right side show a magnification of the areas marked in red on the left side.
Video 4
Time lapse of an IRSp53-/-R mouse embryonic fibroblast (MEF) cell, with EGFP-IRSp53-FL overexpression, and labeled with mCherry-membrane, before, during, and after stretch application.
Images on the right side show a magnification of the areas marked in red on the left side.
Video 5
Time lapse of an IRSp53-/-R mouse embryonic fibroblast (MEF) cell, with EGFP-IRSp53-I268N overexpression, and labeled with mCherry-membrane, before, during, and after stretch application.
Images on the right side show a magnification of the areas marked in red on the left side.
Video 6
Time lapse of an IRSp53-/-R mouse embryonic fibroblast (MEF) cell, with EGFP-IRSp53-ΔI-BAR overexpression, and labeled with mCherry-membrane, before, during, and after stretch application.
Images on the right side show a magnification of the areas marked in red on the left side.
Video 7
Time lapse of an IRSp53-/-R mouse embryonic fibroblast (MEF) cell, with EGFP-IRSp53-I408P overexpression, and labeled with mCherry-membrane, before, during, and after stretch application.
Images on the right side show a magnification of the areas marked in red on the left side.
Video 8
Time lapse of an IRSp53-/-R mouse embryonic fibroblast (MEF) cell, with EGFP-IRSp53-I408P overexpression, and labeled with mCherry-membrane, before, during, and after stretch application.
Images on the right side show a magnification of the areas marked in red on the left side.
Video 9
Time lapse of an IRSp53-/-R mouse embryonic fibroblast (MEF) cell, with EGFP-IRSp53-W413G overexpression, and labeled with mCherry-membrane, before, during, and after stretch application.
Images on the right side show a magnification of the areas marked in red on the left side.
Video 10
Time lapse of an IRSp53-/-R mouse embryonic fibroblast (MEF) cell, with EGFP-I-BAR overexpression, and labeled with mCherry-membrane, before, during, and after stretch application.
Images on the right side show a magnification of the areas marked in red on the left side.
Video 11
Time lapse of an IRSp53-/-R mouse embryonic fibroblast (MEF) cell treated with 10 µM Wiskostatin and labeled with EGFP membrane, before, during, and after stretch application.
Images on the right side show a magnification of the areas marked in red on the left side.
Video 12
Time lapse of an IRSp53-/-R mouse embryonic fibroblast (MEF) cell treated with 15 µM SMIFH2 and labeled with EGFP membrane, before, during, and after stretch application.
Images on the right side show a magnification of the areas marked in red on the left side.
Video 13
Time lapse of an IRSp53-/-R mouse embryonic fibroblast (MEF) cell treated with 10 µM para-nitroblebbistatin and labeled with EGFP membrane, before, during, and after stretch application.
Images on the right side show a magnification of the areas marked in red on the left side.
Video 14
Time lapse of an IRSp53-/-R mouse embryonic fibroblast (MEF) cell treated with 25 µM CK-666 and labeled with EGFP membrane, before, during, and after stretch application.
Images on the right side show a magnification of the areas marked in red on the left side.
Tables
Table 1
List of IRSp53 mutants used in the experiments.
| Mutant name | Domain affected | Description | Expected effect |
|---|---|---|---|
| IRSP53-4KE | I-BAR | Replace charged lysine by neutral glycine of I-BAR | Decreased electrostatically mediated IRSP53/plasma membrane binding Suetsugu et al., 2006b; Mattila et al., 2007 |
| IRSP53-I268N | CRIB | Loss of function in CRIB | Impaired CDC42 interaction |
| IRSP53-I403P | SH3 | Loss of function in SH3 | Impaired interactions with SH3 interactors, including WAVE2 (Choi et al., 2005), VASP, and Eps8 (Disanza et al., 2013; Disanza et al., 2006) |
| IRSP53-W413G | SH3 | Prevents correct folding of the SH3 domain | |
| I-BAR | SH3+CRIB | Absence of SH3 and CRIB domains | Impaired interactions with SH3 and CRIB interactors |
| ΔI-BAR | I-BAR | Absence of I-BAR | Impaired I-BAR-mediated plasma membrane binding and impaired Rac1 binding |
Appendix 1—key resources table
| Reagent type (species) or resource | Designation | Source or reference | Identifiers | Additional information |
|---|---|---|---|---|
| Cell line (Homo sapiens) | Dermal fibroblast (normal, Adult) | Lonza | CC-2511 | Designated as NHDF in the paper |
| Cell line (Mus musculus) | WT MEF | Giorgio Scita Lab. DOIs: 10.1038/emboj.2013.208; 10.1016 /j.chom.2009.02.003 | See first section of Materials and methods | |
| Cell line (M. musculus) | IRSp53-/- MEF | Giorgio Scita Lab. DOIs: 10.1038/emboj.2013.208; 10.1016 /j.chom.2009.02.003; 10.1074/jbc.M808425200 | See first section of Materials and methods | |
| Cell line (M. musculus) | IRSp53-/-R MEF | Giorgio Scita Lab. DOIs: 10.1038/emboj.2013.208 | See first section of Materials and methods | |
| Cell line (M. musculus) | IRSp53-/- C/C9 IRTKS MEF | This paper, Giorgio Scita Lab. | See first section of Materials and methods | |
| Transfected construct (mouse) | siRNA to Nap1 (SMARTpool) | Dharmacon | ON-TARGETplus Mouse Nackp1 50884 | 50 nM |
| Transfected construct (mouse) | siRNA non targeting #3 (SMARTpool) | Dharmacon | ON-TARGETplus Non-targeting #3 | 50 nM |
| Antibody | Anti-BAIAP2, anti-IRSp53 (Rabbit polyclonal) | Sigma-Aldrich | HPA023310 | WB 1:200, used in Author response image 1 |
| Antibody | Anti-IRSp53 (Mouse monoclonal) | Giorgio Scita Lab 10.1038/emboj.2013.208 | WB 5 µg/ml, used in Figure 2—figure supplement 1 | |
| Antibody | Anti-IRTKS (Mouse polyclonal) | Jan Faix Lab 10.1073/pnas.221743712 | WB (1:500); used in Figure 2—figure supplement 1 | |
| Recombinant DNA reagent | mEmerald-Ezrin (plasmid) | Addgene | #54090 | |
| Recombinant DNA reagent | Actin-Chromobody plasmid (TagRFP) (plasmid) | Chromotek | Proteintech ACR | |
| Recombinant DNA reagent | mKate2-P2A-APEX2-csGBP (plasmid) | Addgene | #108875 | |
| Recombinant DNA reagent | pC1-EGFP-IRSP53FL (plasmid) | Giorgio Scita Lab 49 10.1038/ncb1502; 10.1038/s41467-020-17091-x | ||
| Recombinant DNA reagent | pC1-EGFP-IRSP53-4KE (plasmid) | Giorgio Scita Lab 43 10.1038/s41467-018-03955-w; 10.1038/s41467-020-17091-x | ||
| Recombinant DNA reagent | pC1-EGFP-IRSP53-I268N (plasmid) | Giorgio Scita Lab 43 10.1038/s41467-018-03955-w; 10.1038/s41467-020-17091-x | ||
| Recombinant DNA reagent | pC1-EGFP-IRSP53-I403P (plasmid) | Scita Lab 38 10.1038/emboj.2013.208: 10.1038/s41467-020-17091-x | ||
| Recombinant DNA reagent | pC1-EGFP-IRSP53-W413G (plasmid) | Scita Lab 38 10.1038/emboj.2013.208 | ||
| Recombinant DNA reagent | pC1-EGFP-IRSP53-IBAR (plasmid) | Scita Lab 38 10.1038/emboj.2013.208 | ||
| Recombinant DNA reagent | pC1-EGFP-IRSP53-ΔIBAR (plasmid) | Scita Lab 38 10.1038/emboj.2013.208 | ||
| Recombinant DNA reagent | mCherry-Mem | Tebar Lab 10.1111 /j.1600–0854.2011.01274 .x | ||
| Recombinant DNA reagent | Rac1-G12V | Tebar Lab Lab 10.1038/s41598-017-07130-x | ||
| Recombinant DNA reagent | Rac1-T17N | Tebar Lab Lab 10.1038/s41598-017-07130-x | ||
| Recombinant DNA reagent | pEGFP-C3 Wave2 | Klemens Rottner Lab | ||
| Recombinant DNA reagent | pSpCas9(BB)–2A-Puro(PX459)V2.0 | Addgene | 62988 | |
| Sequence-based reagent | Nap1_F, NCKAP1_F | Sigma, FM1_Nckap1 | PCR primers | CATTCGGGGCTACAATAAAC |
| Sequence-based reagent | Nap1_R, NCKAP1_R | Sigma BM1_Nckap1 | PCR primers | TTAGTGCAGACCGTAAAAAC |
| Sequence-based reagent | GAPDH_F | 10.1038/s41556-022-00927-7 | PCR primers | ATCCTGCACCACCAACTGCT |
| Sequence-based reagent | GAPDH_R | 10.1038/s41556-022-00927-7 | PCR primers | GGGCCATCCACAGTCTTCTG |
| Sequence-based reagent | Rn18x_F | This paper | PCR primers | GCAATTATTCCCCATGAACG |
| Sequence-based reagent | Rn18x_R | This paper | PCR primers | GGCCTCACTAAACCATCCAA |
| Sequence-based reagent | IRSp53_F, BAIAP2_F | Thermo Fisher | PCR primers ID: mm00499943_m1 | |
| Sequence-based reagent | IRSp53_R, BAIAP2_R | Thermo Fisher | PCR primers ID: mm00499943_m1 | |
| Sequence-based reagent | IRTKS_F, BAIAP2L1_F | Thermo Fisher | PCR primers ID: mm00508802_m1 | |
| Sequence-based reagent | IRTKS_R, BAIAP2L1_R | Thermo Fisher | PCR primers ID: mm00508802_m1 | |
| Sequence-based reagent | Pinkbar_F, BAIAP2L2_F | Thermo Fisher | PCR primers ID: mm00616958_m1 | |
| Sequence-based reagent | Pinkbar_R, BAIAP2L2_R | Thermo Fisher | PCR primers ID: mm00616958_m1 | |
| Sequence-based reagent | MIM_F, MTSS1_F | Thermo Fisher | PCR primers ID: mm00460614_m1 | |
| Sequence-based reagent | MIM_R, MTSS1_R | Thermo Fisher | PCR primers ID: mm00460614_m1 | |
| Sequence-based reagent | ABBA_F, MTSS1L_F | Thermo Fisher | PCR primers ID: mm01244296_m1 | |
| Sequence-based reagent | ABBA_R, MTSS1L_R | Thermo Fisher | PCR primers ID: mm01244296_m1 | |
| Sequence-based reagent | IRTKs sgRNA | This paper | sgRNA | AAAAGCCTACTACGACGGCG |
| Commercial assay or kit | RNAeasy kit | QIAGEN | 50974104 | |
| Commercial assay or kit | High Pure RNA Isolation Kit | Roche | 11828665001 | |
| Commercial assay or kit | Fast SYBR Green MasterMix | Thermo Fisher/Applied Biosystems | ||
| Chemical compound, drug | DAB tablet | Sigma-Aldrich | Sigmafast, D4293 | |
| Chemical compound, drug | PNB | Optopharma | DR-N-111 | |
| Chemical compound, drug | SMIFH2 | Abcam | ab218296 | |
| Chemical compound, drug | Wiskostatin | Sigma | W2270 | |
| Chemical compound, drug | CK666 | Merck | 182515 | |
| Software, algorithm | ImageJ | ImageJ | freeware | |
| Software, algorithm | GraphPad Prism 9 | GraphPad Prism 9 | GraphPad Prism 9.5.1.733 | |
| Software, algorithm | CellProfiler | CellProfiler | CellProfiler 4.2.4 | freeware |
| Software, algorithm | MATLAB | Marino Arroyo lab 10.1103/PhysRevLett.110.028101; 10.1088/1367–2630/ab3ad6, | This paper | Newly created MATLAB code, combined with previously existing code |
Additional files
-
MDAR checklist
- https://cdn.elifesciences.org/articles/72316/elife-72316-mdarchecklist1-v2.pdf
-
Source code 1
Computational code for dynamics of single evagination.
- https://cdn.elifesciences.org/articles/72316/elife-72316-code1-v2.zip
Download links
A two-part list of links to download the article, or parts of the article, in various formats.
Downloads (link to download the article as PDF)
Open citations (links to open the citations from this article in various online reference manager services)
Cite this article (links to download the citations from this article in formats compatible with various reference manager tools)
A mechanosensing mechanism controls plasma membrane shape homeostasis at the nanoscale
eLife 12:e72316.
https://doi.org/10.7554/eLife.72316


