Sex determination gene transformer regulates the male-female difference in Drosophila fat storage via the adipokinetic hormone pathway
- Department of Cellular and Physiological Sciences, The University of British Columbia, Canada
Figures
Figure 1 with 1 supplement

transformer regulates the sex difference in fat storage.
(A) Whole-body triglyceride levels were significantly lower in tra1/Df(3L)st-j7 females compared with w1118 controls (p<0.0001; Student’s t-test). n=8 biological replicates. (B) Whole-body triglyceride levels were significantly lower in tra1/Df(3L)st-j7 females with excised gonads compared with w1118 with excised ovaries (p<0.0001; Student’s t-test). n=8 biological replicates. (C) Whole-body triglyceride levels were significantly lower in traKO females compared with w1118 controls (p=0.0037; Student’s t-test). n=8 biological replicates. (D) Whole-body triglyceride levels were significantly higher in da-GAL4>UAS-traF males compared with da-GAL4>+ and +>UAS-traF controls (p<0.0001 and p<0.0001, respectively; one-way ANOVA followed by Tukey’s HSD). n=8 biological replicates. (E) Whole-body triglyceride levels were significantly higher in traF K-IN males compared with w1118 controls (p<0.0001, Student’s t-test). n=8 biological replicates. (F) Whole-body triglyceride levels were significantly higher in traF K-IN males with excised gonads compared with w1118 controls lacking gonads (p<0.0001; Student’s t-test). n=8 biological replicates. Black circles indicate the presence of a transgene and open circles indicate the lack of a transgene. ** indicates p<0.01, **** indicates p<0.0001; error bars represent SEM.
Figure 1—figure supplement 1
Elucidating transformer’s effect on sex differences in fat metabolism.
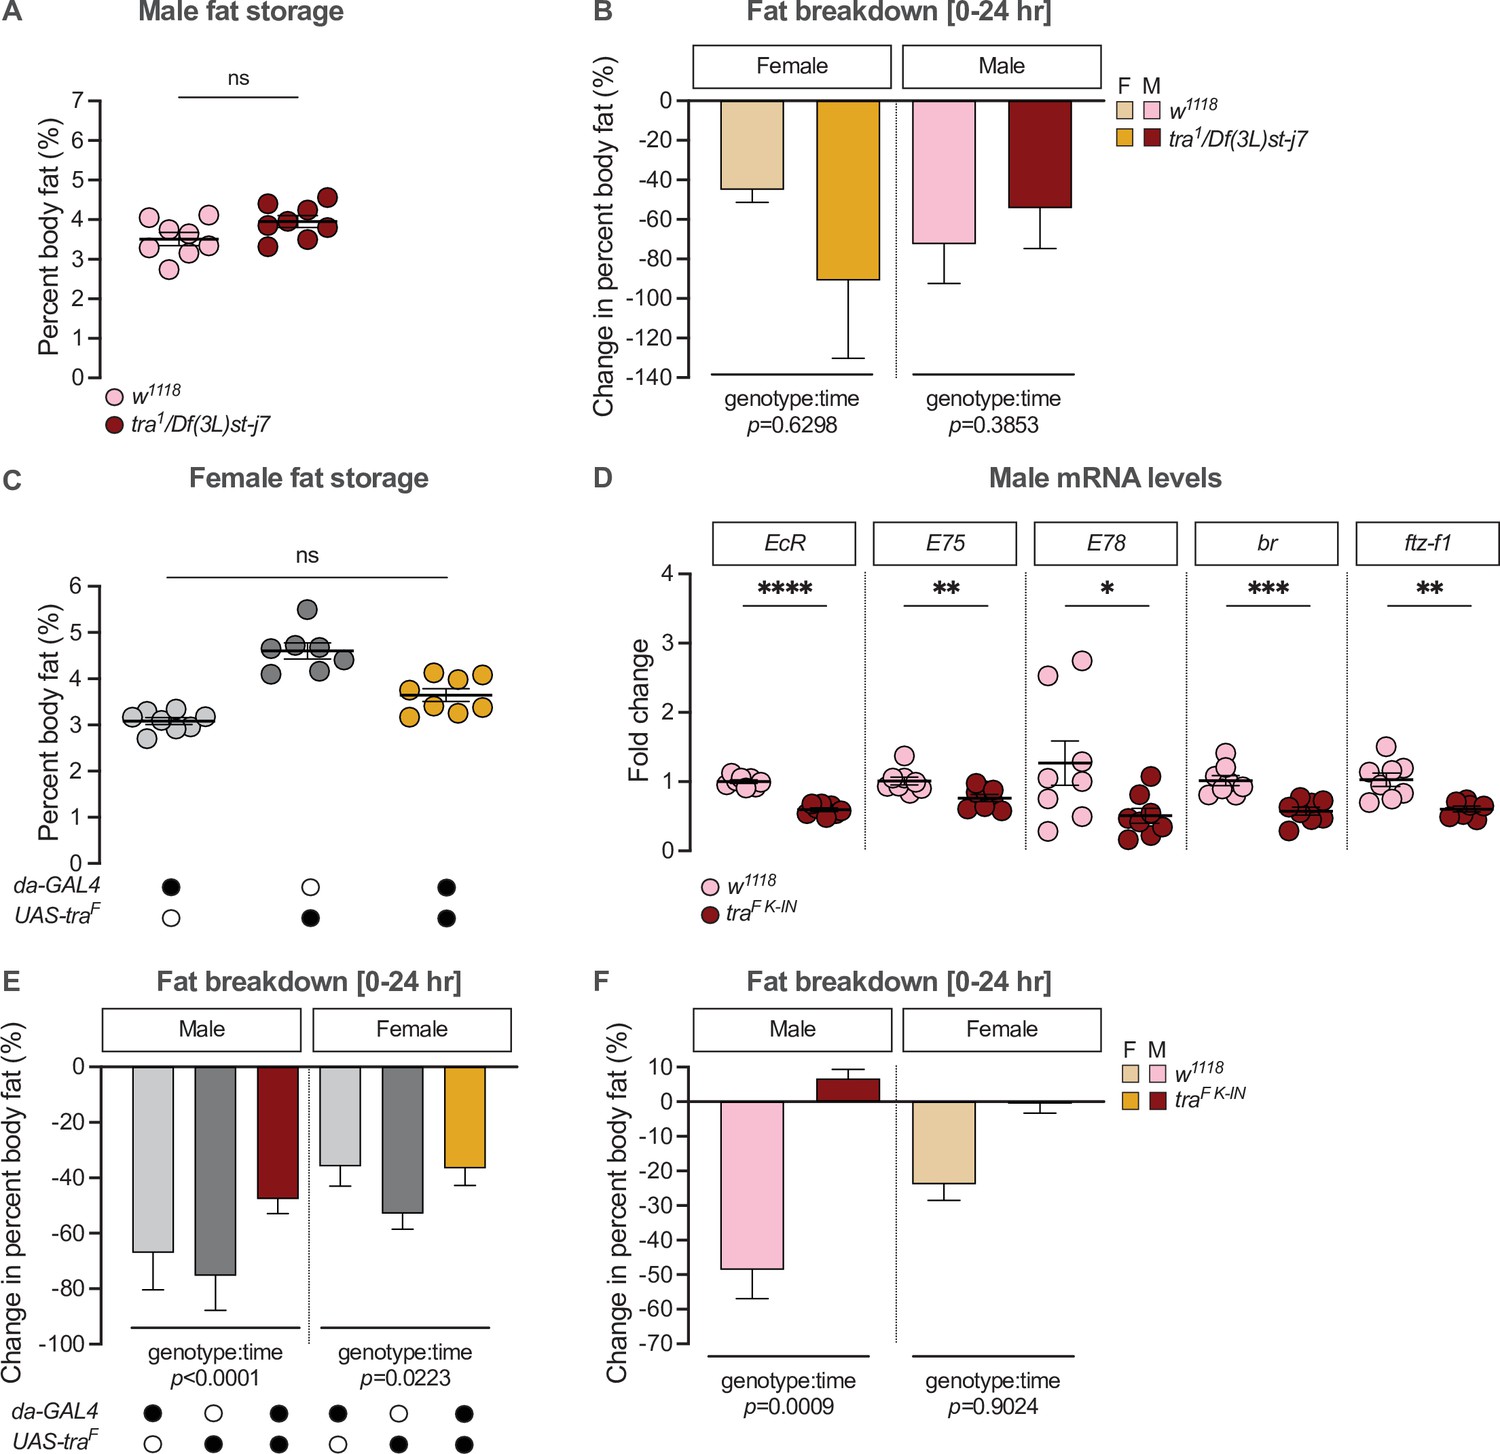
(A) Whole-body triglyceride levels were not significantly different between tra1/Df(3L)st-j7 males and w1118 controls (p=0.0685; Student’s t-test). n=8 biological replicates. (B) The reduction in whole-body triglyceride levels post-starvation was not significantly different between tra1/Df(3L)st-j7 animals and sex-matched w1118 controls between 0 and 24 hr post-starvation (genotype:time p=0.6298 [female], p=0.3853 [male]; two-way ANOVA per sex). n=7–8 biological replicates. (C) Whole-body triglyceride levels in da-GAL4>UAS-traF females were intermediate between da-GAL4>+ and +>UAS-traF control females, indicating no overall effect of Tra overexpression in females (p=0.0160 and p=0.0002, respectively; one-way ANOVA followed by Tukey’s HSD). n=7–8 biological replicates. (D) Whole-body mRNA levels of ecdysone responsive genes were not higher in traF K-IN males compared to w1118 control males (Ecdysone receptor (EcR): p<0.0001; Ecdysone-induced protein 75B (E75): p=0.0072; Ecdysone-induced protein 78C (E78): p=0.0408; broad (br): p=0.0003; ftz transcription factor 1 (ftz-f1): p=0.002; Student’s t-test for each gene). n=7–8 biological replicates. (E) The reduction in whole-body triglyceride levels between 0 and 24 hr post-starvation was significantly smaller in da-GAL4>UAS-traF males compared with da-GAL4>+ and +>UAS-traF control males (genotype:time p<0.0001; two-way ANOVA). The post-starvation reduction in triglyceride levels in da-GAL4>UAS-traF females was intermediate between both da-GAL4>+ and +>UAS-traF controls, suggesting no overall effect of Tra overexpression on female fat breakdown post-starvation (genotype:time p=0.0223; two-way ANOVA per sex). n=7–8 biological replicates. (F) The reduction in whole-body triglyceride levels between 0 and 24 hr post-starvation was significantly lower in traF K-IN males, but not females, compared with sex-matched w1118 controls (genotype:time p=0.0009 [male], p=0.9024 [female]; two-way ANOVA per sex). n=7–8 biological replicates. F indicates female, M indicates male. Black circles indicate the presence of a transgene and open circles indicate the lack of a transgene. * indicates p<0.05, ** indicates p<0.01, *** indicates p<0.001, **** indicates p<0.0001, ns indicates not significant; error bars represent SEM except for graphs displaying fat breakdown where error bars represent COE.
Figure 2 with 5 supplements
transformer function in Akh-producing cells contributes to the sex difference in fat storage.
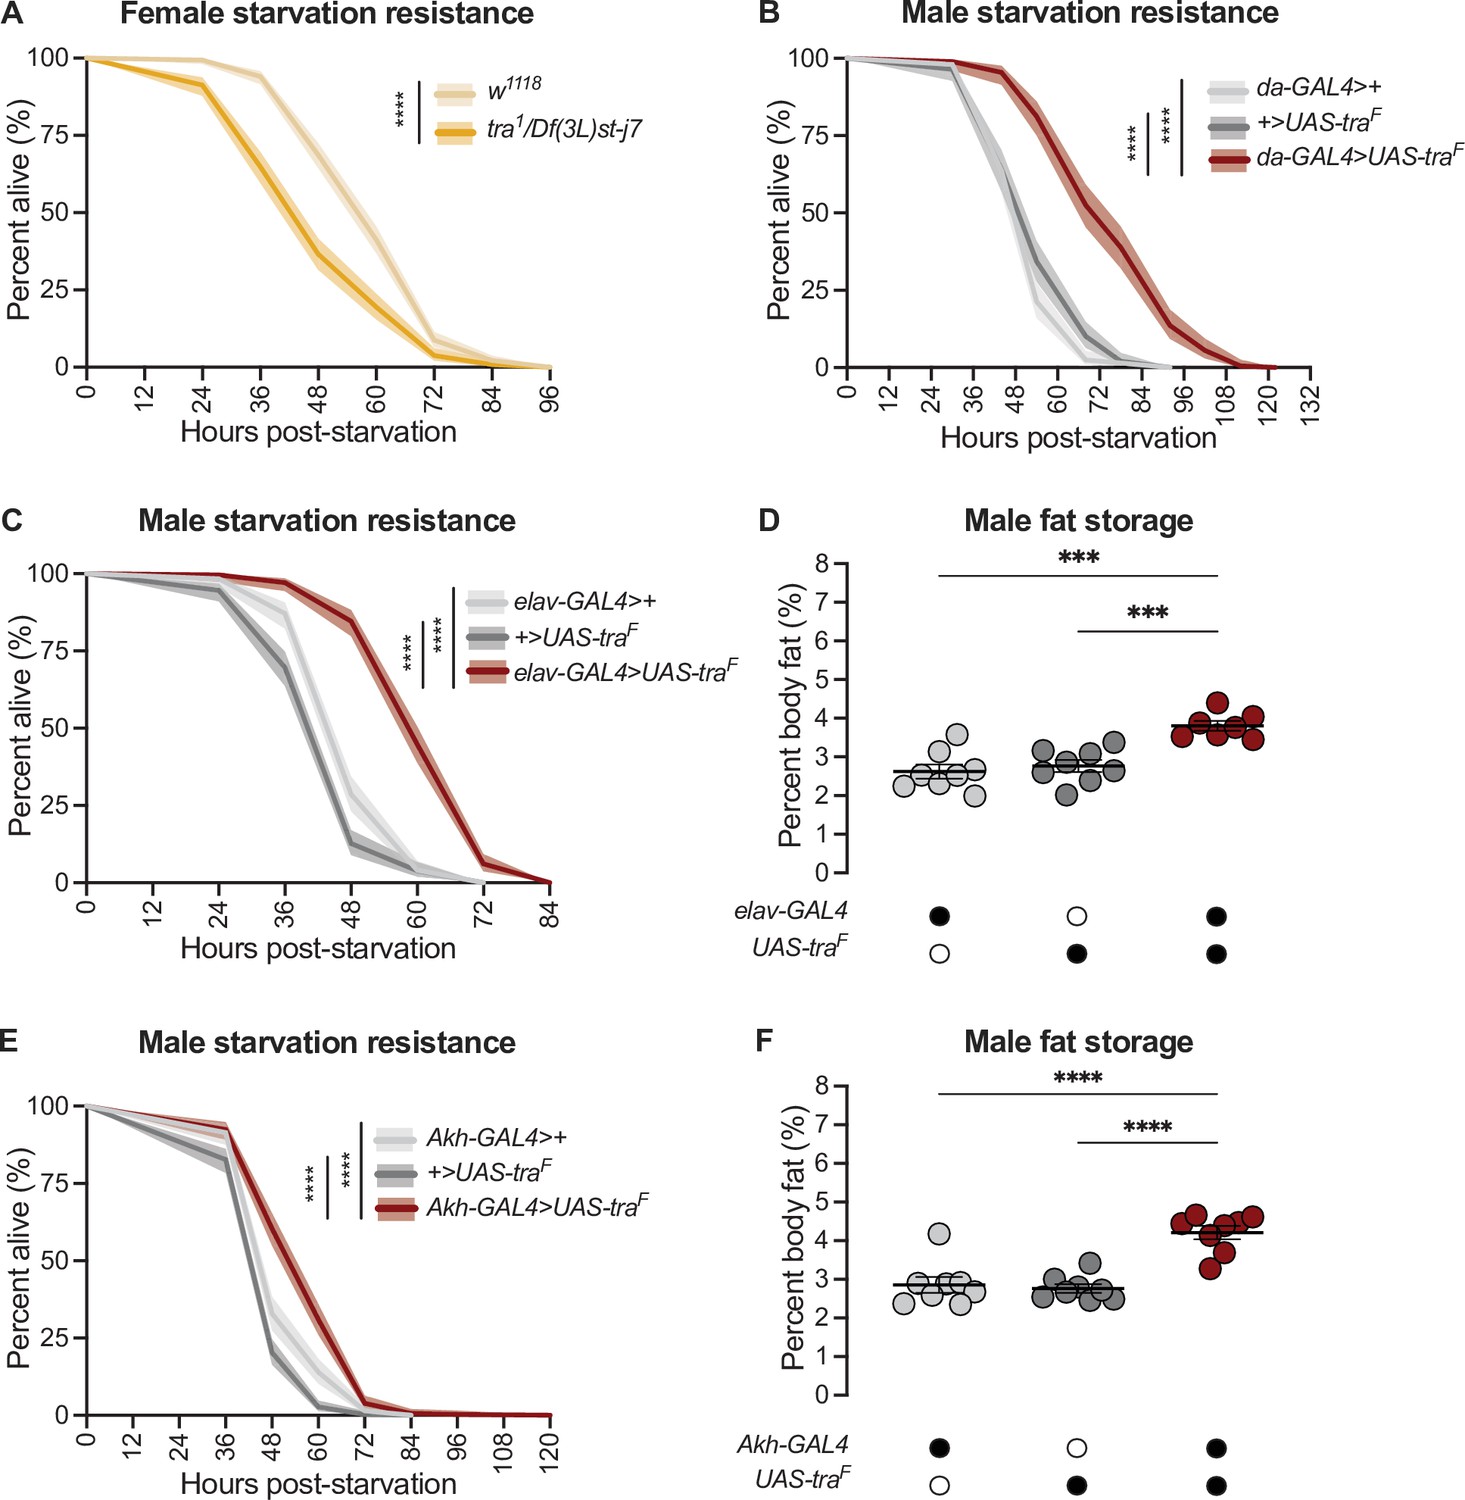
(A) Starvation resistance was significantly reduced in tra1/Df(3L)st-j7 females compared with w1118 controls (p<2×10–16; log-rank test, Bonferroni’s correction for multiple comparisons). n=344–502 animals. (B) Starvation resistance was significantly enhanced in da-GAL4>UAS-traF males compared with da-GAL4>+ and +>UAS-traF controls (p<2×10–16 and p<2×10–16, respectively; log-rank test, Bonferroni’s correction for multiple comparisons). n=198–201 animals. (C) Starvation resistance was significantly enhanced in elav-GAL4>UAS-traF males compared with elav-GAL4>+ and +>UAS-traF controls (p<2×10–16 and p<2×10–16, respectively; log-rank test, Bonferroni’s correction for multiple comparisons). n=248–279 animals. (D) Whole-body triglyceride levels were significantly higher in elav-GAL4>UAS-traF males compared with elav-GAL4>+ and +>UAS-traF controls (p=0.0001 and p=0.0006, respectively; one-way ANOVA followed by Tukey’s HSD). n=7–8 biological replicates. (E) Starvation resistance was significantly enhanced in Akh-GAL4>UAS-traF males compared with Akh-GAL4>+ and +>UAS-traF controls (p=3.1×10⁻⁹ and p<2×10–16, respectively; log-rank test, Bonferroni’s correction for multiple comparisons). n=280–364 animals. (F) Whole-body triglyceride levels were significantly higher in Akh-GAL4>UAS-traF males compared to Akh-GAL4>+ and +>UAS-traF control males (p<0.0001 and p<0.0001, respectively; one-way ANOVA followed by Tukey’s HSD). n=8 biological replicates. Black circles indicate the presence of a transgene and open circles indicate the lack of a transgene. *** indicates p<0.001, **** indicates p<0.0001; shaded areas represent the 95% confidence interval; error bars represent SEM.
Figure 2—figure supplement 1
Effect of transformer gain in multiple cell types and tissues on starvation resistance.
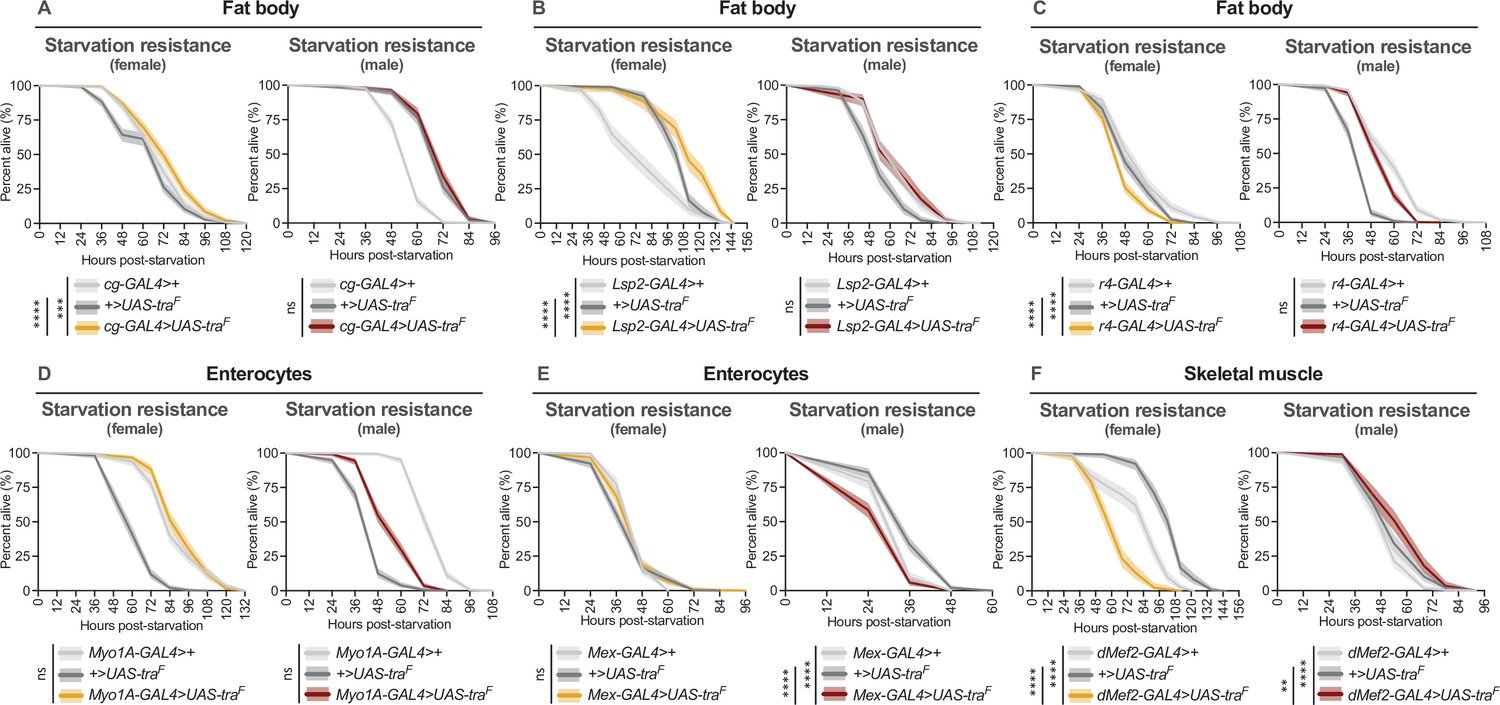
(A–F) Limited to no effects of Tra overexpression on starvation resistance were observed for female fat body, muscle, and gut (for individual p-values see Supplementary file 1; log-rank test with Bonferroni’s correction for multiple comparisons). In males, Tra overexpression in the fat body and gut caused no extension of starvation resistance, with only a minor extension observed upon Tra overexpression in muscle (for individual p-values see Supplementary file 1; log-rank test with Bonferroni’s correction for multiple comparisons). (A) n=397–413 females, n=295–431 males. (B) n=187–206 females, n=198–202 males. (C) n=293–402 females, n=330–452 males. (D) n=268–383 females, n=363–409 males. (E) n=226–374 females, n=250–362 males. (F) n=168–206 females, n=178–198 males. ** indicates p<0.01, *** indicates p<0.001, **** indicates p<0.0001, ns indicates not significant; shaded areas represent the 95% confidence interval.
Figure 2—figure supplement 2
Effect of transformer gain in additional cell types and tissues on starvation resistance.
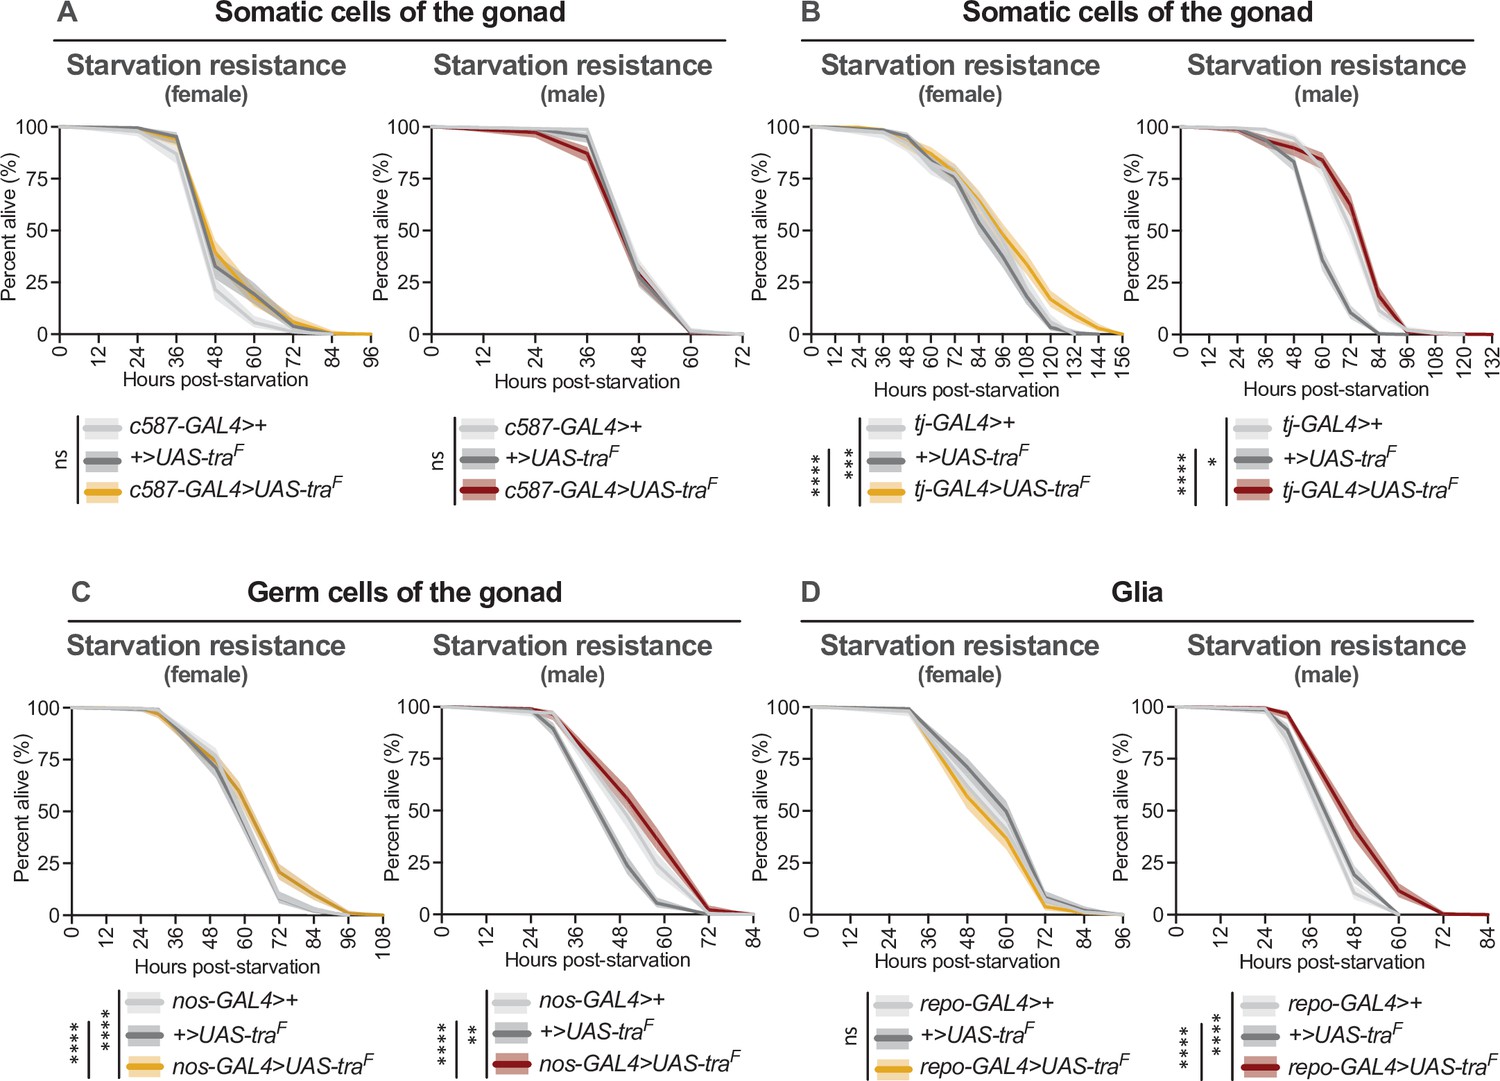
(A–D) Limited to no effects of Tra overexpression were observed upon Tra expression in the female gonad and glia (for individual p-values see Supplementary file 1; log-rank test with Bonferroni’s correction for multiple comparisons). Limited to no effects of Tra overexpression were observed upon Tra expression in the male gonad and glia (for individual p-values see Supplementary file 1; log-rank test with Bonferroni’s correction for multiple comparisons). (A) n=232–268 females, n=318–400 males. (B) n=234–349 females, n=327–349 males. (C) n=374–442 females, n=293–364 males. (D) n=300–374 females, n=329–355 males. * indicates p<0.05, ** indicates p<0.01, *** indicates p<0.001, **** indicates p<0.0001, ns indicates not significant; shaded areas represent the 95% confidence interval.
Figure 2—figure supplement 3
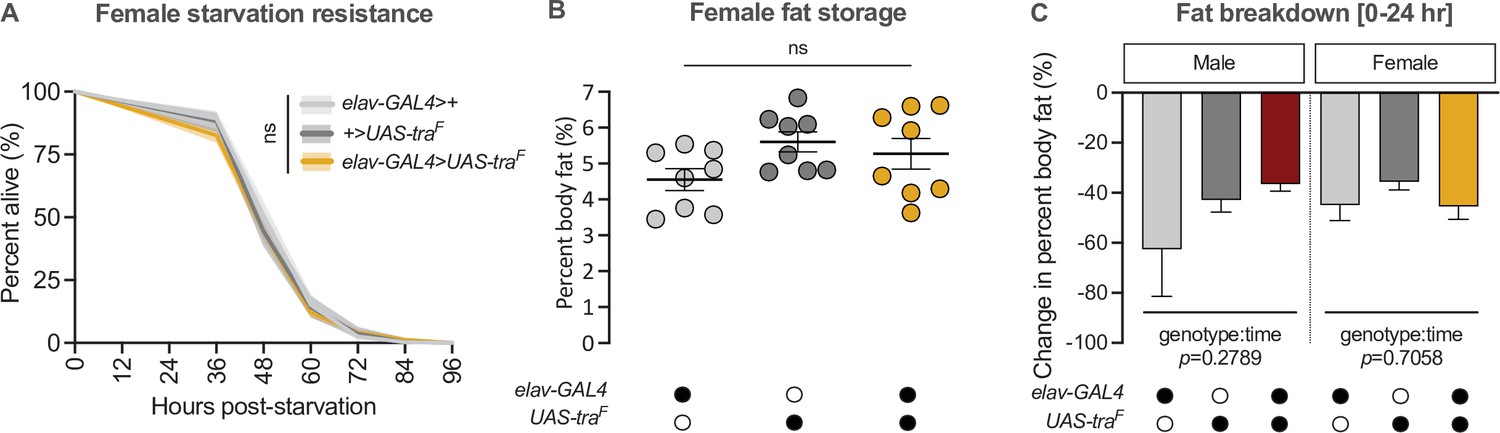
Gain of transformer function in neurons does not affect fat breakdown.
(A) Starvation resistance in elav-GAL4>UAS-traF females was not significantly different compared with elav-GAL4>+ and +>UAS-traF controls (p=0.3 and p=1, respectively; log-rank test with Bonferroni’s correction for multiple comparisons). n=318–749 females. (B) Whole-body triglyceride levels were not significantly different between elav-GAL4>UAS-traF females and elav-GAL4>+ and +>UAS-traF controls (p=0.3224 and p=0.7754, respectively; one-way ANOVA followed by Tukey’s HSD). n=8 biological replicates. (C) The reduction in whole-body triglyceride levels post-starvation was not significantly different between elav-GAL4>UAS-traF flies and sex-matched elav-GAL4>+ and +>UAS-traF controls (genotype:time p=0.2789 [male], p=0.7058 [female]; two-way ANOVA per sex). n=7–8 biological replicates. Black circles indicate the presence of a transgene and open circles indicate the lack of a transgene; ns indicates not significant; shaded areas represent the 95% confidence interval; error bars represent SEM except for graphs displaying fat breakdown where error bars represent COE.
Figure 2—figure supplement 4
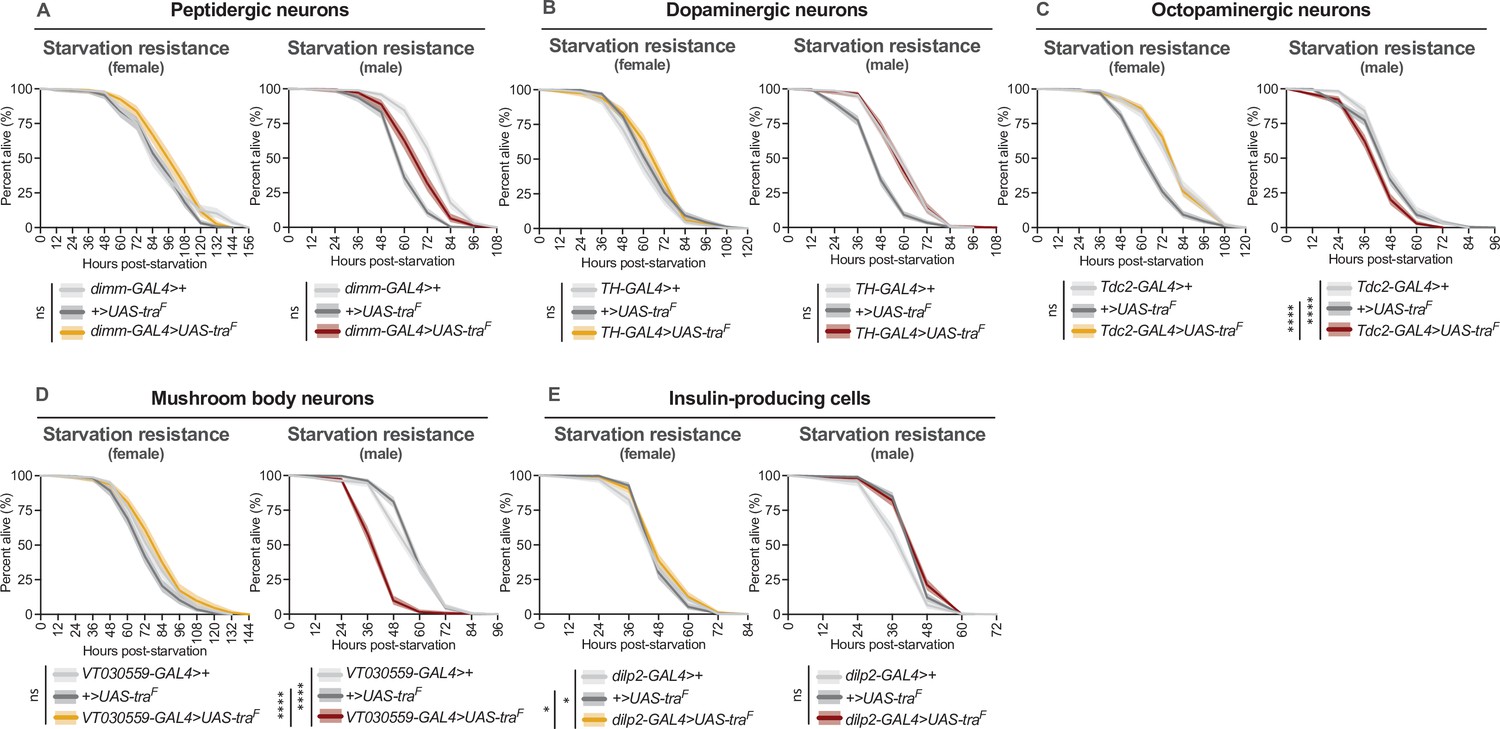
Effect of transformer gain in multiple neuronal subsets on starvation resistance.
(A–E) Limited to no effects of Tra overexpression in several subsets of neurons on starvation resistance in females (for individual p-values see Supplementary file 1; log-rank test with Bonferroni’s correction for multiple comparisons). In males, Tra overexpression in several subsets of neurons caused no extension of starvation resistance (for individual p-values see Supplementary file 1; log-rank test with Bonferroni’s correction for multiple comparisons). (A) n=248–333 females, n=249–333 males. (B) n=322–484 females, n=314–516 males. (C) n=282–478 females, n=364–516 males. (D) n=256–343 females, n=326–392 males. (E) n=326–390 females, n=285–466 males. * indicates p<0.05, **** indicates p<0.0001, ns indicates not significant; shaded areas represent the 95% confidence interval.
Figure 2—figure supplement 5
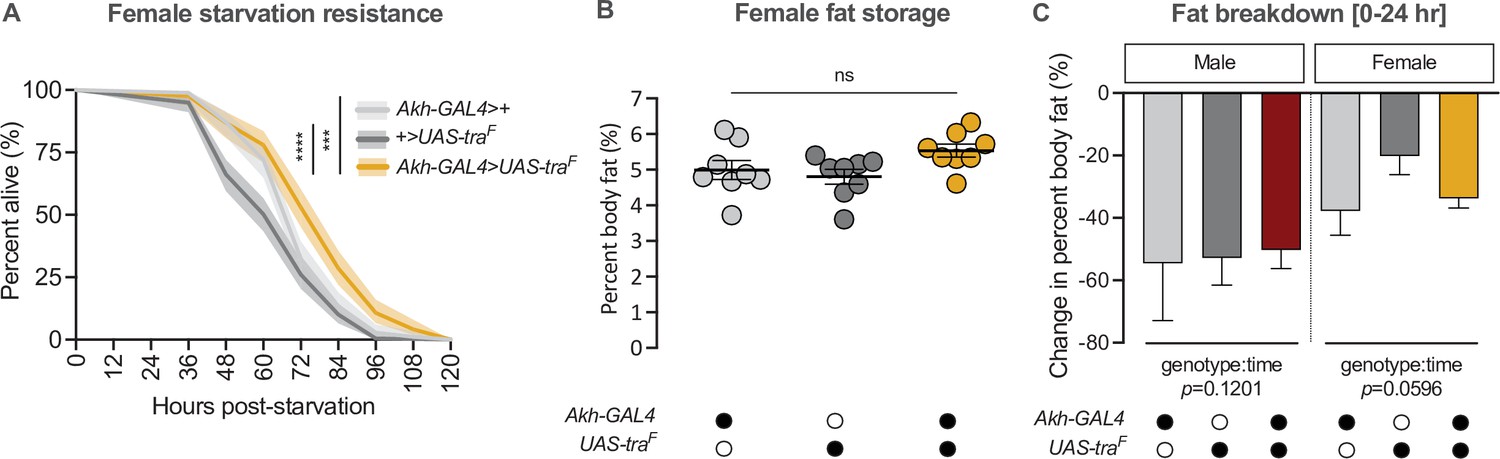
Gain of transformer function in Akh-producing cells does not affect fat breakdown.
(A) Starvation resistance was significantly extended in Akh-GAL4>UAS-traF females compared with Akh-GAL4>+ and +>UAS-traF controls (p=0.00033 and p=9.4×10⁻¹¹, respectively; log-rank test with Bonferroni’s correction for multiple comparisons). n=168–219 females. (B) Whole-body triglyceride levels were not significantly different between Akh-GAL4>UAS-traF females and Akh-GAL4>+ and +>UAS-traF controls (p=0.2195 and p=0.0731, respectively; one-way ANOVA followed by Tukey’s HSD). n=8 biological replicates. (C) The reduction in whole-body triglyceride levels post-starvation was not significantly different between Akh-GAL4>UAS-traF animals and sex-matched Akh-GAL4>+ and +>UAS-traF controls (genotype:time p=0.1201 [males], p=0.0596 [female]; two-way ANOVA per sex). n=8 biological replicates. Black circles indicate the presence of a transgene and open circles indicate the lack of a transgene; *** indicates p<0.001, **** indicates p<0.0001, ns indicates not significant; shaded areas represent the 95% confidence interval; error bars represent SEM except for graphs displaying fat breakdown where error bars represent COE.
Figure 3 with 1 supplement
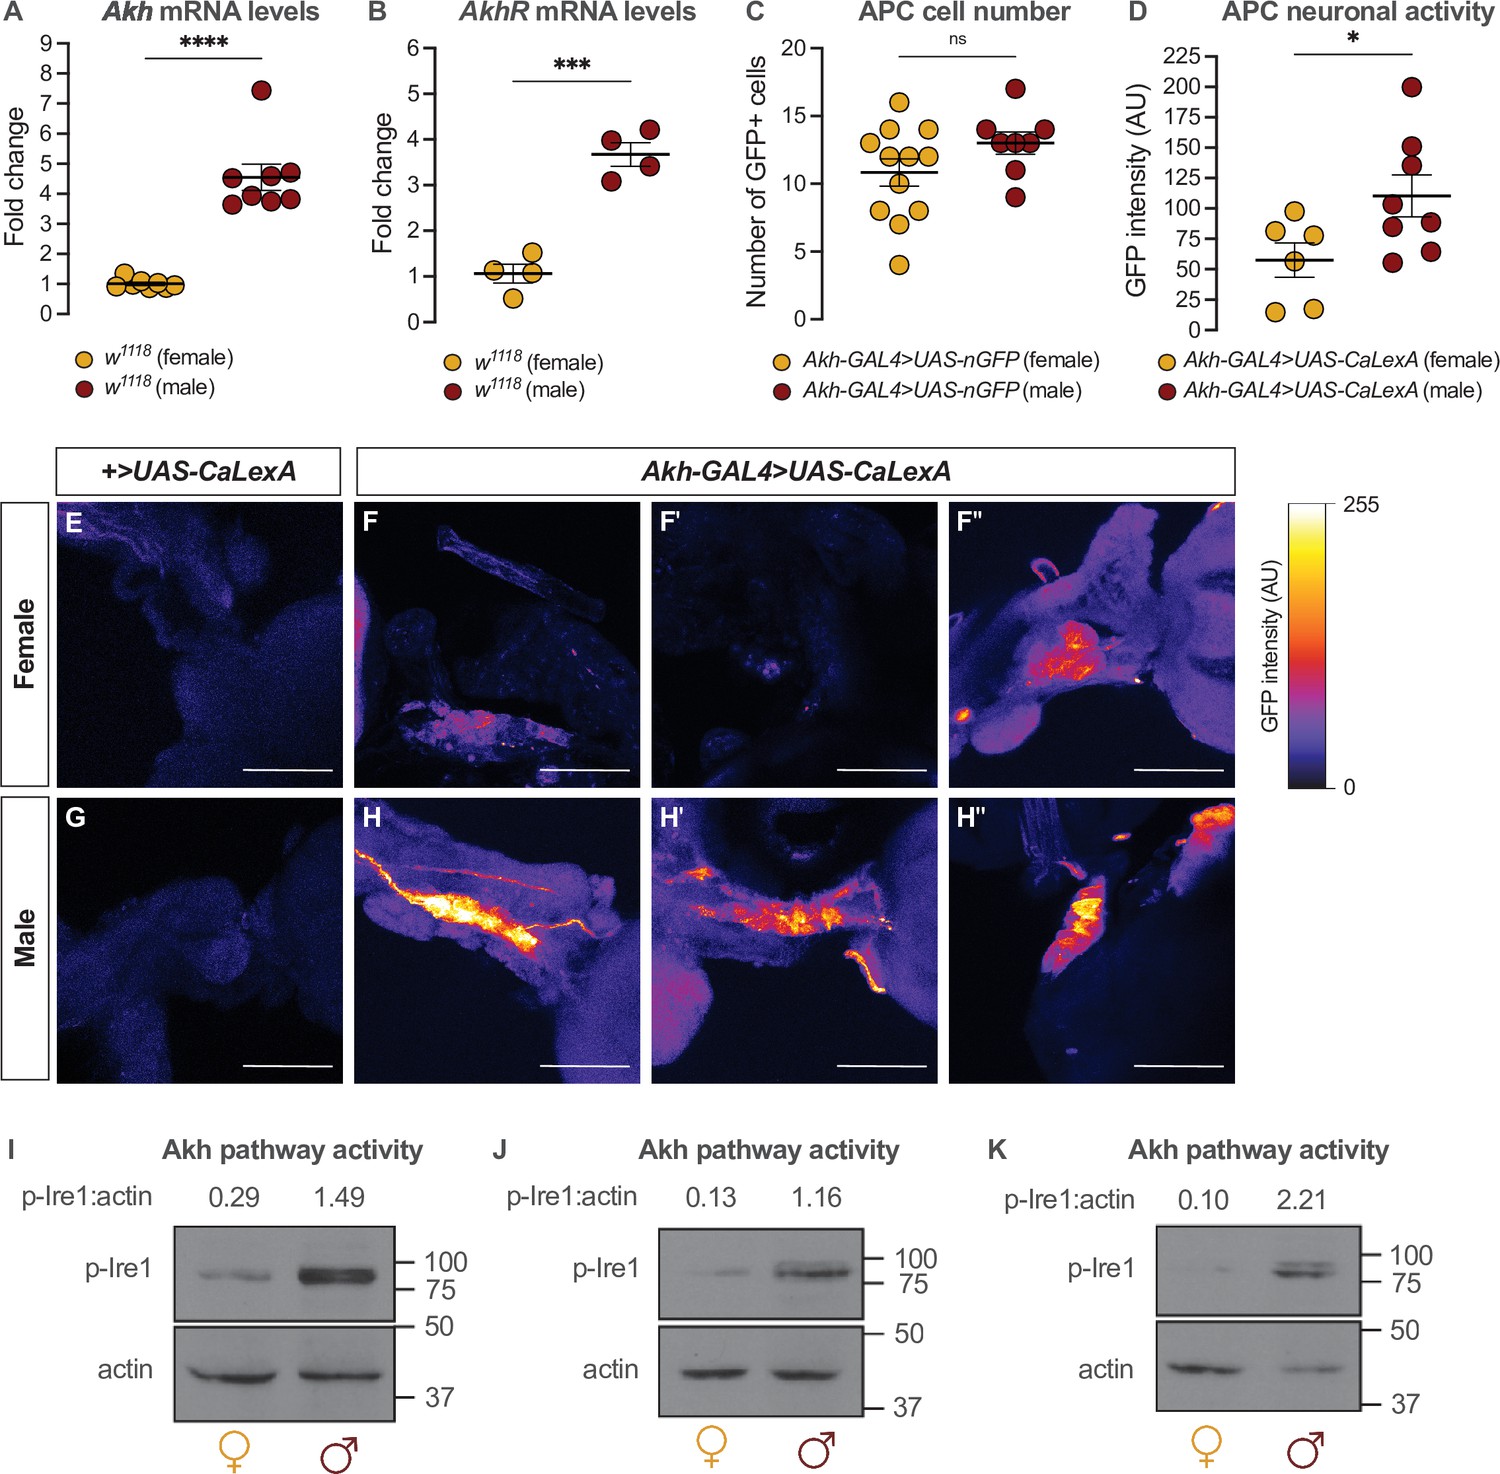
Sex-specific regulation of Akh and the Akh signaling pathway.
(A) Akh mRNA levels were significantly higher in w1118 males compared with genotype-matched females (p<0.0001, Student’s t-test). n=8 biological replicates. (B) AkhR mRNA levels were significantly higher in w1118 males than in females (p=0.0002, Student’s t-test). n=4 biological replicates. (C) Expression of UAS-nGFP in Akh-producing cells (APCs) (Akh-GAL4>UAS-nGFP) revealed no significant difference in APC cell number between males and females (p=0.1417; Student’s t-test). n=8–12 animals. (D) GFP intensity produced as a readout of calcium activity in the APCs (Akh-GAL4>LexAop-CD8-GFP;UAS-LexA-VP16-NFAT (UAS-CaLexA)) was significantly higher in males compared with females (p=0.0438; Student’s t-test). n=6–8 biological replicates. (E–H) Maximum Z-projections of representative images showing GFP produced as a readout for APC calcium activity from both Akh-GAL4>UAS-CaLexA males and females. Scale bars=50 μm, n=6–8 biological replicates. (I–K) Whole-body p-Ire1 levels were higher in w1118 males compared with w1118 females in three biological replicates. * indicates p<0.05, *** indicates p<0.001, **** indicates p<0.0001, ns indicates not significant; error bars represent SEM. Original images for (C) are found in Figure 3—source data 1. Original images for (D–H) are found in Figure 3—source data 2. Original images for (I–K) are found in Figure 3—source data 3.
-
Figure 3—source data 1
Images used to quantify number of Akh-producing cells.
- https://cdn.elifesciences.org/articles/72350/elife-72350-fig3-data1-v2.zip
-
Figure 3—source data 2
Images used to quantify neuronal activity of Akh-producing cells.
- https://cdn.elifesciences.org/articles/72350/elife-72350-fig3-data2-v2.zip
-
Figure 3—source data 3
Original blots for p-Ire1 and actin in males and females.
- https://cdn.elifesciences.org/articles/72350/elife-72350-fig3-data3-v2.zip
Figure 3—figure supplement 1
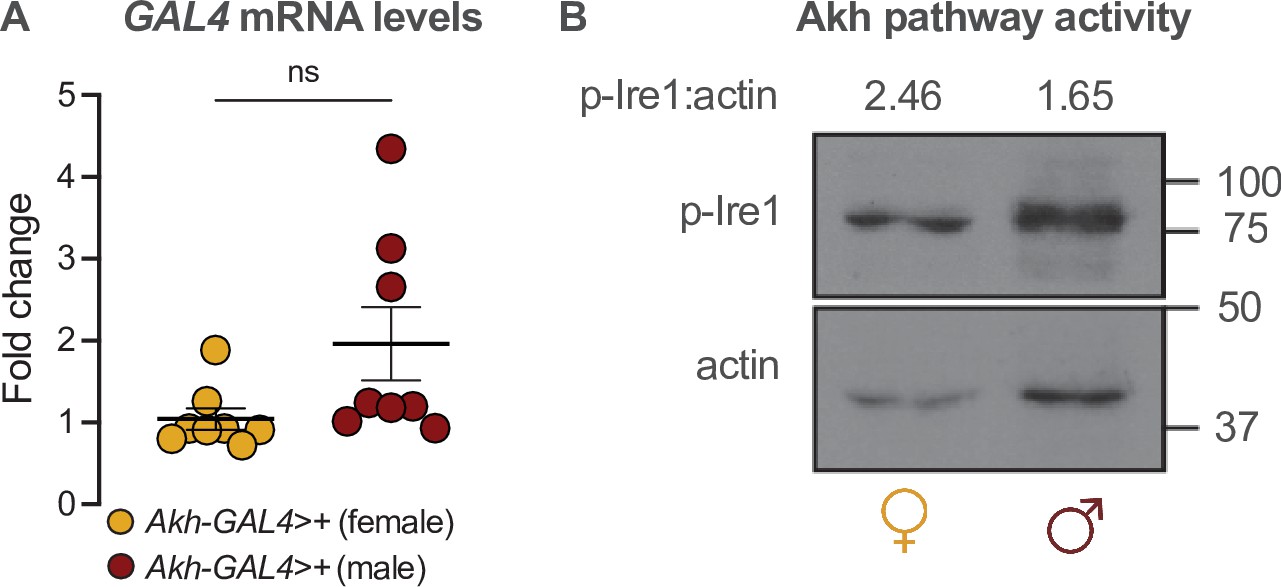
Akh-GAL4 drives equivalent GAL4 mRNA levels in both sexes.
(A) Whole-body GAL4 mRNA levels were not significantly different between Akh-GAL4>+ females and males (p=0.0687; Student’s t-test). n=8 biological replicates. (B) Whole-body p-Ire1 levels were not higher in w1118 males compared with w1118 females in one biological replicate. ns indicates not significant; error bars represent SEM. Original image for (B) is found in Figure 3—figure supplement 1—source data 1.
-
Figure 3—figure supplement 1—source data 1
Original blots for p-Ire1 and actin in male versus female.
- https://cdn.elifesciences.org/articles/72350/elife-72350-fig3-figsupp1-data1-v2.zip
Figure 4 with 4 supplements
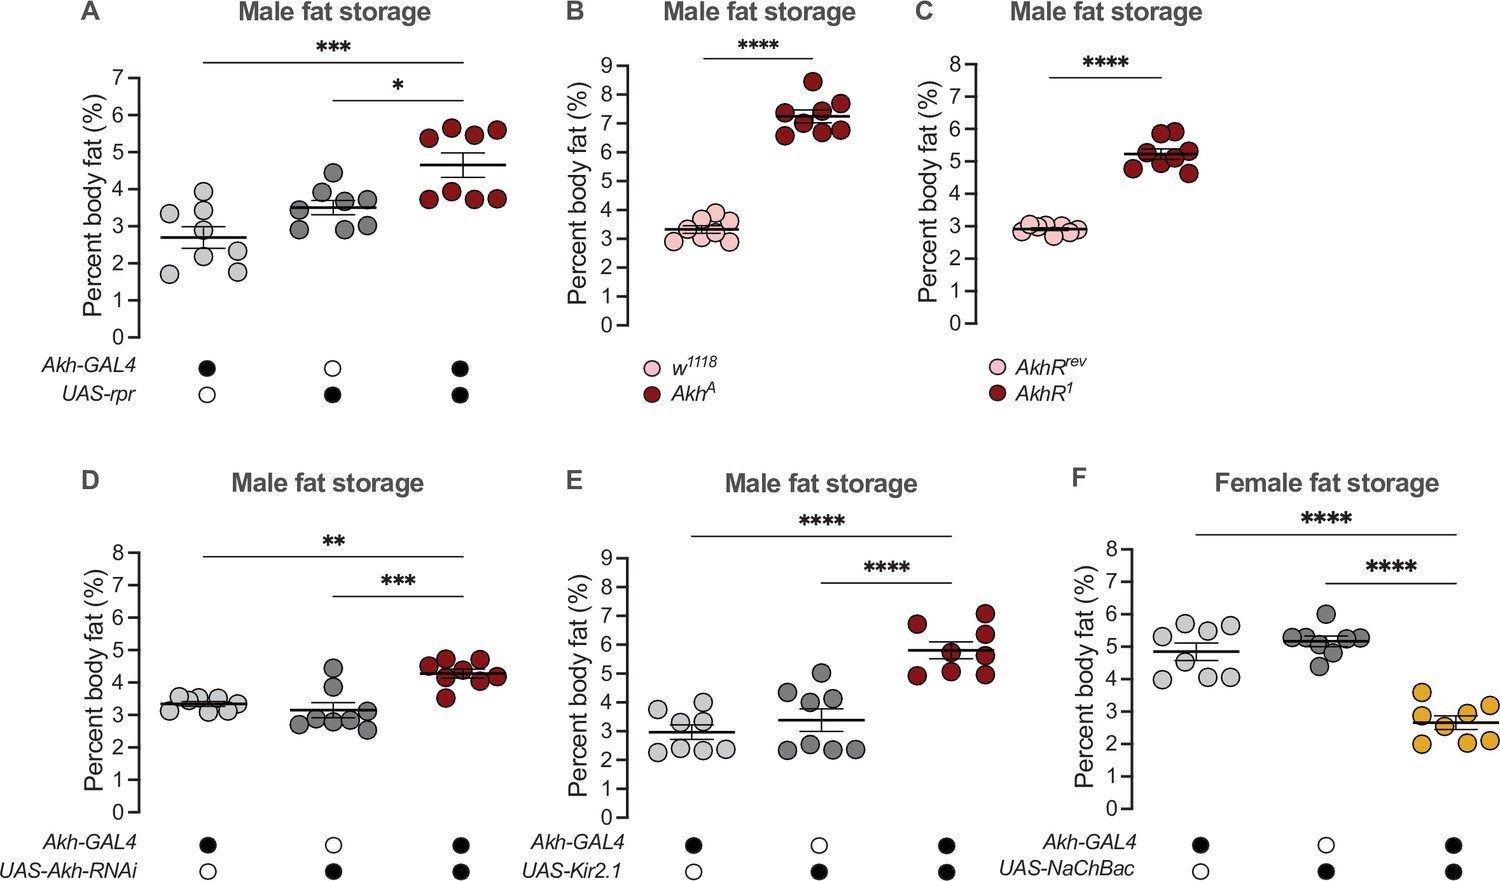
Sex-specific regulation of Akh and APC activity influence the sex difference in fat storage.
(A) Whole-body triglyceride levels were significantly higher in Akh-GAL4>UAS-reaper (rpr) males compared with Akh-GAL4>+ and +>UAS-rpr controls (p=0.0002 and p=0.0215, respectively; one-way ANOVA followed by Tukey’s HSD). n=8 biological replicates. (B) Whole-body triglyceride levels were significantly higher in AkhA males compared with w1118 controls (p<0.0001; one-way ANOVA followed by Tukey’s HSD). n=8 biological replicates. (C) Whole-body triglyceride levels were significantly higher in AkhR1 males compared with AkhRrev controls (p<0.0001; one-way ANOVA followed by Tukey’s HSD). n=8 biological replicates. (D) Whole-body triglyceride levels were significantly higher in Akh-GAL4>UAS-Akh-RNAi males compared with Akh-GAL4>+ and +>UAS-Akh-RNAi controls (p=0.0015 and p=0.0002, respectively; one-way ANOVA followed by Tukey’s HSD). n=8 biological replicates. (E) Whole-body triglyceride levels were significantly higher in Akh-GAL4>UAS-Kir2.1 males compared with Akh-GAL4>+ and +>UAS-Kir2.1 controls (p<0.0001 and p<0.0001, respectively; one-way ANOVA followed by Tukey’s HSD). n=8 biological replicates. (F) Whole-body triglyceride levels were significantly lower in Akh-GAL4>UAS-NaChBac females compared with Akh-GAL4>+ and +>UAS-NaChBac controls (p<0.0001 and p<0.0001, respectively; one-way ANOVA followed by Tukey’s HSD). n=8 biological replicates. Due to independent experiments with a shared GAL4 control, Akh-GAL4>+ males are shared between (E) and Figure 4—figure supplement 3E. Akh-GAL4>+ females are shared between (F) and Figure 4—figure supplement 3D. Black circles indicate the presence of a transgene and open circles indicate the lack of a transgene; * indicates p<0.05, ** indicates p<0.01, *** indicates p<0.001, **** indicates p<0.0001; error bars represent SEM.
Figure 4—figure supplement 1
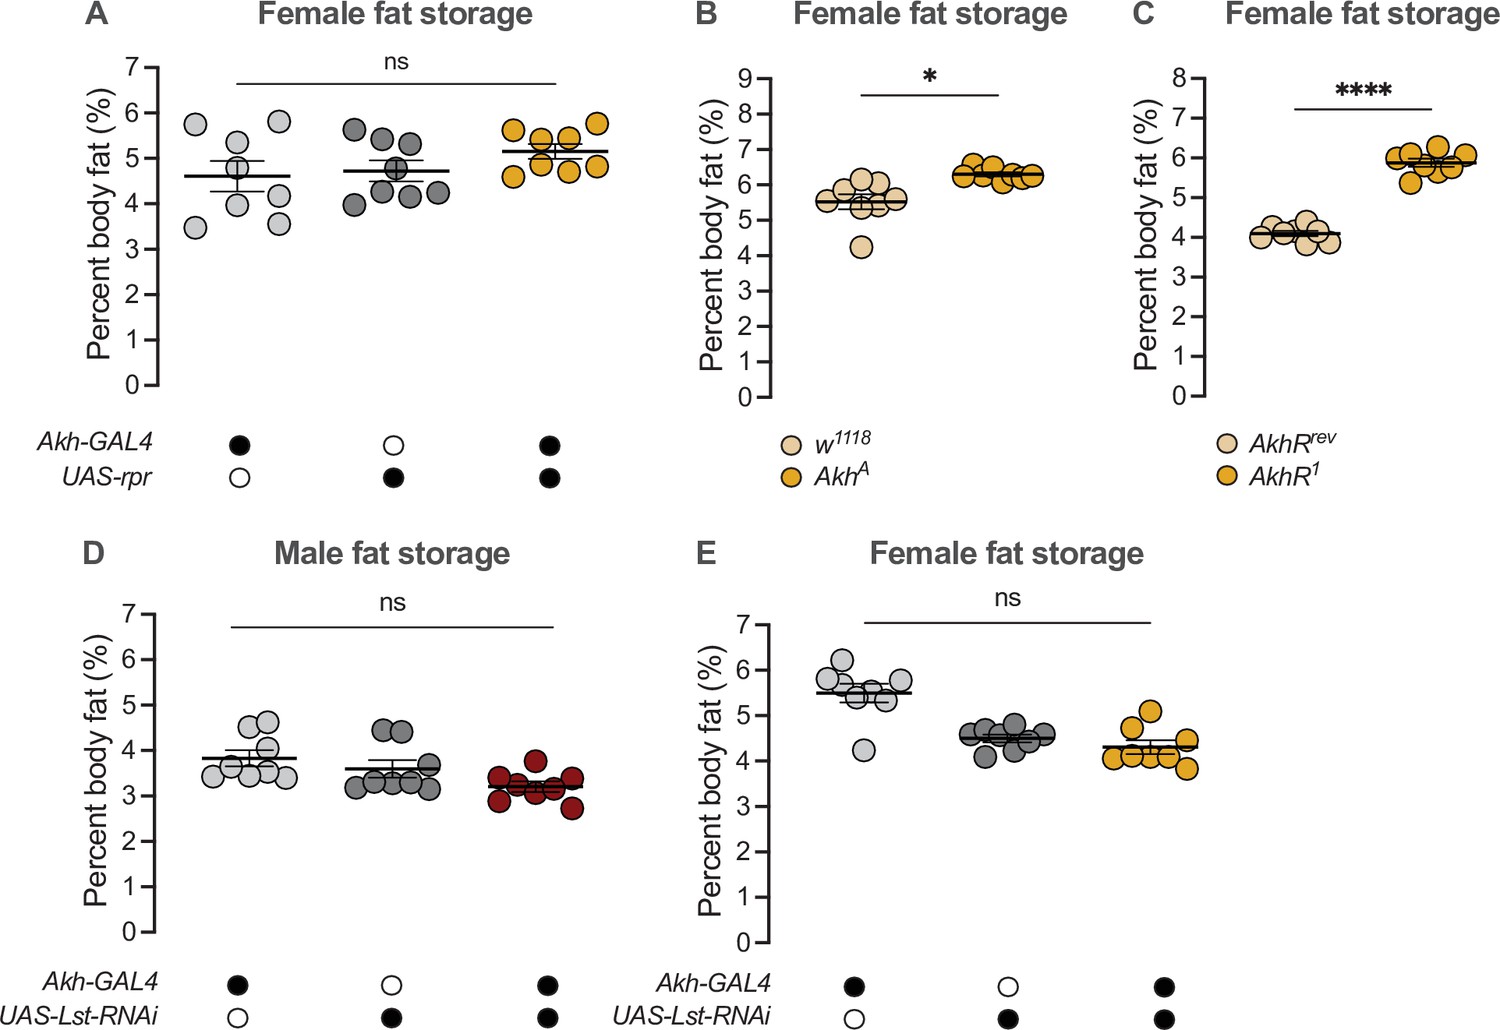
APC-derived Limostatin does not regulate the sex difference in fat storage.
(A) Whole-body triglyceride levels were not significantly different between Akh-GAL4>UAS-reaper (rpr) females and Akh-GAL4>+ and +>UAS-rpr controls (p=0.3024 and p=0.4673, respectively; one-way ANOVA followed by Tukey’s HSD). n=8 biological replicates. (B) Whole-body triglyceride levels were significantly higher in AkhA females compared with w1118 controls (p=0.0152; one-way ANOVA followed by Tukey’s HSD). n=8 biological replicates. (C) Whole-body triglyceride levels were significantly higher in AkhR1 females compared with AkhRrev control females (p<0.0001; one-way ANOVA followed by Tukey’s HSD). n=8 biological replicates. (D) Whole-body triglyceride levels in Akh-GAL4>UAS-Limostatin (Lst)-RNAi males were not significantly different from both Akh-GAL4>+ and +>UAS-Lst-RNAi controls (p=0.0357 and p=0.2364, respectively; one-way ANOVA followed by Tukey’s HSD). n=8 biological replicates. (E) Whole-body triglyceride levels in Akh-GAL4>UAS-Lst-RNAi females were not significantly different from both Akh-GAL4>+ and +>UAS-Lst-RNAi controls (p<0.0001 and p=0.6656, respectively; one-way ANOVA followed by Tukey’s HSD). n=8 biological replicates. Black circles indicate the presence of a transgene and open circles indicate the lack of a transgene. * indicates p<0.05, **** indicates p<0.0001, ns indicates not significant; error bars represent SEM.
Figure 4—figure supplement 2
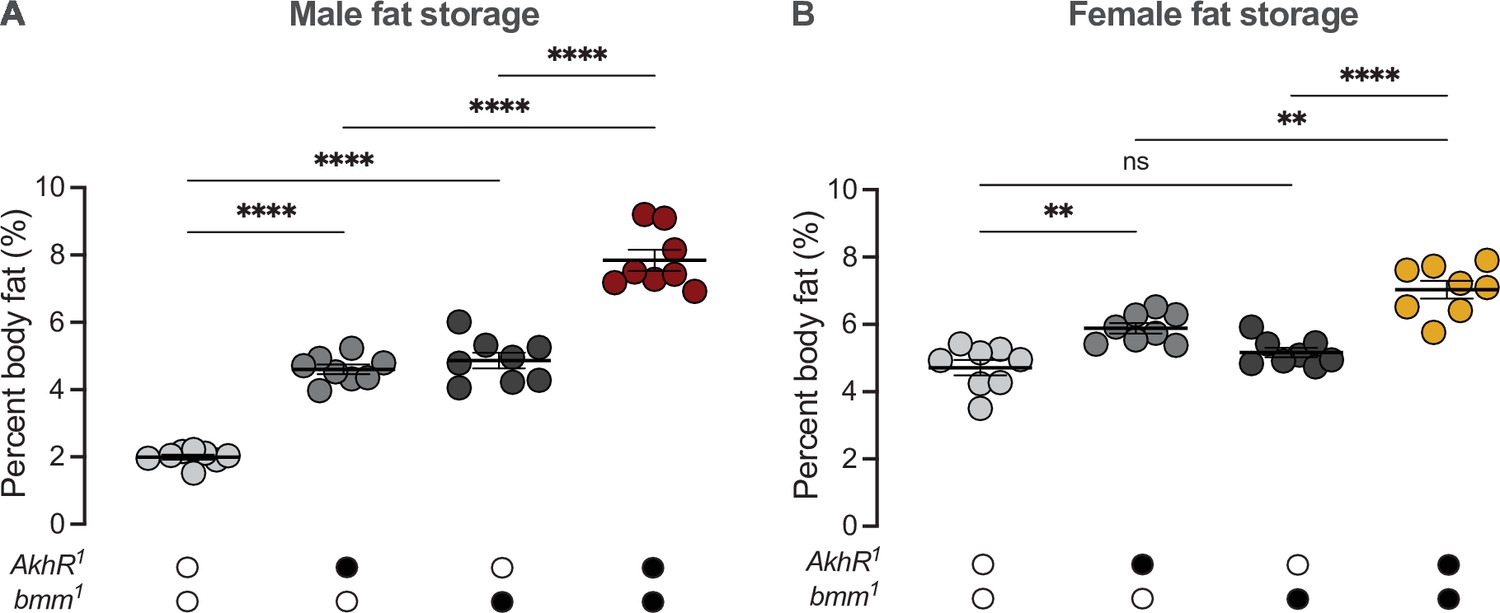
Akh and brummer operate in parallel pathways to regulate the sex difference in fat storage.
(A) Whole-body triglyceride levels were significantly higher in AkhR1 and bmm1 males, respectively, compared with w1118 controls (p<0.0001 and p<0.0001; one-way ANOVA followed by Tukey’s HSD). Whole-body triglyceride levels were further increased in AkhR1; bmm1 males compared with AkhR1 males and bmm1 males (p<0.0001 and p<0.0001, respectively; one-way ANOVA followed by Tukey’s HSD). n=7–8 biological replicates. (B) Whole-body triglyceride levels were significantly higher in AkhR1 females compared with w1118 controls; however whole-body triglyceride levels were not significantly different between bmm1 females and w1118 control females (p=0.002 and p=0.4256, respectively; one-way ANOVA followed by Tukey’s HSD). Whole-body triglyceride levels were further increased in AkhR1; bmm1 females compared to AkhR1 females and bmm1 females (p=0.0024 and p<0.0001, respectively; one-way ANOVA followed by Tukey’s HSD). n=8 biological replicates. Black circles indicate the presence of a mutant allele and open circles indicate the lack of a mutant allele. ** indicates p<0.01, **** indicates p<0.0001, ns indicates not significant; error bars represent SEM.
Figure 4—figure supplement 3
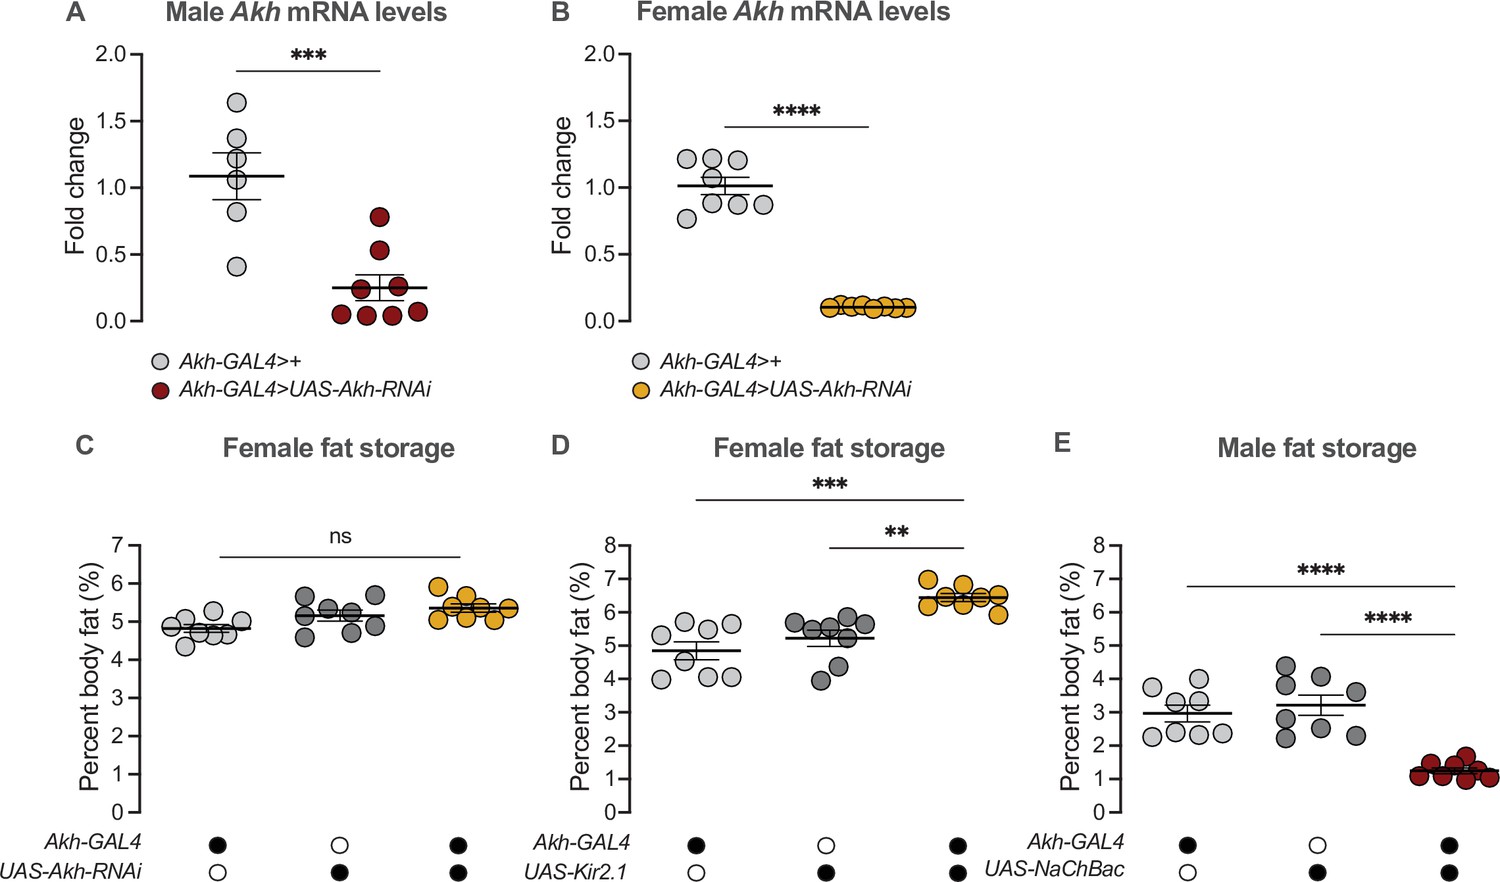
RNAi-mediated Akh knockdown effectively reduced Akh transcripts in both sexes.
(A) Akh mRNA levels in the head and anterior half of the thorax were significantly lower in Akh-GAL4>UAS-Akh-RNAi males compared with Akh-GAL4>+ controls (p=0.0008; Student’s t-test). n=5–8 biological replicates. (B) Akh mRNA levels in the head and anterior half of the thorax were significantly lower in Akh-GAL4>UAS-Akh-RNAi females compared with Akh-GAL4>+ controls (p<0.0001; Student’s t-test). n = 8 biological replicates. (C) Whole-body triglyceride levels were not significantly different between Akh-GAL4>UAS-Akh-RNAi females and both Akh-GAL4>+ and +>UAS-Akh-RNAi controls (p=0.0136 and p=0.4845, respectively; one-way ANOVA followed by Tukey’s HSD). n=8 biological replicates. (D) Whole-body triglyceride levels were significantly higher in Akh-GAL4>UAS-Kir2.1 females compared with Akh-GAL4>+ and +>UAS-Kir2.1 controls (p=0.0001 and p=0.0022, respectively; one-way ANOVA followed by Tukey’s HSD). n=8 biological replicates. (E) Whole-body triglyceride levels were significantly lower in Akh-GAL4>UAS-NaChBac males compared with Akh-GAL4>+ and +>UAS-NaChBac controls (p<0.0001 and p<0.0001, respectively; one-way ANOVA followed by Tukey’s HSD). n=8 biological replicates. Due to independent experiments with a shared GAL4 control, Akh-GAL4>+ males are shared between Figure 4E and (E). Akh-GAL4>+ females are shared between Figure 4F and (D). Black circles indicate the presence of a transgene and open circles indicate the lack of a transgene. ** indicates p<0.01, *** indicates p<0.001, **** indicates p<0.0001, ns indicates not significant; error bars represent SEM.
Figure 4—figure supplement 4
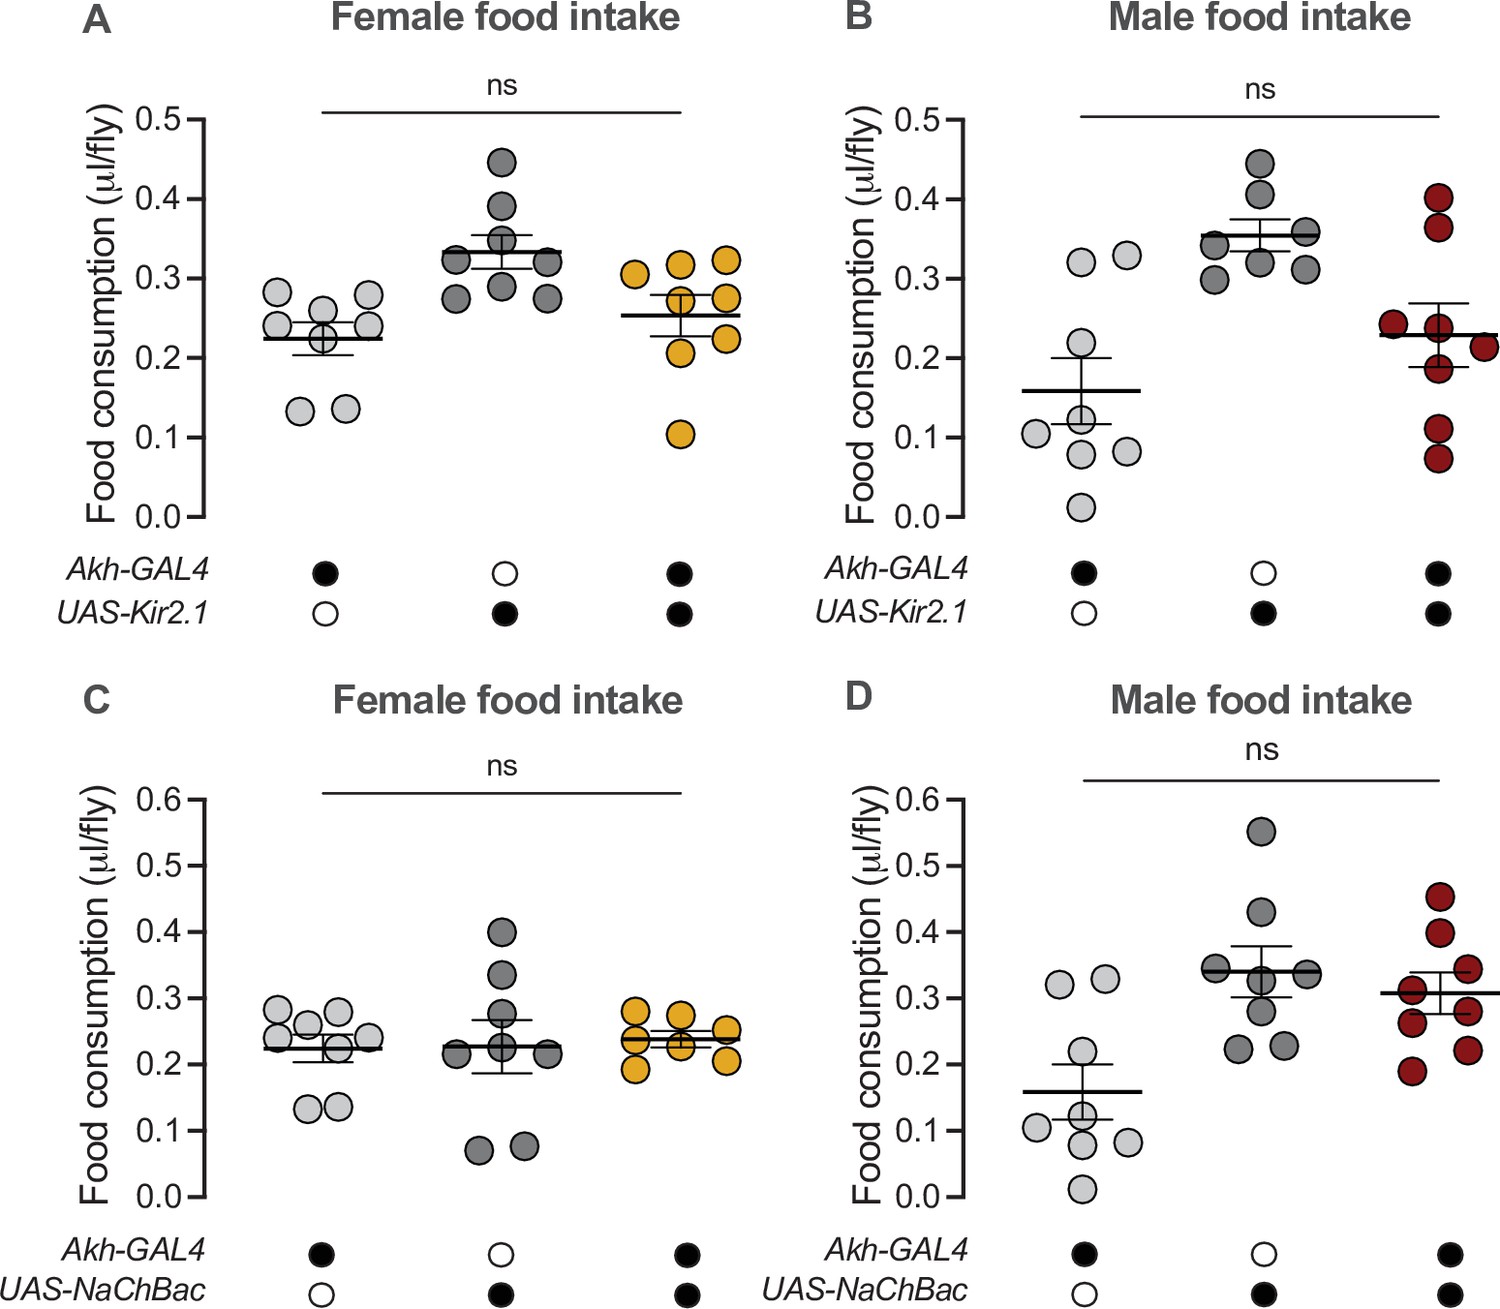
Activity of the Akh-producing cells does not regulate food consumption in either sex.
(A) Food consumption was not significantly different between Akh-GAL4>UAS-Kir2.1 females and Akh-GAL4>+ and +>UAS-Kir2.1 controls (p=0.6488 and p=0.0539, respectively; one-way ANOVA followed by Tukey’s HSD). n=8 biological replicates. (B) Food consumption was not significantly different between Akh-GAL4>UAS-Kir2.1 males and Akh-GAL4>+ and +>UAS-Kir2.1 controls (p=0.3623 and p=0.0638, respectively; one-way ANOVA followed by Tukey’s HSD). n=7–8 biological replicates. (C) Food consumption was not significantly different between Akh-GAL4>UAS-NaChBac females and Akh-GAL4>+ and +>UAS-NaChBac controls (p=0.9369 and p=0.9571, respectively; one-way ANOVA followed by Tukey’s HSD). n=7–8 biological replicates. (D) Food consumption was not significantly different between Akh-GAL4>UAS-NaChBac males and both Akh-GAL4>+ and +>UAS-NaChBac controls (p=0.0266 and p=0.8141, respectively; one-way ANOVA followed by Tukey’s HSD). n=8 biological replicates. Due to independent experiments with a shared GAL4 control, Akh-GAL4>+ females are shared between (A) and (C). Akh-GAL4>+ males are shared between (B) and (D). Black circles indicate the presence of a transgene and open circles indicate the lack of a transgene. ns indicates not significant; error bars represent SEM.
Figure 5 with 1 supplement
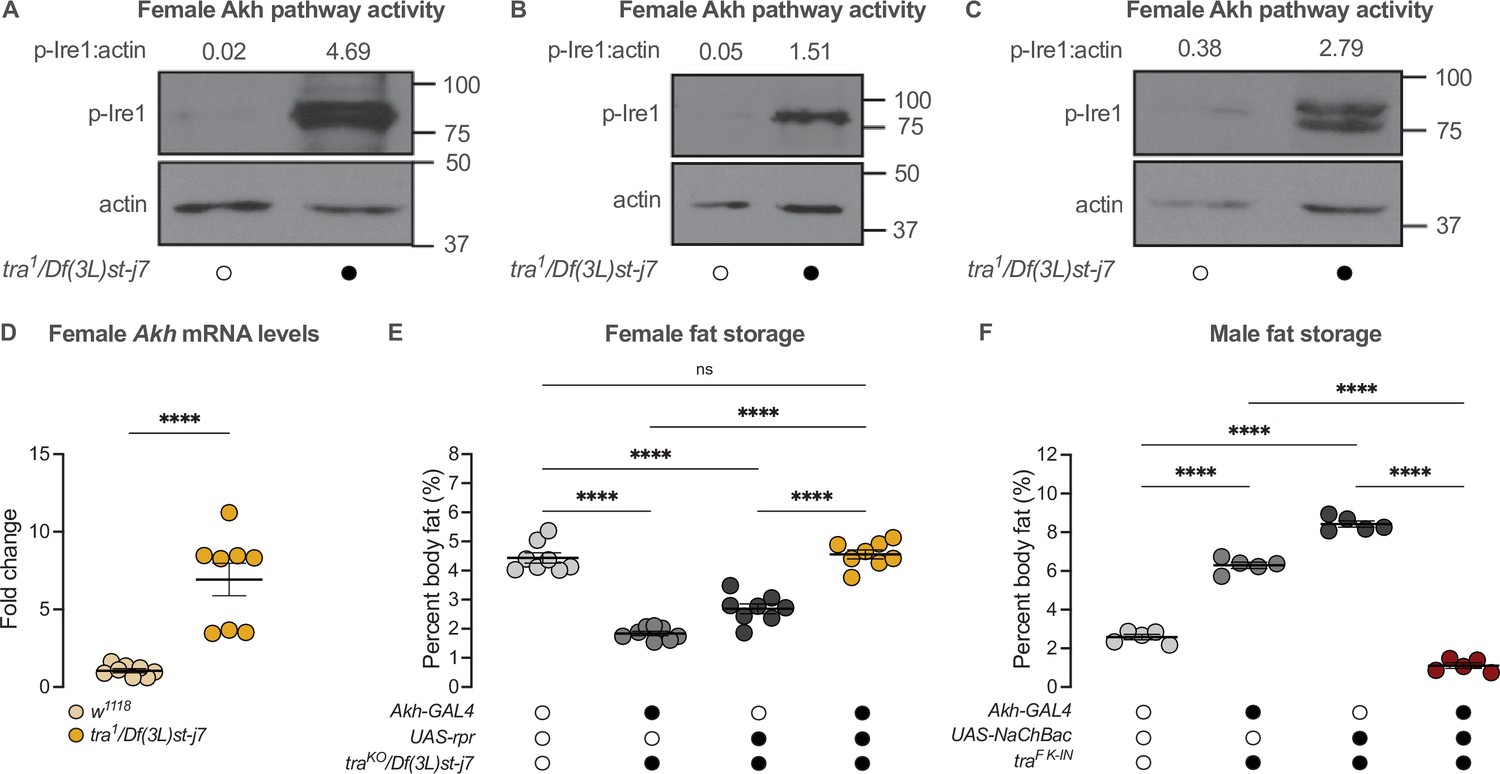
transformer regulates the sex difference in fat storage via the Akh signalling pathway.
(A–C) Whole-body p-Ire1 levels were higher in tra1/Df(3L)st-j7 females compared with w1118 controls in three biological replicates. (D) Whole-body Akh mRNA levels were significantly higher in tra1/Df(3L)st-j7 females compared with w1118 controls (p<0.0001; Student’s t-test). n=8 biological replicates. (E) Whole-body triglyceride levels were significantly lower in traKO/Df(3L)st-j7 females carrying either Akh-GAL4>+ or +>UAS-reaper (rpr) transgenes compared with w1118 controls carrying a functional Tra protein (p<0.0001 and p<0.0001, respectively; one-way ANOVA followed by Tukey’s HSD). Whole-body triglyceride levels were not significantly different between traKO/Df(3L)st-j7 females lacking APCs (Akh-GAL4>UAS-rpr) and w1118 controls (p=0.9384; one-way ANOVA followed by Tukey’s HSD). n=8 biological replicates. (F) Whole-body triglyceride levels were significantly higher in traF K-IN males carrying either Akh-GAL4>+ or +>UAS-NaChBac transgenes compared with w1118 control males lacking Tra function (p<0.0001 and p<0.0001, respectively; one-way ANOVA followed by Tukey’s HSD). Whole-body triglyceride levels in traF K-IN males with APC activation (Akh-GAL4>UAS-NaChBac) were significantly lower than traF K-IN males carrying either the Akh-GAL4>+ or +>UAS-NaChBac transgenes alone (p<0.0001 and p<0.0001, respectively; one-way ANOVA followed by Tukey’s HSD). n=5 biological replicates. Black circles indicate the presence of a transgene or mutant allele and open circles indicate the lack of a transgene or mutant allele. **** indicates p<0.0001, ns indicates not significant; error bars represent SEM. Original images for (A–C) are found in Figure 5—source data 1.
-
Figure 5—source data 1
Original blots for p-Ire1 and actin in females with whole-body loss of transformer.
- https://cdn.elifesciences.org/articles/72350/elife-72350-fig5-data1-v2.zip
Figure 5—figure supplement 1
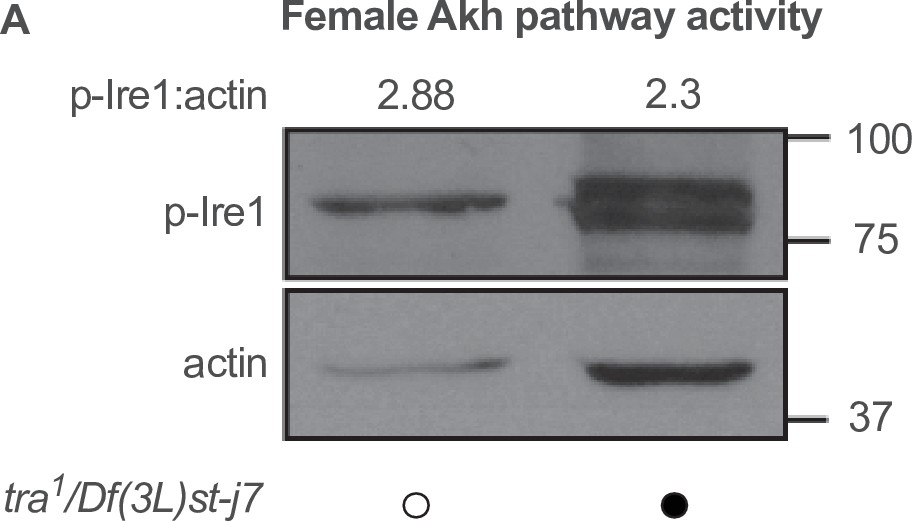
Whole-body p-Ire1 levels in transformer mutant flies.
(A) Whole-body p-Ire1 levels were not higher in tra1/Df(3L)st-j7 females compared with w1118 control females in one biological replicate. Black circles indicate the presence of a mutant allele and open circles indicate the lack of a mutant allele. Original image for (A) is found in Figure 5—figure supplement 1—source data 1.
-
Figure 5—figure supplement 1—source data 1
Original blots for p-Ire1 and actin in females with whole body loss of transformer.
- https://cdn.elifesciences.org/articles/72350/elife-72350-fig5-figsupp1-data1-v2.zip
Figure 6

Sex-specific regulation of Akh signalling pathway promotes reproductive success in each sex.
(A) At all observation points, a lower proportion of AkhA males were successfully copulating with a wildtype Canton-S (CS) female compared with w1118 controls. n=31 males. (B) The number of pupae produced from a 60-min mating period was significantly lower in AkhA males compared with w1118 controls (p=0.0003; Student’s t-test). n=24–26 males. (C) The number of pupae produced from a 24-hr mating period was not significantly different between AkhA males and w1118 control males (p=0.2501; Student’s t-test). n=24–25 males. (D) The number of pupae produced from a 24-hr mating period was significantly higher in AkhA females compared with w1118 controls (p=0.0006; Student’s t-test). n=28–36 females. (E) Lifespan was significantly shorter in Akh-GAL4>UAS-Kir2.1 females compared with Akh-GAL4>+ and +>UAS-Kir2.1 controls (p<2×10–16 and p=0.0015, respectively; log-rank test, Bonferroni’s correction for multiple comparisons). n=160–198 females. (F) Lifespan of Akh-GAL4>UAS-Kir2.1 males was intermediate between Akh-GAL4>+ and +>UAS-Kir2.1 controls, indicating no overall effect of inhibiting APC neuronal activity on male lifespan (p=0.00013 and p=7.0×10⁻⁶, respectively; log-rank test, Bonferroni’s correction for multiple comparisons). n=196–200 males. ** indicates p<0.01, *** indicates p<0.001, **** indicates p<0.0001, ns indicates not significant; error bars represent SEM; shaded areas represent the 95% confidence interval.
Figure 7
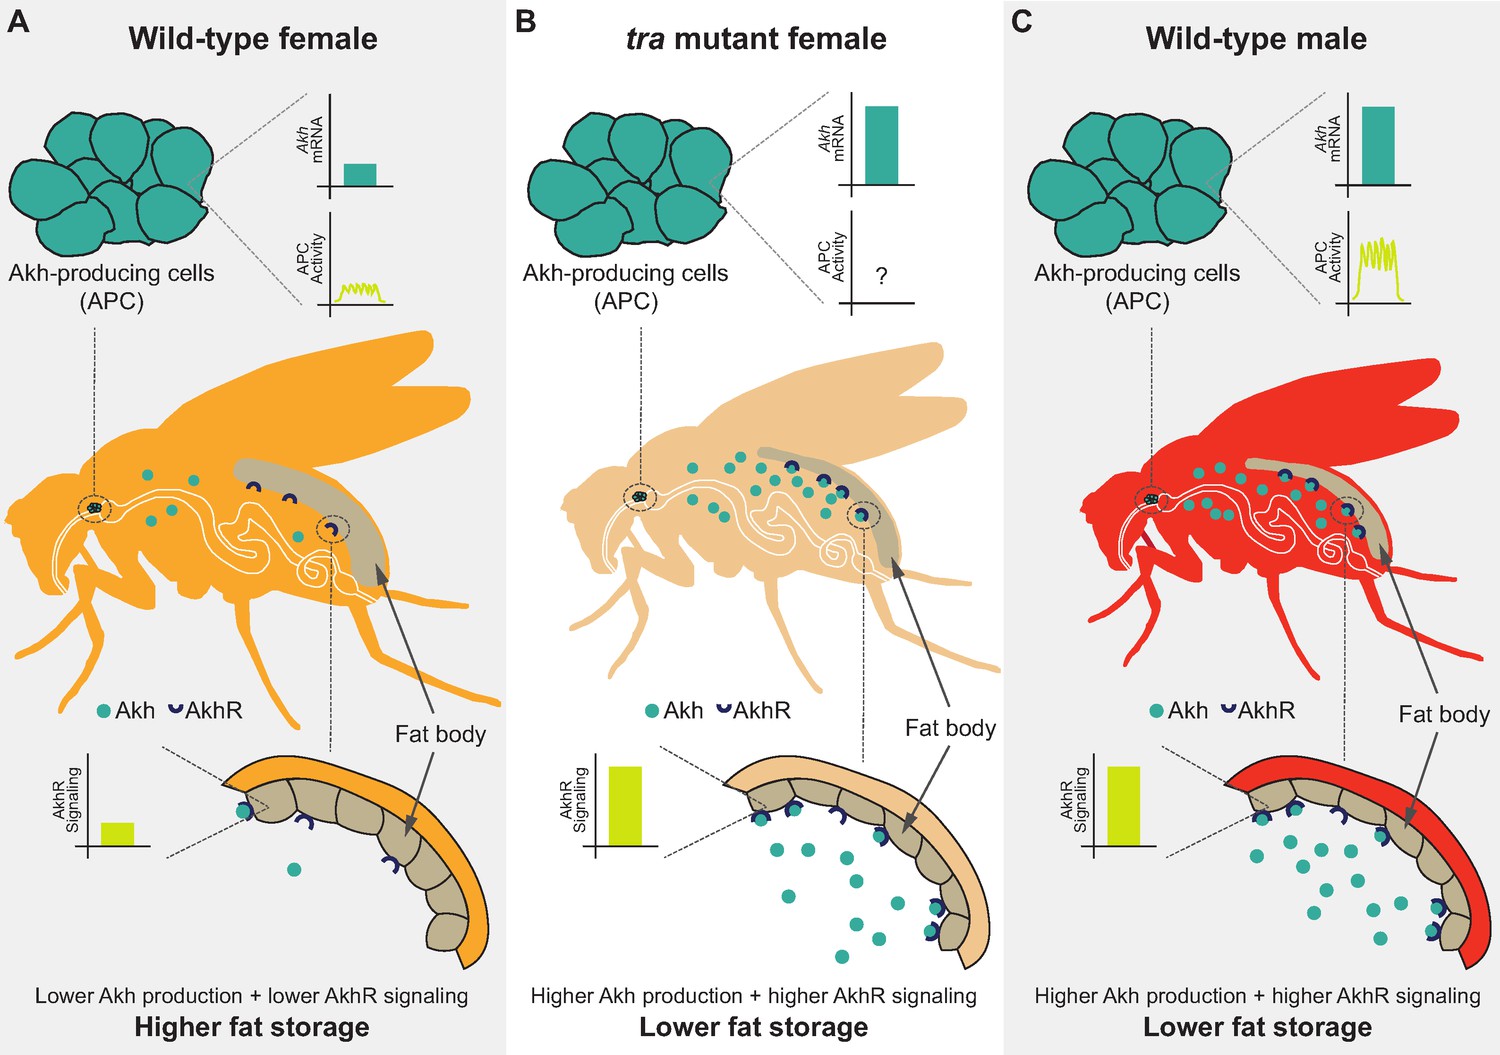
Sex-specific regulation of the Akh pathway by tra contributes to the sex difference in fat storage.
(A) In wild-type females, Akh mRNA transcripts and APC activity are lower compared with wild-type males, leading to lower AkhR signaling. Given that AkhR signaling stimulates fat breakdown, lower AkhR signaling in females contributes to higher female fat storage. (B) In females lacking functional tra, Akh mRNA transcripts are higher compared with wild-type females, leading to higher AkhR signaling. Higher AkhR signaling in tra mutant females contributes to lower tra mutant female fat storage. (C) In wild-type males, Akh mRNA transcripts and APC activity are higher compared with wild-type females, leading to higher AkhR signaling. Higher AkhR signaling in males contributes to lower male fat storage.
Additional files
-
Supplementary file 1
1 p-values.
- https://cdn.elifesciences.org/articles/72350/elife-72350-supp1-v2.xlsx
-
Supplementary file 2
Raw data.
- https://cdn.elifesciences.org/articles/72350/elife-72350-supp2-v2.xlsx
-
Supplementary file 3
Primers.
- https://cdn.elifesciences.org/articles/72350/elife-72350-supp3-v2.xlsx
-
Supplementary file 4
Fly food media.
- https://cdn.elifesciences.org/articles/72350/elife-72350-supp4-v2.xlsx
-
Transparent reporting form
- https://cdn.elifesciences.org/articles/72350/elife-72350-transrepform1-v2.docx
Download links
A two-part list of links to download the article, or parts of the article, in various formats.
Downloads (link to download the article as PDF)
Open citations (links to open the citations from this article in various online reference manager services)
Cite this article (links to download the citations from this article in formats compatible with various reference manager tools)
Sex determination gene transformer regulates the male-female difference in Drosophila fat storage via the adipokinetic hormone pathway
eLife 10:e72350.
https://doi.org/10.7554/eLife.72350


