Principles of mRNA targeting via the Arabidopsis m6A-binding protein ECT2
- University of Copenhagen, Copenhagen Plant Science Center, Denmark
- Department of Biology, University of Copenhagen, Denmark
- University of Bielefeld, Faculty of Biology, RNA Biology and Molecular Physiology, Germany
Figures
Figure 1 with 1 supplement
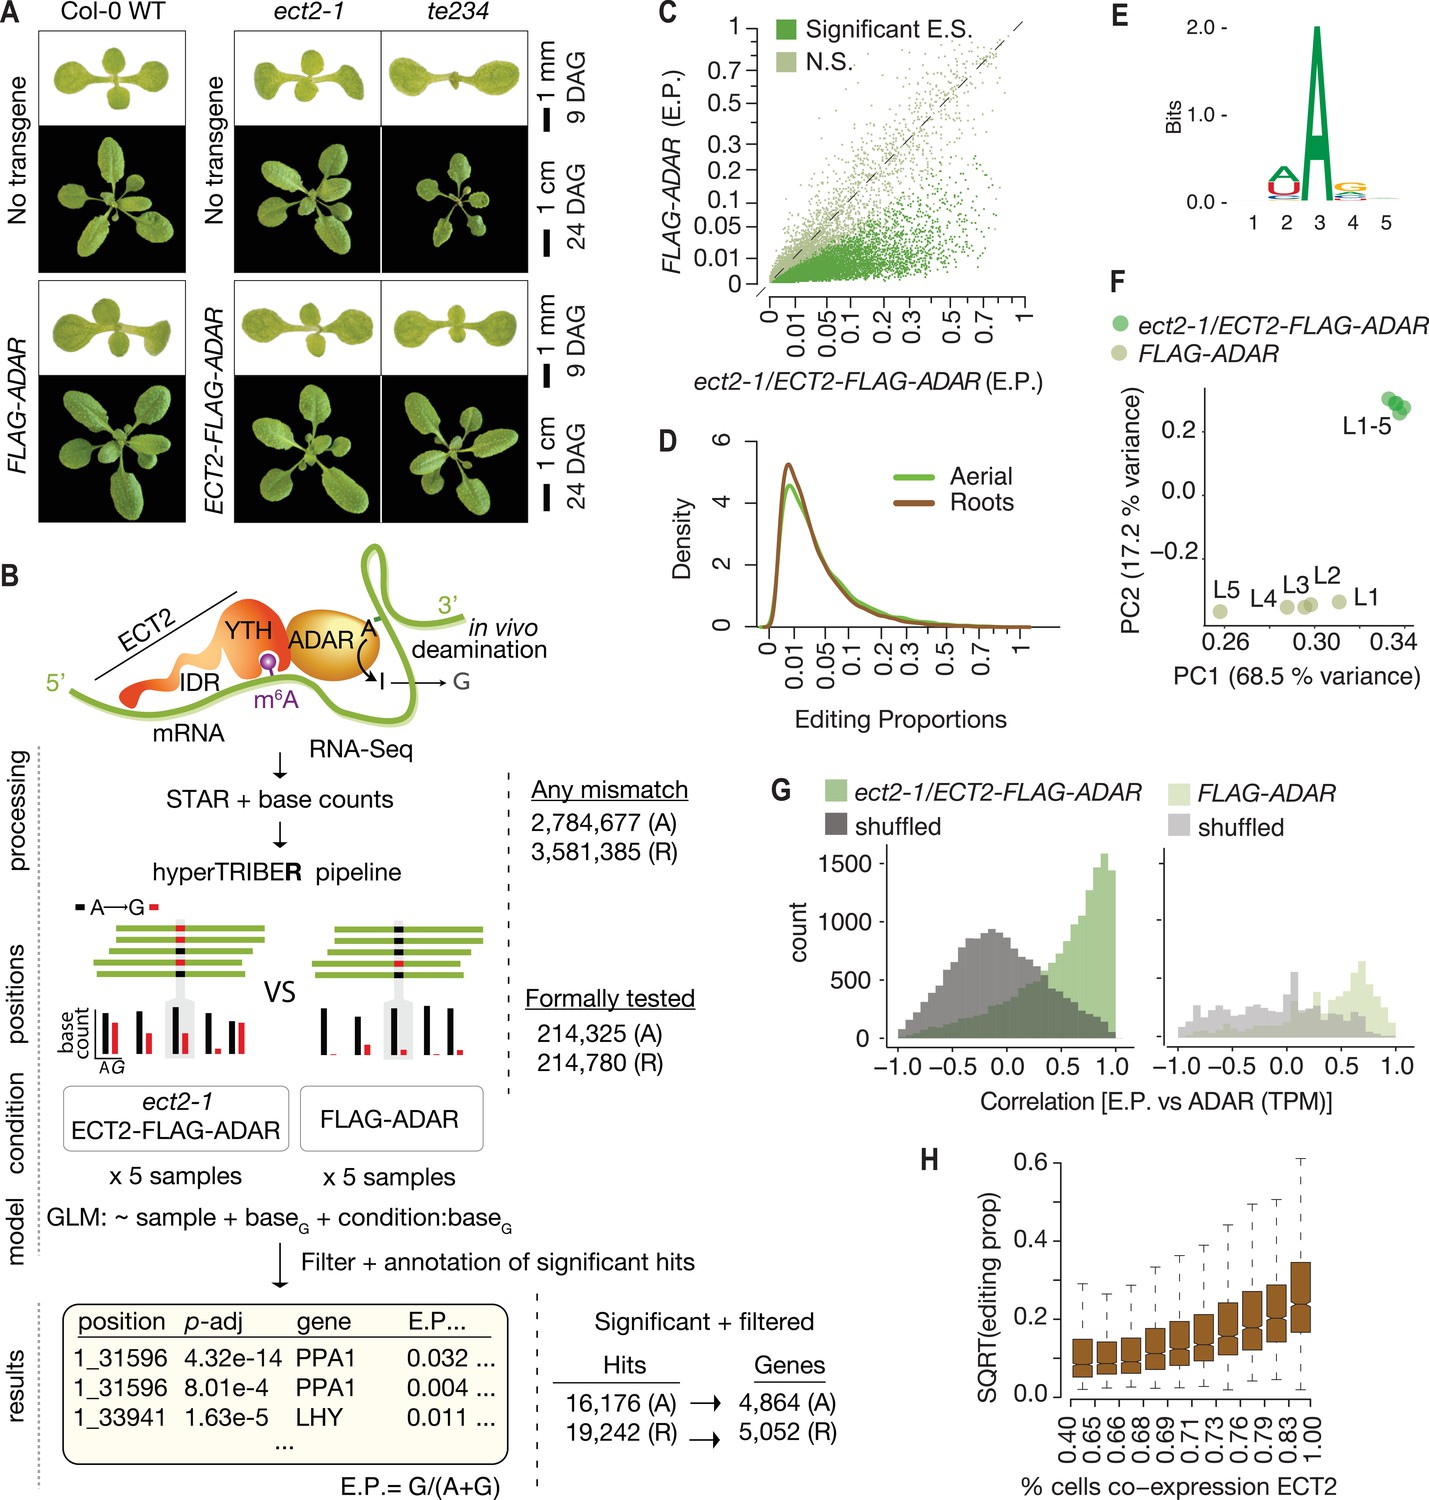
Drosophila ADARcd fused to ECT2 can edit target mRNAs in vivo in plants.
(A) Phenotypes of wild type, ect2-1 and te234 mutants with (lower panels) or without (upper panels) ECT2-FLAG-ADAR or FLAG-ADAR transgenes, at 9 or 24 days after germination (DAG). (B) Experimental design for ECT2-HyperTRIBE (ECT2-HT) target identification and hyperTRIBER pipeline (Rennie et al., 2021). Nucleotide base counts quantified from mapped RNA-seq libraries were passed into the hyperTRIBER pipeline to call significant editing sites, which were further filtered and annotated. The number of sites in either aerial (A, dissected apices) or root (R, root tips) tissues considered at each stage of the analysis is indicated. GLM, generalized linear model; E.P., editing proportion. (C) Scatterplot of the editing proportions of potential and significant editing sites (E.S.) in aerial tissues of ect2-1/ECT2-FLAG-ADAR lines compared to the FLAG-ADAR controls. Significant sites are highlighted in vivid green. N.S., not significant. (D) Density of editing proportions for significant editing sites in aerial tissues and roots of ect2-1/ECT2-FLAG-ADAR lines. (E) Consensus motif identified at significant editing sites in aerial tissues of ect2-1/ECT2-FLAG-ADAR lines. (F) Principal component analysis of editing proportions at significant editing sites in samples with aerial tissues. (G) Distribution of the correlations between editing proportions and ADAR expression (TPM) for significant editing sites in aerial tissues of either ect2-1/ECT2-FLAG-ADAR or FLAG-ADAR lines. Background correlations (gray) are based on randomly shuffling ADAR expression for each site. (H) Boxplots showing the mean editing proportions as a function of the proportion of cells co-expressing ECT2, calculated based on single cell RNA-seq in roots (Denyer et al., 2019). For panels C, E, F, and G, comparable analyses in both aerial and root tissues are shown in the Figure 1—figure supplement 1.
Figure 1—figure supplement 1
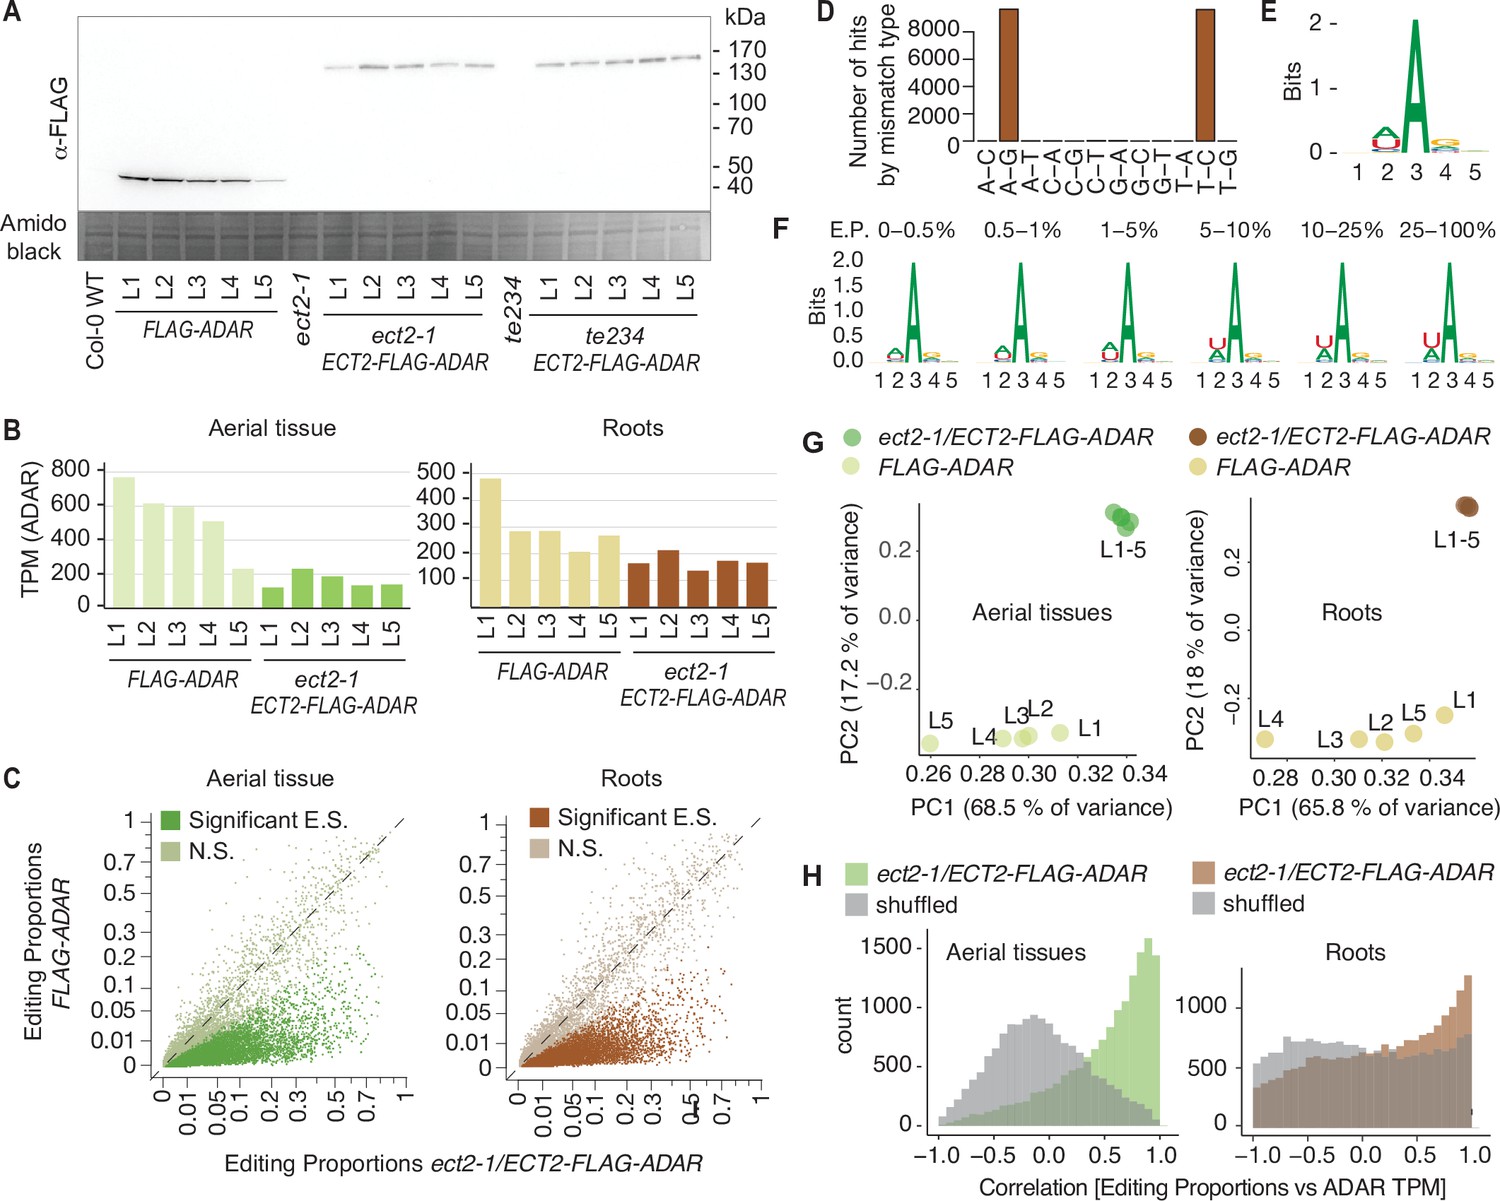
Drosophila ADARcd fused to ECT2 can edit target mRNAs in vivo in plants (extended data, aerial and root tissues).
(A) Protein expression levels of ECT2pro:ECT2-FLAG-DmADARE488Qcd-ECT2ter (ECT2-FLAG-ADAR) or ECT2pro:FLAG-DmADARE488Qcd-ECT2ter (FLAG-ADAR) transgenes in 10-day-old seedlings of five independent transgenic lines (L1–L5) of each of the genotypes shown in Figure 1A and their background controls. Amido black staining is used as loading control. (B) mRNA expression levels (TPM) of ECT2-FLAG-ADAR or FLAG-ADAR in dissected apices (aerial tissues) or root tips of the lines used for ECT2-HyperTRIBE (ECT2-HT). (C) Scatterplot of the editing proportions, defined as G/(A + G), of potential and significant editing sites (E.S.) in aerial and root tissues of ect2-1/ECT2-FLAG-ADAR lines compared to the FLAG-ADAR controls. Significant sites are highlighted in vivid colors. N.S., not significant. (D) Number of significant hits in root samples by mismatch type, after filtering but before removing non-A-G or non-T-C sites. (E, F) Consensus motif identified at significant editing sites in roots of ect2-1/ECT2-FLAG-ADAR lines, split in groups by editing proportions (E.P.) in (F). (G) Principal component analysis of editing proportions for significant editing sites. (H) Distribution of the correlations between editing proportions and ADAR expression (TPM) for significant editing sites. Background correlations (gray) are based on randomly shuffling ADAR expression for each site.
-
Figure 1—figure supplement 1—source data 1
Uncropped labeled panels and raw image files: Figure 1—figure supplement 1A.
- https://cdn.elifesciences.org/articles/72375/elife-72375-fig1-figsupp1-data1-v2.zip
Figure 2
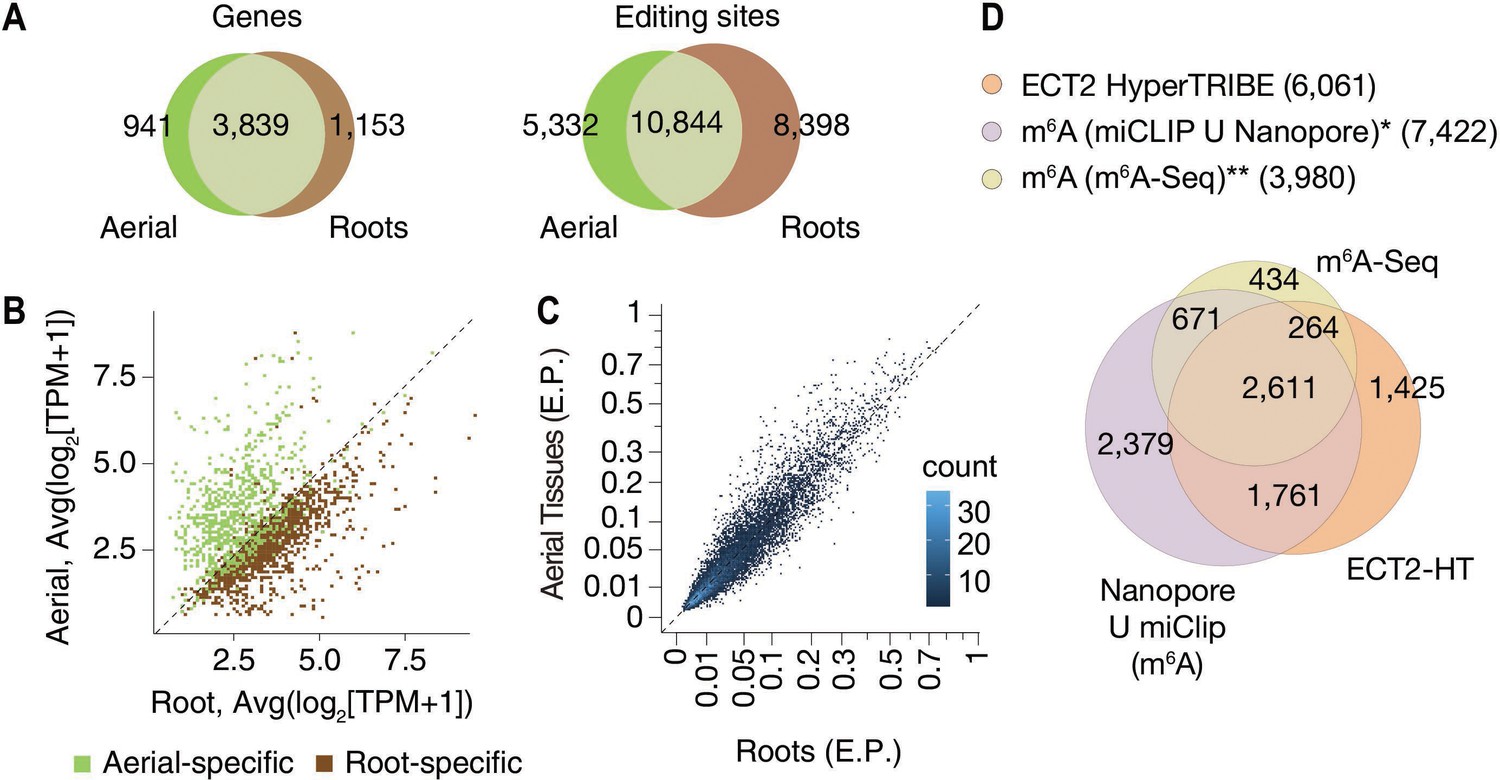
HyperTRIBE identifies m6A-reader targets in plants.
(A) Overlap between ECT2-HT targets (genes and editing sites) in roots and aerial tissues, based on genes commonly expressed in both tissues. (B) Scatterplot showing the expression levels in roots and aerial tissues (mean log2(TPM+1) over the five ECT2-HT control samples) of the genes identified as aerial or root-specific targets. (C) Scatterplot of the editing proportions (E.P.) of significant editing sites in ECT2-HT for aerial vs root tissues. (D) Overlap between ECT2-HT targets and m6A-containing genes. *Parker et al., 2020; ** Shen et al., 2016.
Figure 3 with 4 supplements
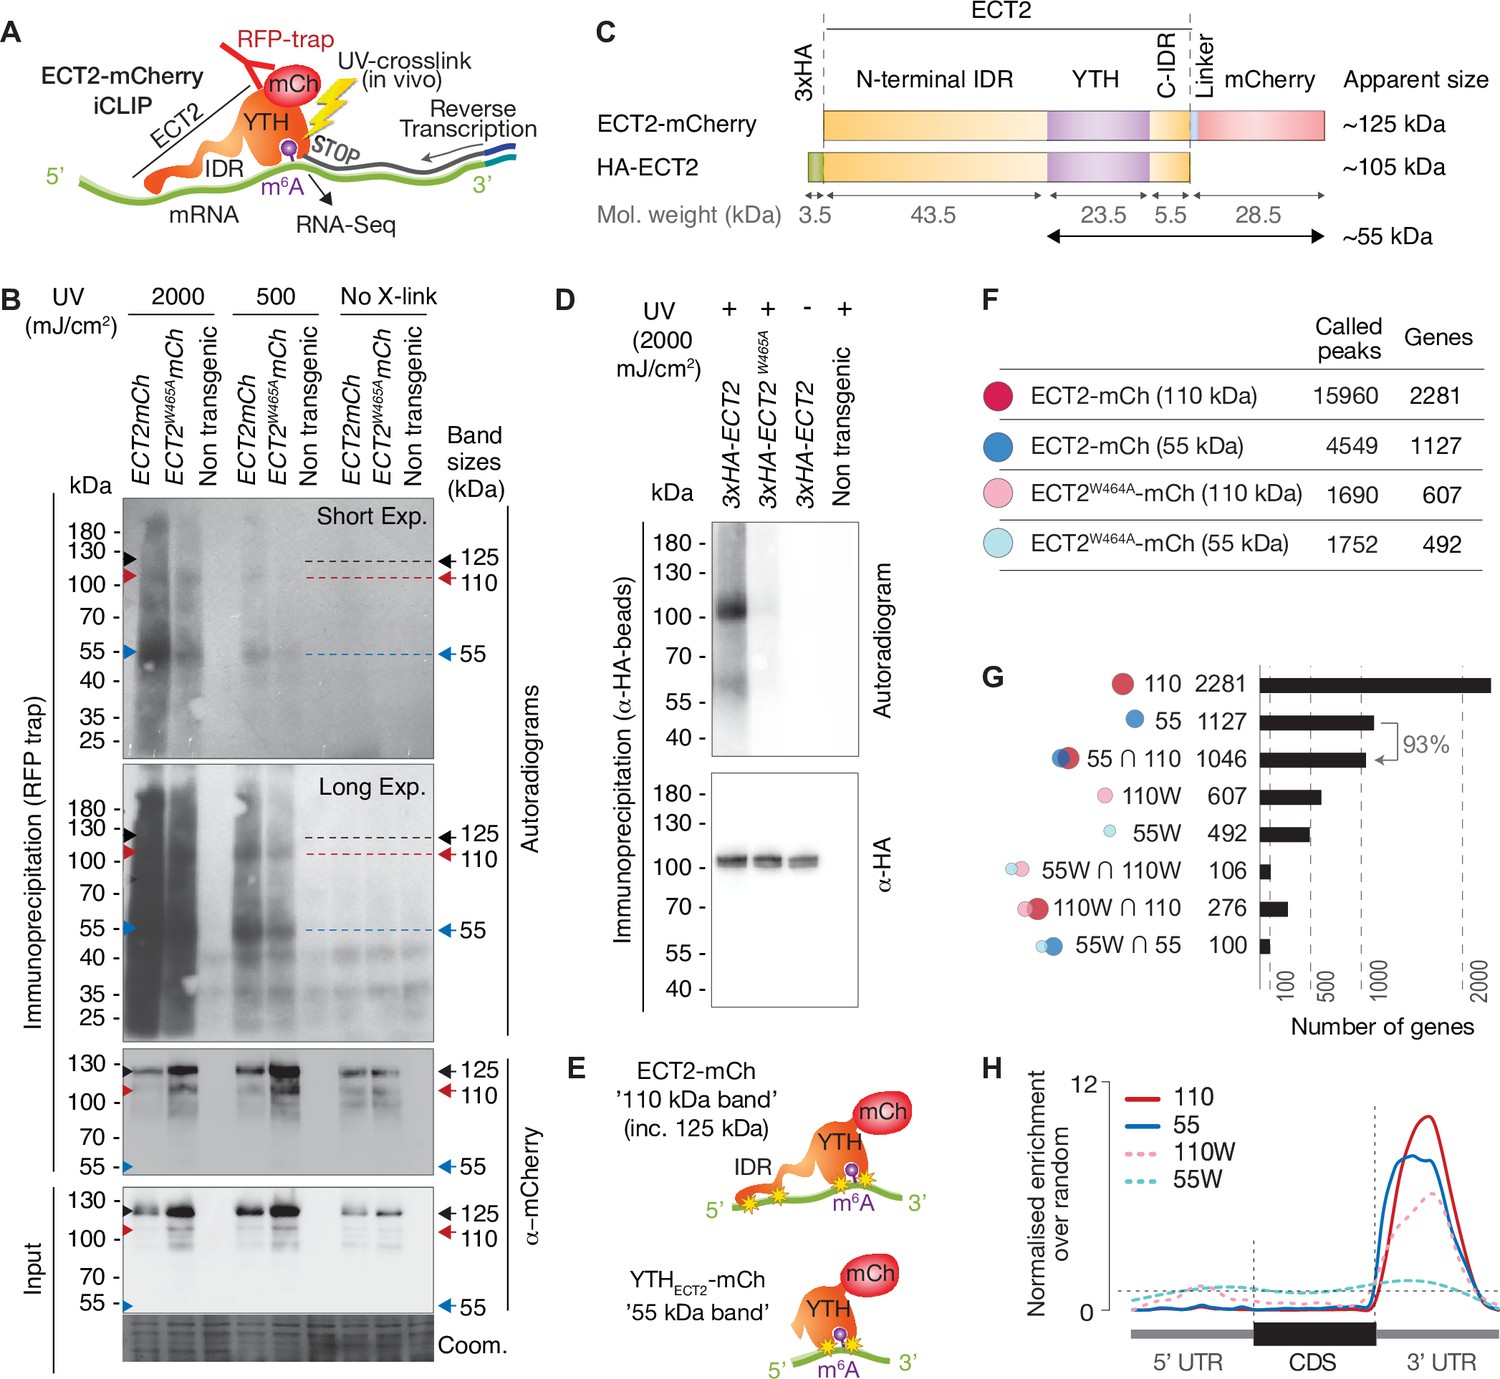
RNA-binding properties of ECT2 revealed by CLIP.
(A) iCLIP experimental design. (B) Upper panels: autoradiogram (top) and α-mCherry protein blot (below) of RFP-trap immuno-purifications. Samples are cell extracts from 12-day-old seedlings expressing ECT2-mCherry or ECT2W464A-mCherry in the ect2-1 mutant background after in vivo UV-crosslinking as indicated, and subjected to DNase digestion, partial RNase digestion, and 5’-32P labeling of RNA. Non-transgenic, Col-0 wild type. Lower panels: α-mCherry protein blot of the same extracts before immunoprecipitation (input) and Coomassie staining of the membrane. Sizes corresponding to full length ECT2-mCherry (~125 kDa) and the most apparent RNA bands are indicated with arrows. A repeat of the experiment with independently grown and crosslinked tissue is shown in the Figure 3—figure supplement 1A. (C) Schematic representation of ECT2-mCherry and HA-ECT2 fusion proteins with their apparent size (electrophoretic mobility). The molecular weight of each region is indicated. Notice that IDRs tend to show higher apparent sizes (lower electrophoretic mobility) than globular domains. (D) Equivalent to B with lines expressing 3xHA-ECT2 variants in the ect2-1 background, α-HA immuno-purifications and α-HA detection by western blot. (E) Cartoon illustrating the nature of the bands of labelled RNA co-purifying with ECT2-mCherry. Yellow stars indicate possible crosslinking sites. (F) Number of called peaks and genes detected from the four iCLIP libraries sequenced for this study (Figure 3—figure supplement 3). (G) Upset plot showing single and pairwise combinations of genes for the four sequenced iCLIP libraries. Additional intersections can be found in the Figure 3—figure supplement 4. (H) Metagene profiles depicting the enrichment along the gene body (5’UTR, CDS or 3’UTR) of the called iCLIP peaks detailed in F.
-
Figure 3—source data 1
Uncropped labelled panels and raw image files - Figure 3B, D.
- https://cdn.elifesciences.org/articles/72375/elife-72375-fig3-data1-v2.zip
Figure 3—figure supplement 1
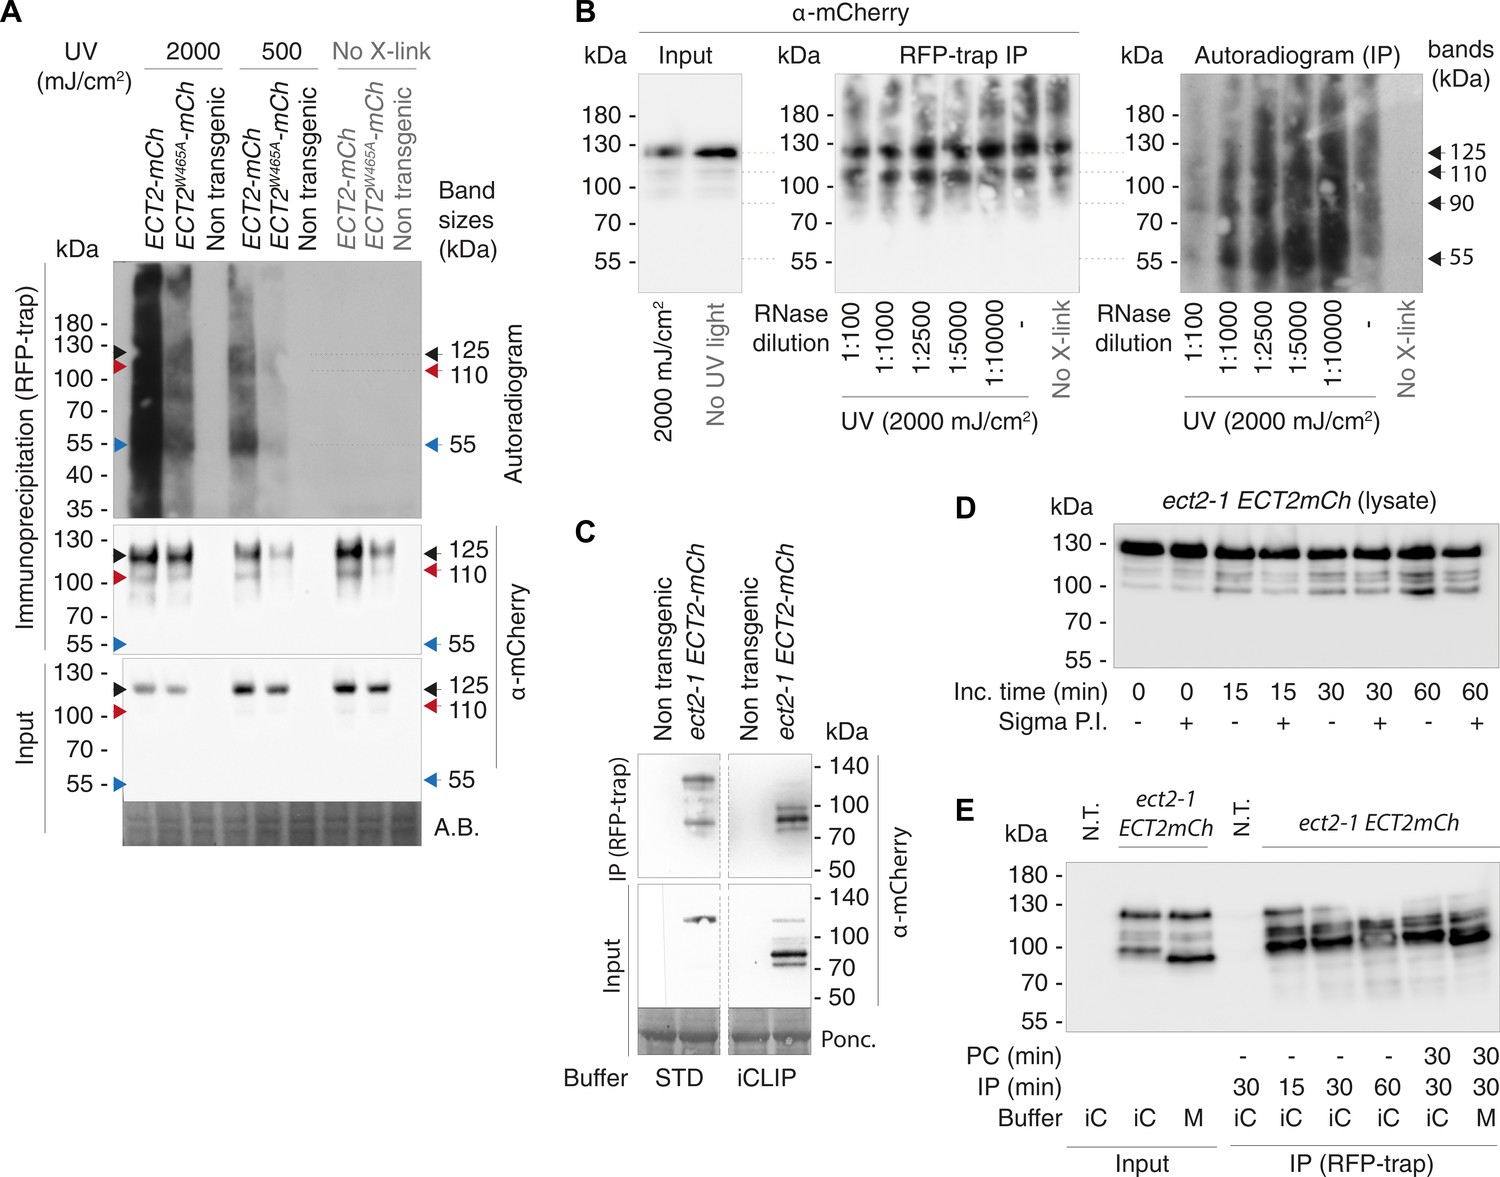
UV-crosslinked RNA co-purifies with ECT2-mCherry in a pattern that depends on the proteolytic cleavage of the ECT2 intrinsically disordered region (IDR) in the lysate.
(A) Independent repeat of the CLIP experiment in Figure 3B. Sizes corresponding to full-length ECT2-mCherry (~125-kDa) (Figure 3C) and the most apparent RNA bands are indicated. (B) Same as (A) using a gradient of increasing concentrations of RNase I. Dilutions refer to the 100 U/μL stock, from which 5 μL were added to 100 μL reactions (e.g., 1:5000 corresponds to the final concentration of 1 U/mL used in all other CLIP experiments and for construction of iCLIP libraries). Note that the background in the IP-western blot is presumably due to lack of cooling during the 3-hr-long SDS-PAGE in this first experiment. (C) α-mCherry protein blot of lysates (input) or immunopurifications (RFP-trap) incubated for 1 hr at 4°C in either standard (STD) IP buffer (50 mM Tris-HCl, pH 7.5, 150 mM NaCl, 5 mM MgCl2, 10% glycerol, 4 mM DTT, 0.1% Nonidet P-40) or iCLIP buffer (50 mM Tris-HCl pH 7.5, 150 mM NaCl, 4 mM MgCl2, 5 mM DTT, 1% SDS, 0.25% sodium deoxycholate, 0.25% Igepal), both supplemented only with Roche EDTA-free Protease Inhibitor Cocktail (1 tablet/10 mL). All IP or input lanes have been developed identically on the same membrane. Dashed lines indicate cropping of lanes containing samples irrelevant for this work. Part of the input/non-transgenic/STD buffer sample lane was accidentally left out when the membrane was developed (the thin line indicates the border of the photograph), but the remaining half lane suggests absence of signal. (D) α-mCherry protein blot of cell extracts incubated for increasing amounts of time (at 4°C) in iCLIP buffer supplemented with 4 mM PMSF, 1 tablet/10 mL of Complete Protease Inhibitor Cocktail (Roche), and with or without Sigma Protease Inhibitor Optimized for Plant Extracts (1/30 vol). The progressive, protease inhibitor-sensitive appearance of <125kDa ECT2-mCherry species is evidence of their generation by proteolysis in the lysate. (E) α-mCherry protein blot of lysates (input) or immunopurifications (RFP-trap) from plants expressing ECT2-mCherry using different preclearing (PC) and immunoprecipitation (IP) times at 4°C, either in iCLIP buffer (iC) or in a milder (M) variant with ½ amount of detergents, both supplemented with 1 mM PMSF and 1 tablet/10 mL of Complete Protease Inhibitor Cocktail (Roche). Again, the progressive appearance of <125kDa ECT2-mCherry species with increasing incubation time is seen.
-
Figure 3—figure supplement 1—source data 1
Uncropped labeled panels and raw image files: Figure 3—figure supplement 1A-E.
- https://cdn.elifesciences.org/articles/72375/elife-72375-fig3-figsupp1-data1-v2.zip
Figure 3—figure supplement 2
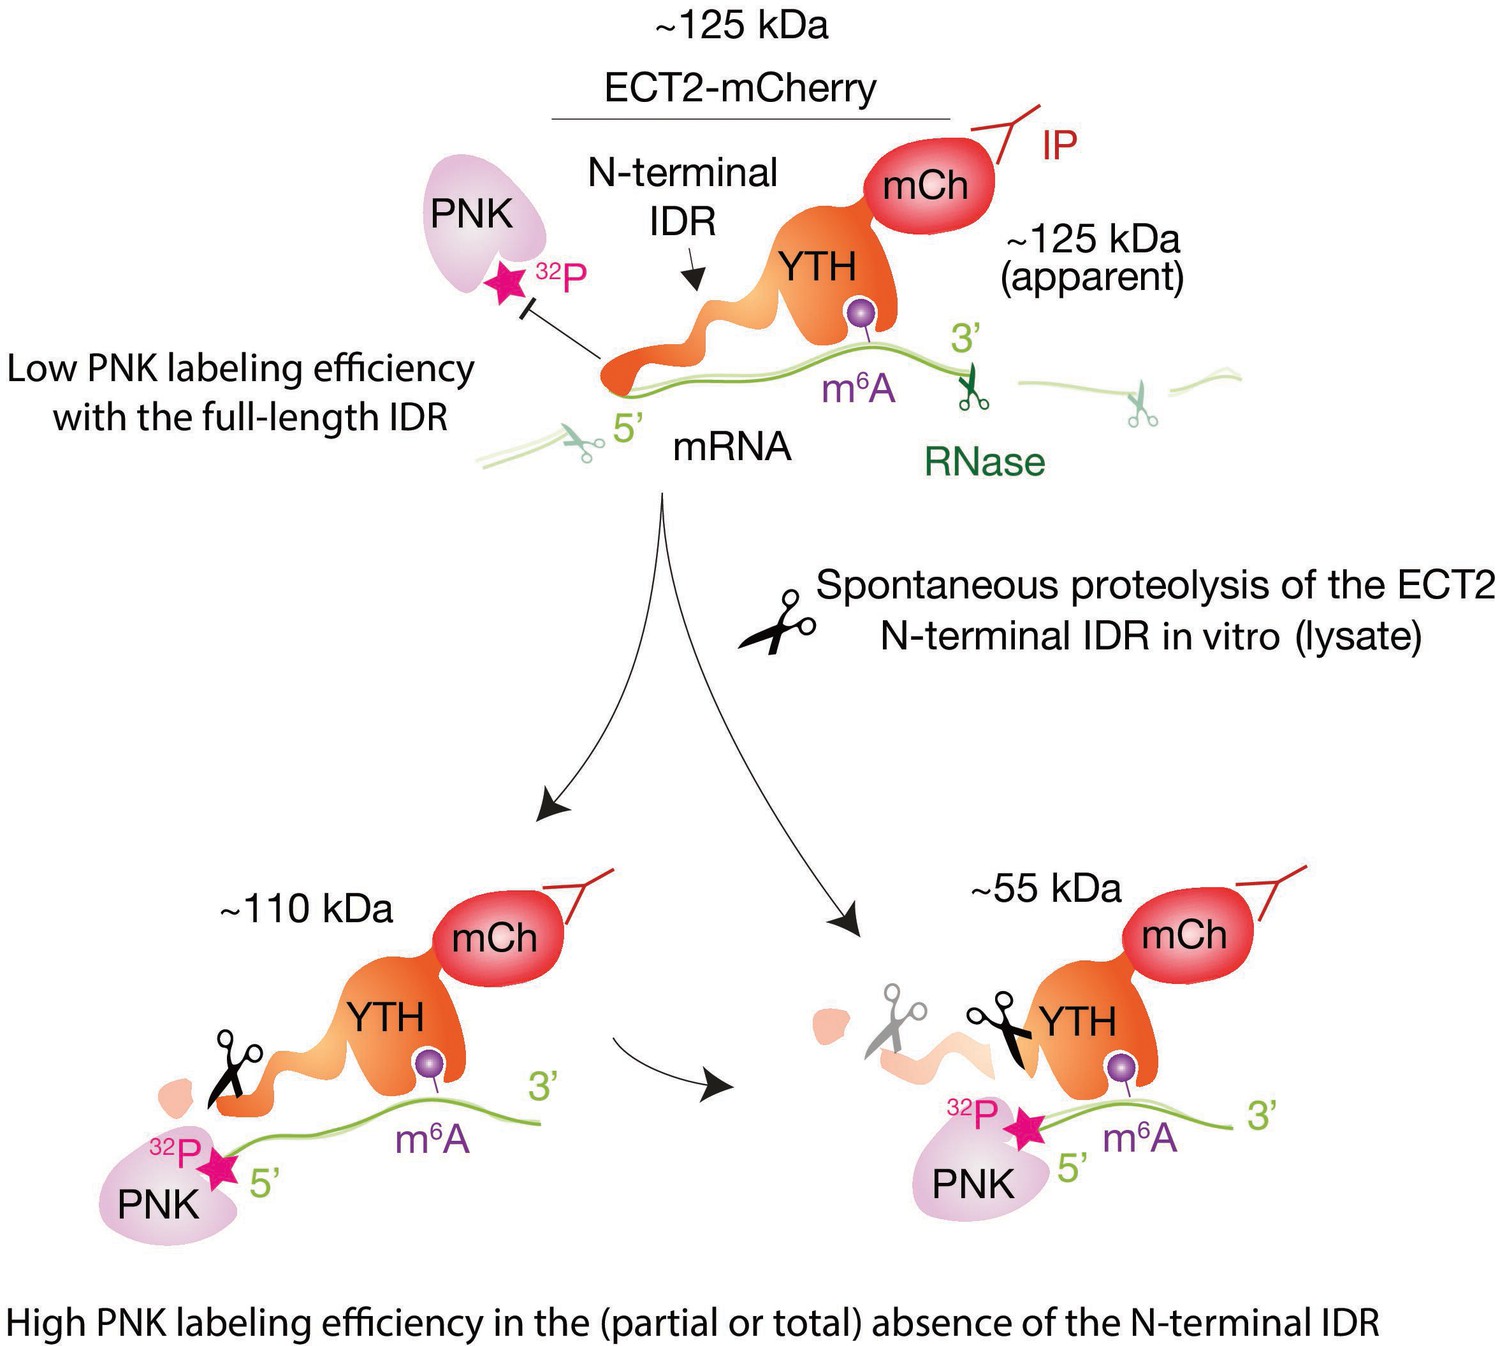
Illustration of RNA-binding properties of ECT2 revealed by CLIP.
Interpretation of the pattern of labeled RNA in CLIP experiments due to the spontaneous proteolysis of the ECT2 intrinsically disordered region (IDR) in the lysate, and the different labeling efficiency of bound RNA: RNA co-migrating with the most abundant ECT2-mCherry fragment (full-length, ~125kDa) is barely labeled while the strongest signal appears at ~55kDa (the size of the YTH domain fused to mCherry), where protein abundance is below the western blot detection limit (Figure 3B and C). This observation suggests limited accessibility of 5′-ends of full length ECT2-bound RNA to polynucleotide kinase (PNK), likely due to binding to the IDR. Supporting this idea, the samples containing full-length protein (’110kDa band’) required fewer PCR cycles to obtain similar amounts of library DNA and generated more unique reads than their ‘55kDa band’ counterparts (Figure 3—figure supplements 3 and 4), indicating that most of the RNA co-purifies with full-length ECT2-mCherry, and the stronger intensity of the ‘55kDa band’ (Figure 3B) is indeed due to differences in labeling efficiency.
Figure 3—figure supplement 3
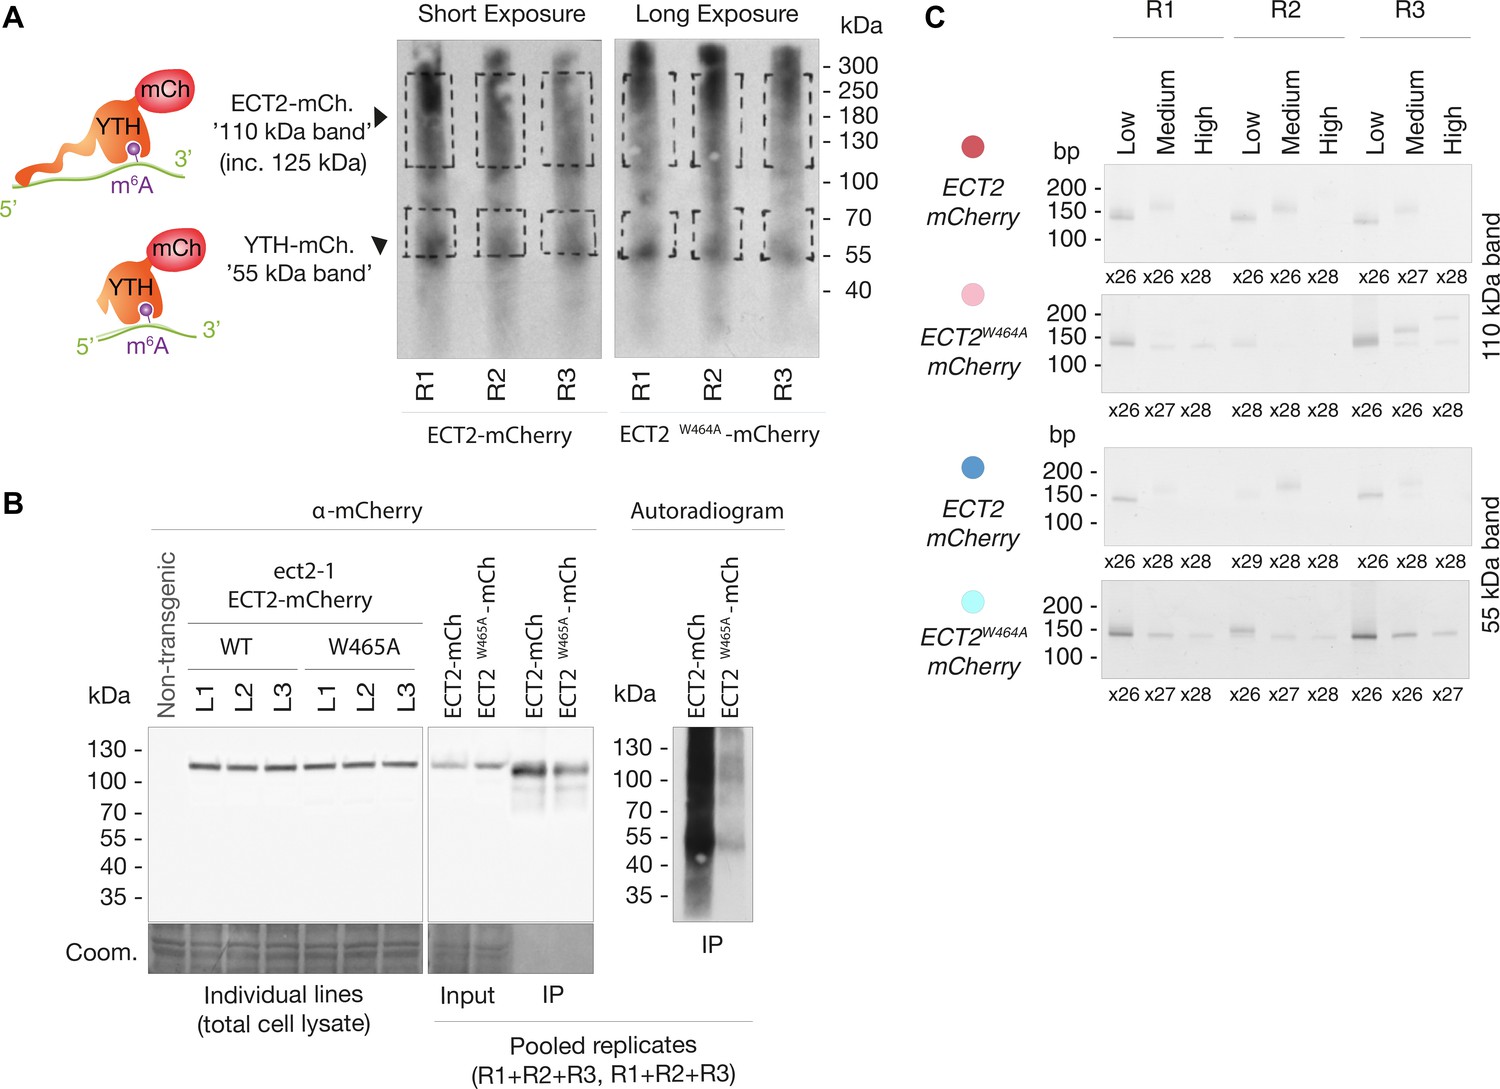
iCLIP Libraries.
(A) Autoradiograms showing labeled RNA co-purified with ECT2-mCherry and ECT2W464A-mCherry in the replicates used to generate iCLIP libraries. Handwritten dashed lines on the films were used as guides to excise the corresponding membrane pieces (‘110 ’Da’ and ‘55kDa’ bands) with a scalpel. The apparently comparable amount of labeled RNA in the two panels, generated from two different membranes and gels run and blotted identically, but separately is a product of different exposure times, which were adjusted in each case for optimal visualization of the RNA. (B) Left panel: α-mCherry protein blot from cell extracts of the 3 + 3 independent lines used for iCLIP. Middle and right panels: α-mCherry protein blot and autoradiogram of the cell extracts (input) and the RFP-trap IPs used to prepare the iCLIP libraries. Because samples for ECT2-mCherry and ECT2W464A-mCherry samples were run in separate gels to prevent cross-contamination, pooled aliquots were saved to compare the extent of ECT2 degradation and RNA-binding between them. (C) PCR reactions (number of cycles is indicated) used to prepare iCLIP libraries. For each one of the four different libraries, the three corresponding PCRs (low, medium, and high molecular weight) were combined according to their relative concentrations to compensate for inequalities. Notice that the size of the cDNA-insert to be mapped to the genome is expected to be the size of the PCR product minus the length of the P3/P5 Solexa primers and the barcode (128 nt in total) (Huppertz et al., 2014). Therefore, the low molecular weight bands cut at [70–85]-nt on the cDNA gel, with [20–35]-nt-cDNA + 52-nt-primer, generate [145–155]-nt PCR fragments. The low amount of PCR product from the higher molecular weight bands is to be expected, and the non-matching PCR product sizes of the ECT2W464A-mCherry control samples are likely a product of the low amount of RNA co-purified with the m6A-binding-deficient ECT2 mutant.
-
Figure 3—figure supplement 3—source data 1
Uncropped labeled panels and raw image files: Figure 3—figure supplement 3A-C.
- https://cdn.elifesciences.org/articles/72375/elife-72375-fig3-figsupp3-data1-v2.zip
Figure 3—figure supplement 4
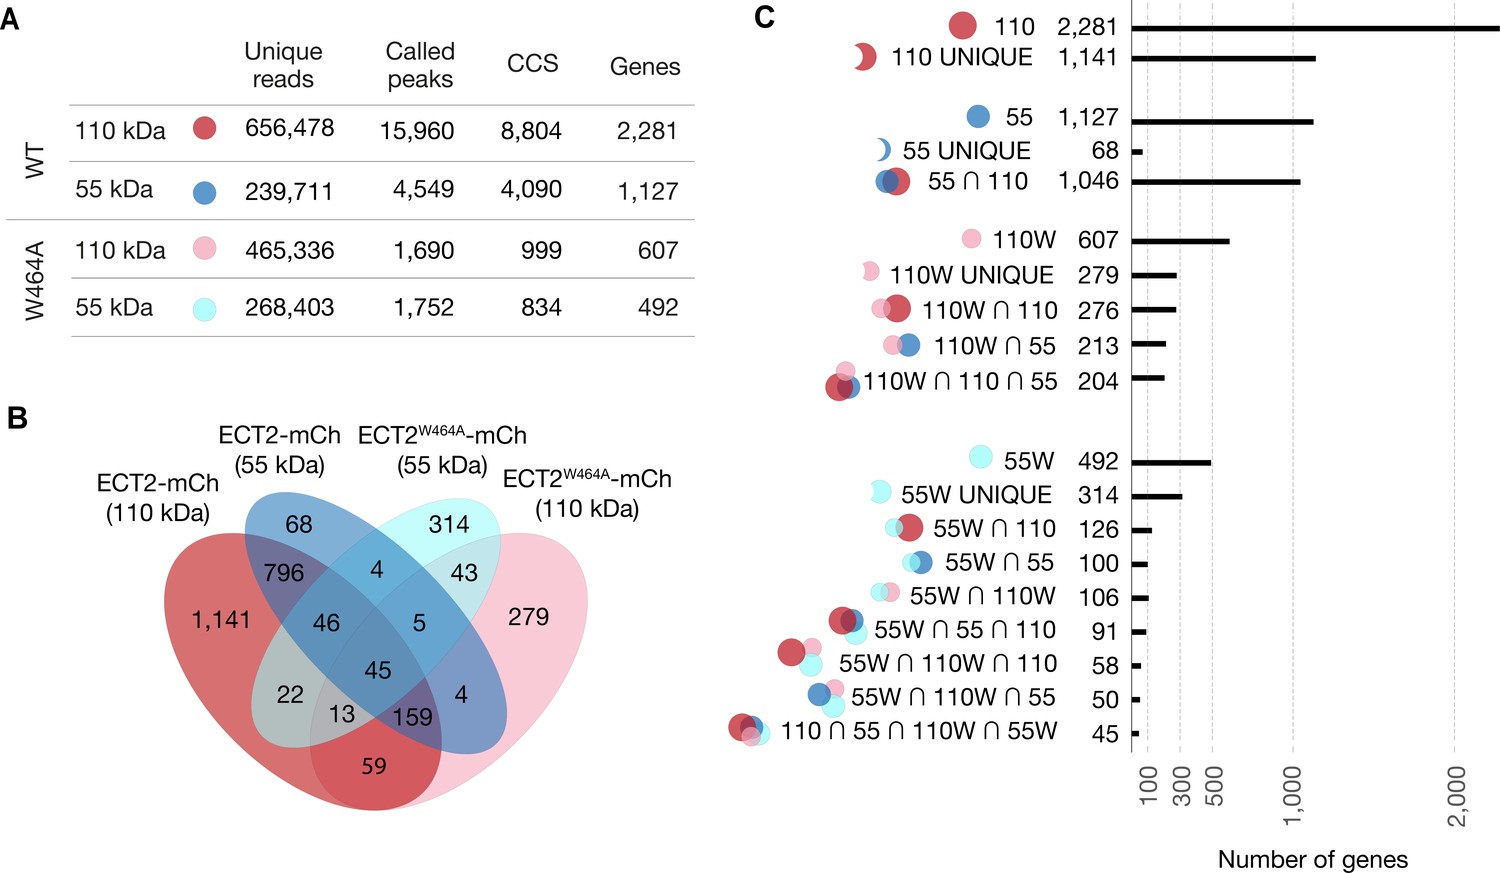
Analysis of ECT2 iCLIP Libraries.
(A) Number of valid reads (trimmed reads mapped to the Arabidopsis genome [TAIR10] discarding PCR duplicates), called peaks ( = crosslink sites) (Krakau et al., 2017), collapsed crosslink sites (CCS) (peaks with the highest PureCLIP-score within clusters and extended by 4 nt in both directions forming 9 nt wide regions), and target genes, obtained from ECT2-mCherry iCLIP libraries. (B) Overlaps between gene sets identified for the four ECT2-mCherry iCLIP libraries generated in this study. (C) Upset plot displaying gene counts according to different sets defined from the four iCLIP libraries.
Figure 4 with 3 supplements
CLIP identifies bona-fide ECT2 targets.
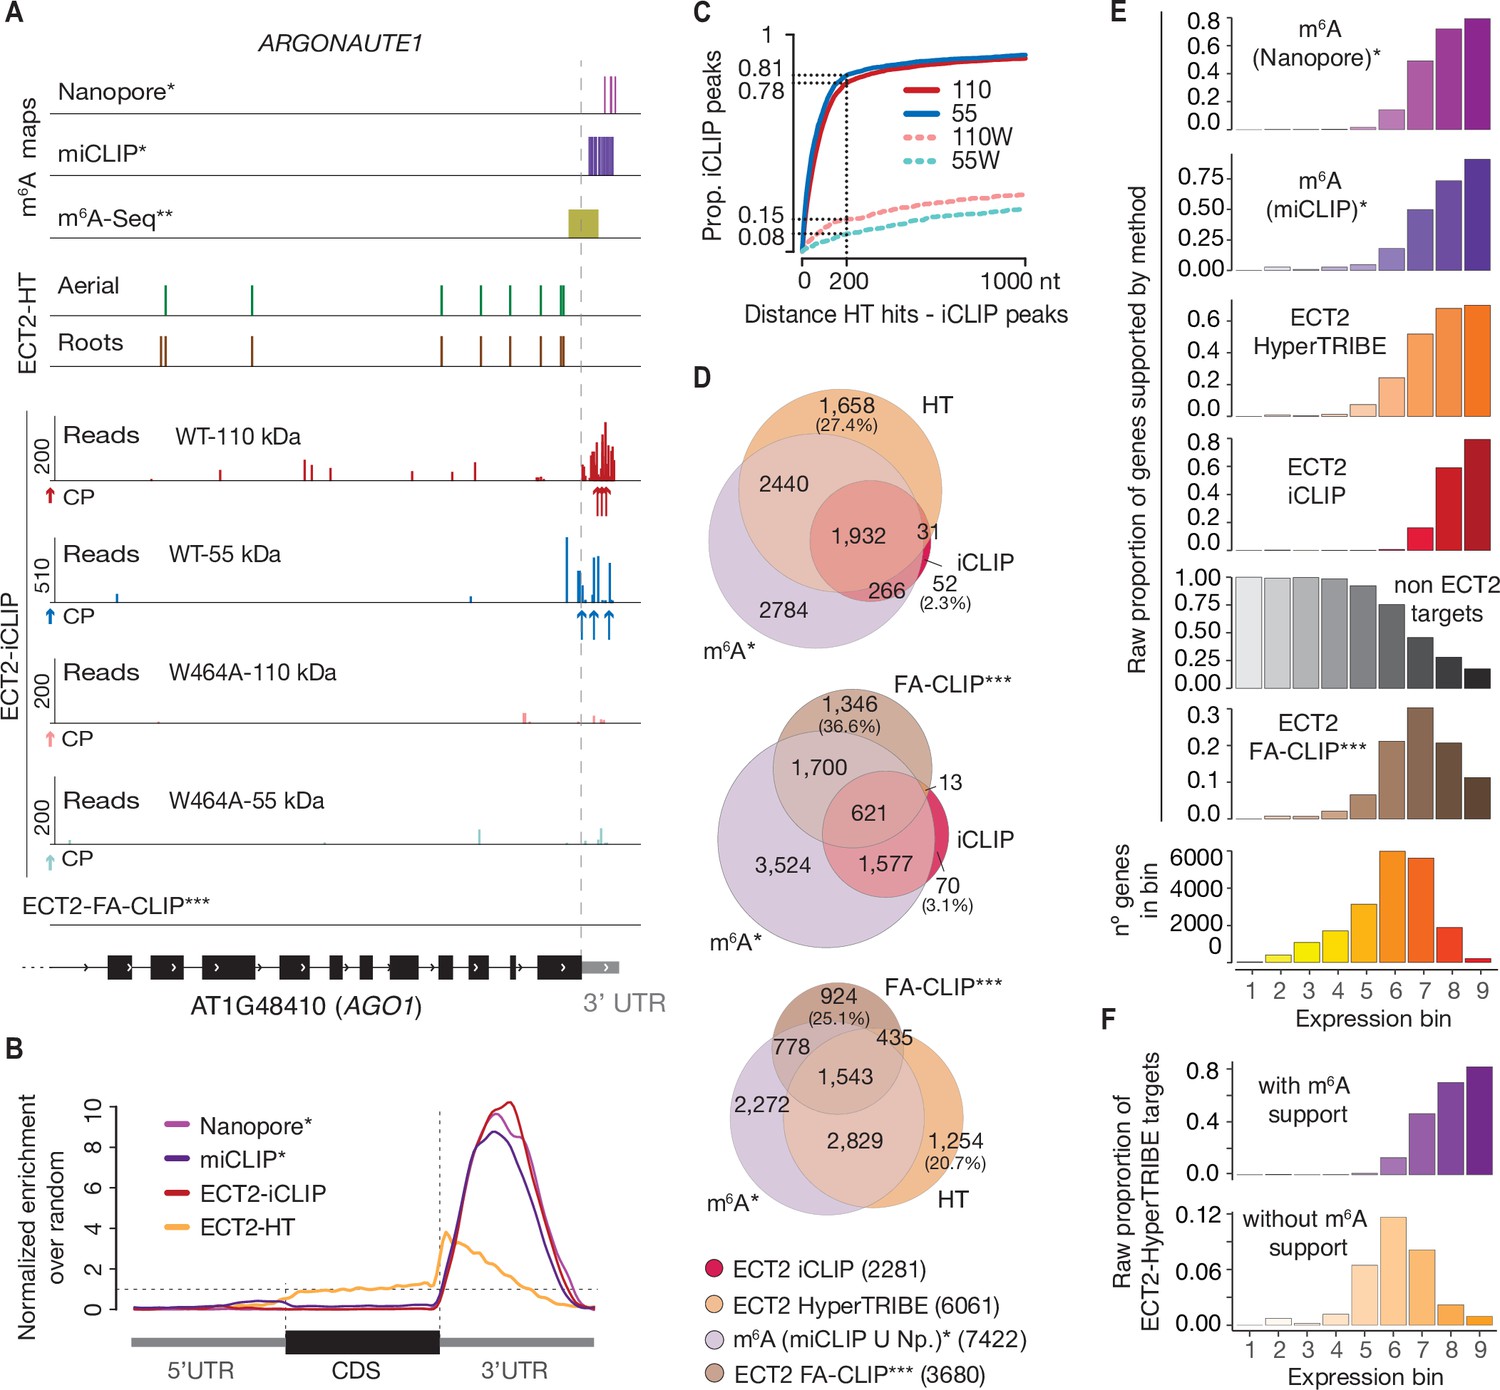
(A) Example of an ECT2 target (AGO1) showing the distribution of m6A sites*, **, ECT2-iCLIP reads and peaks, ECT2-HT edited sites, and FA-CLIP peaks*** along the transcript. CP, called peaks. See more examples in the Figure 4—figure supplement 1. (B) Metagene profiles comparing the distributions along the gene body of ECT2-mCherry iCLIP peaks (wild type, 110-kDa band), ECT2-HT editing sites (in roots and aerial tissues) and m6A sites*. (C) Proportion of ECT2 iCLIP peaks within a given distance from the nearest ECT2-HT edited site. Numbers indicated on the y-axis show the proportion of ECT2 iCLIP peaks less than or equal to 200 nt from the nearest ECT2-HT edited site. (D) Overlap between genes supported as containing m6A or ECT2 targets by the different techniques indicated. The ECT2-HT target set includes the sum of targets identified in root and aerial tissues. Additional overlaps are shown in the Figure 4—figure supplement 2. (E) Proportions of genes in each expression bin either containing m6A or supported as ECT2 targets by the indicated techniques. (F) Proportion of ECT2-HT targets with or without support from m6A data (Nanopore*, miCLIP* or m6A-Seq**) in each expression bin. * Parker et al., 2020; ** Shen et al., 2016; *** Wei et al., 2018.
Figure 4—figure supplement 1
Distribution of m6A and ECT2 sites on ECT2 targets.
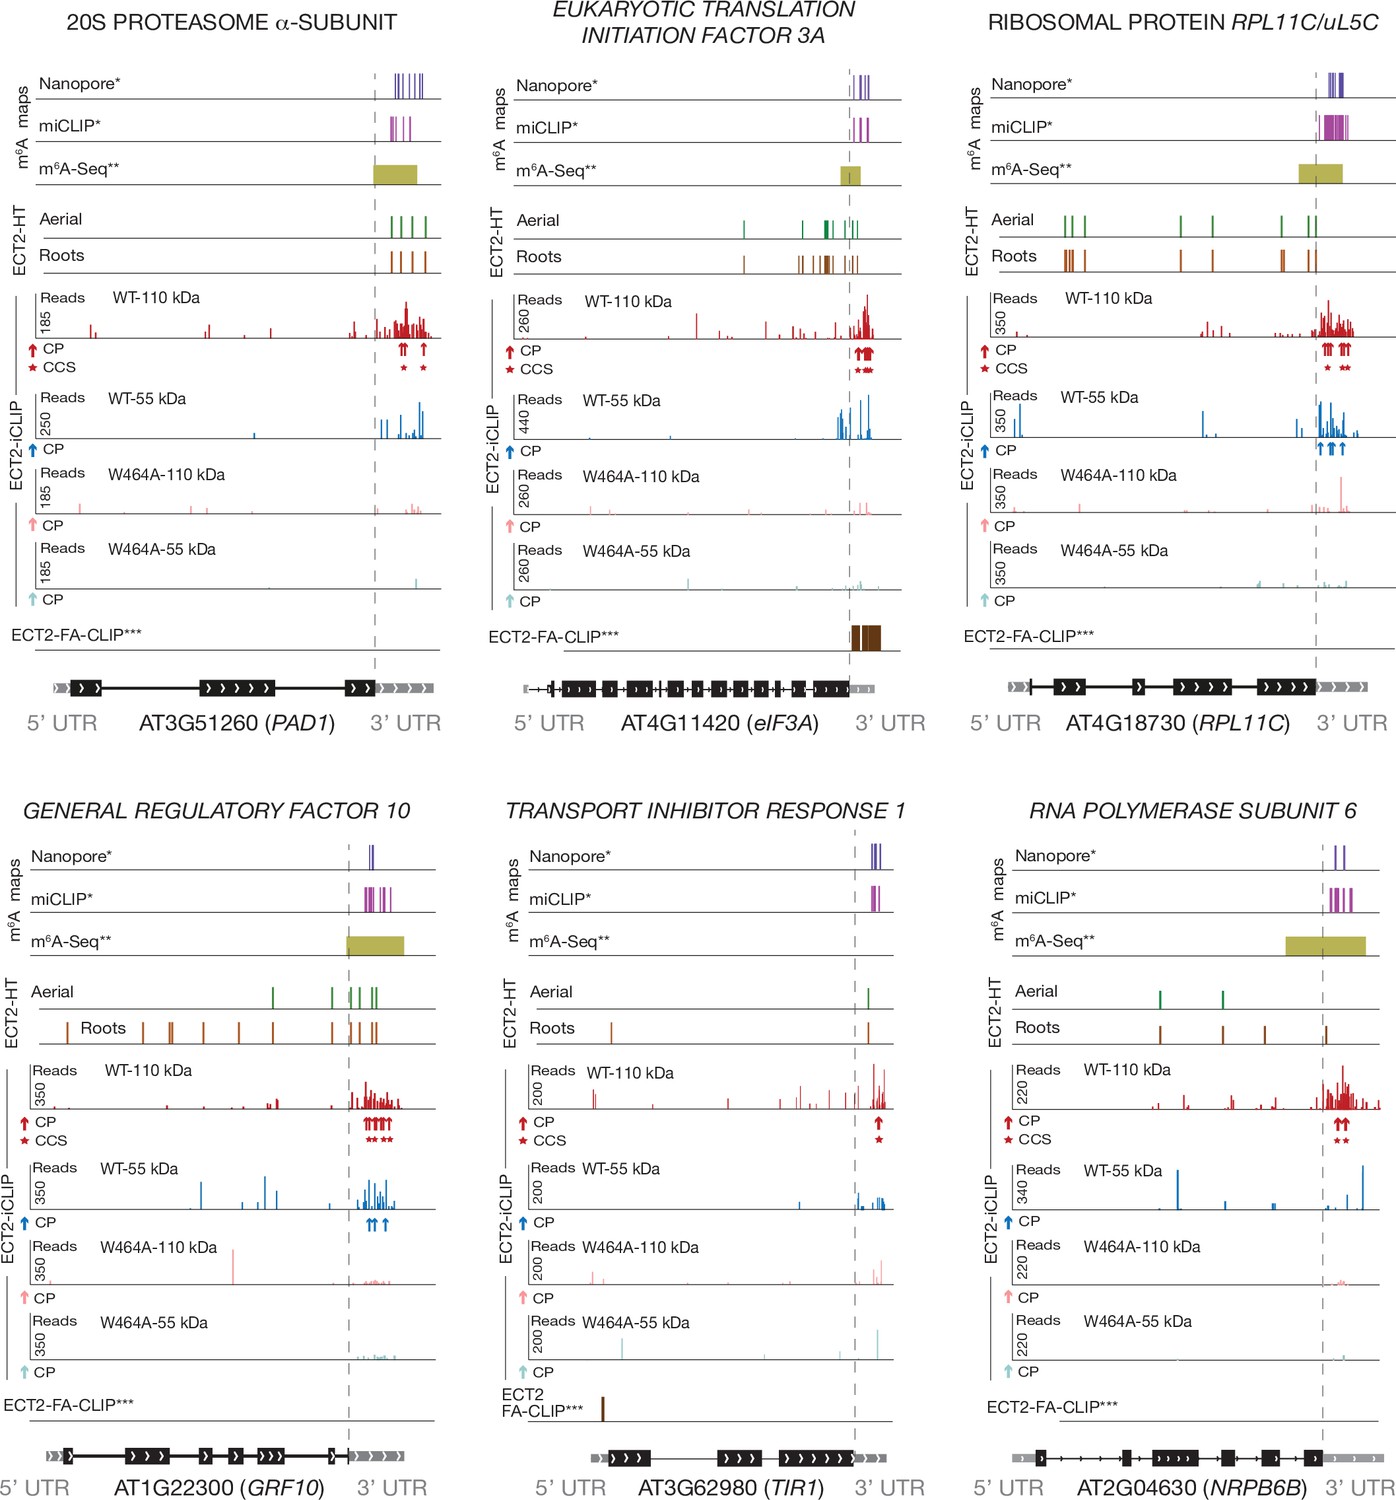
Representative examples of ECT2 targets showing the distribution of m6A sites*, **, ECT2-iCLIP reads and peaks, ECT2-HT edited sites, and FA-CLIP peaks*** along the transcript. CP, called peaks ( = crosslink sites); CCS, collapsed crosslink sites. * Parker et al., 2020; ** Shen et al., 2016; *** Wei et al., 2018.
Figure 4—figure supplement 2
Overlaps between m6A-containing genes and ECT2 targets datasets.
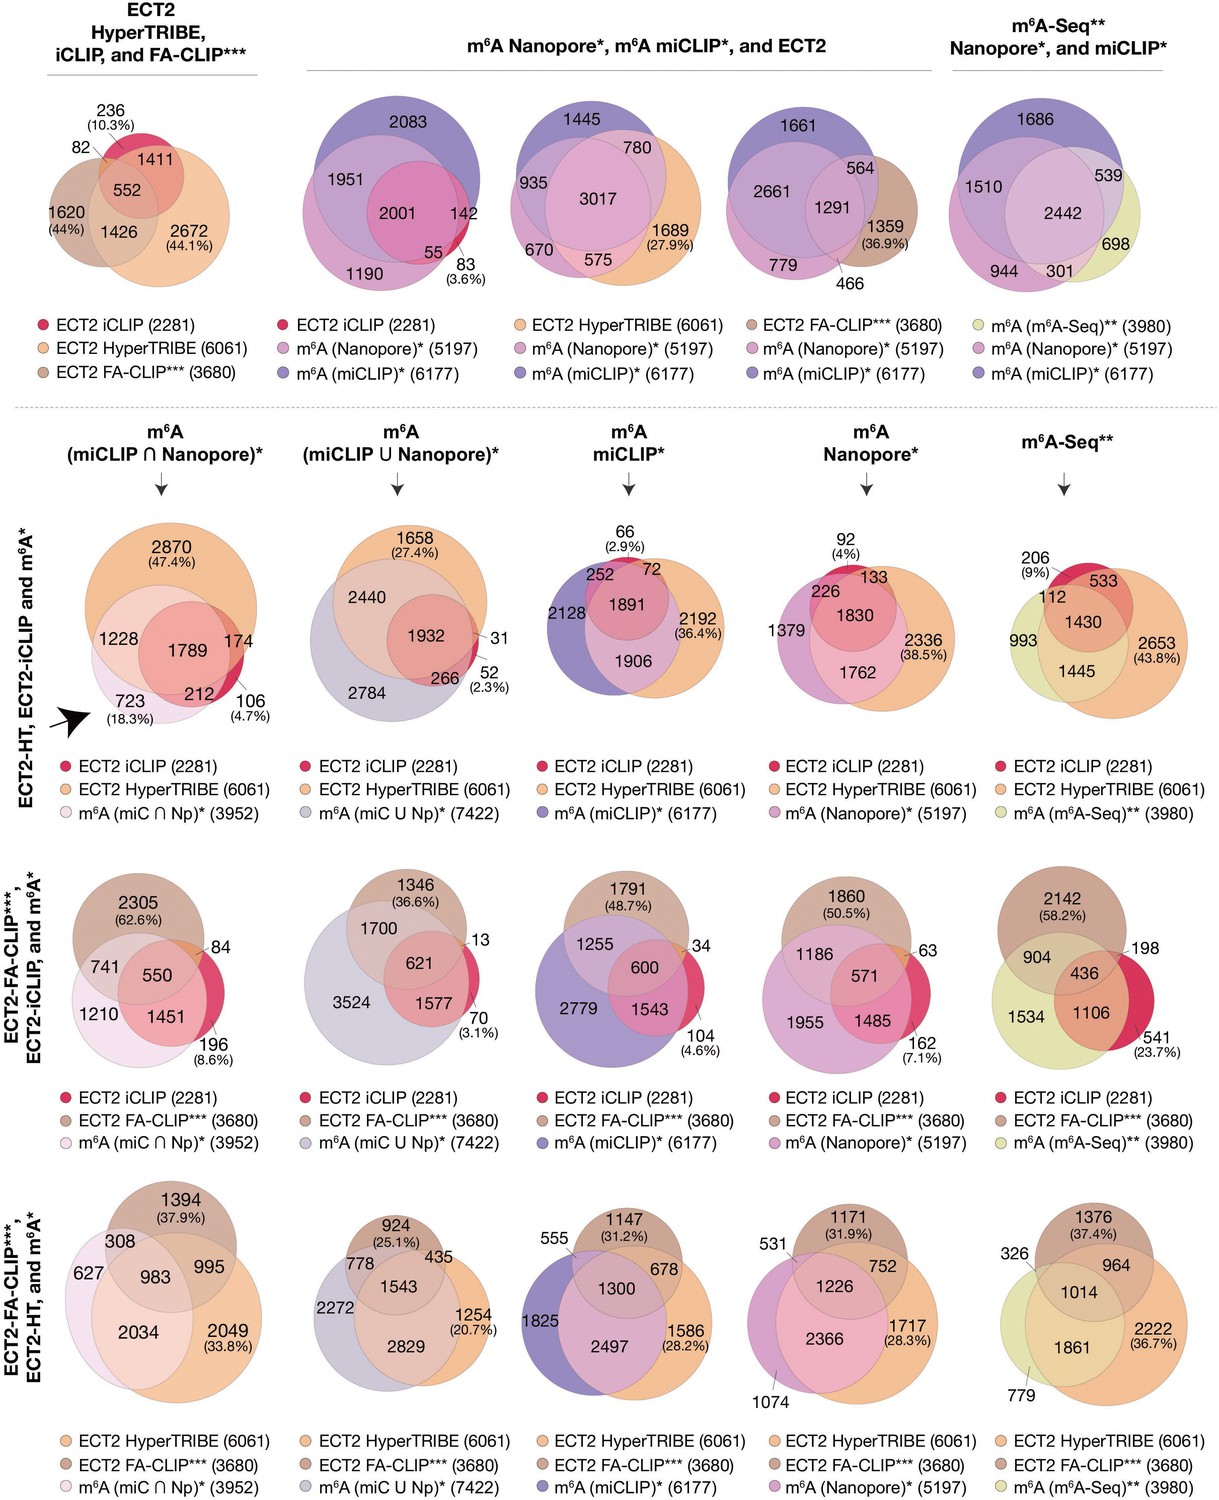
Overlap between genes supported as containing m6A or ECT2 targets by the different techniques indicated. The ECT2-HT target set includes the sum of targets identified in root and aerial tissues. * Parker et al., 2020; ** Shen et al., 2016; *** Wei et al., 2018.
Figure 4—figure supplement 3
Characteristics of ECT2-HyperTRIBE editing sites relative to target expression levels.
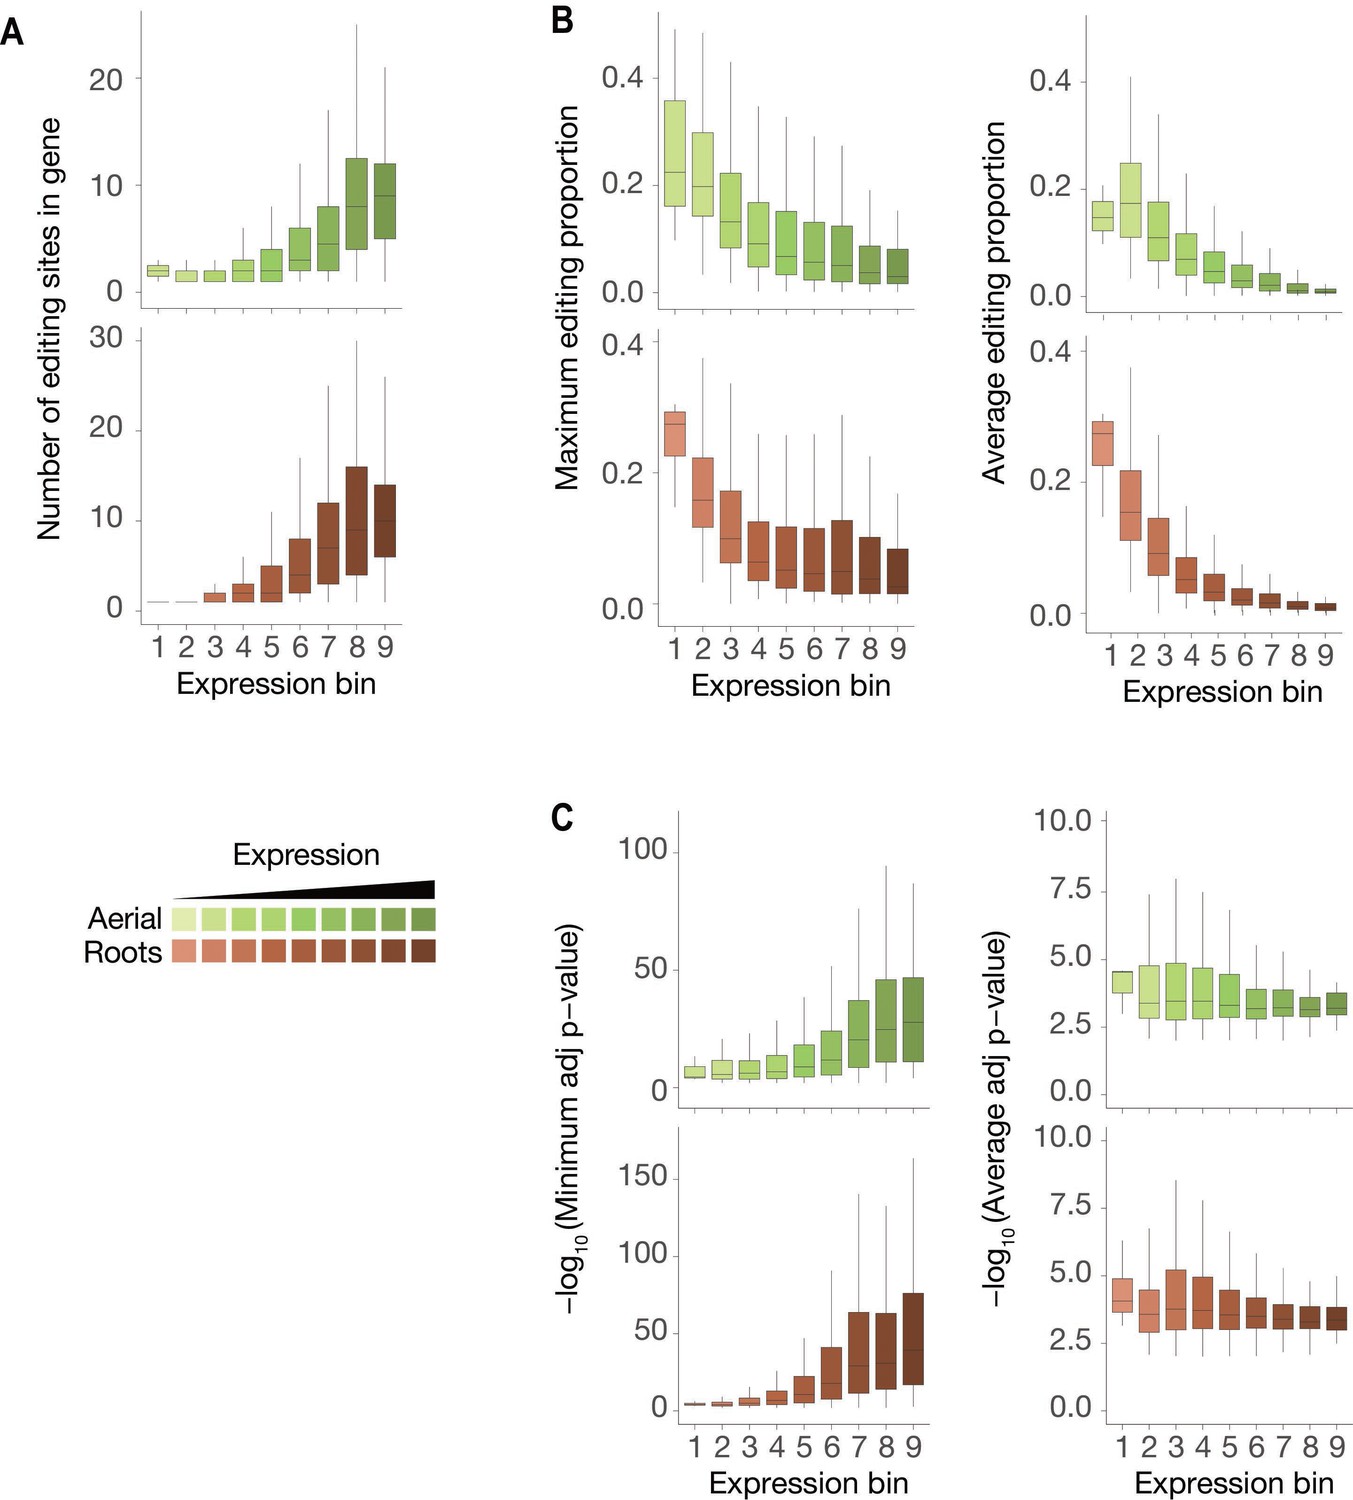
(A–C) Number of significant editing sites (A), maximum or average editing proportions (B), and significance of editing sites according to either minimum or average -log10(adjusted p-value) per gene (C) in ECT2-HT targets split according to their expression levels (calculated as in Figure 2B), in both aerial and root tissues. The number of detected editing sites increases with the expression level of the targets (A) while, unexpectedly, the editing proportion decreases (B). This may be caused by dilution as the ECT2 promoter is active only in highly dividing cells (Arribas-Hernández et al., 2020) while some abundant target mRNAs may be ubiquitously expressed. Nevertheless, the average statistical significance over all edited sites per target mRNA did not change with the expression level (C, right panels), indicating that our HyperTRIBE experimental setup and data analysis identifies targets across a wide range of expression levels including lowly expressed transcripts. This suggests that the significance of differential editing versus a negative control, rather than raw editing proportion or number of editing sites, is the preferred parameter for definition and ranking of targets.
Figure 5 with 4 supplements
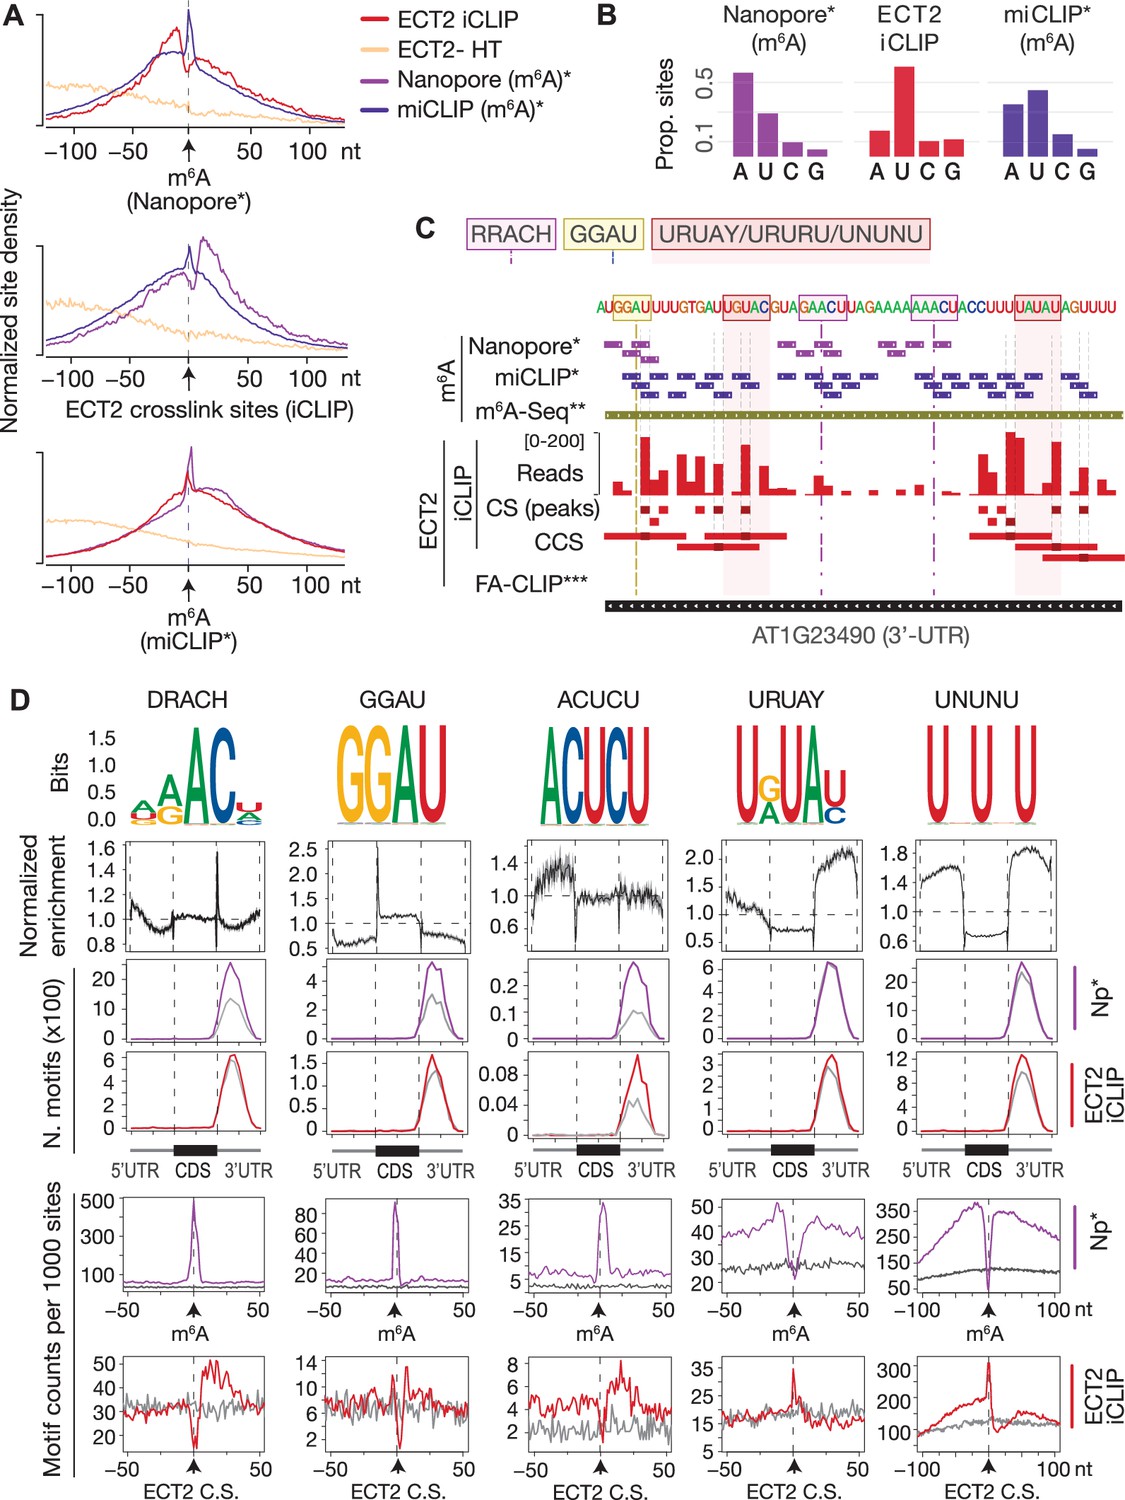
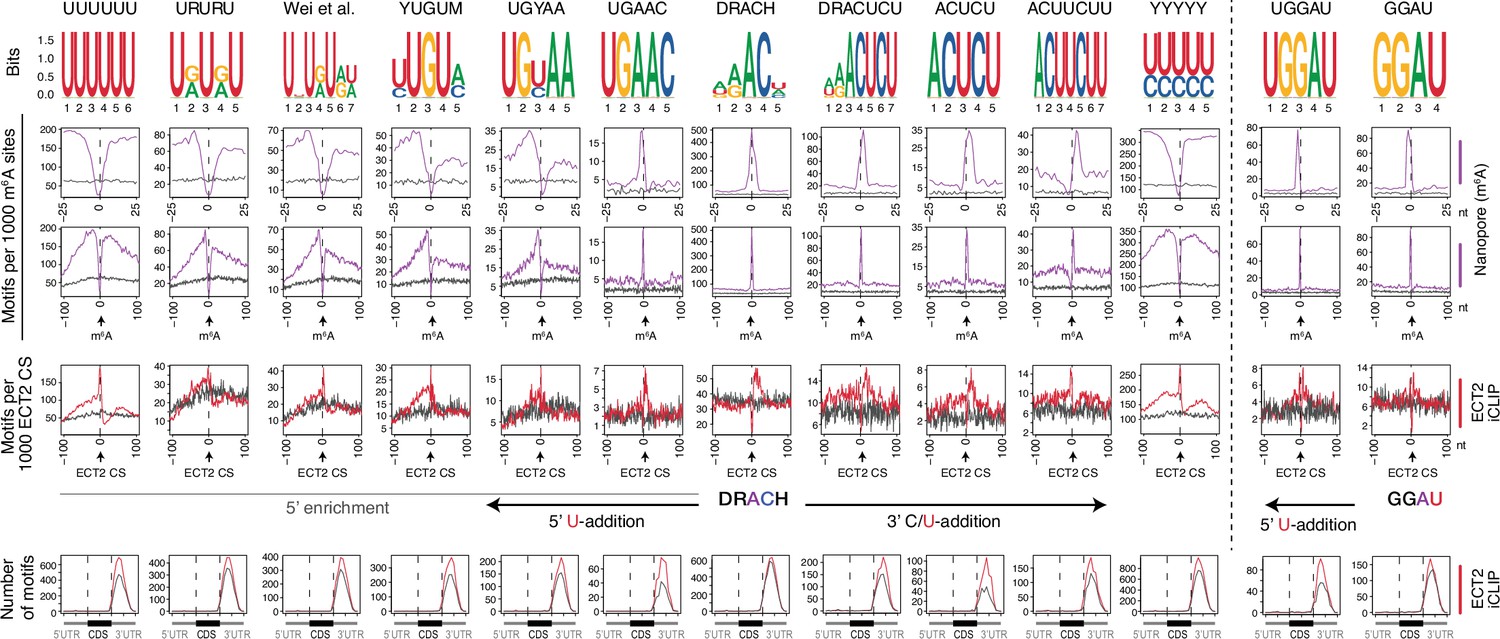
ECT2 UV-crosslinks to uridines in the immediate vicinity of DR(m6A)CH or GG(m6A)U sites.
(A) Normalized density of sites at and up to +/-100 nt of either m6A-Nanopore*, m6A-miCLIP* or ECT2-iCLIP sites. (B) Proportion of m6A and ECT2-iCLIP sites at each nucleotide by the different methods. (C) View from IGV browser illustrating the presence of RRACH, GGAU and U-rich motifs in the vicinity of m6A and ECT2 sites in the 3’-UTR of AT1G23490 (ARF1). CS, crosslink sites; CSS, collapsed crosslink sites. (D) Key motifs analyzed in this study. From top to bottom: (1) motif logos for derived position weight matrices (PWMs); (2) normalized enrichment of motif locations across gene body; (3-4) total number of the relevant motif found at m6A-Nanopore* (3) or ECT2-iCLIP (4) sites according to gene body location. Gray lines indicate numbers found in a gene-body location-matched background set of sites of equivalent number; (5-6) distribution of the relevant motif relative to m6A-Nanopore* (5) or ECT2–iCLIP (6) sites. Gray lines represent the distribution for the same gene-body location-matched set as derived in the panels above. * Parker et al., 2020; ** Shen et al., 2016; *** Wei et al., 2018.
Figure 5—figure supplement 1
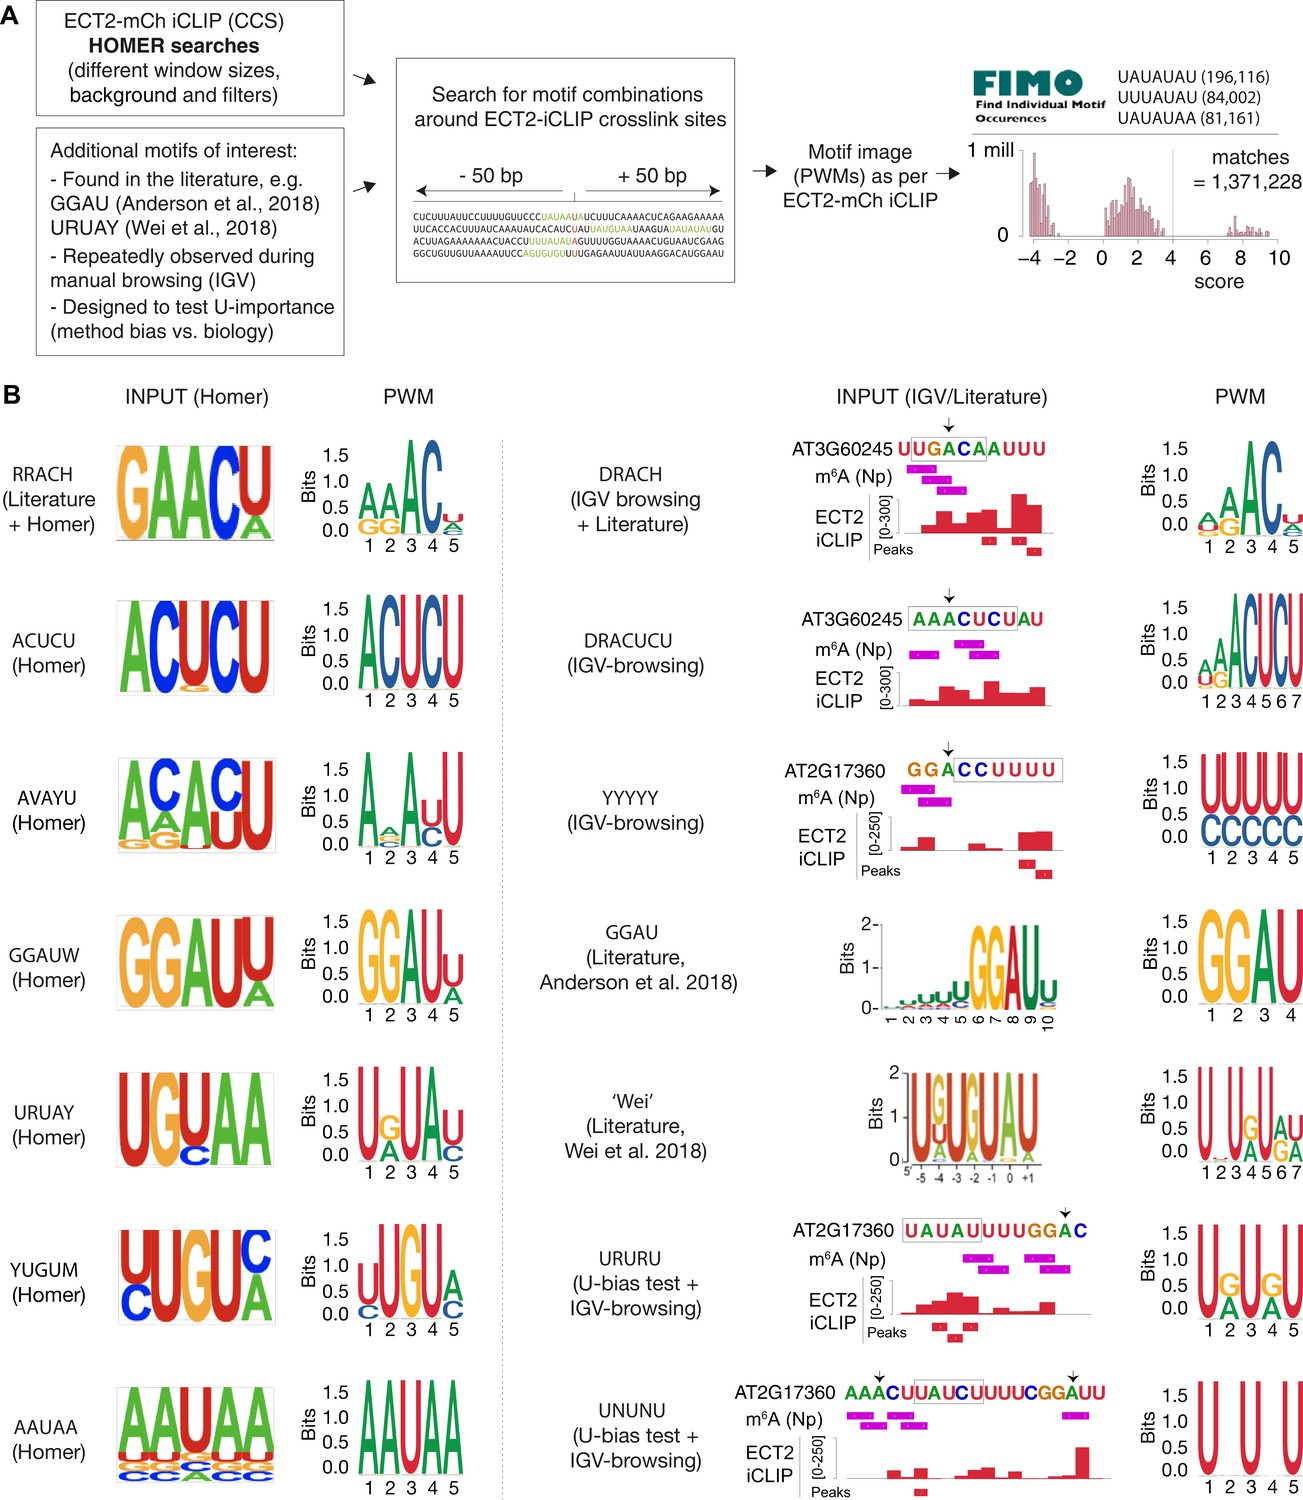
Sources of motifs and generation of position weight matrices (PWMs).
(A) Relative nucleotide frequencies for motifs of interest with potential sequence redundancies were estimated from windows around ECT2-iCLIP collapsed crosslink sites (CCS) and converted into PWMs that were subsequently used in FIMO to scan for motif matches genome wide. Plot illustrates score distribution for the motif derived from Wei et al., 2018, and vertical dotted line indicates chosen score cutoff. (B) Subset of motifs according to source. Left: examples of motifs inspired by Homer searches (left logo) and subsequent PWM used in the analysis (right logo). Right: examples of further motifs derived from other sources. Logo from the relevant paper is shown if the motif derives from literature, and representative examples of IGV-browser screenshots are shown otherwise (motifs are outlined; arrows mark As within DRACH/GGAU contexts; Np, Nanopore [Parker et al., 2020]). Subsequent PWMs are also indicated (right logos).
Figure 5—figure supplement 2
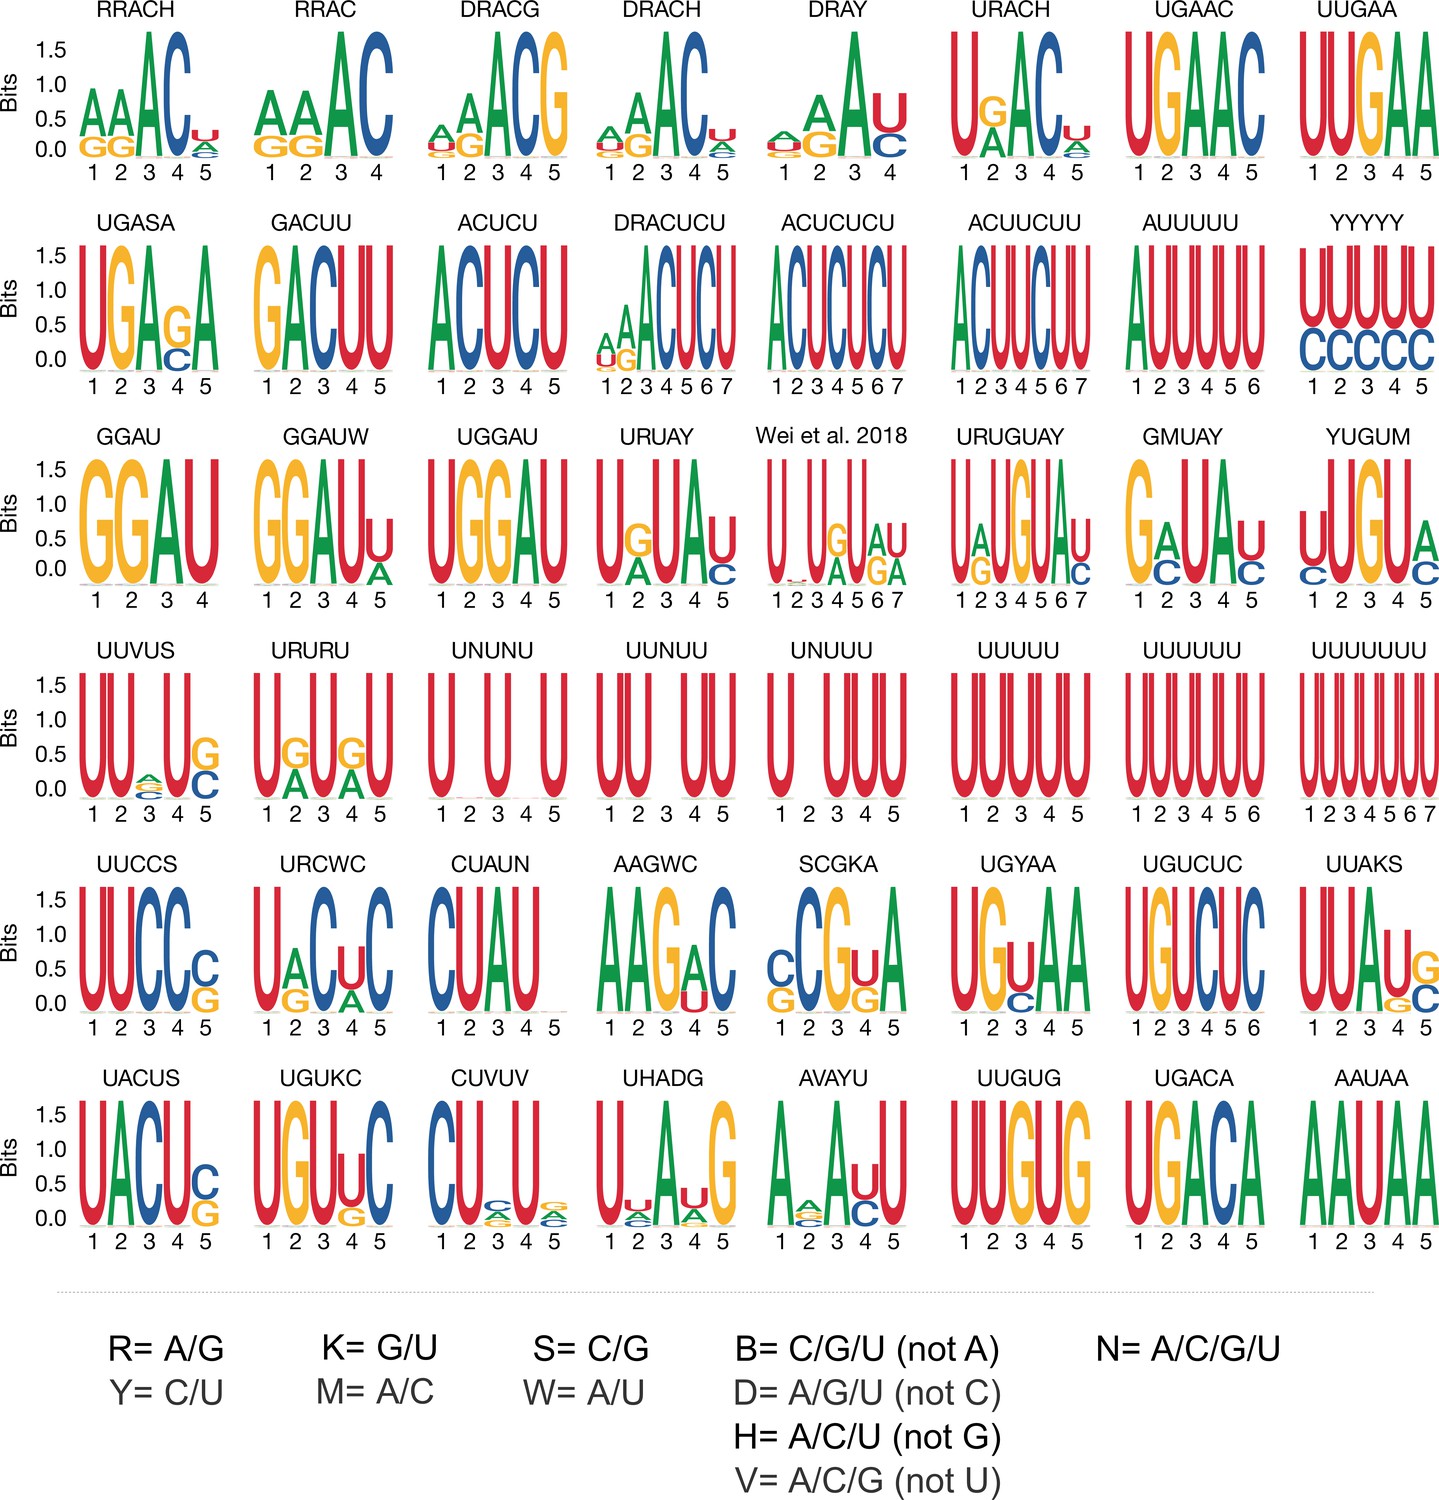
Motif logos generated from position weight matrices.
Motif logos represent all of the 48 derived motif position weight matrices considered in the current analysis (see Materials and methods and Figure 5—figure supplement 1 for selection details). UPAC-IUB codes to define multiple nucleotide possibilities in one position are detailed below.
Figure 5—figure supplement 3
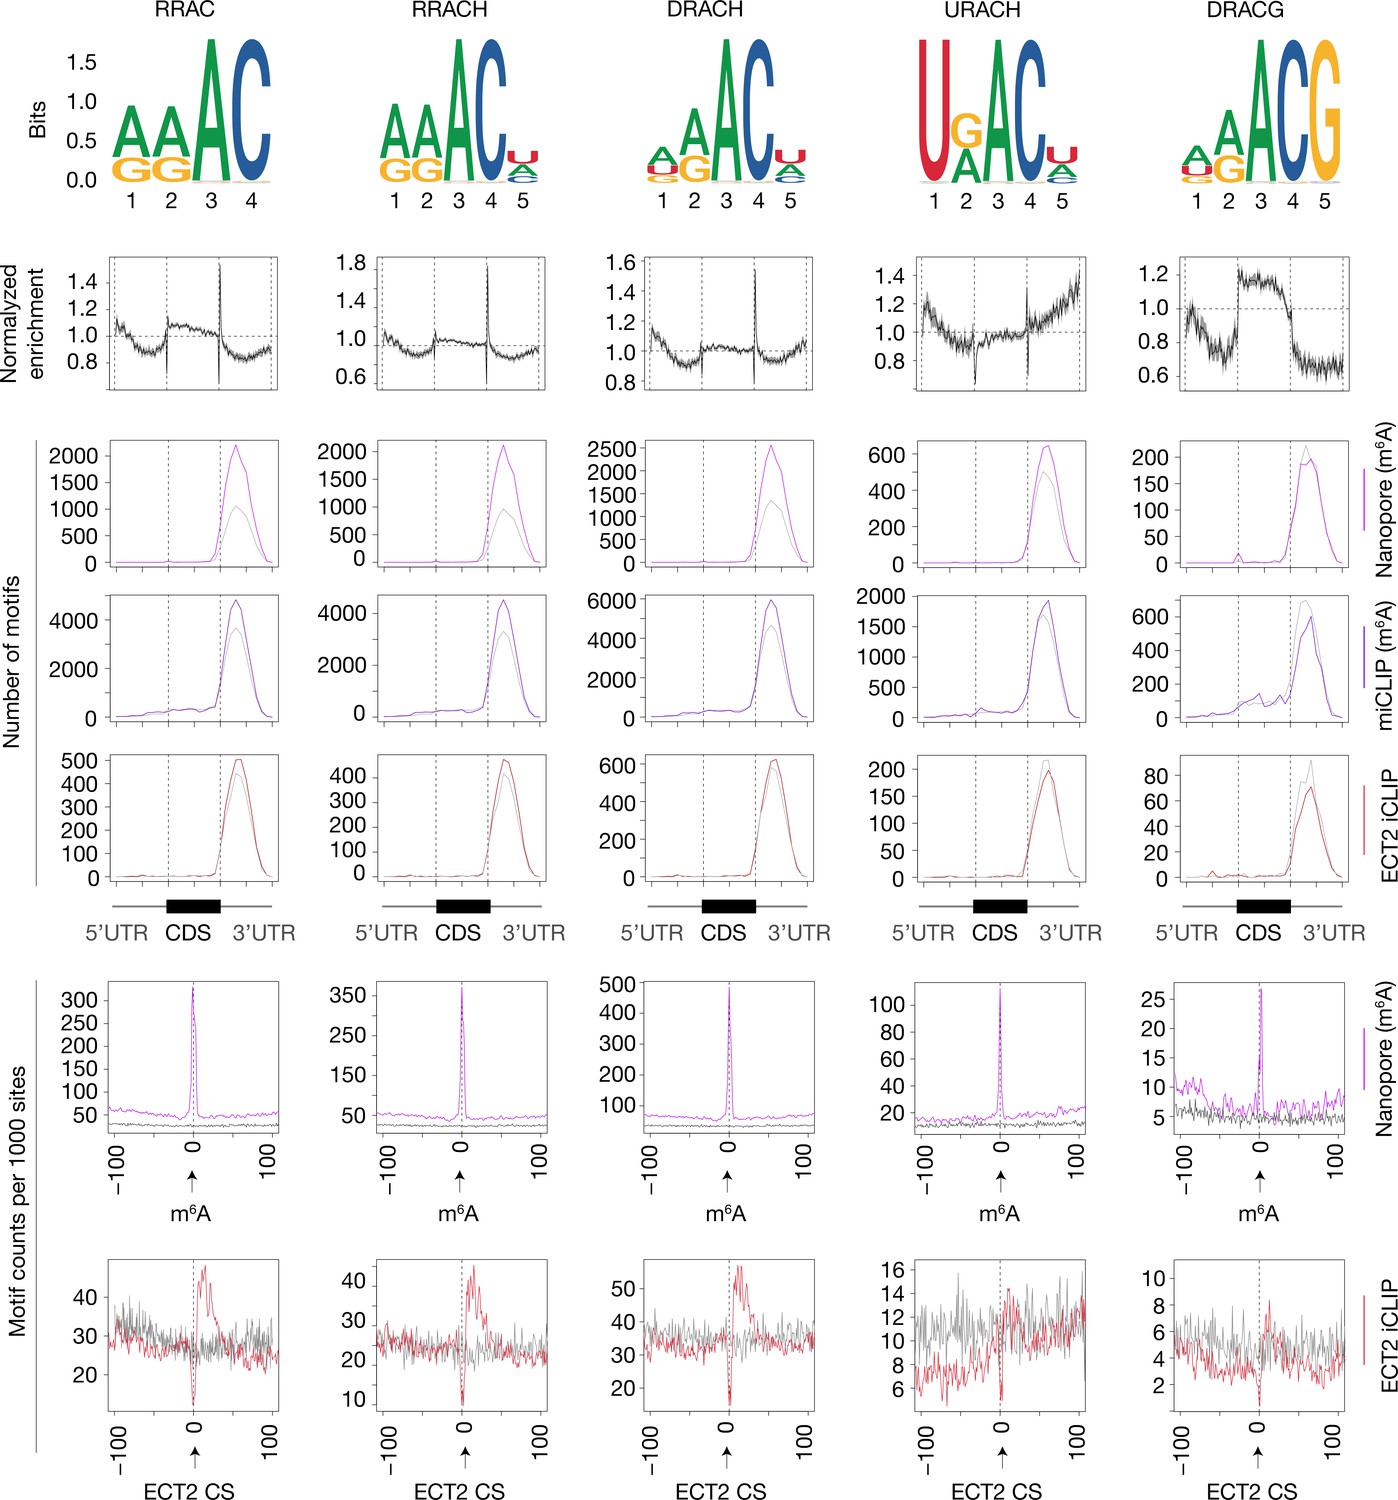
Enrichment of RRACH variants around m6A and ECT2 sites.
From top to bottom: (1) motif logos for derived position weight matrices (PWMs); (2) normalized enrichment of motif locations across gene body; (3–5) total number of the relevant motif found at m6A-Nanopore* (3), m6A-miCLIP*, (4) or ECT2-iCLIP (5) sites according to gene body location. Gray lines indicate numbers found in a gene body location-matched background set of sites of equivalent number; (6 and 7) distribution of the relevant motif relative to m6A-Nanopore* (6) or ECT2–iCLIP (7) sites. Gray lines represent the distribution for the same gene body location-matched set as derived in the panels above. RRACH shows a slightly higher enrichment over RRAC around m6A-Nanopore* sites, which is further increased in the more lenient version DRACH. Accordingly, there is also clear enrichment of URAC. On the contrary, there is no global enrichment of DRACG in m6A-Nanopore* datasets along the gene body, and only very modest around m6A-Nanopore* sites, highlighting the importance of the final H in DRACH. R = A/G, H = A/C/U, D = A/G/U. * Parker et al., 2020.
Figure 5—figure supplement 4
Uridines flanking DRACH result in additional motifs enriched at ECT2 iCLIP sites.
Enrichment of DRACH-like motifs containing additive amounts of U(/Y)s at the flanks until there is only U/Ys. Through the upstream U-additions, transition forms like URURU/UGUAY/YUGUM are included. GGAU with addition of one U upstream is also shown on the right side of the figure. From top panel to bottom: (1) motif logos for derived position weight matrices (PWMs); (2-4) distribution of the relevant motif relative to m6A-Nanopore (Parker et al., 2020) (2, 3) or ECT2–iCLIP crosslink sites (CS) (4). Gray lines represent the distribution for gene body location-matched background set of sites of equivalent number; (5) total number of the relevant motif found at ECT2-iCLIP sites according to gene body location. Gray lines indicate numbers found in the same gene body location-matched background set.
-
Figure 5—figure supplement 4—source data 1
High quality image file.
- https://cdn.elifesciences.org/articles/72375/elife-72375-fig5-figsupp4-data1-v2.pdf
Figure 6 with 1 supplement
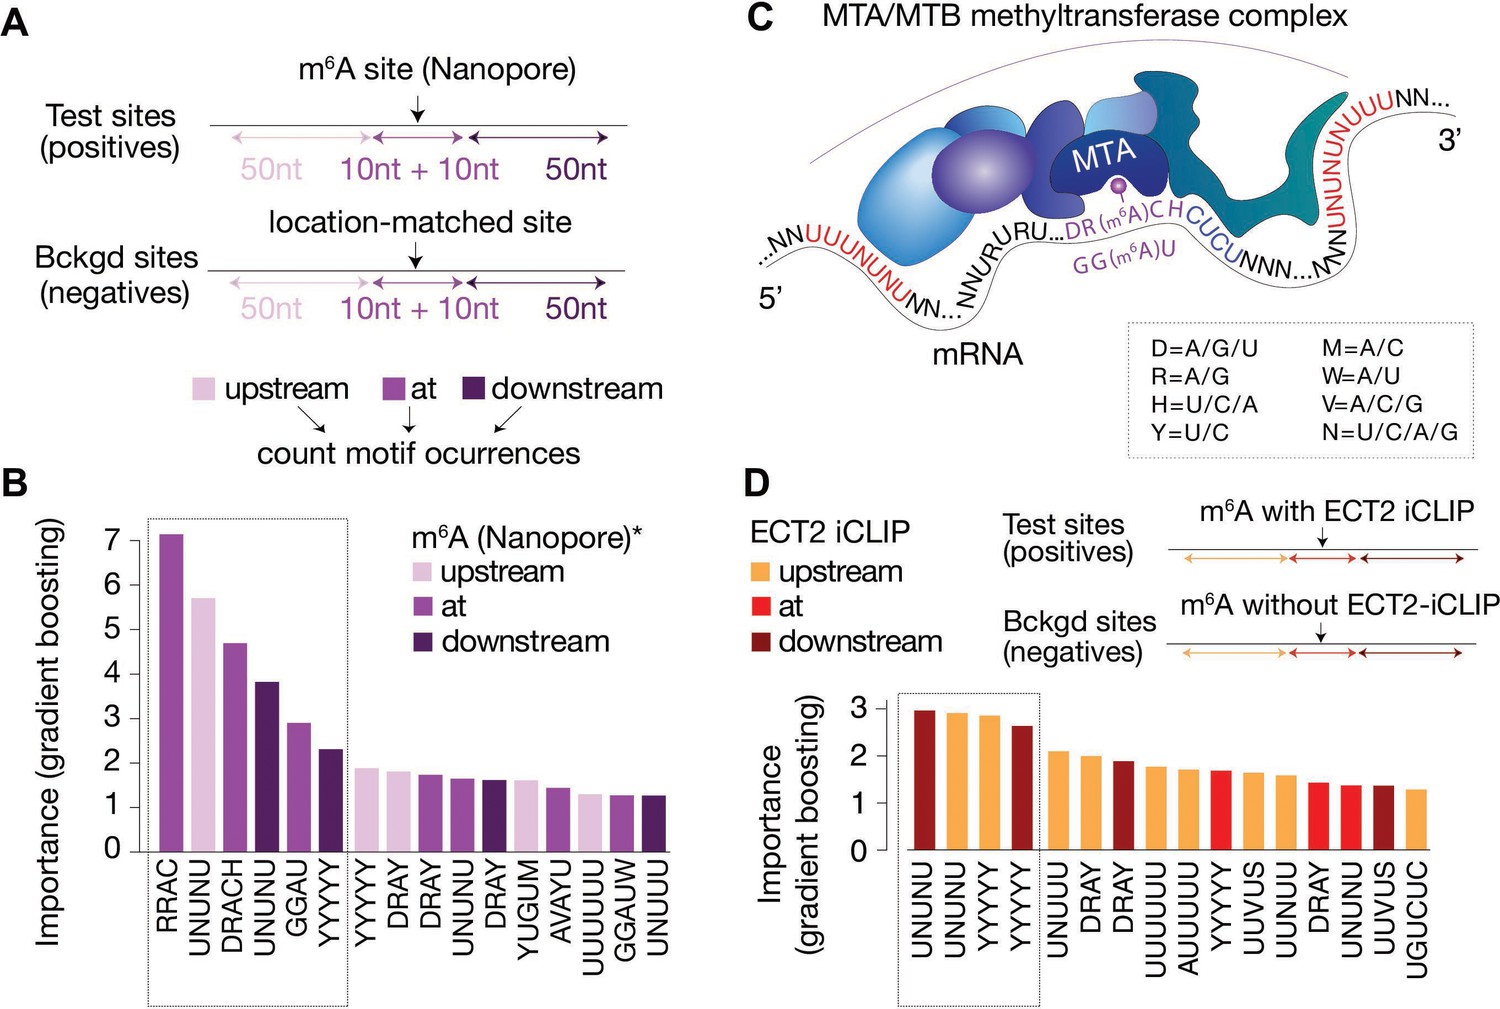
Distal U-rich motifs and at-the-site DRACH/GGAU are determinants for m6A deposition.
(A) Diagram representing the strategy for machine learning model trained to distinguish m6A-Nanopore* sites from their respective gene-body location matched background sets. (B) Bar plots showing top 16 motif feature importance scores from the m6A model, ordered from left to right by importance. The dotted rectangle highlights motifs with outstanding importance compared to the rest. (C) Cartoon representing the most important motifs found at and around m6A sites. UPAC-IUB codes to define multiple nucleotide possibilites in one position are indicated. (D) Machine learning model trained to distinguish between m6A sites with and without ECT2 crosslink sites, and the resulting bar plot showing top 16 motif feature importance scores. Nucleotide distances for intervals, order and dotted box are as in A/B. * Parker et al., 2020.
Figure 6—figure supplement 1
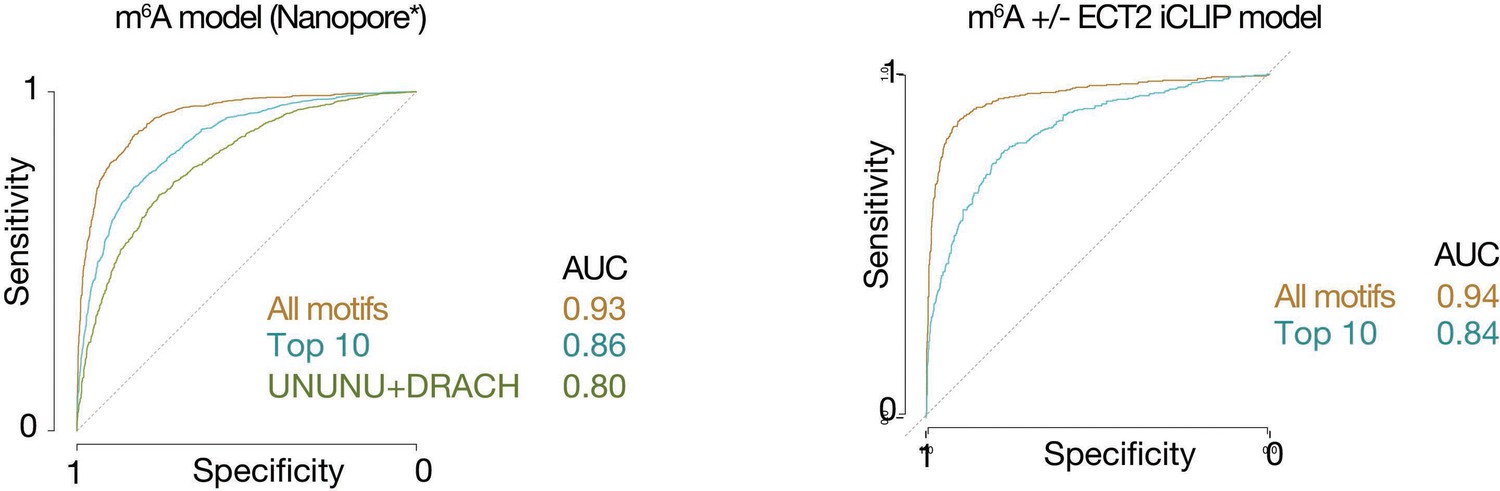
Model performance receiver operating characteristic (ROC) curves for distinguishing sequence preferences of either m6A or ECT2-bound sites.
ROC curves showing model performance of random forest (gradient boosting) trained models, for distinguishing either m6A-Nanopore* sites from their respective random location-matched background sites (left), or m6A-Nanopore* sites with and without ECT2-iCLIP crosslink sites (right), with overall performance represented by area under the curve (AUC) values. ‘All motifs’ refers to the full set of 48 motifs (at, upstream, or downstream), ‘Top 10’ to the top 10 most important features from the full model, and ‘UNUNU + DRACH’ includes features derived only from UNUNU or DRACH motifs. *Parker et al., 2020.
Figure 7 with 2 supplements
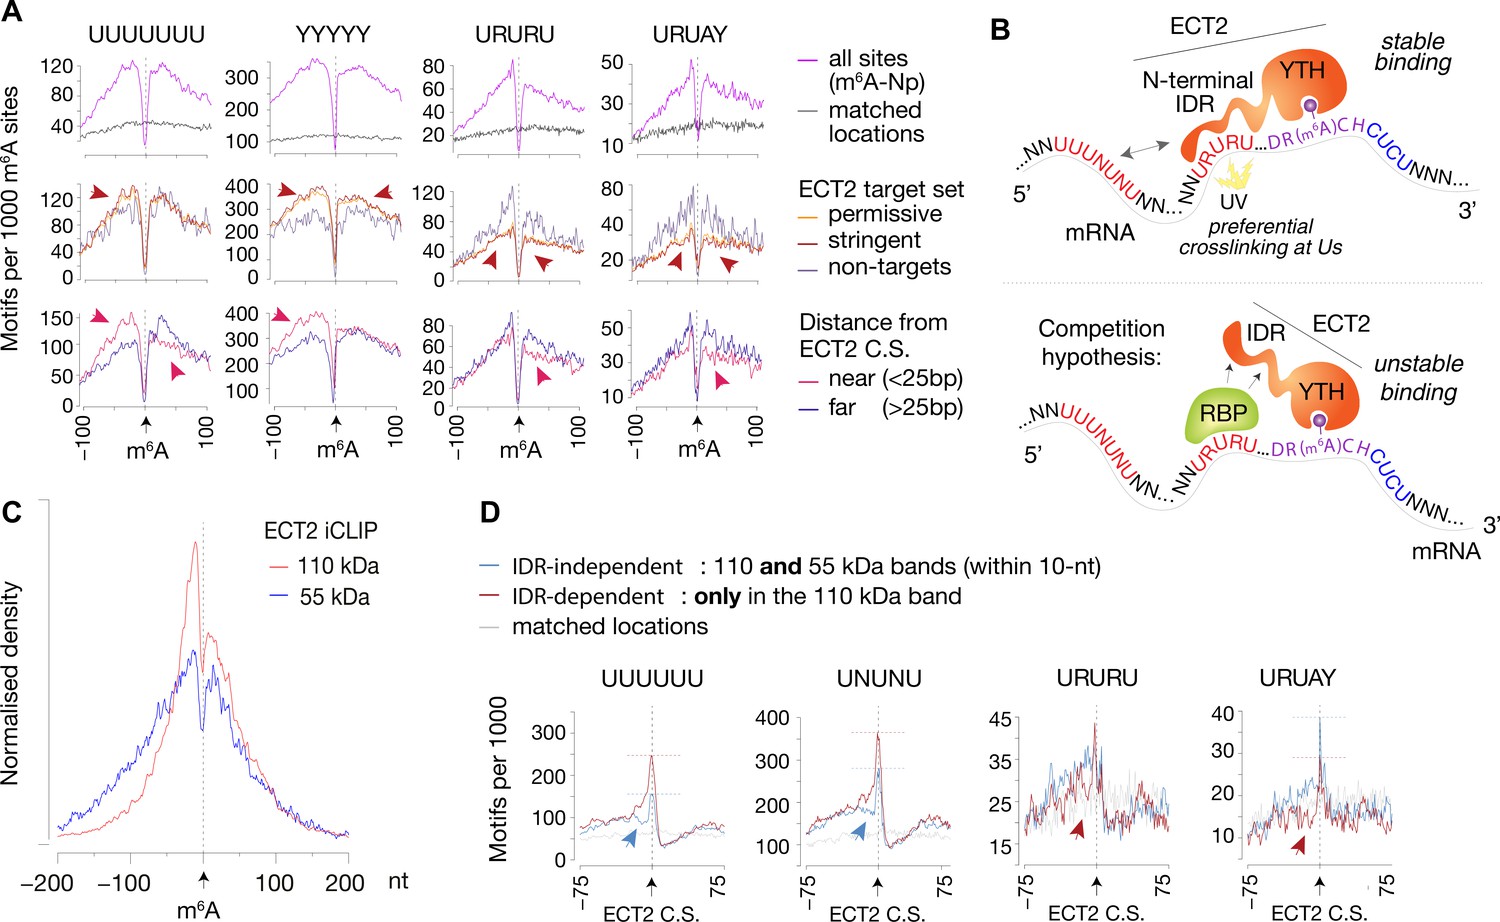
IDR-dependent binding of ECT2 to U-rich motifs 5’ of m6A.
(A) Top panels: Distance-based enrichment of motifs at and around m6A-Nanopore (Np, Parker et al., 2020) sites, plotted as motif counts per 1000 m6A sites (purple lines). Gray lines indicate the enrichment in a location-matched background set as in Figure 5D. Middle and bottom panels: sites are split according to whether they sit on ECT2 targets (middle), or to distance from the nearest ECT2 crosslink site (for ECT2-iCLIP targets only) (bottom). Additional motifs are shown in the Figure 7—figure supplement 1. (B) Cartoon illustrating the ECT2 IDR RNA-binding and competition hypotheses. (C) Normalized density of ECT2 iCLIP crosslink sites identified in the libraries corresponding to the 110- and 55-kDa bands (Figure 3B) at and up to +/-200 nt of m6A-Nanopore sites. (D) Motifs per 1000 ECT2-iCLIP crosslink sites (CS) split according to whether they are found in libraries from both 110-kDa and 55-kDa bands (IDR-independent’), or exclusively (distance > 10 nt) in the 110-kDa band (’IDR-dependent’). Gray lines indicate the enrichment in a location-matched background set as in Figure 5D. Additional motifs are shown in Figure 7—figure supplement 2 and Supplementary file 3.
Figure 7—figure supplement 1
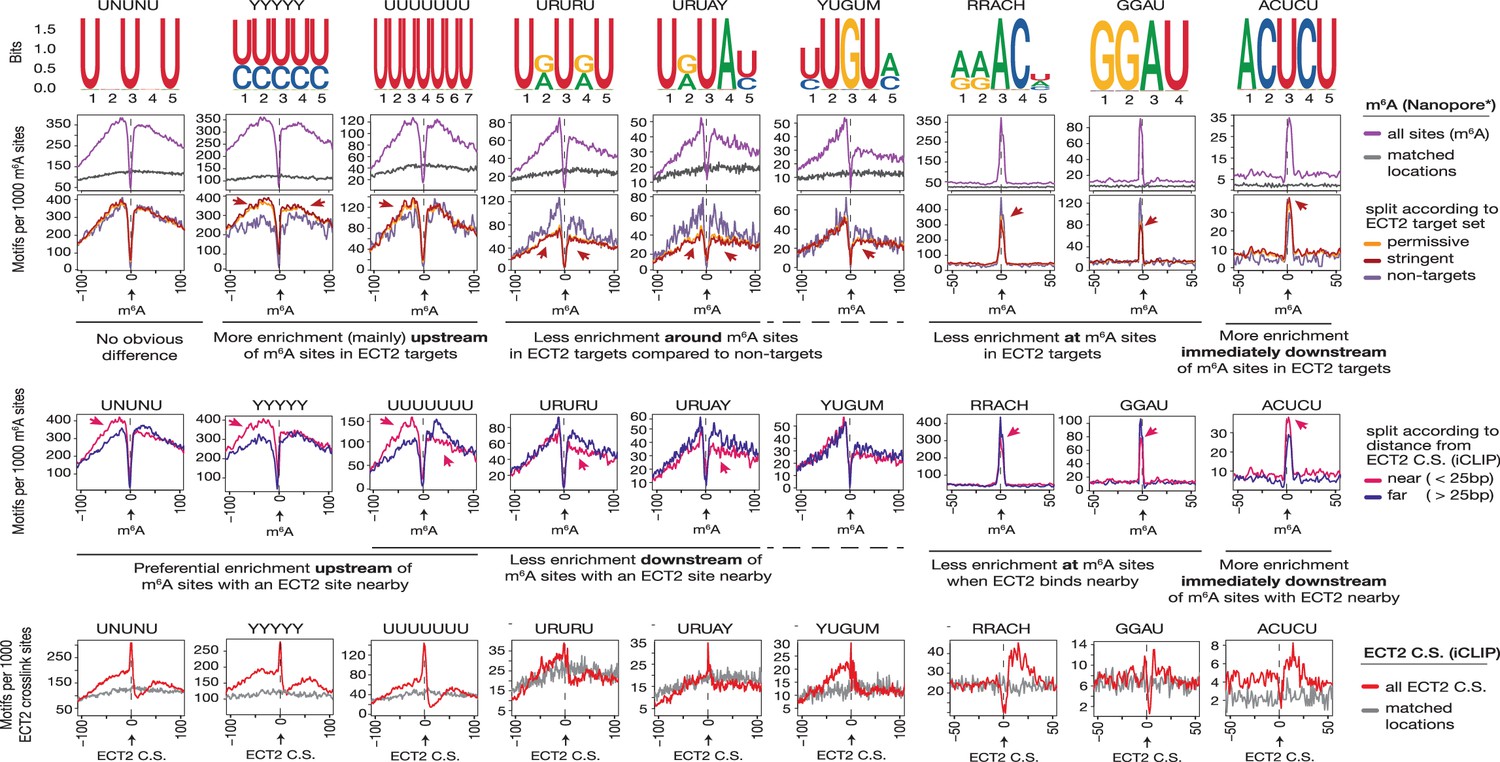
Motif preferences around m6A sites according to ECT2 binding.
From top to bottom: (1) motif logos for derived position weight matrices (PWMs); (2) distance-based enrichment of motifs at and around m6A-Nanopore* sites, plotted as motif counts per 1000 m6A sites (purple lines). Gray lines indicate the enrichment in a location-matched background set as in Figure 5D; (3) same as in (2) with sites split according to whether they sit on ECT2 targets; (4) same as in (2) with sites split according to the distance from the nearest ECT2 crosslink site (for ECT2-iCLIP targets only); (5) motif counts per 1000 iCLIP-binding sites, as a function of distance from the iCLIP position, showing all sites against matched background sites (gray lines). Motifs are ordered according to the different relative enrichment upstream or downstream m6A sites according to ECT2 binding (see text below panels 3 and 4). * Parker et al., 2020.
-
Figure 7—figure supplement 1—source data 1
High quality image file.
- https://cdn.elifesciences.org/articles/72375/elife-72375-fig7-figsupp1-data1-v2.pdf
Figure 7—figure supplement 2
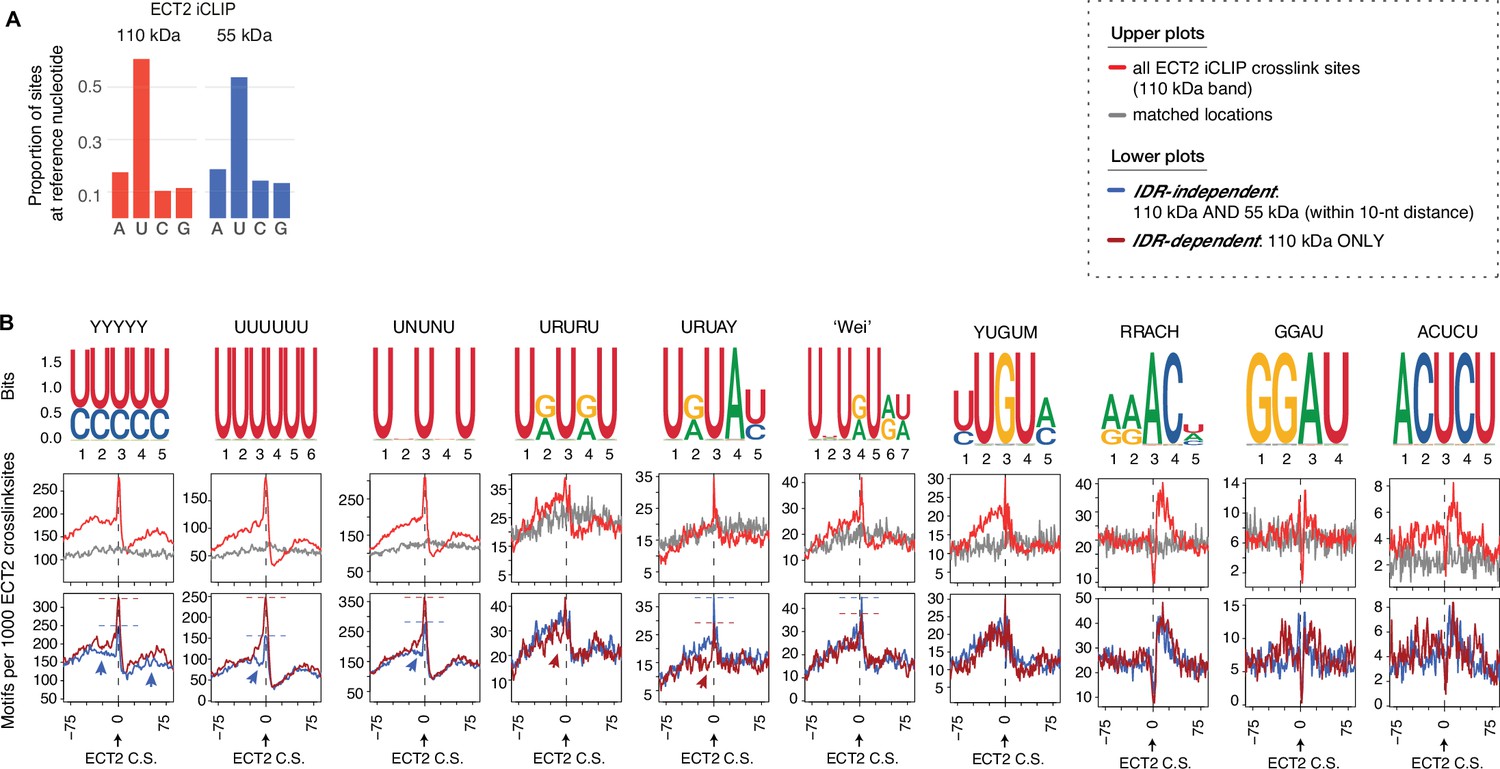
Dependency of the ECT2 intrinsically disordered region (IDR) for motif enrichment.
(A) Proportion of ECT2-iCLIP sites at each nucleotide for the 110kDa and 55kDa bands. (B) From top to bottom: (1) motif logos for derived position weight matrices (PWMs); (2) distribution of motifs per 1000 ECT2-iCLIP crosslink sites (red) or matched-locations background (gray), ±75 nt of the site; (3) motifs per 1000 ECT2-iCLIP crosslink sites, split according to whether they are found in libraries from both 110kDa and 55kDa bands (’IDR-independent’) or exclusively (distance >10 nt) in the 110kDa band (’IDR-dependent’).
-
Figure 7—figure supplement 2—source data 1
High quality image file.
- https://cdn.elifesciences.org/articles/72375/elife-72375-fig7-figsupp2-data1-v2.pdf
Tables
Key resources table
| Reagent type (species) or resource | Designation | Source orreference | Identifiers | Additional information |
|---|---|---|---|---|
| Gene (Arabidopsis thaliana) | ECT2 | TAIR10 | AT3G13460 | EVOLUTIONARILY CONSERVED C-TERMINAL REGION 2 |
| Gene (Arabidopsis thaliana) | ECT3 | TAIR10 | AT5G61020 | EVOLUTIONARILY CONSERVED C- TERMINAL REGION 3 |
| Gene (Arabidopsis thaliana) | ECT4 | TAIR10 | AT1G55500 | EVOLUTIONARILY CONSERVED C- TERMINAL REGION 4 |
| Gene (Drosophila melanogaster) | ADAR Isoform N | Genebank, FlyBase, NCBI | CG12598 NM_001297862 | Adenosine deaminase acting on RNA |
| Strain (Escherichia coli) | DH5α | NEB | Cat. # 18258012 | MAX Efficiency DH5α Competent Cells |
| Strain (Agrobacterium tumefaciens) | GV3101 | Koncz and Schell, 1986 | ||
| Genetic reagent (A. thaliana) | SALK_002225 C (ect2-1) | NASC | N657472 N2110120 | |
| Genetic reagent (A. thaliana) | te234 (ect2-1/ect3-1/ect4-2) | Arribas-Hernández et al., 2018 | N2110132 | Donated to NASC and ABRC |
| Genetic reagent (A. thaliana) | ECT2pro:FLAG-DmADARE488Qcd-ECT2ter | This paper (see Methods) | Seed requests to pbrodersen@bio.ku.dk | |
| Genetic reagent (A. thaliana) | ect2-1/ECT2pro:ECT2-FLAG-DmADARE488Qcd-ECT2ter | This paper (see Methods) | Seed requests to pbrodersen@bio.ku.dk | |
| Genetic reagent (A. thaliana) | te234/ECT2pro:ECT2-FLAG-DmADARE488Qcd-ECT2ter | This paper (see Methods) | Seed requests to pbrodersen@bio.ku.dk | |
| Genetic reagent (A. thaliana) | ect2-1/ECT2pro: ECT2-mCherry-ECT2ter | Arribas-Hernández et al., 2018; Arribas-Hernández et al., 2020 | N2110839 N2110840 | Donated to NASC and ABRC |
| Genetic reagent (A. thaliana) | ect2-1/ECT2pro: ECT2W464A- mCherry-ECT2ter | Arribas-Hernández et al., 2018; Arribas-Hernández et al., 2020 | N2110841 N2110842 | Donated to NASC and ABRC |
| Genetic reagent (A. thaliana) | ect2−1/ ECT2pro:3xHA- ECT2-ECT2ter | This paper (see Methods) | Seed requests to pbrodersen@bio.ku.dk | |
| Genetic reagent (A. thaliana) | ect2−1/ ECT2pro:3xHA-ECT2W464A-ECT2ter | This paper (see Methods) | Seed requests to pbrodersen@bio.ku.dk | |
| Genetic reagent (D. melanogaster) | Canton-S | Bloomington Drosophila Stock Center | BDSC:64,349 | Used to extract RNA and produce cDNA for cloning |
| Antibody | anti-FLAG (mouse monoclonal) | Sigma-Aldrich | A8592 | Used for WB (1:1000) |
| Antibody | anti-mCherry (rabbit polyclonal) | Abcam | ab183628 | Used for WB (1:1000) |
| Antibody | anti-HA (mouse monoclonal) | Abnova | 12CA5 | Used for WB (1:2000) |
| Antibody | RFP-Trap RFP Nanobody/VHH coupled to agarose (recombinant, monoclonal) | ChromoTek | Cat. # rta-20 | Used for IP (20 μL of beads for 4 g of tissue in 6 mL of buffer) |
| Antibody | Anti-HA Affinity Matrix from IgG1 3 F10 (rat, monoclonal) | Roche | Cat. # 11815016001 | Used for IP (10 μL of beads for 500 mg of tissue in 750 μL of buffer) |
| Recombinant DNA reagent | pCAMBIA3300U (plasmid) | Nour-Eldin et al., 2006 | Used for cloning | |
| Commercial assay or kit | pGEM -T Easy (plasmid and cloning kit) | Promega | Cat. # A1360 | Used for cloning |
| Commercial assay or kit | KAPAHiFi HotStart Uracil + Kit | Roche | Cat. # 7959079001 | Used for cloning |
| Commercial assay or kit | AccuPrime Supermix I | Invitrogen | Cat. # 12342–010 | Used for iCLIP library preparation |
| Peptide, recombinant protein | Uracil-DNA Glycosylase (USER enzyme) | NEB | Cat. # M5505L | Used for cloning |
| Peptide, recombinant protein | Turbo DNase | Ambion | Cat. # AM2238 | Used for CLIP |
| Peptide, recombinant protein | RNase I | Ambion | Cat. # AM2294 | Used for CLIP |
| Peptide, recombinant protein | T4 Polynucleotide Kinase (PNK) | ThermoFisher Scientific | Cat. # EK0031 | Used for iCLIP library preparation |
| Peptide, recombinant protein | T4 RNA Ligase I, High Concentration | NEB | Cat. # M0437M | Used for iCLIP library preparation |
| Peptide, recombinant protein | Proteinase K | Roche | Cat. # 3115887001 | Used for iCLIP library preparation |
| Peptide, recombinant protein | Superscript III Reverse Transcriptase | Invitrogen | Cat. # 18080–093 | Used for iCLIP library preparation |
| Peptide, recombinant protein | CircLigase II ssDNA Ligase | Epicentre | Lucigen Cat. # CL9021K | Used for iCLIP library preparation |
| Peptide, recombinant protein | BamHI (Fast Digest) | ThermoFisher Scientific | Cat. # FD0054 | Used for iCLIP library preparation |
| Chemical compound, drug | cOmplete protease inhibitor cocktail | Roche | Cat. # 11697498001 | Used for CLIP |
| Chemical compound, drug | Protease inhibitor cocktail for plant cell extracts | Sigma | Cat. # P9599 | Used for CLIP |
| Chemical compound, drug | Glufosinate-ammonium (PESTANAL) | Sigma | Cat. # 45520 77182-82-2 | Used for selection of transgenic lines |
| Sequence-based reagent | Pre-adenylated adapter for iCLIP (3’-RNA linker) | Huppertz et al., 2014 | L3-App | rAppAGATCG GAAGAGCGGT TCAG/ddC/ |
| Sequence-based reagent | iCLIP RT-primers (Two-part cleavable DNA adapters complementary to the 3’ RNA linker) | Huppertz et al., 2014 | Rt1clip-Rt12clip | Used for iCLIP library preparation (seq: ) |
| Sequence-based reagent | USER and site-directed mutagenesis primers | This paper (Appendix) | Used for cloning. Sequences are in the Appendix | |
| Sequence-based reagent | Primers for detection of point mutations | This paper (Appendix) | Used for cloning. Sequences are in the Appendix | |
| Software, algorithm | R | https://www.R-project.org/ | Used for data analyses | |
| Software, algorithm | hyperTRIBER | Rennie et al., 2021; https://github.com/sarah-ku/hyperTRIBER; https://github.com/sarah-ku/targets_arabidopsis | Used for calling significant ADAR-edited sites. Contact: sarah@binf.ku.dk | |
| Software, algorithm | trimmomatic | Bolger et al., 2014 | Used for trimming RNAseq-reads | |
| Software, algorithm | STAR | Dobin et al., 2013 | Used for mapping RNAseq-reads | |
| Software, algorithm | Salmon | Patro et al., 2017 | Used for transcript quantification | |
| Software, algorithm | SAMtools mpileup | Li et al., 2009 | Used to count nt-mismatches | |
| Software, algorithm | rtracklayer | Lawrence et al., 2009 | Used to retrieve sequences | |
| Software, algorithm | ggseqlogo | Wagih, 2017 | Used to generate motif logos | |
| Software, algorithm | Hmisc | https://github.com/harrelfe/Hmisc/ | Used for expression-based binning | |
| Software, algorithm | fastqc | https://www.bioinformatics.babraham.ac.uk/projects/fastqc/ | Used for quality control | |
| Software, algorithm | cutadapt | Martin, 2011 | Used for trimming of iCLIP reads | |
| Software, algorithm | flexbar | Roehr et al., 2017 | Used for demultiplexing iCLIP reads | |
| Software, algorithm | PureCLIP | Krakau et al., 2017 | Used for calling iCLIP peaks | |
| Software, algorithm | GenomicRanges | Lawrence et al., 2013 | Used to retrieve short sequences | |
| Software, algorithm | ‘Distributions of motifs per 1,000 sites over distance’ | This paper https://github.com/sarah-ku/targets_arabidopsis | Used to calculate motif distributions around m6A/iCLIP. Contact: sarah@binf.ku.dk | |
| Software, algorithm | ggplot2 | https://ggplot2.tidyverse.org | Used to generate plots | |
| Software, algorithm | bedtools | Dale et al., 2011; Quinlan and Hall, 2010 | Used to filter and clean iCLIP data | |
| Software, algorithm | Homer | Heinz et al., 2010 | Used for de novo motif discovery | |
| Software, algorithm | FIMO | Grant et al., 2011 | Used to detect motif occurrences | |
| Software, algorithm | gbm | https://github.com/gbm-developers/gbm | Used for random forest analysis | |
| Software, algorithm | pROC | Robin et al., 2011 | Used to estimate predictive score of RF | |
| Software, algorithm | IGV (Integrative Genomics Viewer) | Robinson et al., 2011 | Used to show genomic data |
Additional files
-
Supplementary file 1
ECT2 HyperTRIBE data.
- https://cdn.elifesciences.org/articles/72375/elife-72375-supp1-v2.xlsx
-
Supplementary file 2
ECT2-mCherry iCLIP data.
- https://cdn.elifesciences.org/articles/72375/elife-72375-supp2-v2.xlsx
-
Supplementary file 3
Analysis of HOMER-identified and additional motifs around ECT2-iCLIP and m6A sites.
- https://cdn.elifesciences.org/articles/72375/elife-72375-supp3-v2.pdf
-
Transparent reporting form
- https://cdn.elifesciences.org/articles/72375/elife-72375-transrepform1-v2.pdf
Download links
A two-part list of links to download the article, or parts of the article, in various formats.
Downloads (link to download the article as PDF)
Open citations (links to open the citations from this article in various online reference manager services)
Cite this article (links to download the citations from this article in formats compatible with various reference manager tools)
Principles of mRNA targeting via the Arabidopsis m6A-binding protein ECT2
eLife 10:e72375.
https://doi.org/10.7554/eLife.72375


