Analysis of combinatorial chemokine receptor expression dynamics using multi-receptor reporter mice
- Chemokine Research Group, Institute of Infection, Immunity and Inflammation, College of Medical, Veterinary and Life Sciences, University of Glasgow, United Kingdom
- Center for Molecular and Cellular Bioengineering, Biotechnology Center, Technische Universität Dresden, Germany
- Shandong University–Helmholtz Institute of Biotechnology, State Key Laboratory of Microbial Technology, School of Life Science, Shandong University, China
- Max-Planck-Institute for Cell Biology and Genetics, Germany
Figures
Figure 1 with 3 supplements
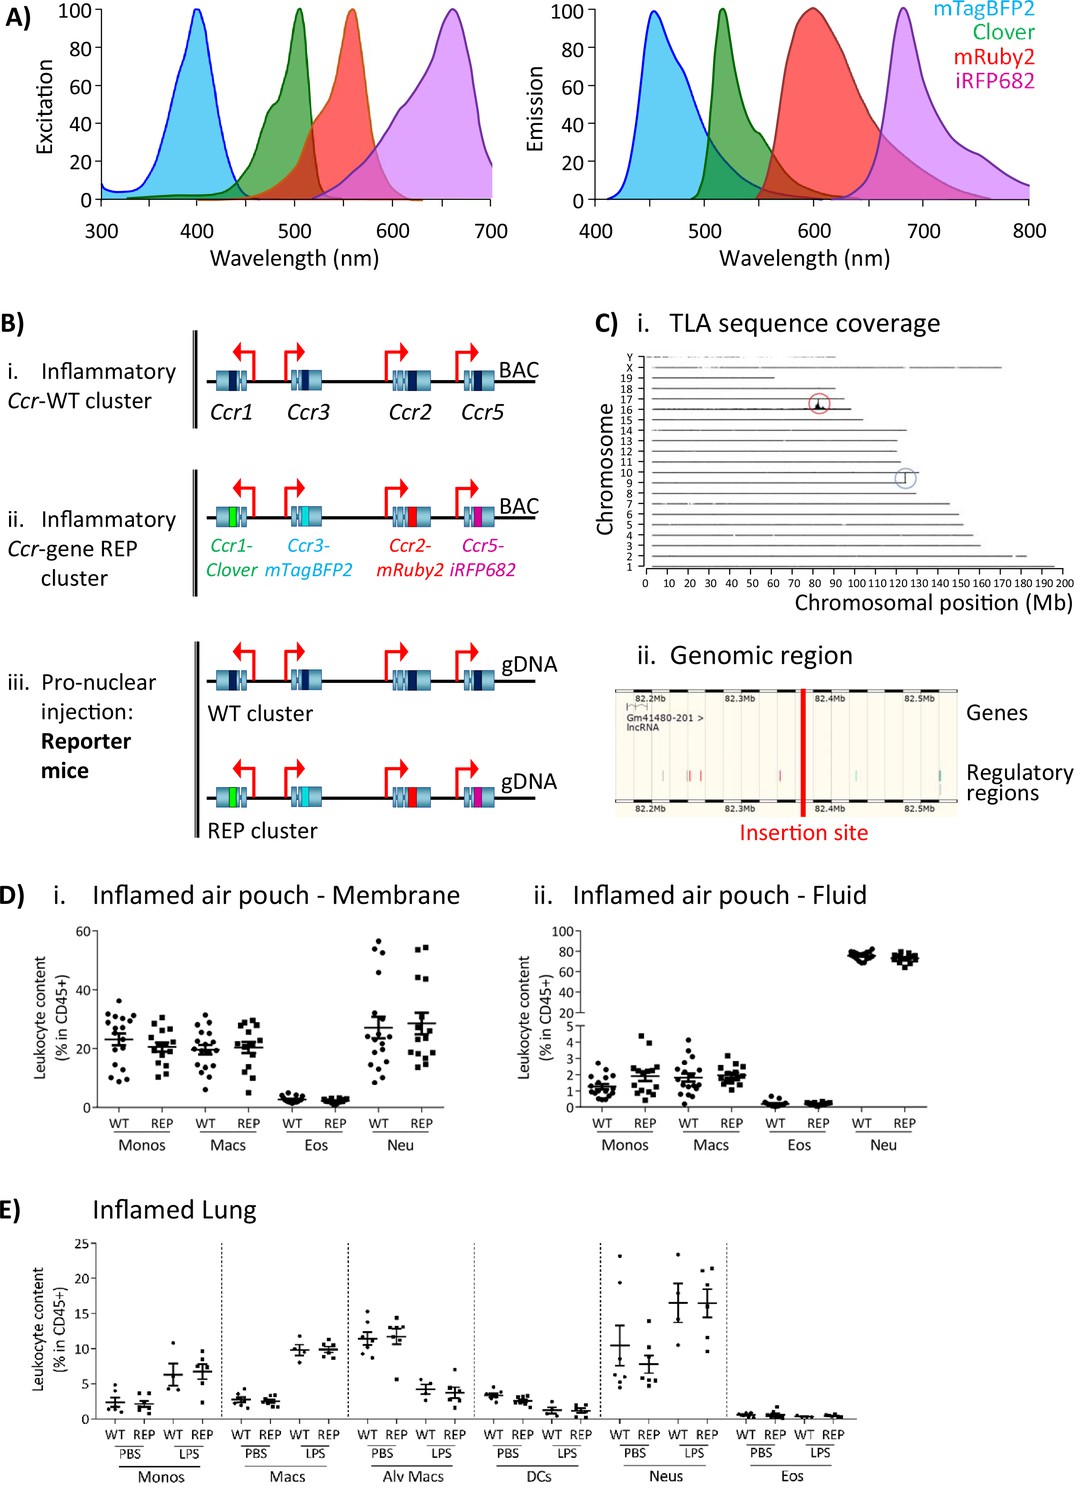
Generation of the reporter mice.
(A) Reporters were selected for this study based on their discrete excitation and emission spectra. (B) (i) The inflammatory Ccr genes were targeted in a bacterial artificial chromosome (BAC). (ii) The coding sequence of each inflammatory Ccr was replaced with a different fluorescent reporter (ii). (iii) Pro-nuclear injection was then used to generate the transgenic reporter mice. (C) (i) The inflammatory Ccr gene-REP cluster inserted into chromosome 16 (red circle), as determined by targeted locus amplification (TLA). The blue circle represents the endogenous locus. (ii) The insertion site does not contain any other genes or regulatory regions. (D) Leukocyte counts determined by flow cytometry in the inflamed air-pouch. Data are shown for (i) the membrane that surrounds the air-pouch and for (ii) the lavage fluid. (E) Leukocyte counts determined by flow cytometry in PBS- or LPS-treted lungs. Data on D and E are shown as mean ± SEM and are compiled from at least two separate experiments. Normally distributed data were analysed using unpaired t-test with or without Welch’s correction, according to their standard deviations. Not normally distributed data were analysed using Mann-Whitney or Kolmogorov-Smirnov, according to their standard deviations. Each data point represents a measurement from a single mouse (N=15-18 in D; N=4-6 in E). Abbreviations are: Monos, monocytes; Macs, macrophages; Neu, neutrophils; Eos, eosinophils; DCs, dendritic cells; Alv macs, alveolar macrophages. See also Figure 1—figure supplement 3.
Figure 1—figure supplement 1
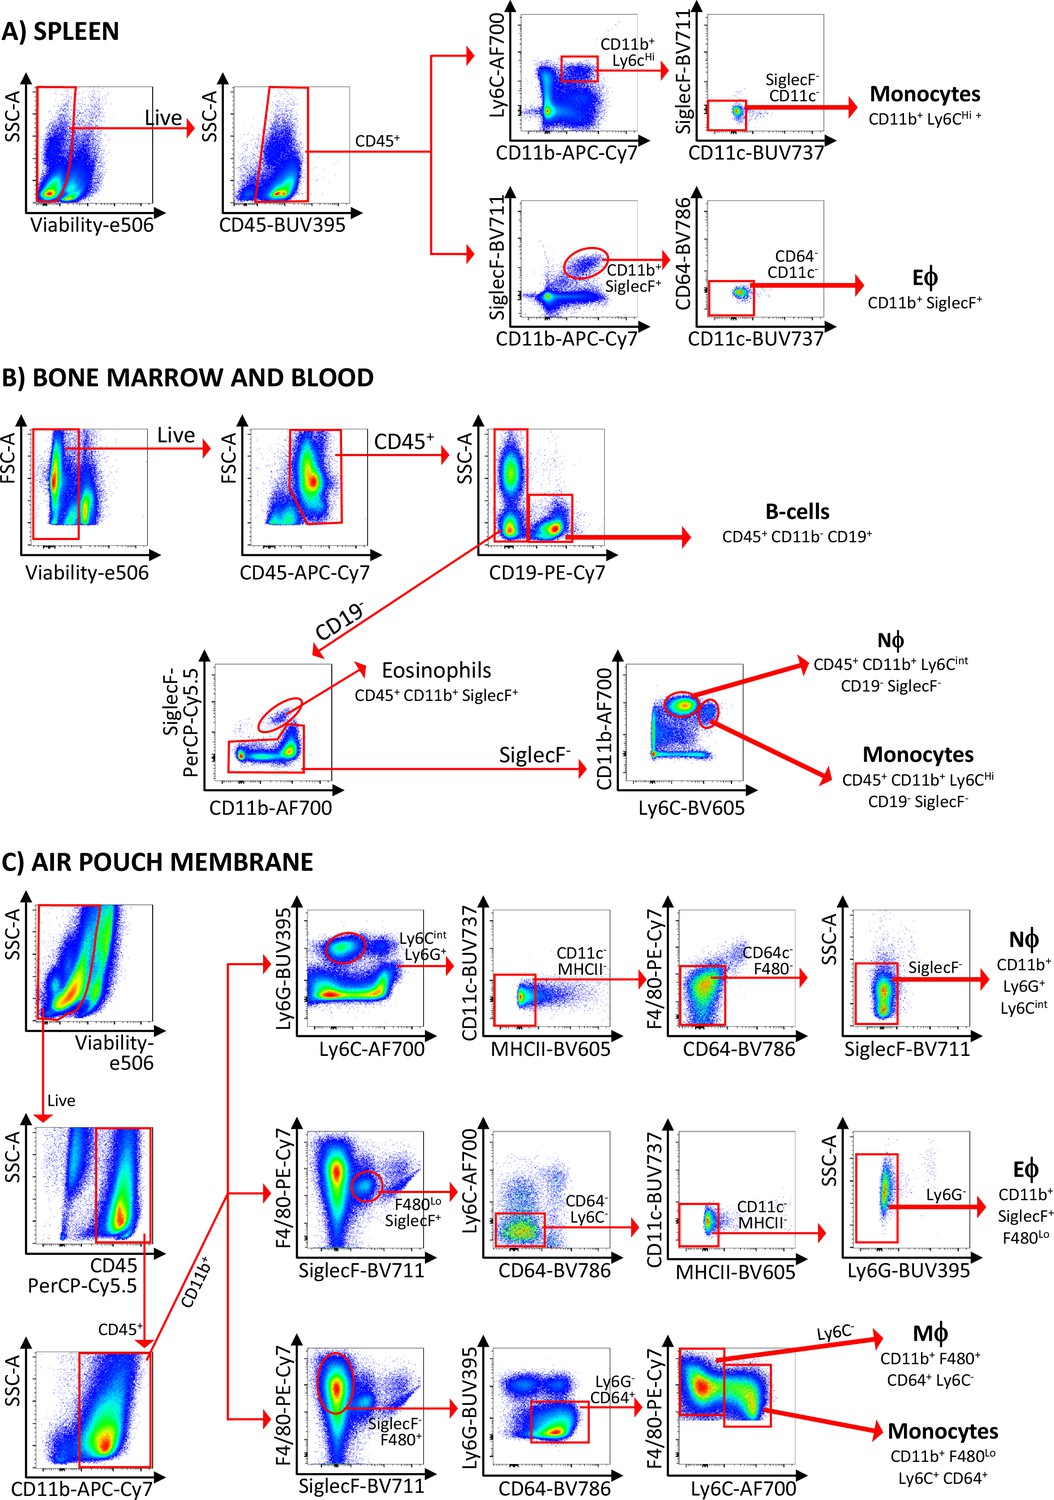
Gating strategies used in the study.
Gating strategies used for the isolation of cell subsets in (A) spleen, (B) bone marrow and blood, and (C) air-pouch membrane. Abbreviations are: Eϕ, eosinophils; Nϕ, neutrophils; Mϕ, macrophages.
Figure 1—figure supplement 2
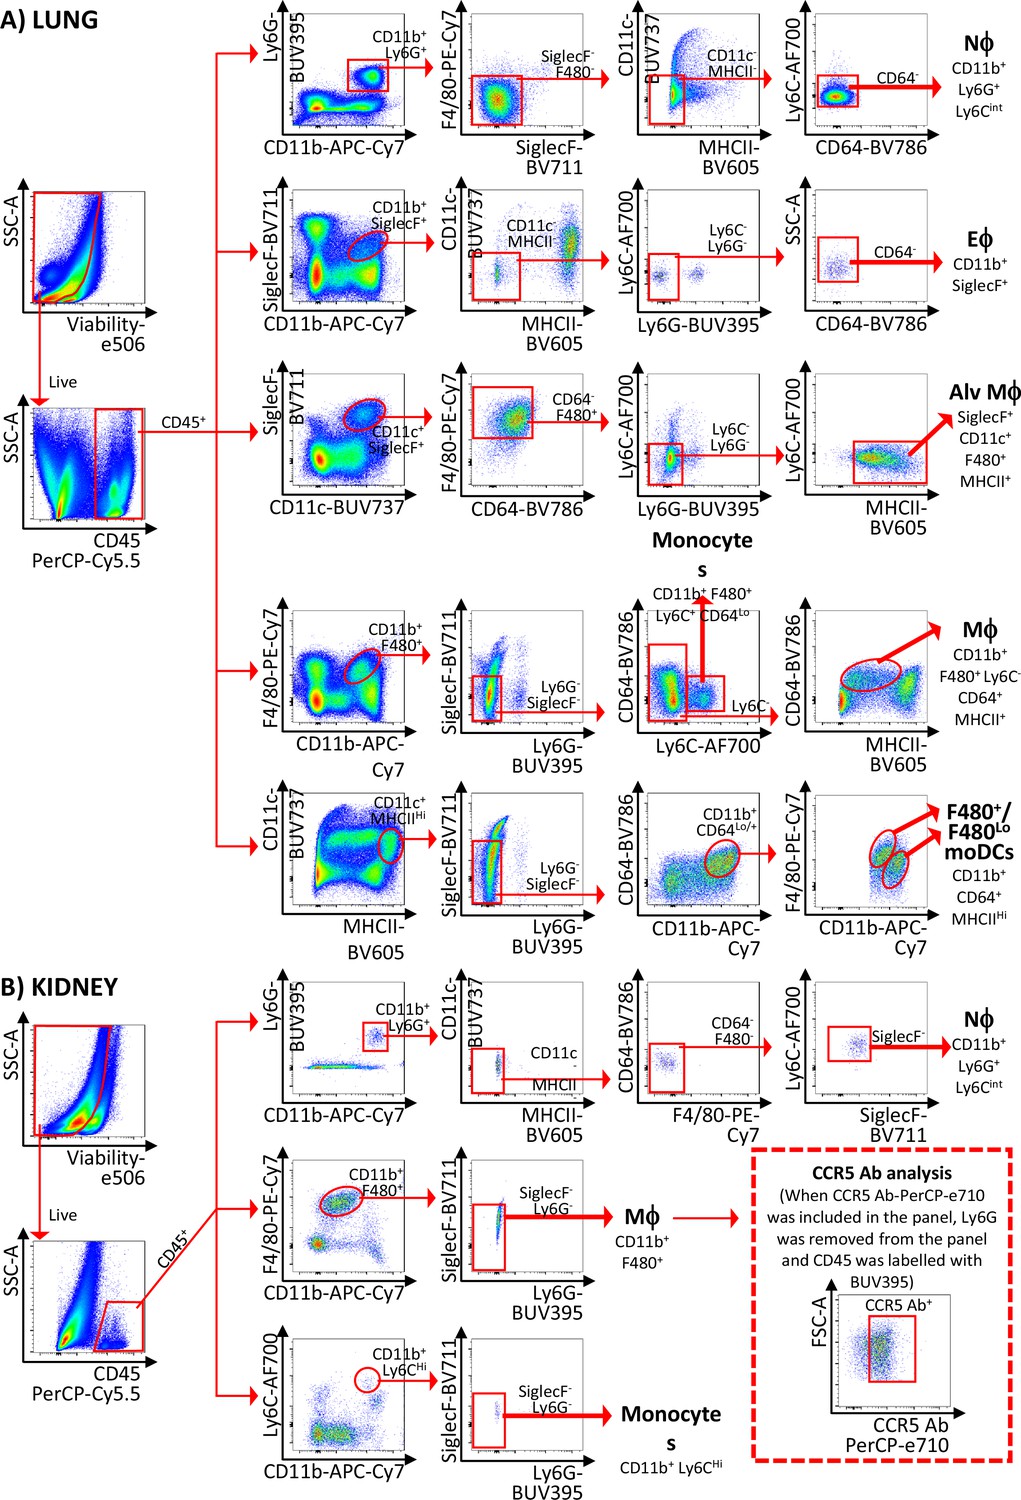
Gating strategies used in the study.
Gating strategies used for the isolation of (A) lung and (B) kidney cell subsets. Abbreviations are: Nϕ, neutrophils; Eϕ, eosinophils; Alv Mϕ, alveolar macrophages; Mϕ, macrophages; moDCs, monocyte-derived dendritic cells.
Figure 1—figure supplement 3
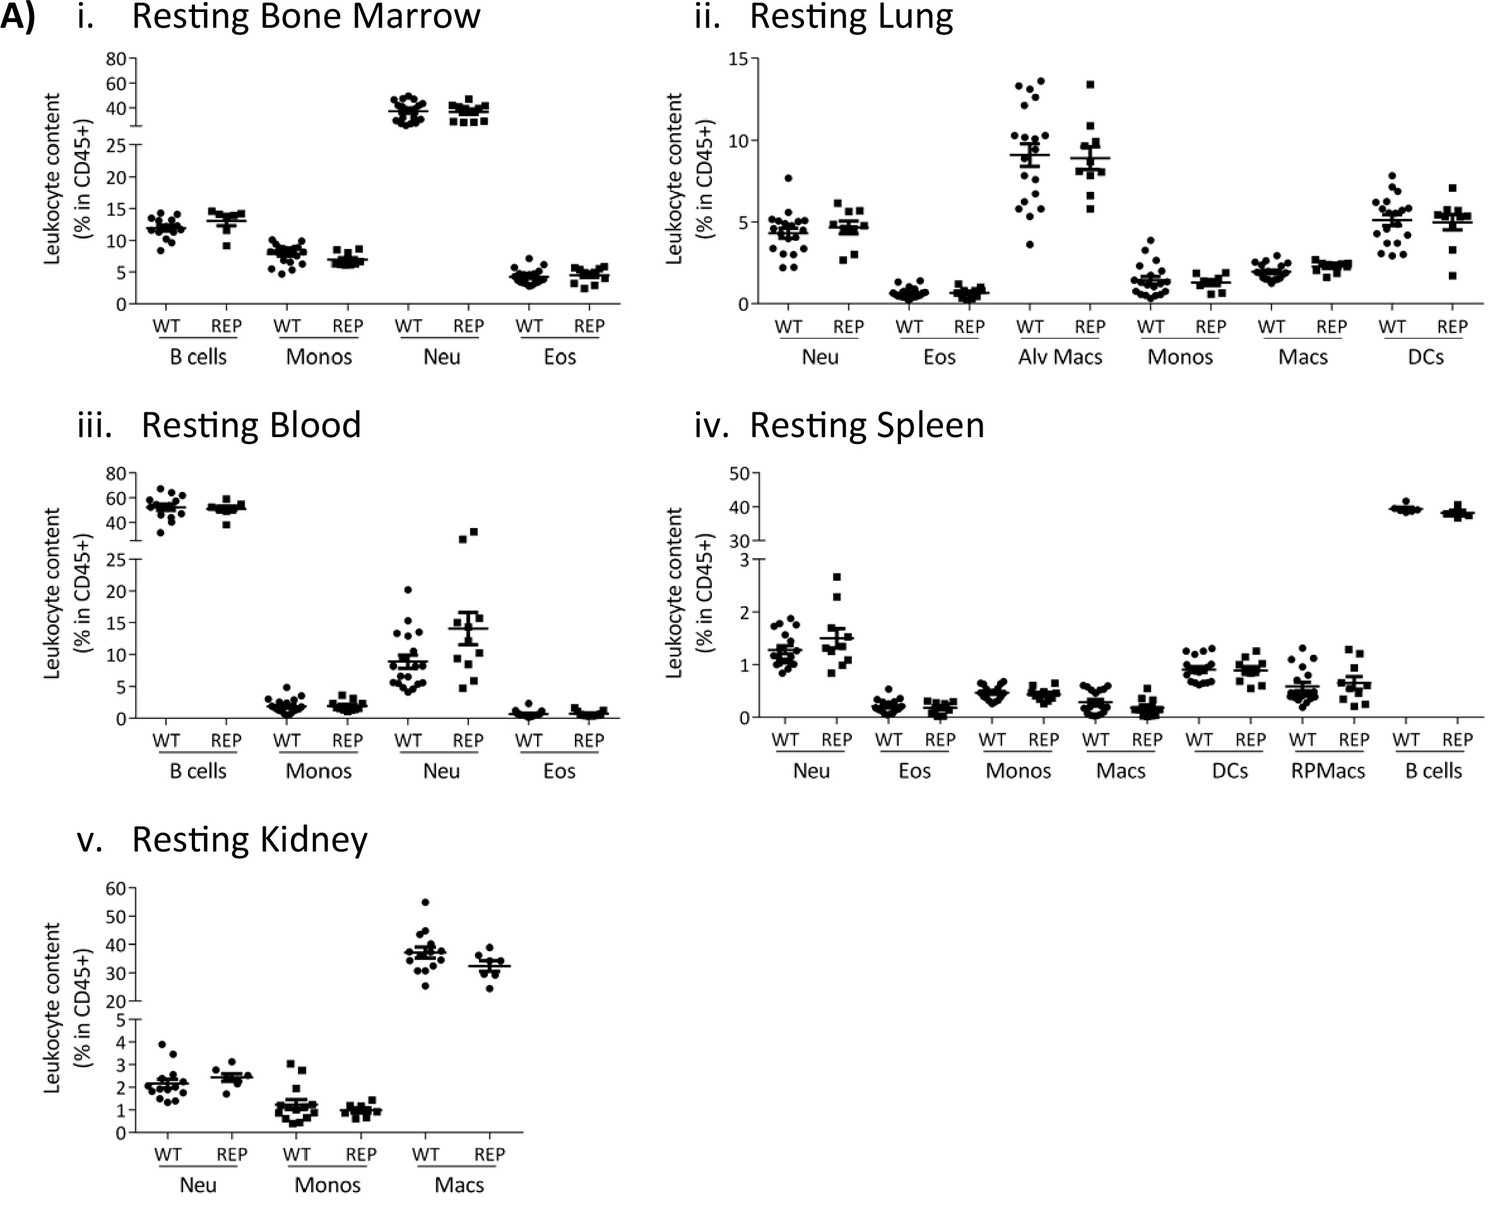
Normal leukocyte recruitment in the reporter mice.
Leukocyte counts determined by flow cytometry in resting (i) bone marrow, (ii) lung, (iii) blood, (iv) spleen, and (v) kidney. Data are shown as mean ± SEM and are compiled from at least two separate experiments. Normally distributed data were analysed using unpaired t-test with or without Welch’s correction, according to their standard deviations. Not normally distributed data were analysed using Mann-Whitney or Kolmogorov-Smirnov, according to their standard deviations. Each data point represents a measurement from a single mouse (N=7-14). Abbreviations are: Monos, monocytes; Macs, macrophages; Neu, neutrophils; Eos, eosinophils; DCs, dendritic cells; RPMacs, red pulp macrophages; Alv macs, alveolar macrophages.
Figure 2
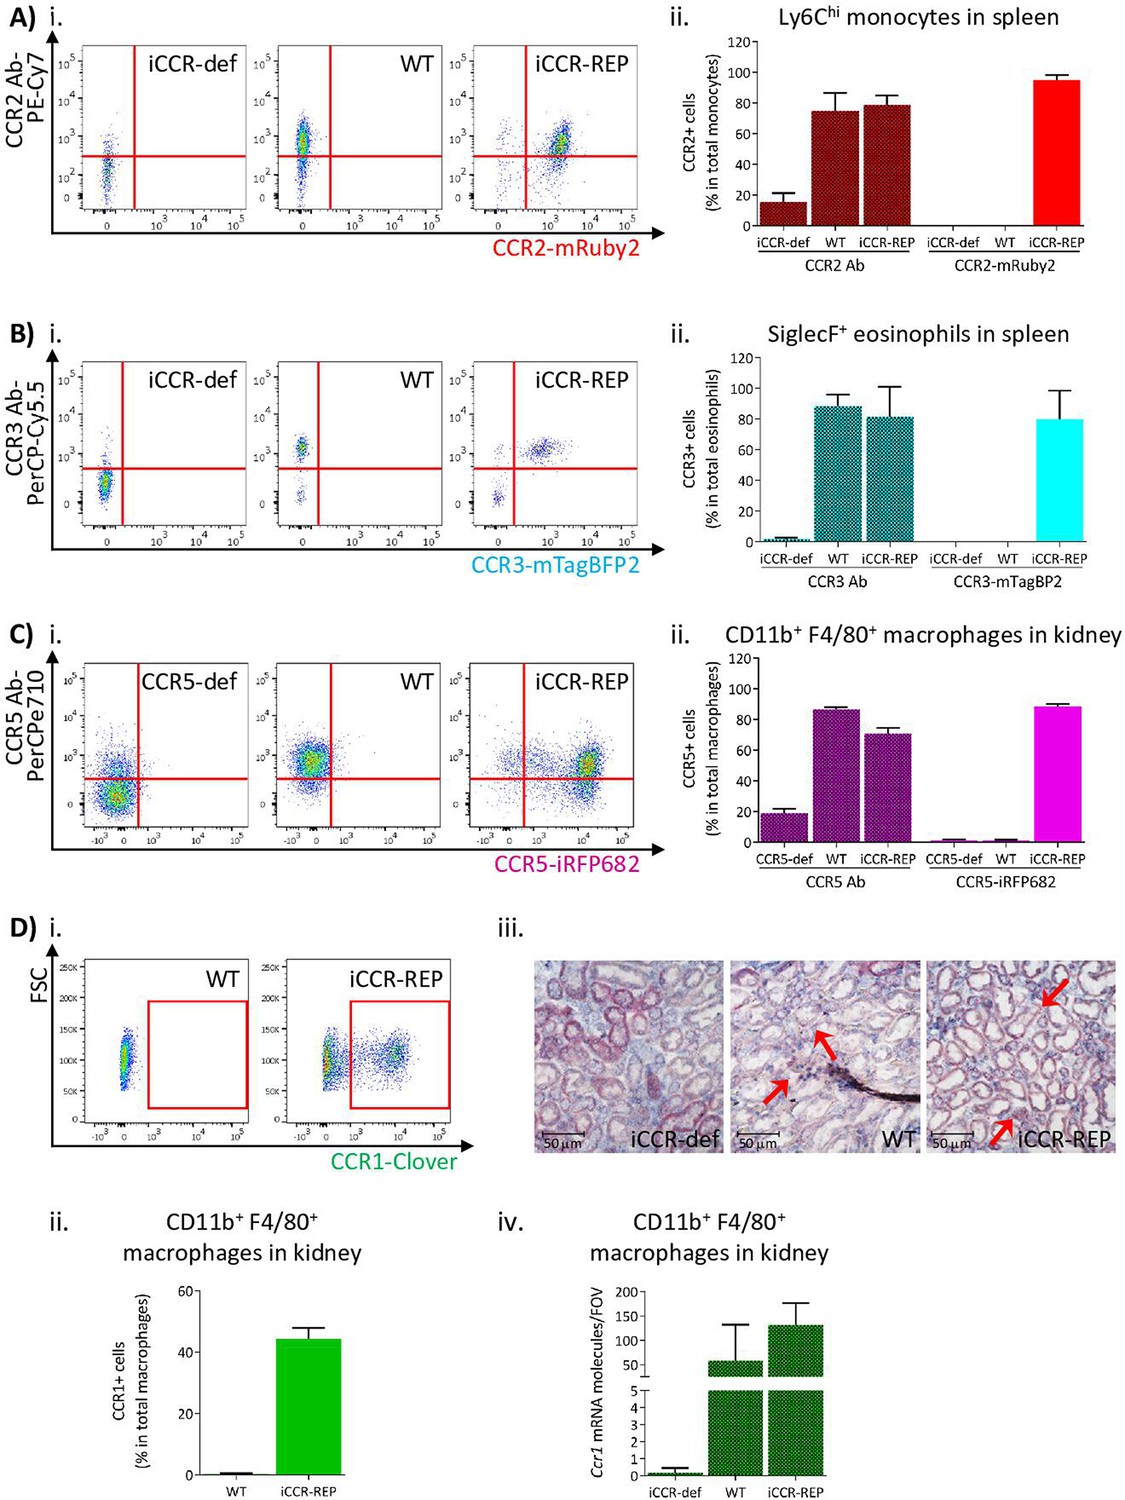
Inflammatory CC chemokine receptor (iCCR) reporter expression accurately mirrors iCCR surface presentation.
(A) (i) Flow cytometric analysis of CCR2 antibody binding and mRuby2 expression in spleen Ly6Chi monocytes at rest. (ii) Quantification of the percentage of Ly6Chi monocytes binding CCR2 antibody and expressing mRuby2. (B) (i) Flow cytometric analysis of CCR3 antibody binding and mTagBFP2 expression in spleen SiglecF+ eosinophils at rest. (ii) Quantification of the percentage of SiglecF+ eosinophils binding CCR3 antibody and expressing mTagBFP2. (C) (i) Flow cytometric analysis of CCR5 antibody binding and iRFP682 expression in kidney CD11b+F4/80+ macrophages at rest. (ii) Quantification of the percentage of CD11b+F4/80+ macrophages binding CCR5 antibody and expressing iRFP682. (D) (i) Flow cytometric analysis of Clover expression in kidney CD11b+F4/80+ macrophages at rest. (ii) Quantification of the percentage of CD11b+F4/80+ macrophages expressing Clover. (iii) Brightfield images of resting kidneys showing CCR1 mRNA molecules detected by RNAscope analysis in the form of red precipitate dots (arrows). (iv) CCR1 mRNA molecule counts per field of view. Data information: data on Aii, Bii, Cii, Dii, and Div are shown as mean ± SD and are compiled from at least two separate experiments (N=4-7 in A, B and C: N=2-3 in D).
Figure 3
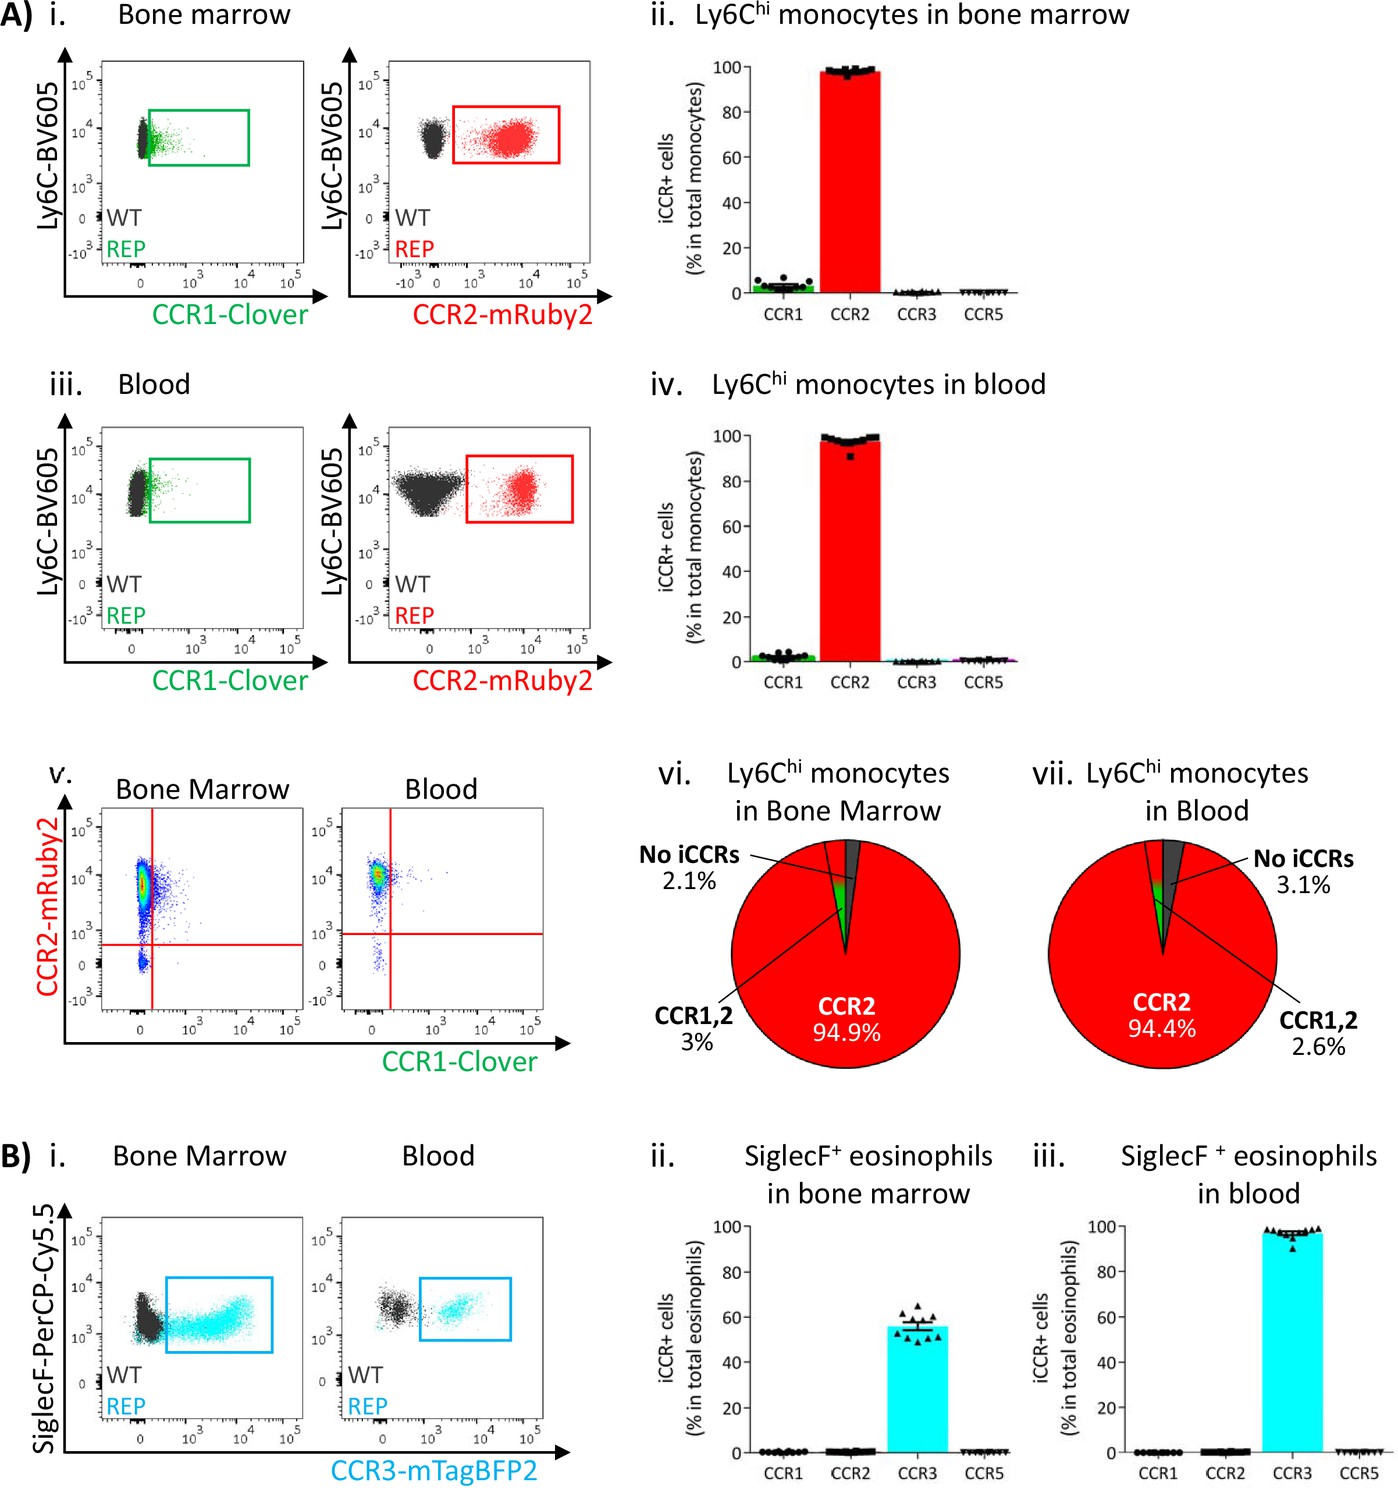
Inflammatory CC chemokine receptor (iCCR) expression in bone marrow and blood leukocytes at rest.
(A) Flow cytometric analysis of Clover/CCR1 and mRuby2/CCR2 expression in (i) bone marrow and (iii) circulating Ly6Chi monocytes. Quantification of the percentage of Ly6Chi monocytes expressing the fluorescent reporters in (ii) bone marrow and (iv) blood. (v) Flow cytometric analysis of Clover/CCR1 and mRuby2/CCR2 co-expression in bone marrow and circulating Ly6Chi monocytes. Distribution of Clover and mRuby2 in (vi) bone marrow and (vii) circulating Ly6Chi monocytes. (B) (i) Flow cytometric analysis of mTagBFP2/CCR3 expression in bone marrow and circulating SiglecF+ eosinophils. Quantification of the percentage of SiglecF+ eosinophils expressing the iCCR reporters in (ii) bone marrow and (iii) blood. Data on A–B are compiled from at least three separate experiments. Data on Aii, Aiv, Bii, and Biii are shown as mean ± SEM (N=10). Each data point represents a measurement from a single mouse. Blots in Ai, Aiii, and Bi are combinatorial blots showing reporter expression in iCCR-REP and wild type (WT) (control for background autofluorescence) mice.
Figure 4 with 4 supplements
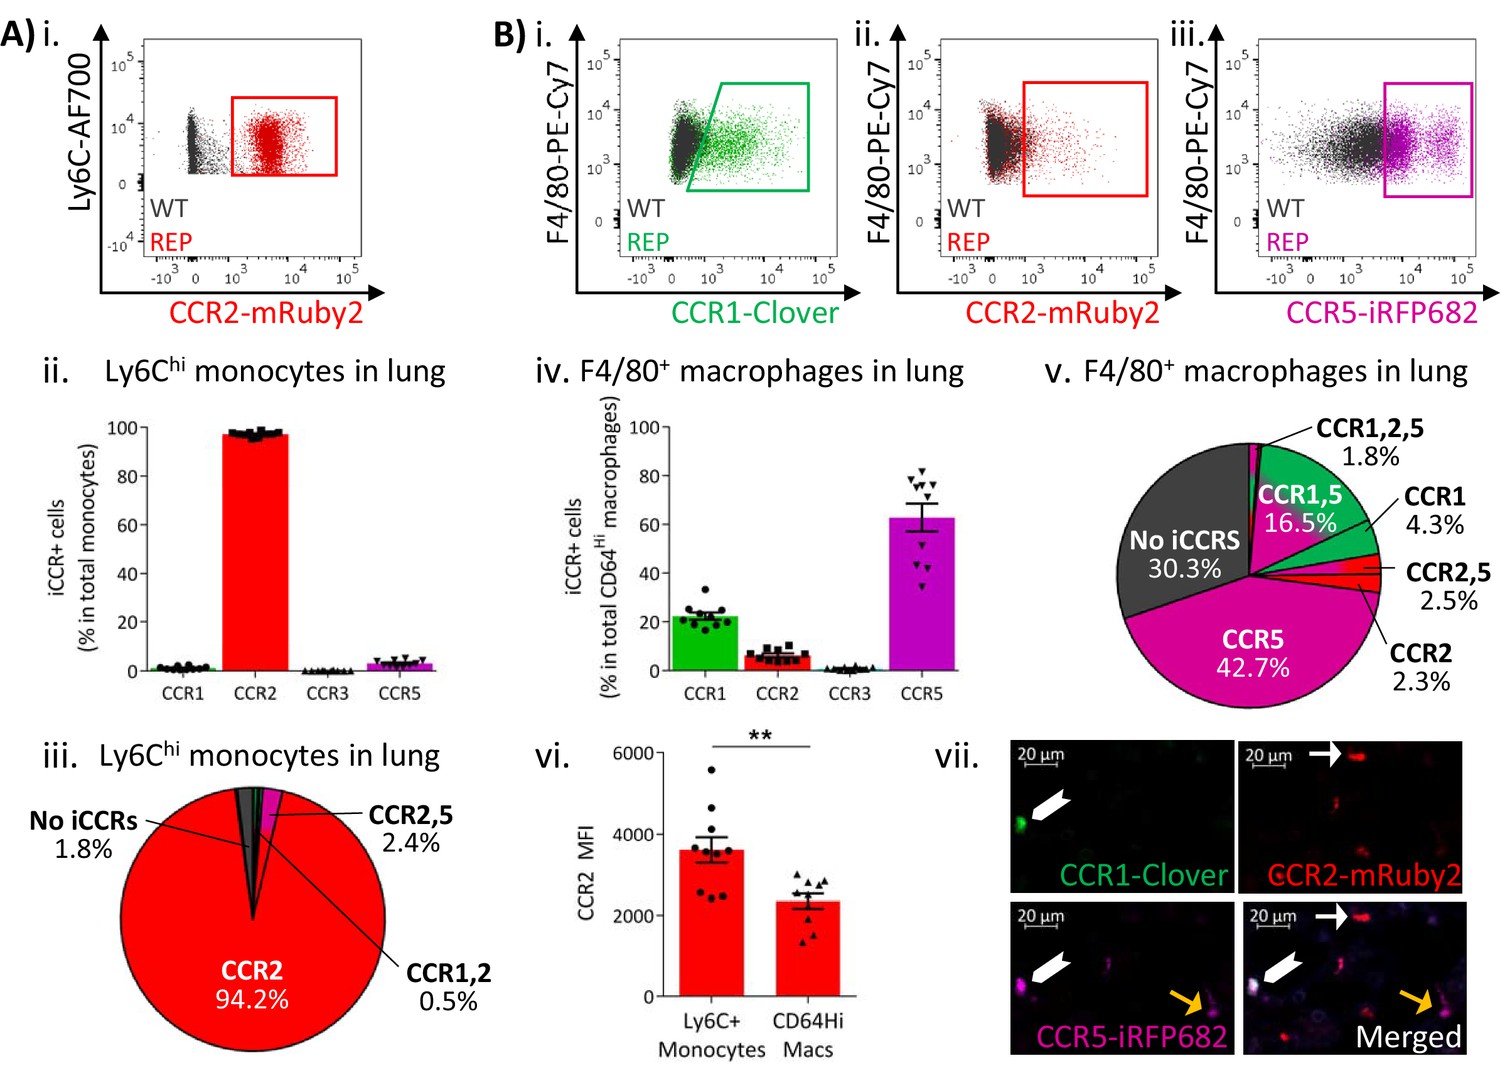
Inflammatory CC chemokine receptor (iCCR) expression in resting lung.
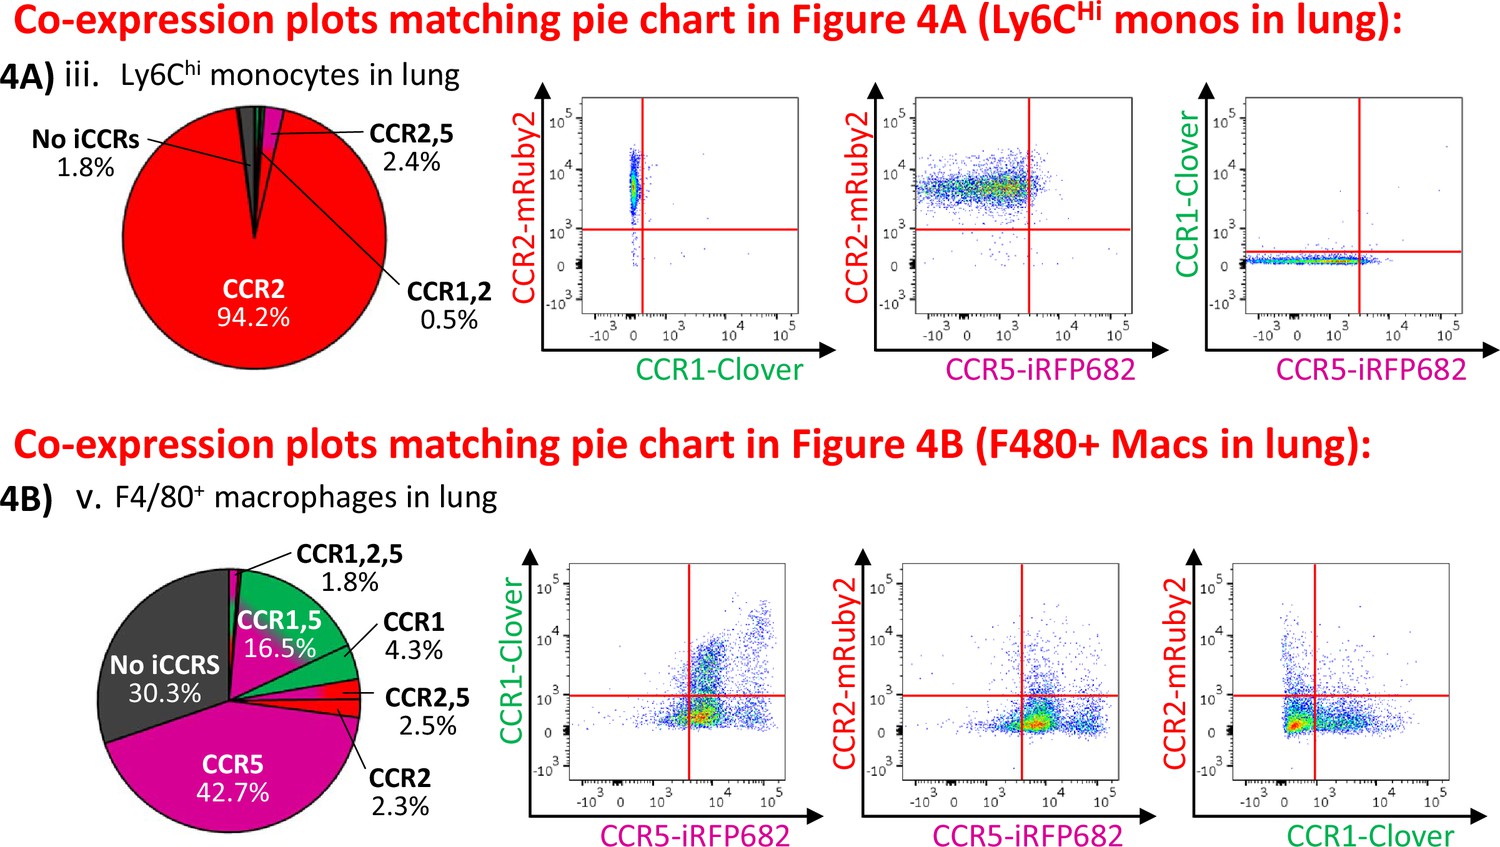
(A) (i) Flow cytometric analysis of mRuby2/CCR2 expression in Ly6Chi monocytes. (ii) Quantification of the percentage of Ly6Chi monocytes expressing the iCCR reporters. (iii) Distribution of the iCCR reporters in Ly6Chi monocytes. (B) Flow cytometric analysis of (i) Clover/CCR1, (ii) mRuby2/CCR2, and (iii) iRFP682/CCR5 expression in F4/80+ macrophages. (iv) Quantification of the percentage of F4/80+ macrophages expressing the iCCR reporters. (v) Distribution of the iCCR reporters in F4/80+ macrophages. (vi) mRuby2/CCR2 mean fluorescence intensity from Ly6Chi monocytes and F4/80+ macrophages. (vii) Lung leukocytes expressing CCR2 exclusively (white arrow), CCR1 and CCR5 (chevron) or CCR5 exclusively (yellow arrow). Data in A–B are compiled from at least two separate experiments. Data on Aii, Biv, Bvi are shown as mean ± SEM (N=10). Each data point represents a measurement from a single mouse. Blots in Ai, Bi, Bii, and Biii are combinatorial blots showing reporter expression in iCCR-REP and wild type (WT) (control for background autofluorescence) mice. Data on Bvi were analysed using unpaired t-test. **p<0.01. See also Figure 4—figure supplement 2 and , Figure 4—figure supplement 4.
Figure 4—figure supplement 1
Reporter co-expression in resting tissues.
Figure 4—figure supplement 2
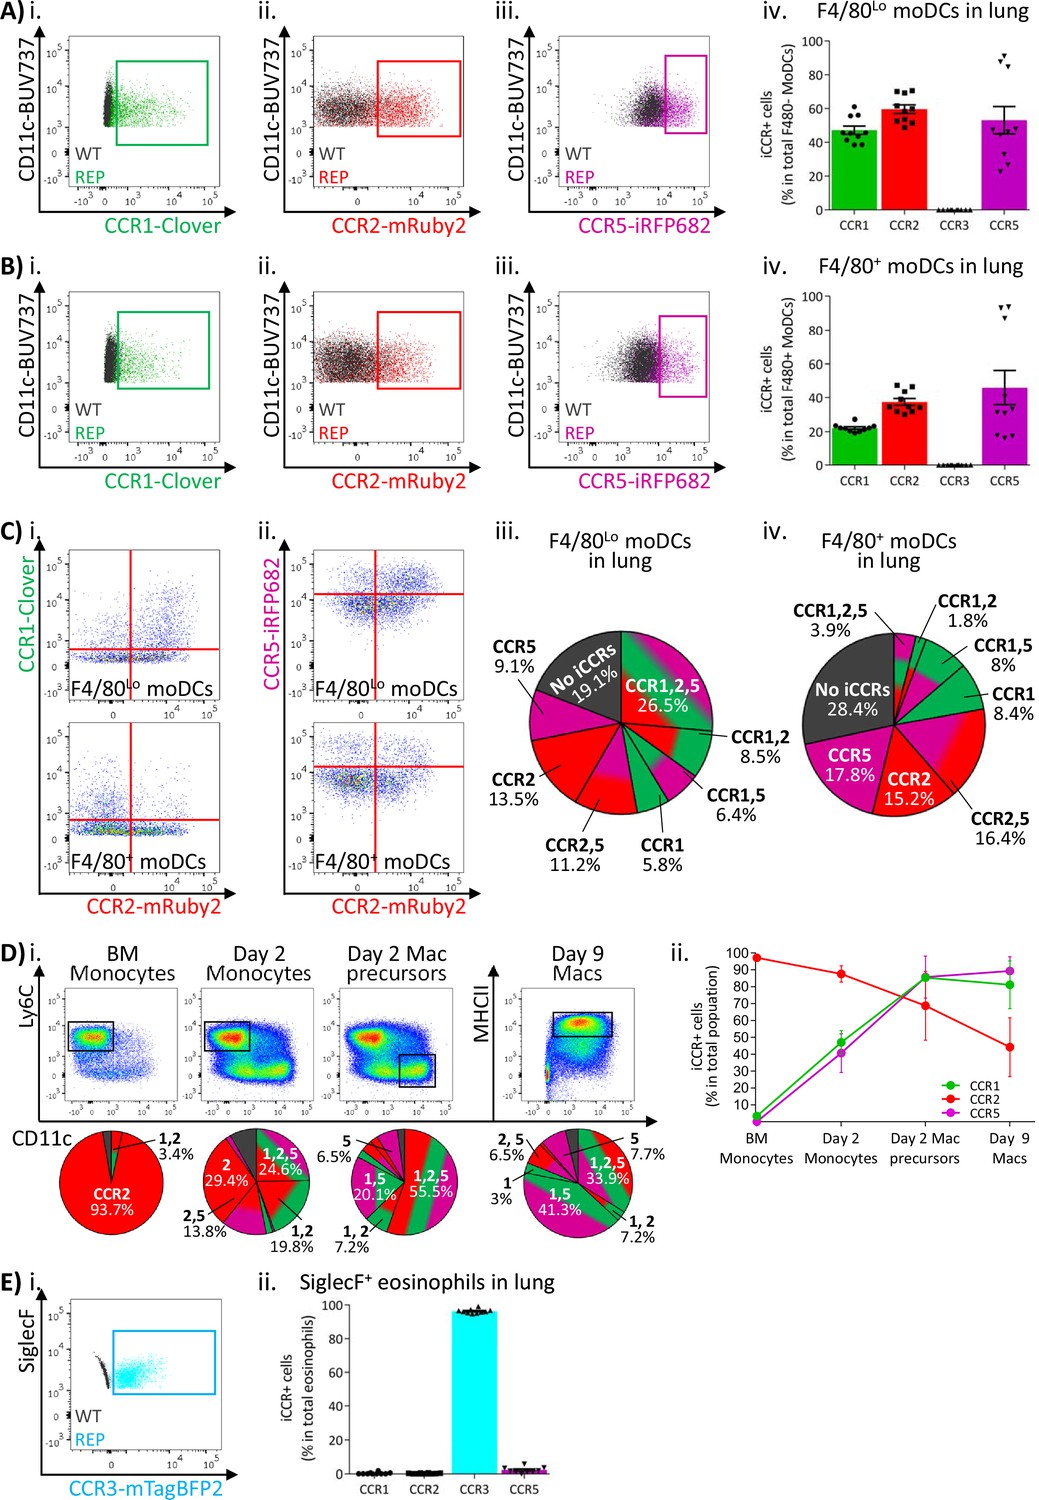
Inflammatory CC chemokine receptor (iCCR) expression in resting lung.
(A) Flow cytometric analysis of (i) Clover/CCR1, (ii) mRuby2/CCR2, and (iii) iRFP682/CCR5 expression in F4/80Lo monocyte-derived dendritic cells (moDCs) in resting lung. (iv) Quantification of the percentage of F4/80Lo moDCs expressing the iCCR reporters. (B) Flow cytometric analysis of (i) Clover/CCR1, (ii) mRuby2/CCR2, and (iii) iRFP682/CCR5 expression on F4/80+ moDCs in resting lung. (iv) Quantification of the percentage of F4/80+ moDCs expressing the iCCR reporters. (C) Flow cytometric analysis of the co-expression of (i) Clover/CCR1 with mRuby2/CCR2 or (ii) iRFP682/CCR5 with mRuby2/CCR2 on moDCs in resting lung. Distribution of the iCCR reporters in (iii) F4/80Lo and (iv) F4/80+ moDCs. (D) Flow cytometric analysis (i) and quantification (ii) of iCCR expression on bone marrow (BM)-derived GM-CSF moDCs. (E) (i) Flow cytometric analysis of mTagBFP2/CCR3 expression in SiglecF+ eosinophils in resting lung. (ii) Quantification of the percentage of SiglecF+ eosinophils expressing the iCCR reporters. Data in A–C and E are compiled from at least three separate experiments. Data in Dii is pooled from five mice and shown as mean ± SD. Data in Aiv, Biv, and Eii are shown as mean ± SEM (N=10). Each data point represents a measurement from a single mouse. Blots in Ai, Aii, Aiii, Bi, Bii, Biii, and Ei are combinatorial blots showing reporter expression in iCCR-REP and wild type (WT) (control for background autofluorescence) mice.
Figure 4—figure supplement 3
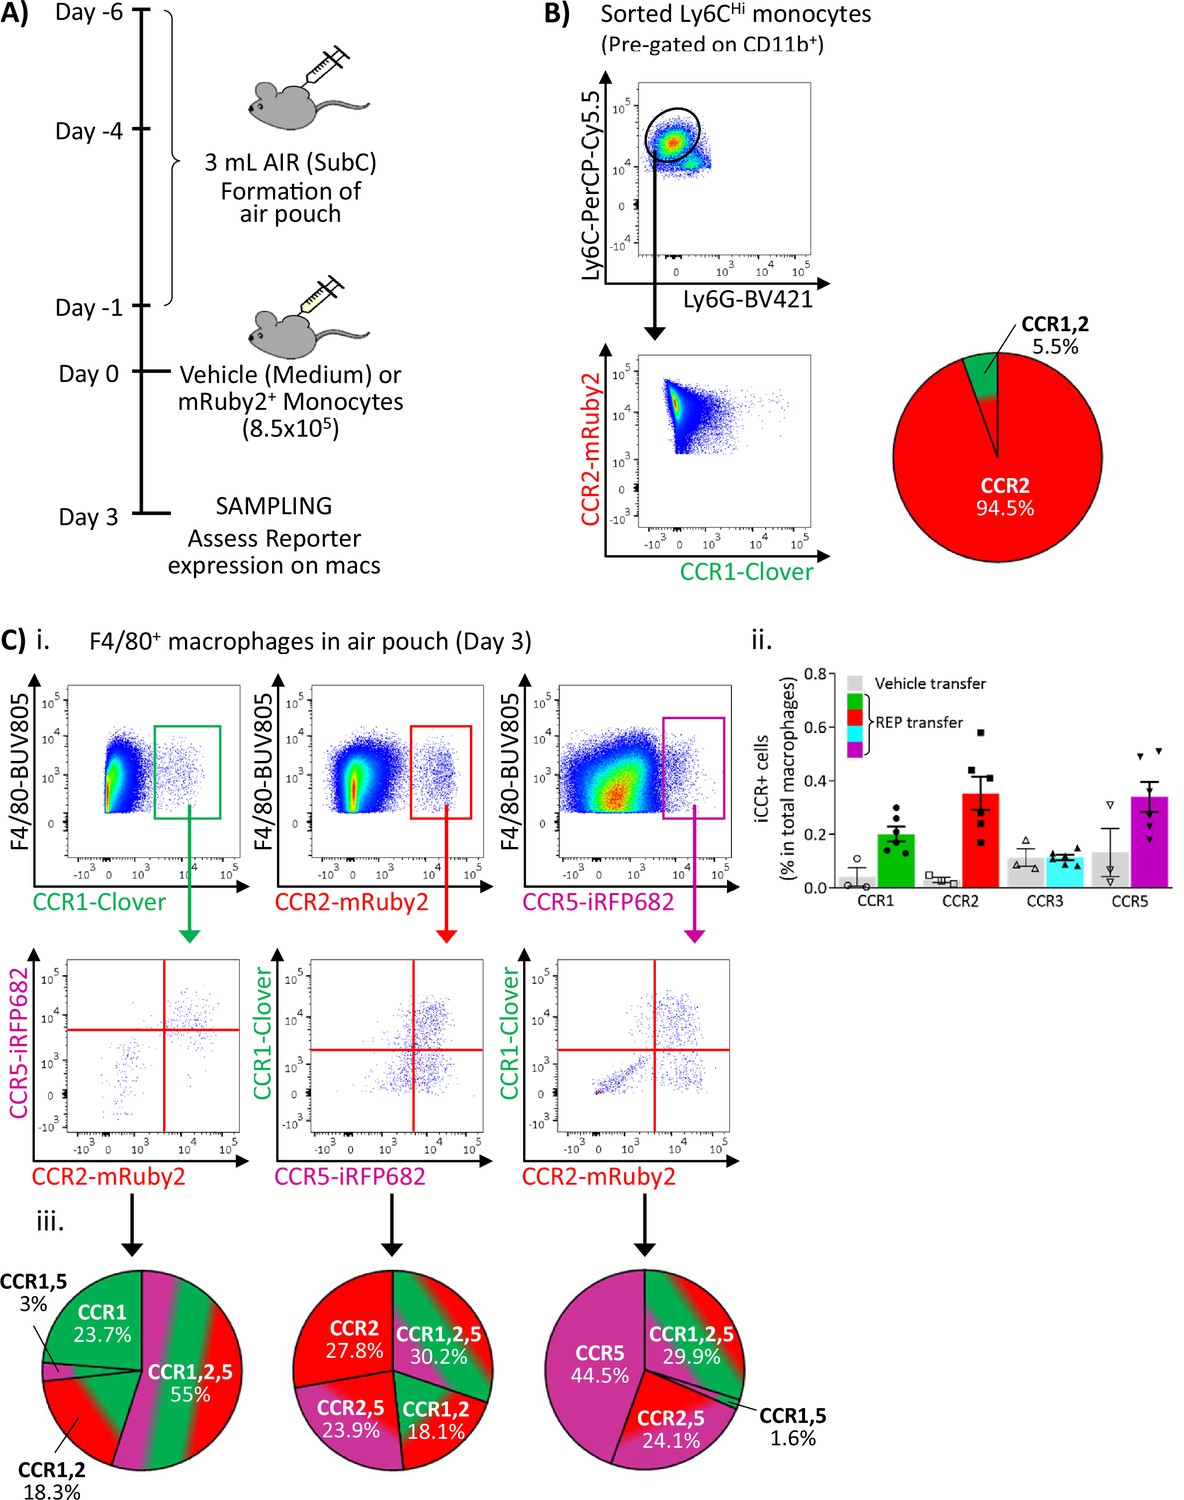
Inflammatory CC chemokine receptor (iCCR) expression in monocytes and macrophages during differentiation.
(A) Schematic of the procedure used to transfer monocytes into the air-pouch. (B) iCCR expression on REP Ly6CHi monocytes immediately before injection into the air-pouch. (C) iCCR expression on F4/80+ macrophages in air-pouch 3 days after REP monocyte transfer. (i) Flow cytometric analysis of Clover/CCR1, mRuby2/CCR2, and iRFP682/CCR5. (ii) Abundance of REP macrophages in the air-pouch. (iii) Co-expression of iCCR reporters on REP macrophages. Data in Cii are shown as mean ± SEM (N=3-6).
Figure 4—figure supplement 4
Inflammatory CC chemokine receptor (iCCR) reporters are readily visualised in tissues.
Spleens from resting mice were isolated and imaged using an AxioImager M2 microscope (Zeiss). Different magnifications are shown.
Figure 5 with 2 supplements
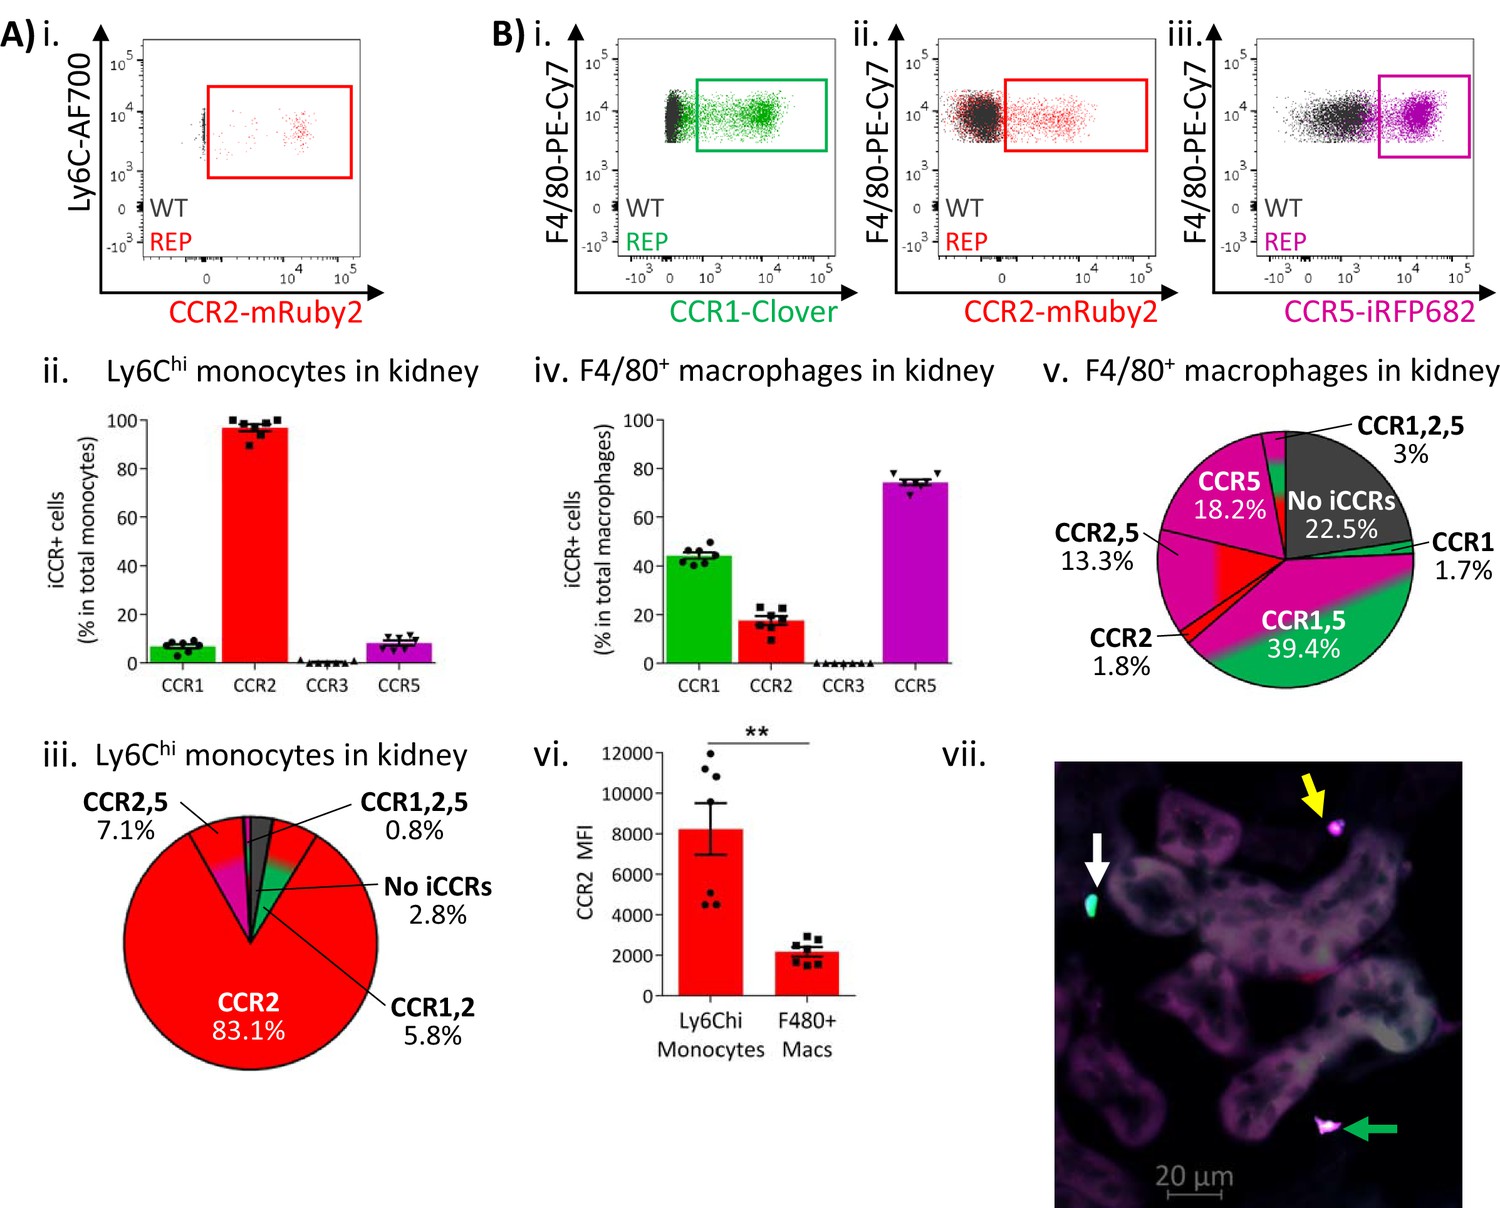
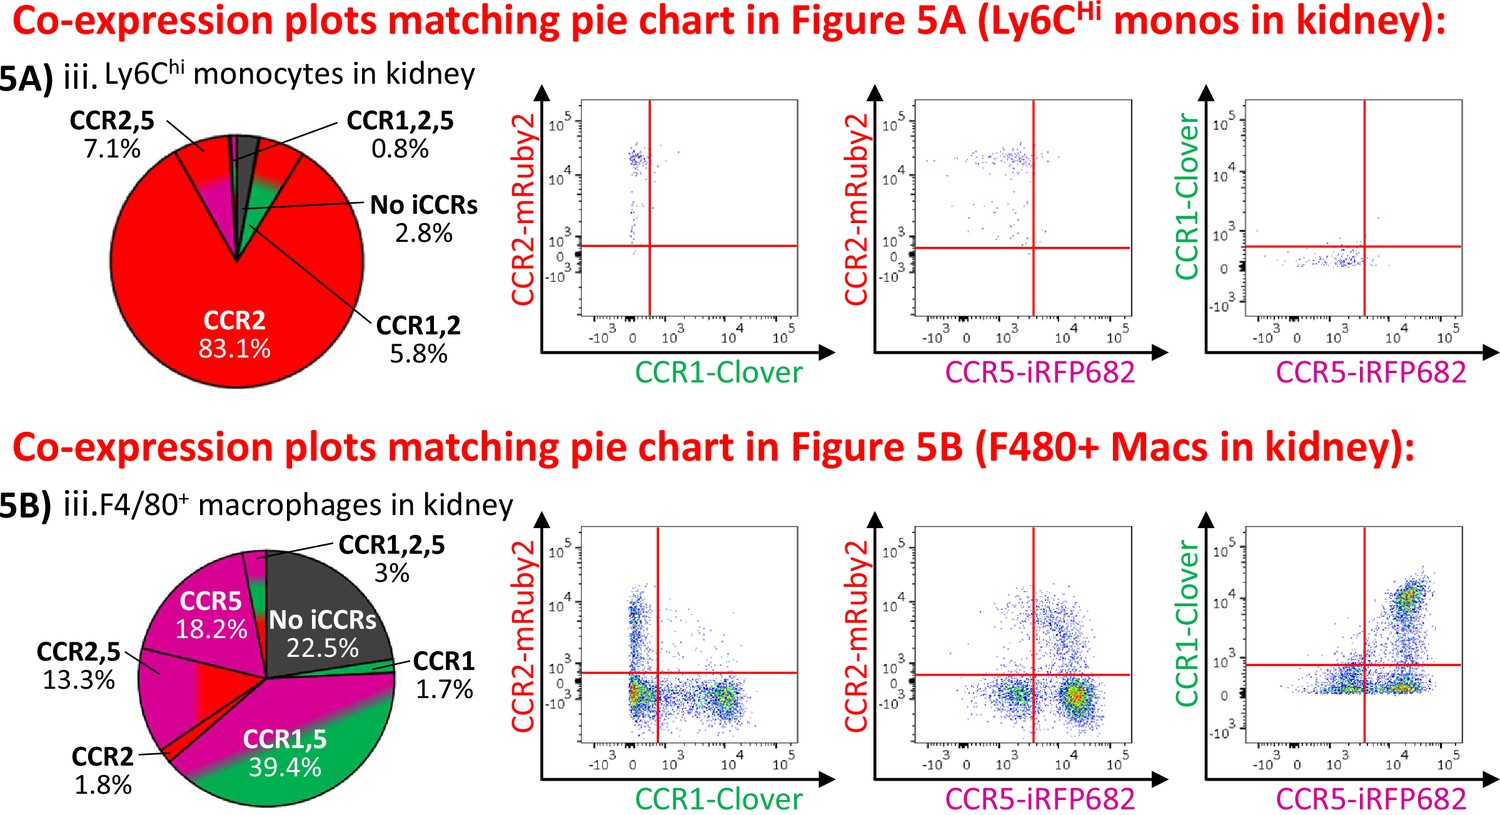
Inflammatory CC chemokine receptor (iCCR) expression in resting kidney.
(A) (i) Flow cytometric analysis of mRuby2/CCR2 expression in Ly6Chi monocytes. (ii) Quantification of the percentage of Ly6Chi monocytes expressing the iCCR reporters. (iii) Distribution of the iCCR reporters in Ly6Chi monocytes. (B) Flow cytometric analysis of (i) Clover/CCR1, (ii) mRuby2/CCR2, and (iii) iRFP682/CCR5 expression on F4/80+ macrophages. (iv) Quantification of the percentage of F4/80+ macrophages expressing the iCCR reporters. (v) Distribution of the iCCR reporters in F4/80+ macrophages. (vi) mRuby2/CCR2 mean fluorescence intensity from Ly6Chi monocytes and F4/80+ macrophages. (vii) Kidney leukocytes expressing CCR1 exclusively (white arrow), CCR5 exclusively (yellow arrow) or CCR1 and CCR5 (green arrow). Data in A–B are compiled from at least two separate experiments. Data on Cii, Civ, and Cvi are shown as mean ± SEM (N=7). Each data point represents a measurement from a single mouse. Blots in Ai, Bi, Bii, and Biii are combinatorial blots showing reporter expression in iCCR-REP and wild type (WT) (control for background autofluorescence) mice. Data on Bvi were analysed using unpaired t-test with Welch’s correction. **p<0.01. See also Figure 5—figure supplement 1 and Figure 5—figure supplement 2.
Figure 5—figure supplement 1
Reporter co-expression in resting tissues.
Figure 5—figure supplement 2
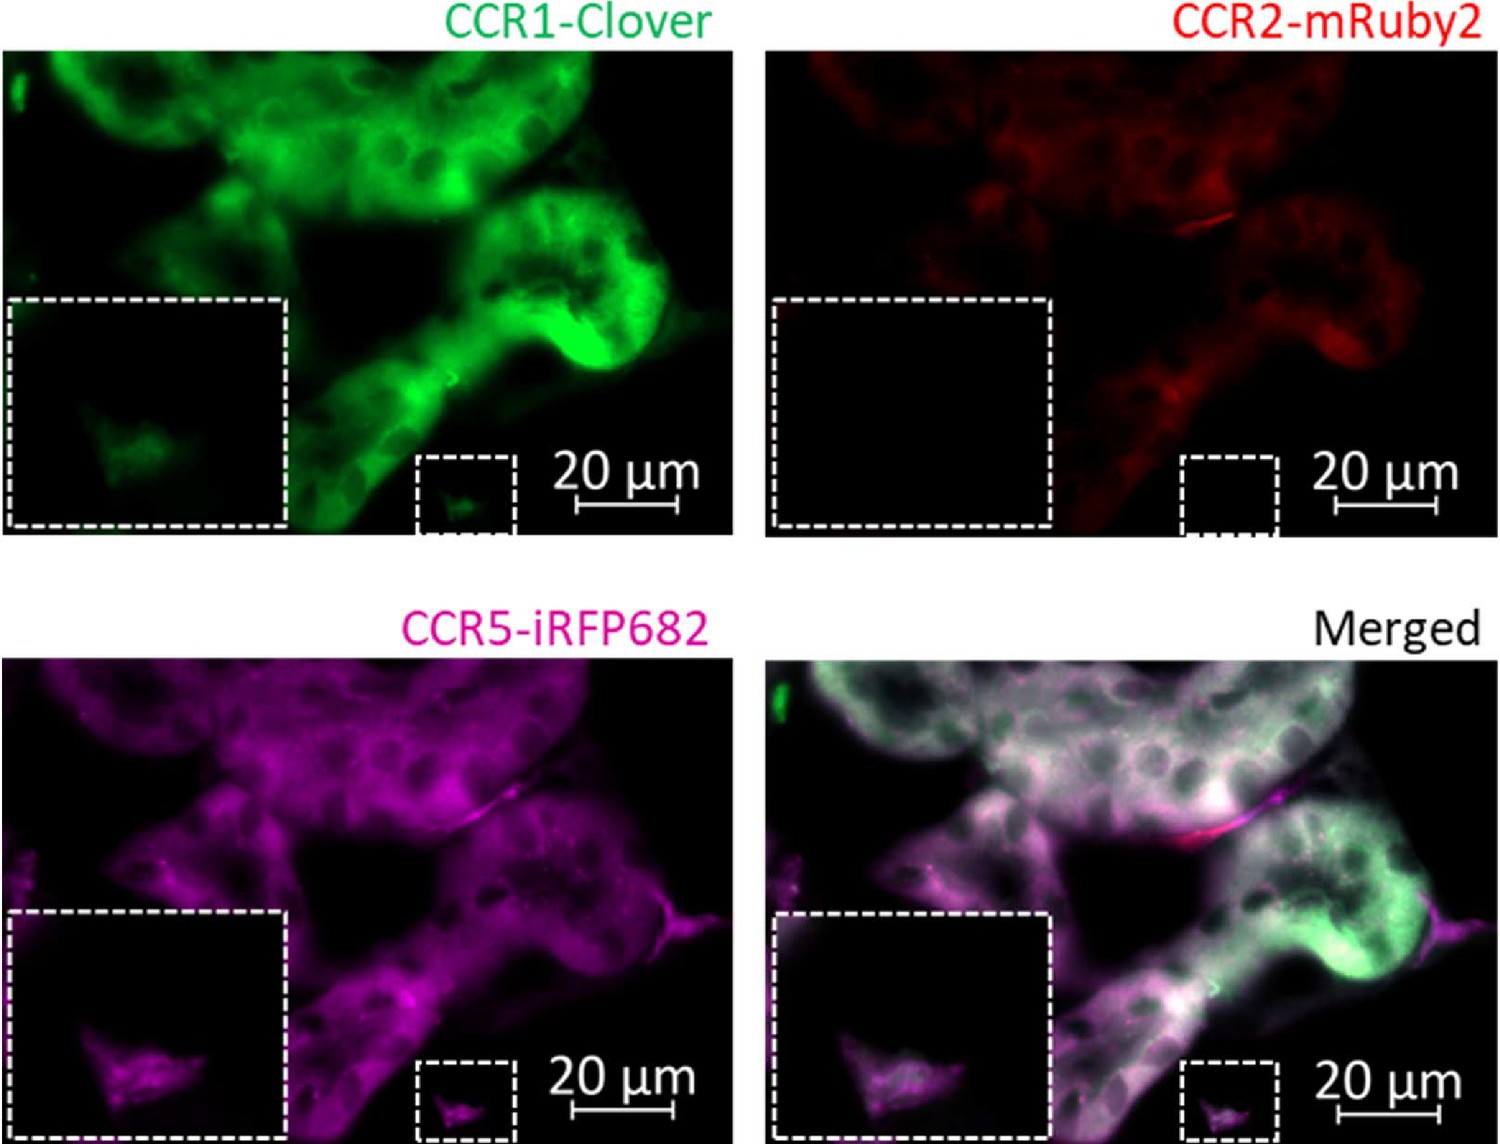
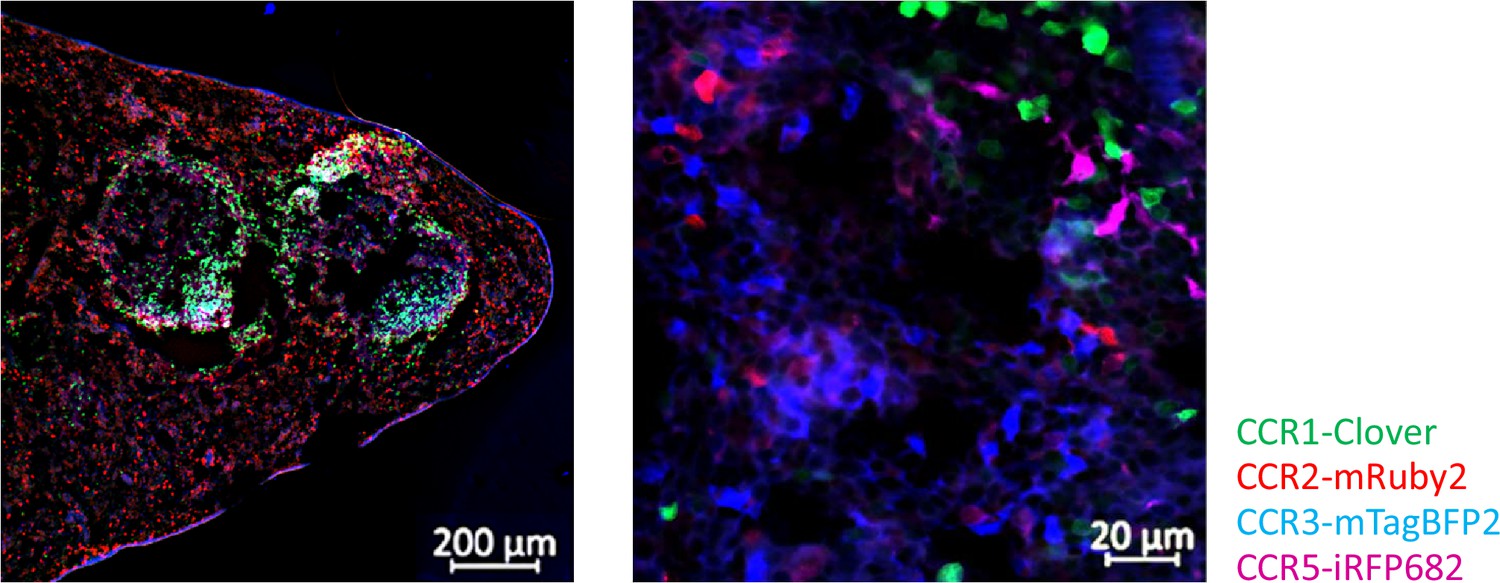
Inflammatory CC chemokine receptor (iCCR) reporters visualised in resting kidney.
Kidneys from resting mice were isolated and imaged using an AxioImager M2 microscope (Zeiss). Inlet shows a myeloid cell co-expressing Clover/CCR1 and iRFP682/CCR5.
Figure 6
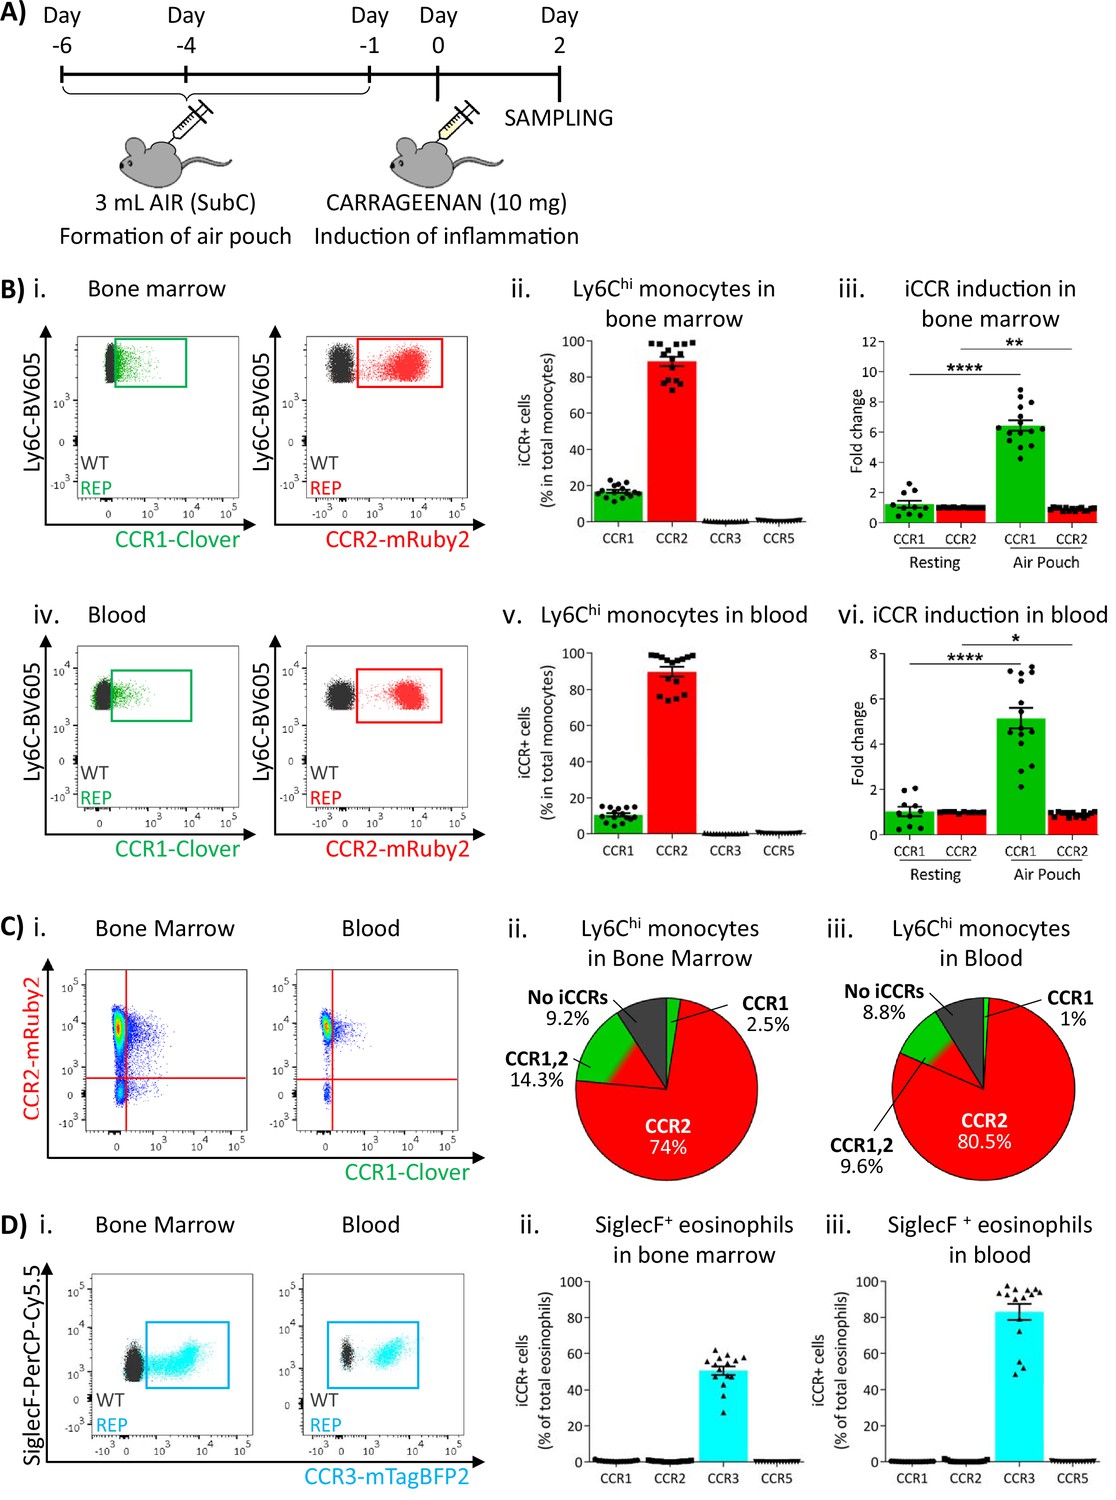
Inflammatory CC chemokine receptor (iCCR) expression in acutely inflamed bone marrow and blood leukocytes.
(A) Schematic of the procedure used to induce acute inflammation using the air-pouch model. (B) Flow cytometric analysis of Clover/CCR1 and mRuby2/CCR2 expression in (i) bone marrow and (iv) circulating Ly6Chi monocytes. Quantification of the percentage of (ii) bone marrow and (v) circulating Ly6Chi monocytes expressing the iCCR reporters. Quantification of the fold change increase in CCR1 and CCR2 expression by (iii) bone marrow and (vi) circulating Ly6Chi monocytes after induction of inflammation. (C) (i) Flow cytometric analysis and distribution of Clover/CCR1 and mRuby2/CCR2 in (ii) bone marrow and (iii) circulating Ly6Chi monocytes in the air-pouch model. (D) (i) Flow cytometric analysis of mTagBFP2/CCR3 expression in bone marrow and circulating SiglecF+ eosinophils. Quantification of the percentage of SiglecF+ eosinophils expressing the iCCR reporters in (ii) bone marrow and (iii) blood. Data on Bii, Biii, Bv, Bvi, Dii, and Diii are shown as mean ± SEM (N=10 for resting mice or N=15 for carrageenan-treated mice) and are compiled from at least three separate experiments. Each data point represents a measurement from a single mouse. Blots in Bi, Biv, and Di are combinatorial blots showing reporter expression in iCCR-REP and wild type (WT) (control for background autofluorescence) mice. Normally distributed data on Biii and Bvi were analysed using unpaired t-test with or without Welch’s correction, according to their standard deviations. Not normally distributed data were analysed using Mann-Whitney or Kolmogorov-Smirnov, according to the standard deviations. *p<0.05; **p<0.01; ****p<0.0001.
Figure 7
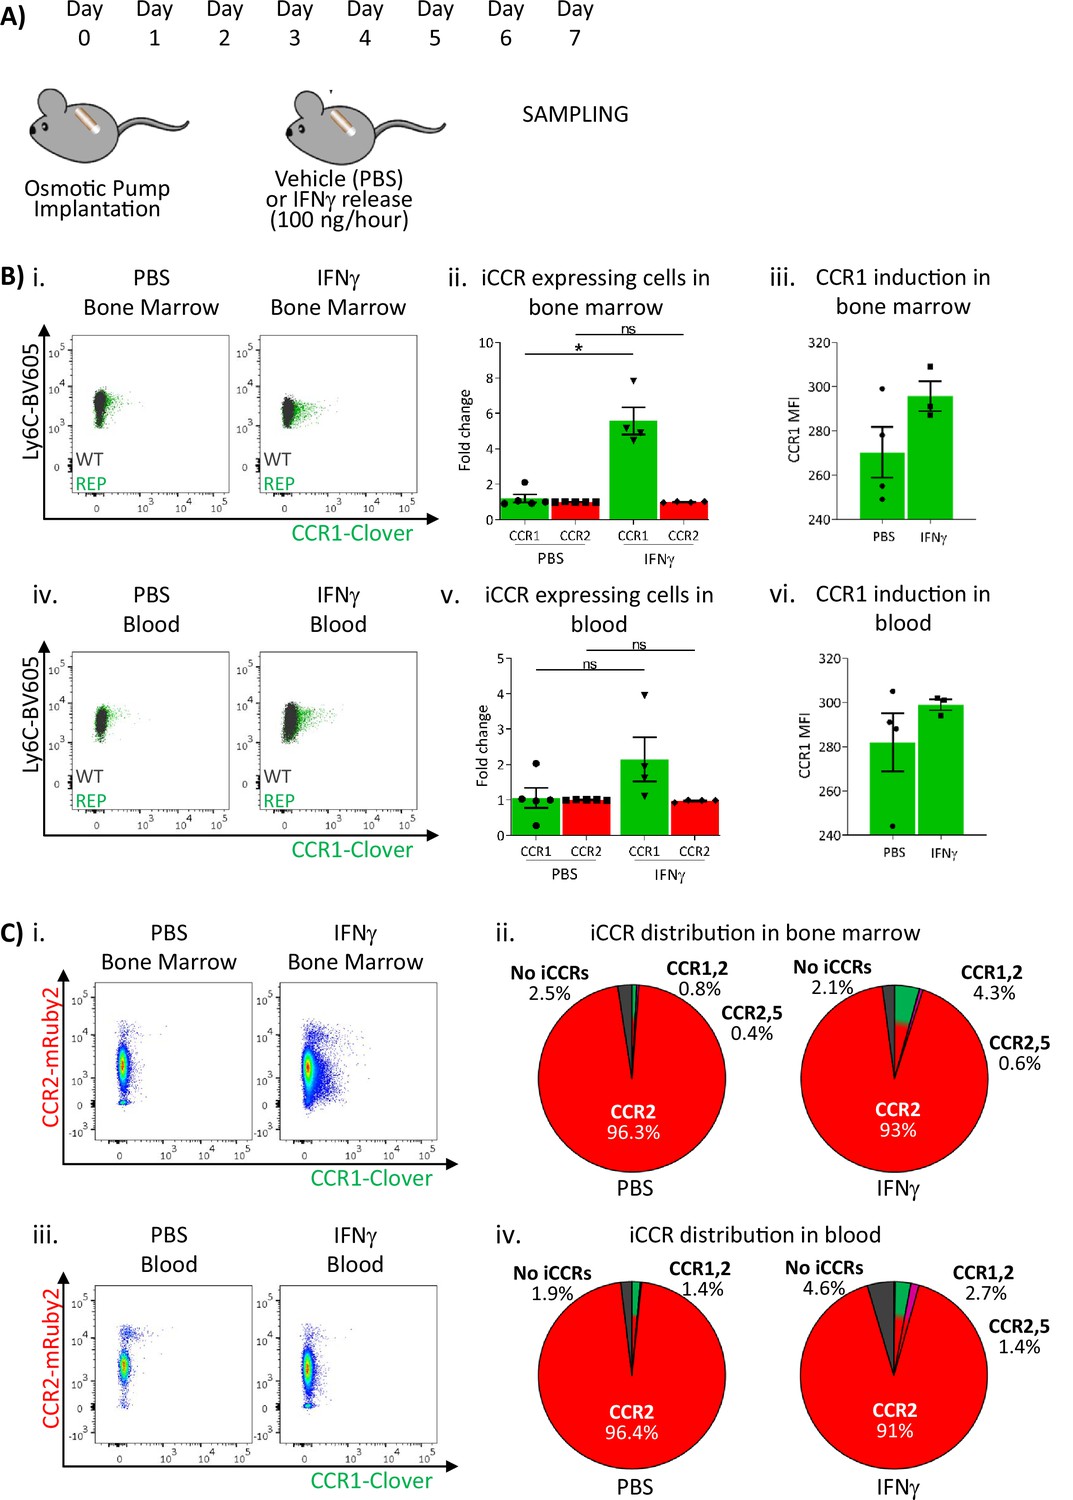
Inflammatory CC chemokine receptor (iCCR) expression in bone marrow and blood under sustained inflammation.
(A) Schematic of the procedure used to induce sustained inflammation using interferon gamma (IFNγ) release from osmotic pumps. (B) Flow cytometric analysis of Clover/CCR1 expression in (i) bone marrow and (iv) circulating Ly6Chi monocytes. Quantification of the fold change increase in CCR1+ and CCR2+ cells in (ii) bone marrow and (v) circulating Ly6Chi monocytes after the induction of sustained inflammation. Mean fluorescence intensity of Clover/CCR1 expression in (iii) bone marrow and (vi) circulating CCR1+ Ly6 Chi monocytes. (C) Flow cytometric analysis and distribution of Clover/CCR1 and mRuby2/CCR2 in (i and ii) bone marrow and (iii and iv) circulating Ly6Chi monocytes. Data on B–C are compiled from at least two separate experiments. Data on Bii, Biii, Bv, and Bvi are shown as mean ± SEM (N=3-5). Each data point represents a measurement from a single mouse. Plots in Bi and Biv are combinatorial plots showing reporter expression in iCCR REP and wild type (WT) (control for background autofluorescence) mice. Normally distributed data were analysed using unpaired t-test with or without Welch’s correction, according to their standard deviations. Not normally distributed data were analysed using Mann-Whitney or Kolmogorov-Smirnov, according to the standard deviations. *p<0.05; ns, not significant.
Figure 8 with 2 supplements
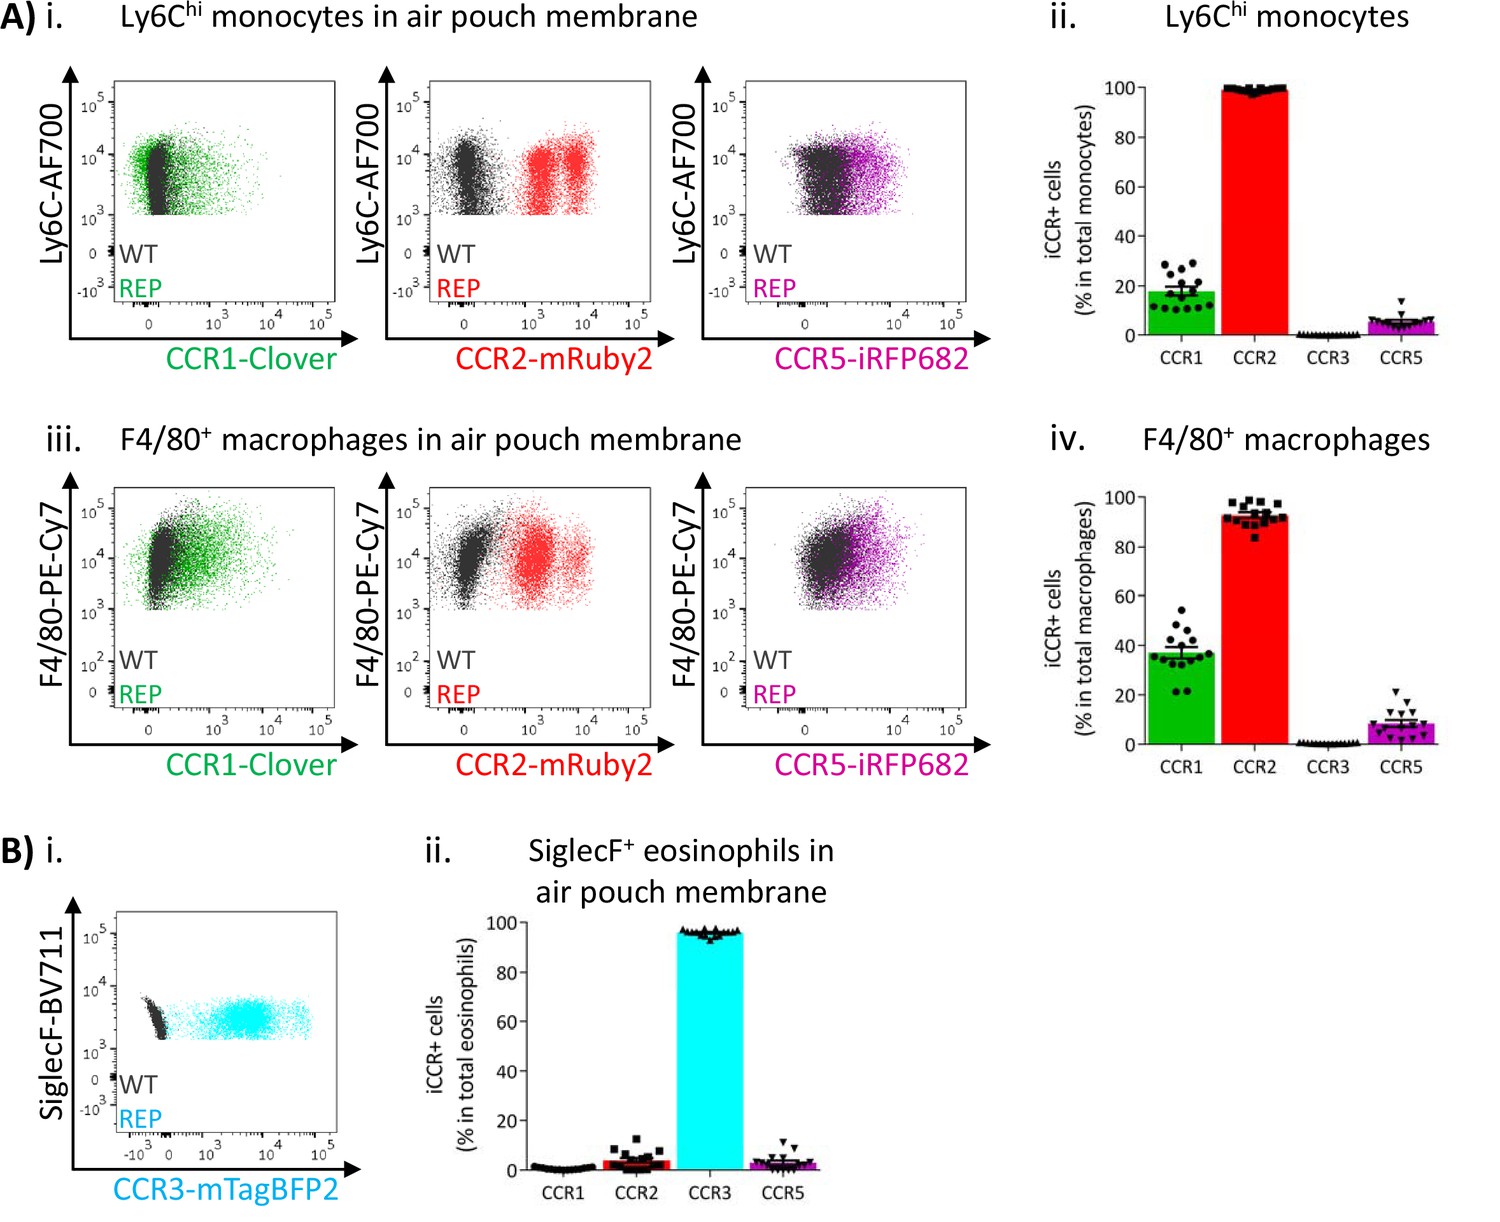
Inflammatory CC chemokine receptor (iCCR) expression in inflamed tissues: the air-pouch model.
(A) Flow cytometric analysis of Clover/CCR1, mRuby2/CCR2, and iRFP682/CCR5 expression in (i) Ly6Chi monocytes and (iii) F4/80+ macrophages isolated from the inflamed air-pouch. Quantification of iCCR reporter expression in (ii) Ly6Chi monocytes and (iv) F4/80+ macrophages. (B) (i) Flow cytometric analysis of mTagBFP2/CCR3 expression in SiglecF+ eosinophils isolated from the inflamed air-pouch. (ii) Quantification of iCCR reporter expression in SiglecF+ eosinophils. Data on Aii, Aiv, and Bii are shown as mean ± SEM (N=15) and are compiled from at least three separate experiments. Each data point represents a measurement from a single mouse. Blots in Ai, Aiii, and Bi are combinatorial blots showing reporter expression in iCCR-REP and wild type (WT) (control for background autofluorescence) mice.
Figure 8—figure supplement 1

Reporter co-expression in inflamed air-pouch.
Figure 8—figure supplement 2
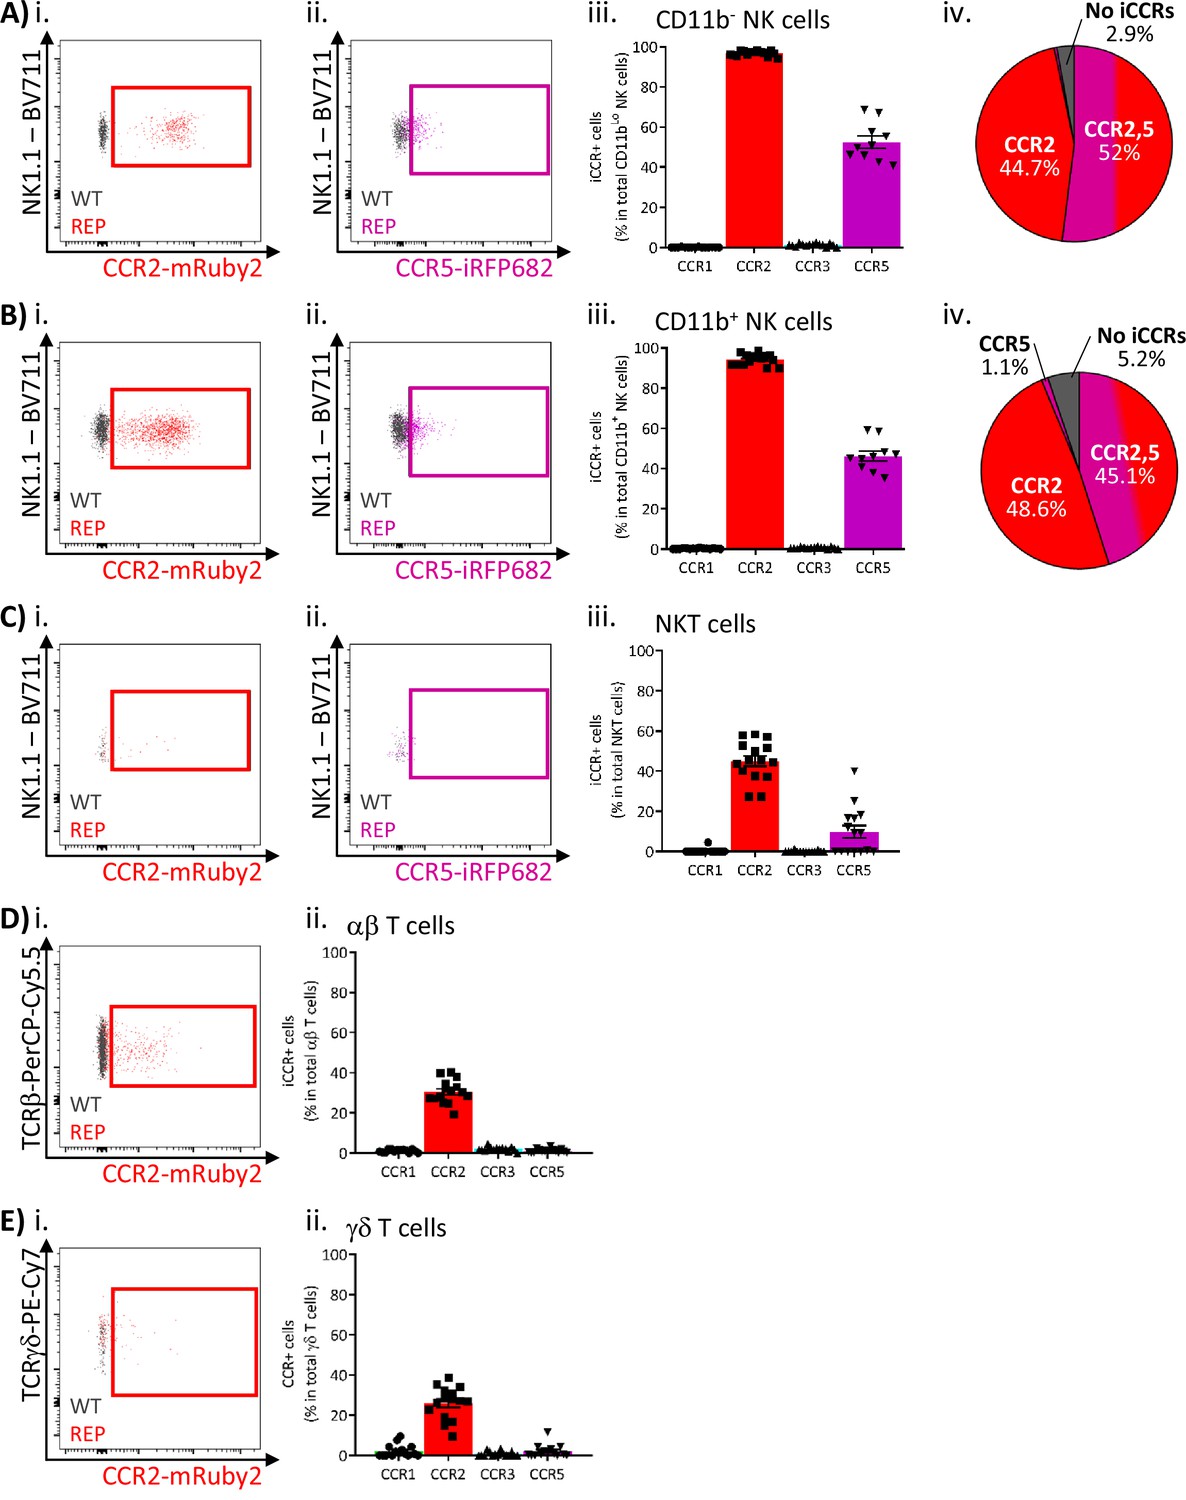
Inflammatory CC chemokine receptor (iCCR) expression in inflamed air-pouch: lymphoid cells.
(A) Flow cytometric analysis of (i) mRuby2/CCR2 and (ii) iRFP682/CCR5 expression in CD11b- NK cells. (iii) Quantification of the percentage of CD11b- NK cells expressing the iCCR reporters. (iv) Distribution of the iCCR reporters in CD11b- NK cells. (B) Flow cytometric analysis of (i) mRuby2/CCR2 and (ii) iRFP682/CCR5 expression in CD11b+ NK cells. (iii) Quantification of the percentage of CD11b+ NK cells expressing the iCCR reporters. (iv) Distribution of the iCCR reporters in CD11b+ NK cells. (C) Flow cytometric analysis of (i) mRuby2/CCR2 and (ii) iRFP682/CCR5 expression in NKT cells. (iii) Quantification of the percentage of NKT cells expressing the iCCR reporters. (D) Flow cytometric analysis of (i) mRuby2/CCR2 in ab T cells. (iii) Quantification of the percentage of ab T cells expressing the iCCR reporters. (E) Flow cytometric analysis of (i) mRuby2/CCR2 in gd T cells. (iii) Quantification of the percentage of gd T cells expressing the iCCR reporters. Data in A–E are compiled from at least three separate experiments. Data on Aiii, Biii, Ciii, Dii, and Eii are shown as mean ± SEM (N=10-15). Each data point represents a measurement from a single mouse. Plots in Ai, Aii, Bi, Bii, Ci, Cii, Di, and Ei are combinatorial plots showing reporter expression in iCCR-REP and wild type (WT) (control for background autofluorescence) mice.
Figure 9 with 2 supplements
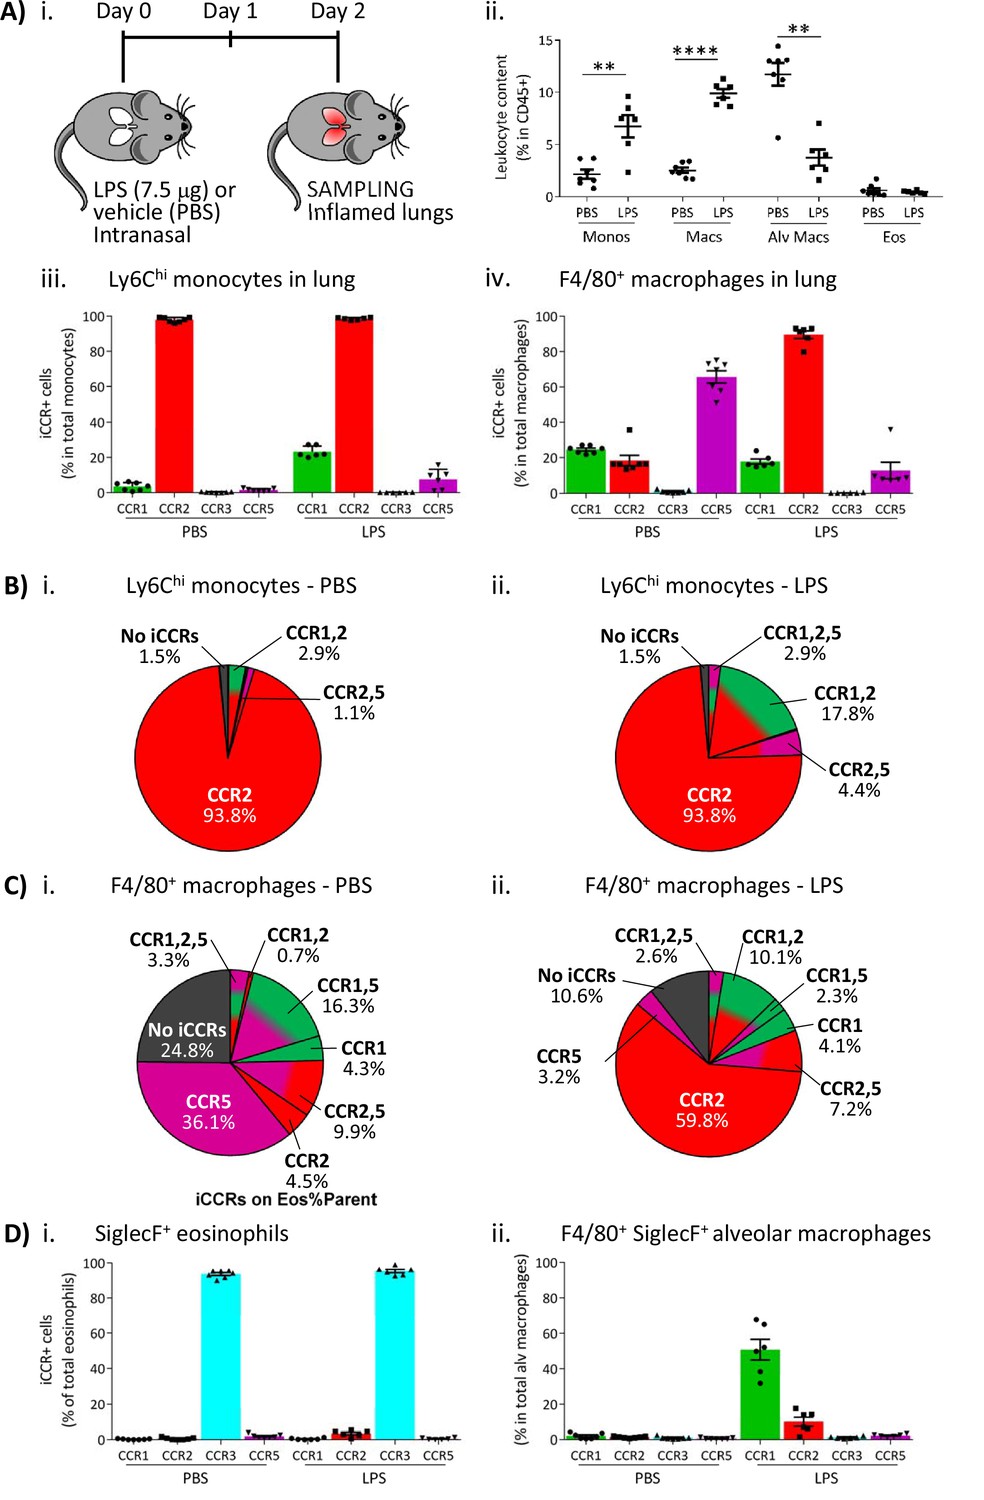
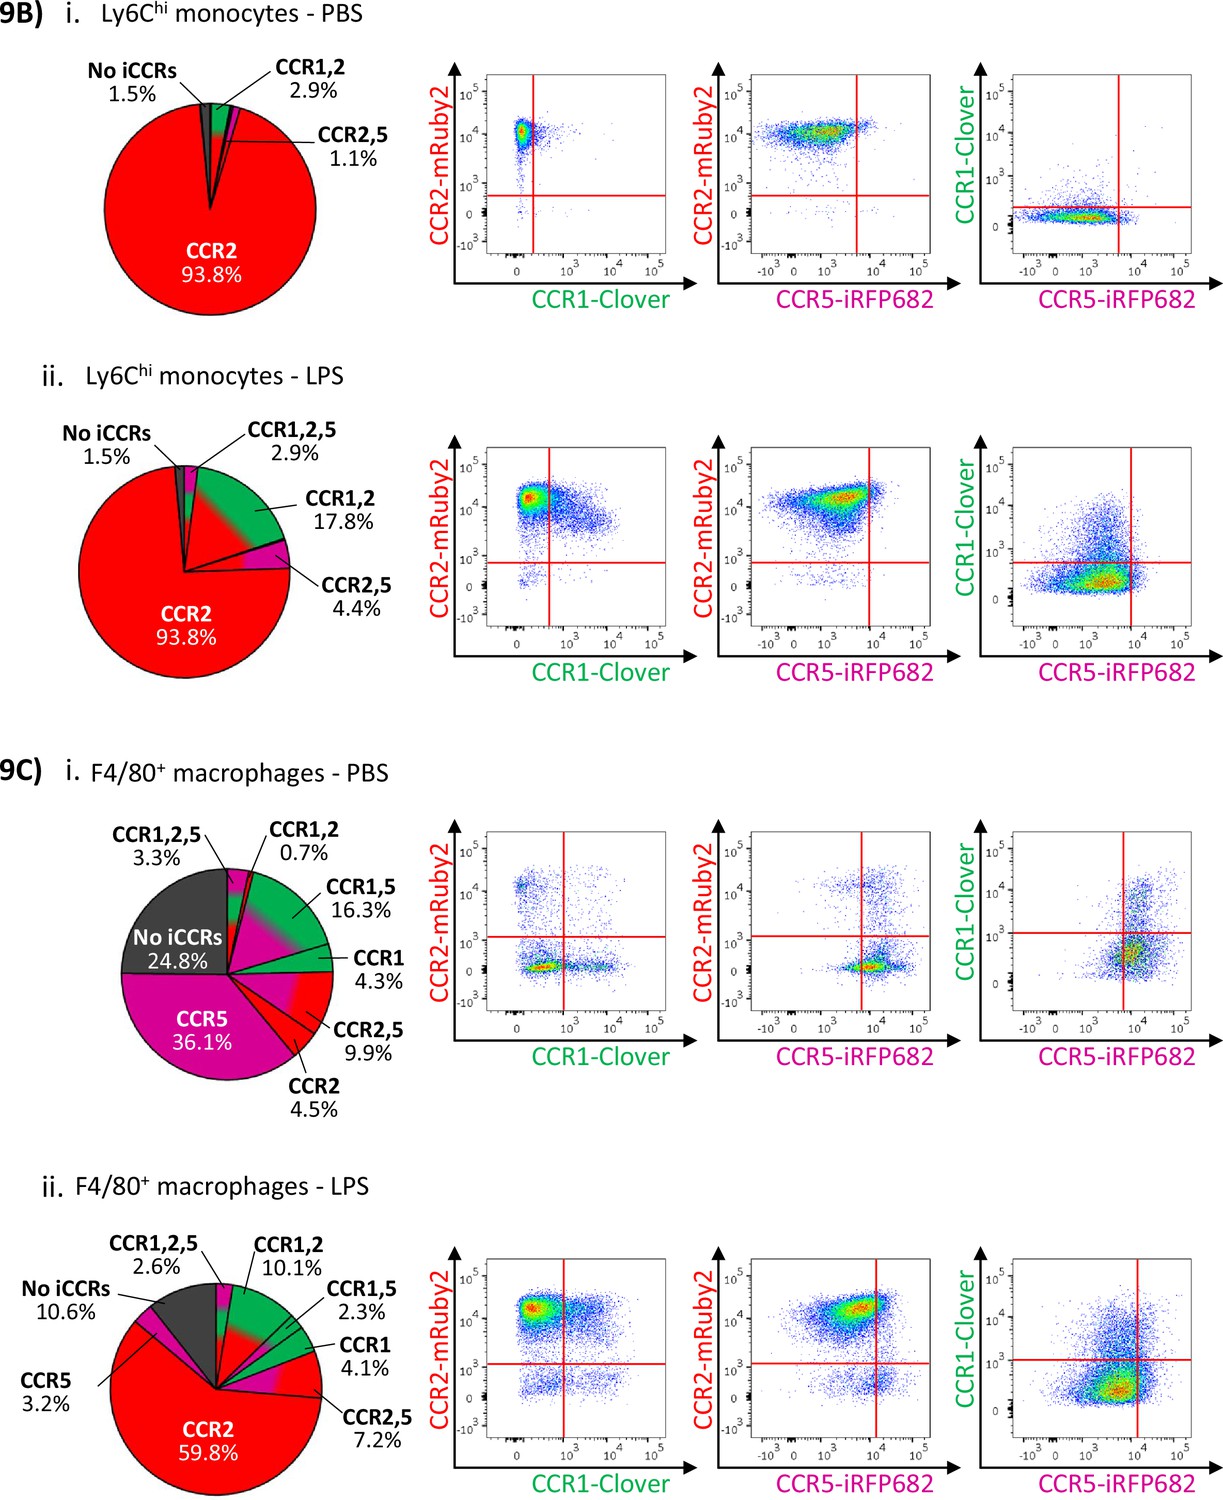
Inflammatory CC chemokine receptor (iCCR) expression in inflamed tissues: the intranasal lipopolysaccharide (LPS) model.
(A) (i) Schematic of the procedure used to induce acute lung inflammation using intranasal administration of LPS. (ii) Quantification of monocyte, macrophage, alveolar macrophage, and eosinophil levels in inflamed lungs. Quantification of iCCR reporter expression in (iii) Ly6Chi monocytes and (iv) F4/80+ macrophages isolated from lungs of vehicle (PBS) and LPS-treated mice. (B) Distribution of Clover/CCR1, mRuby2/CCR2, and iRFP682/CCR5 on Ly6Chi monocytes isolated from lungs of (i) vehicle (PBS) and (ii) LPS-treated mice. (C) Distribution of Clover/CCR1, mRuby2/CCR2, and iRFP682/CCR5 on F4/80+ macrophages isolated from lungs of (i) vehicle (PBS) and (ii) LPS-treated mice. (D) Quantification of iCCR reporter expression on (i) SiglecF+ eosinophils and (ii) SiglecF+ F4/80+ alveolar macrophages isolated from lungs of vehicle and LPS-treated mice. Data in A–D are compiled from at least two separate experiments. Data on Aii, Aiii, Aiv, Di, and Dii are shown as mean ± SEM (N=7 for vehicle-treated mice or N=6 for LPS-treated mice). Each data point represents a measurement from a single mouse. Data on Aii were analysed using unpaired t-test, with the exception of alveolar macrophage, which was analysed using Mann-Whitney test. **p<0.01; ****p<0.0001. Abbreviations are: Monos, monocytes; Macs, macrophages; Alv Macs, alveolar macrophages; Eos, eosinophils.
Figure 9—figure supplement 1
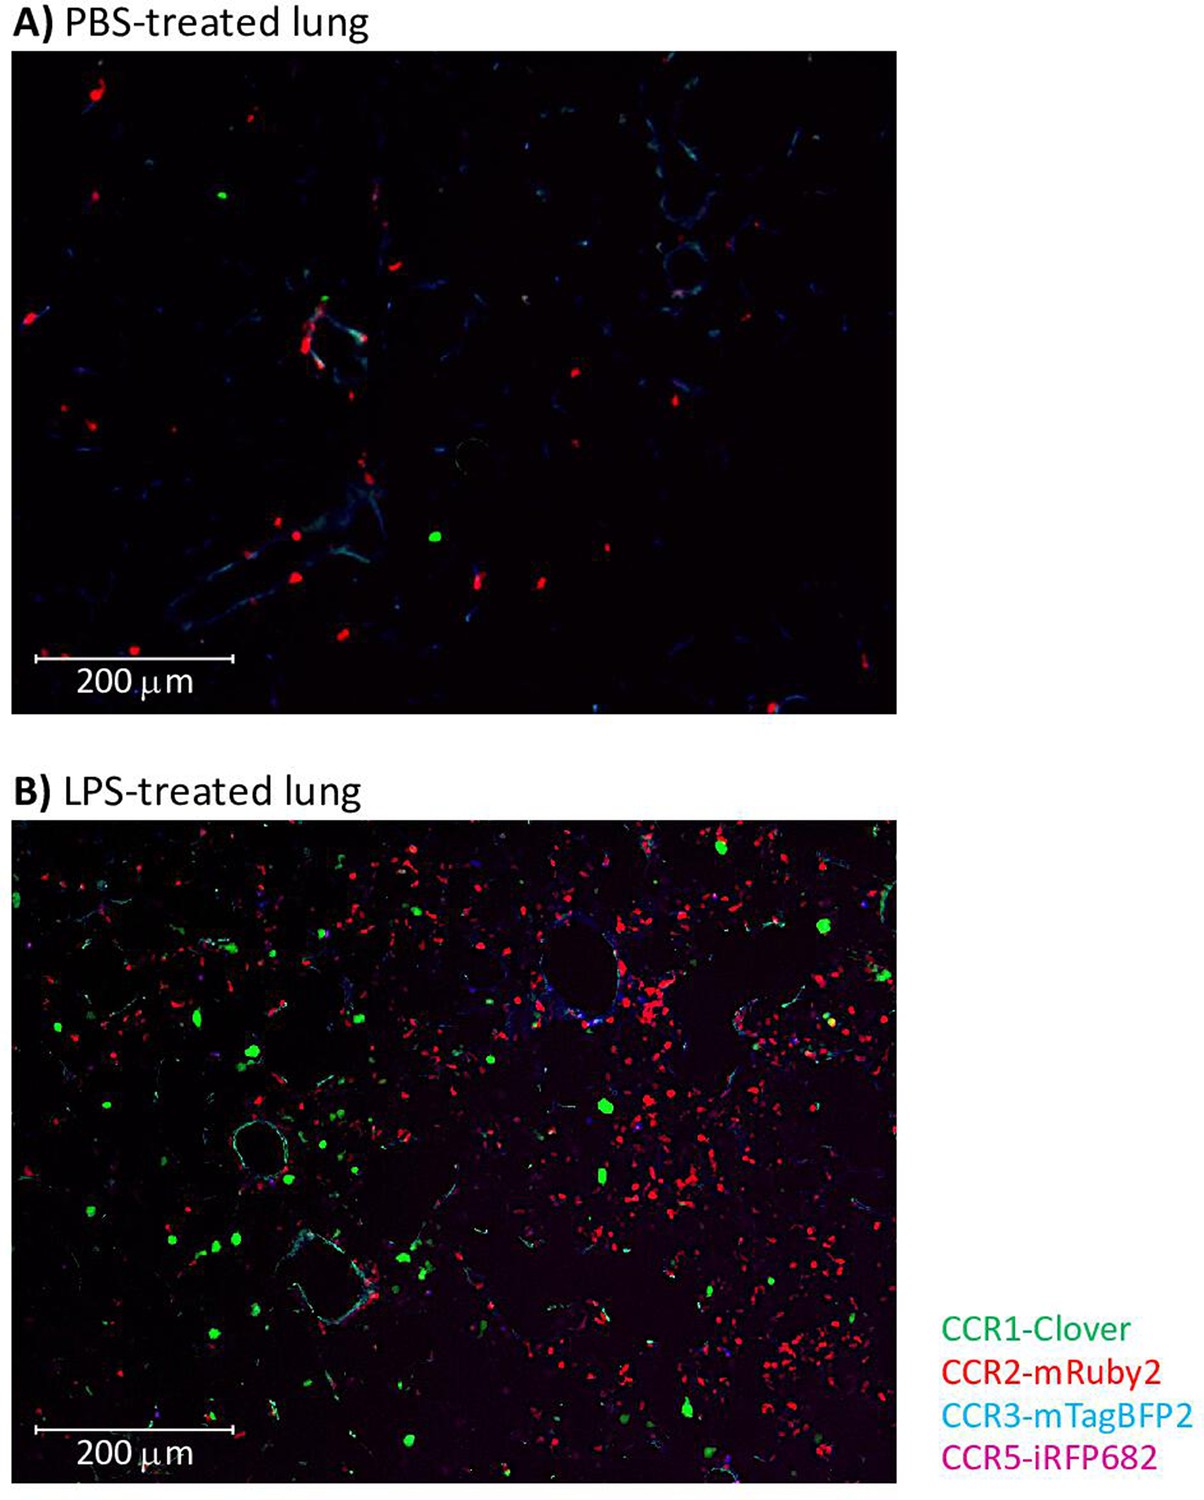
Inflammatory CC chemokine receptor (iCCR) reporters visualised in resting and inflamed lungs.
Lungs from PBS- (A) or LPS- (B) treated mice were isolated and imaged using an AxioImager M2 microscope (Zeiss).
Figure 9—figure supplement 2
Reporter co-expression in inflamed lung.
Figure 10
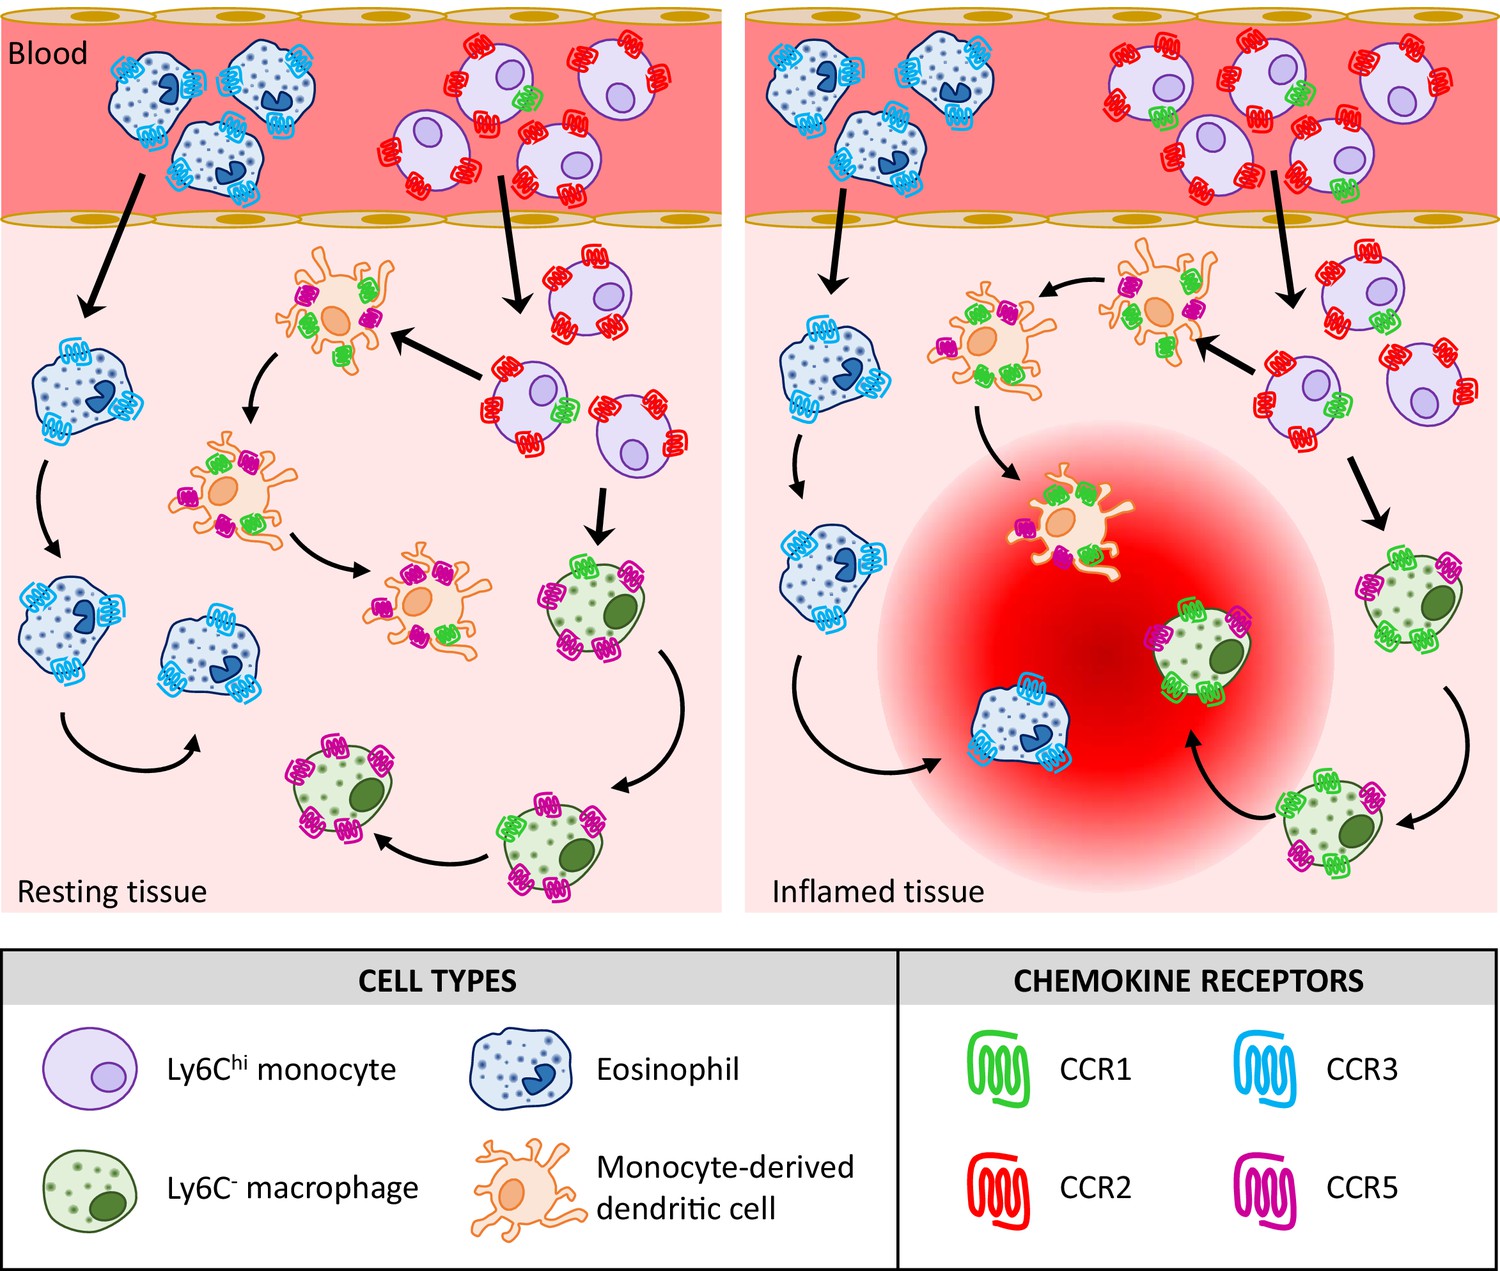
Proposed model for the contribution of the inflammatory CC chemokine receptors (iCCRs) to leukocyte migration.
Videos
Video 1
Real-time in vivo imaging of iCCR reporters in resting mammary gland.
Tables
Table 1
Primers used in the study.
| A. Detection of the iCCR reporters | |
|---|---|
| iRFP682 QPCR1 | GTCACCCCAGACCTCAATCC |
| iRFP682 QPCR2 | AACGATCAATCCCCACAGTC |
| mRuby2 RT F | TGGGAAAGAGTTACGAGATACGA |
| mRuby2 RT R | AACGAGACAGCCATCCTCAA |
| Clover QPCR1 | AACGGCATCAAGGCTAACTTC |
| Clover QPCR2 | GGGTGTTCTGCTGGTAGTGG |
| mTagBFP2 QPCR1 | ACCGTGGACAACCATCACTT |
| mTagBFP2 QPCR2 | CCTCGACCACCTTGATTCTC |
| B. Quantification of iCCR-REP cluster insertion | |
| CCR1prom QPCR1 | TCAACTCAACTCCATCCAACC |
| CCR1prom QPCR2 | CTGTCTTTCCTCTCTGCTCCA |
| BAC-CPN1 Stan1 | CAGCTAGCCCCCAGGTGACA |
| BAC-CPN1 Stan2 | AGTCTTTCTTTCCTGCGTTGTATG |
| BAC-CPN1 QPCR1 | GATAAAGGGAAGCAGACACCAG |
| BAC-CPN1 QPCR2 | CAGCAGGGAGGAAAGAAGAGT |
| BAC-CPN2 Stan1 | AGTCTTTCTTTCCTGCGTTGTATG |
| BAC-CPN2 Stan2 | AAAACCAGACAGGATAGATAACTG |
| BAC-CPN2 QPCR1 | AGGGGTGGAAGCCTATCTCTAC |
| BAC-CPN2 QPCR2 | TGGCAGCATTTACAGGGTCT |
| BAC-CPN3 Stan1 | GGATGGGAGGGAATTTGGAGAAGA |
| BAC-CPN3 Stan2 | GCTTTGTGAAGGCCGAGGTCTAA |
| BAC-CPN3 QPCR1 | CCCCATCCATAACACAAACC |
| BAC-CPN3 QPCR2 | CAAAATGAGCACCTCCCTTC |
| CCR2exon Stan1 | AGGGAGAGCAGAAGGCTAA |
| CCR2exon Stan2 | CCCAGGAAGAGGTTGAGAGA |
| CCR2exon QPCR1 | TGTGGGACAGAGGAAGTGG |
| CCR2exon QPCR2 | GGAGGCAGAAAATAGCAGCA |
| CCR5exon Stan1 | ACCCATTGAGGAAACAGCAA |
| CCR5exon Stan2 | CTTCTGAGGGGCACAACAAC |
| CCR5exon QPCR1 | TTTGTTCCTGCCTTCAGACC |
| CCR5exon QPCR2 | TTGGTGCTCTTTCCTCATCTC |
| TBP Stan1 | GAGTTGCTTGCTCTGTGCTG |
| TBP Stan2 | ATACTGGGAAGGCGGAATGT |
| TBP QPCR1 | TGCTGTTGGTGATTGTTGGT |
| TBP QPCR2 | AACTGGCTTGTGTGGGAAAG |
Table 2
Antibodies used in the study.
| Antibody | Clone | Source | Working dilution |
|---|---|---|---|
| Anti-mouse CD45 | 30-F11 | eBioscience | 1/100 |
| Anti-mouse CD11b | M1/70 | eBioscience | 1/100 |
| Anti-mouse SiglecF | E50-2440 | BD Bioscience | 1/100 |
| Anti-mouse F4/80 | BM8 | eBioscience | 1/100 |
| Anti-mouse CD64 | X54-5/7.1 | BD Bioscience | 1/100 |
| Anti-mouse Ly6C | HK1.4 | BioLegend | 1/100 |
| Anti-mouse CD11c | HL3 | BD Bioscience | 1/100 |
| Anti-mouse MHCII | M5/114.15.2 | BioLegend | 1/100 |
| Anti-mouse Ly6G | 1A8 | BD Bioscience | 1/100 |
| Anti-mouse CD19 | eBio1D3 (1D3) | eBioscience | 1/100 |
| Anti-mouse CCR2 | SA203G11 | BioLegend | 1/50 |
| Anti-mouse CCR3 | J073E5 | BioLegend | 1/50 |
| Anti-mouse CCR5 | HM-CCR5 (7A4) | eBioscience | 1/50 |
Additional files
Download links
A two-part list of links to download the article, or parts of the article, in various formats.
Downloads (link to download the article as PDF)
Open citations (links to open the citations from this article in various online reference manager services)
Cite this article (links to download the citations from this article in formats compatible with various reference manager tools)
Analysis of combinatorial chemokine receptor expression dynamics using multi-receptor reporter mice
eLife 11:e72418.
https://doi.org/10.7554/eLife.72418


