Intracerebral mechanisms explaining the impact of incidental feedback on mood state and risky choice
- Grenoble Institut Neurosciences, University Grenoble Alpes, France
- Motivation, Brain and Behavior (MBB) Team, Paris Brain Institute, Pitié-Salpêtrière Hospital, France
- Université de Paris, France
- Department of Psychiatry, Service Hospitalo-Universitaire, GHU Paris Psychiatrie & Neurosciences, France
- Neurology Department, 2nd Faculty of Medicine, Charles University, Motol University Hospital, Czech Republic
- Neurology Department, University Hospital of Rennes, France
- Epileptology Department, Timone Hospital, Public Assistance Hospitals of Marseille, France
- Functional Neurology and Epileptology Department, Hospices Civils de Lyon and Université de Lyon, France
- Centre de recherche Cerveau et Cognition, France
- Neurology Department, CHU Toulouse, France
- Neurology Department, University Hospital of Nancy, France
- Neurology Department, University Hospital of Grenoble, France
Figures
Figure 1 with 1 supplement
Behavioral task and results.
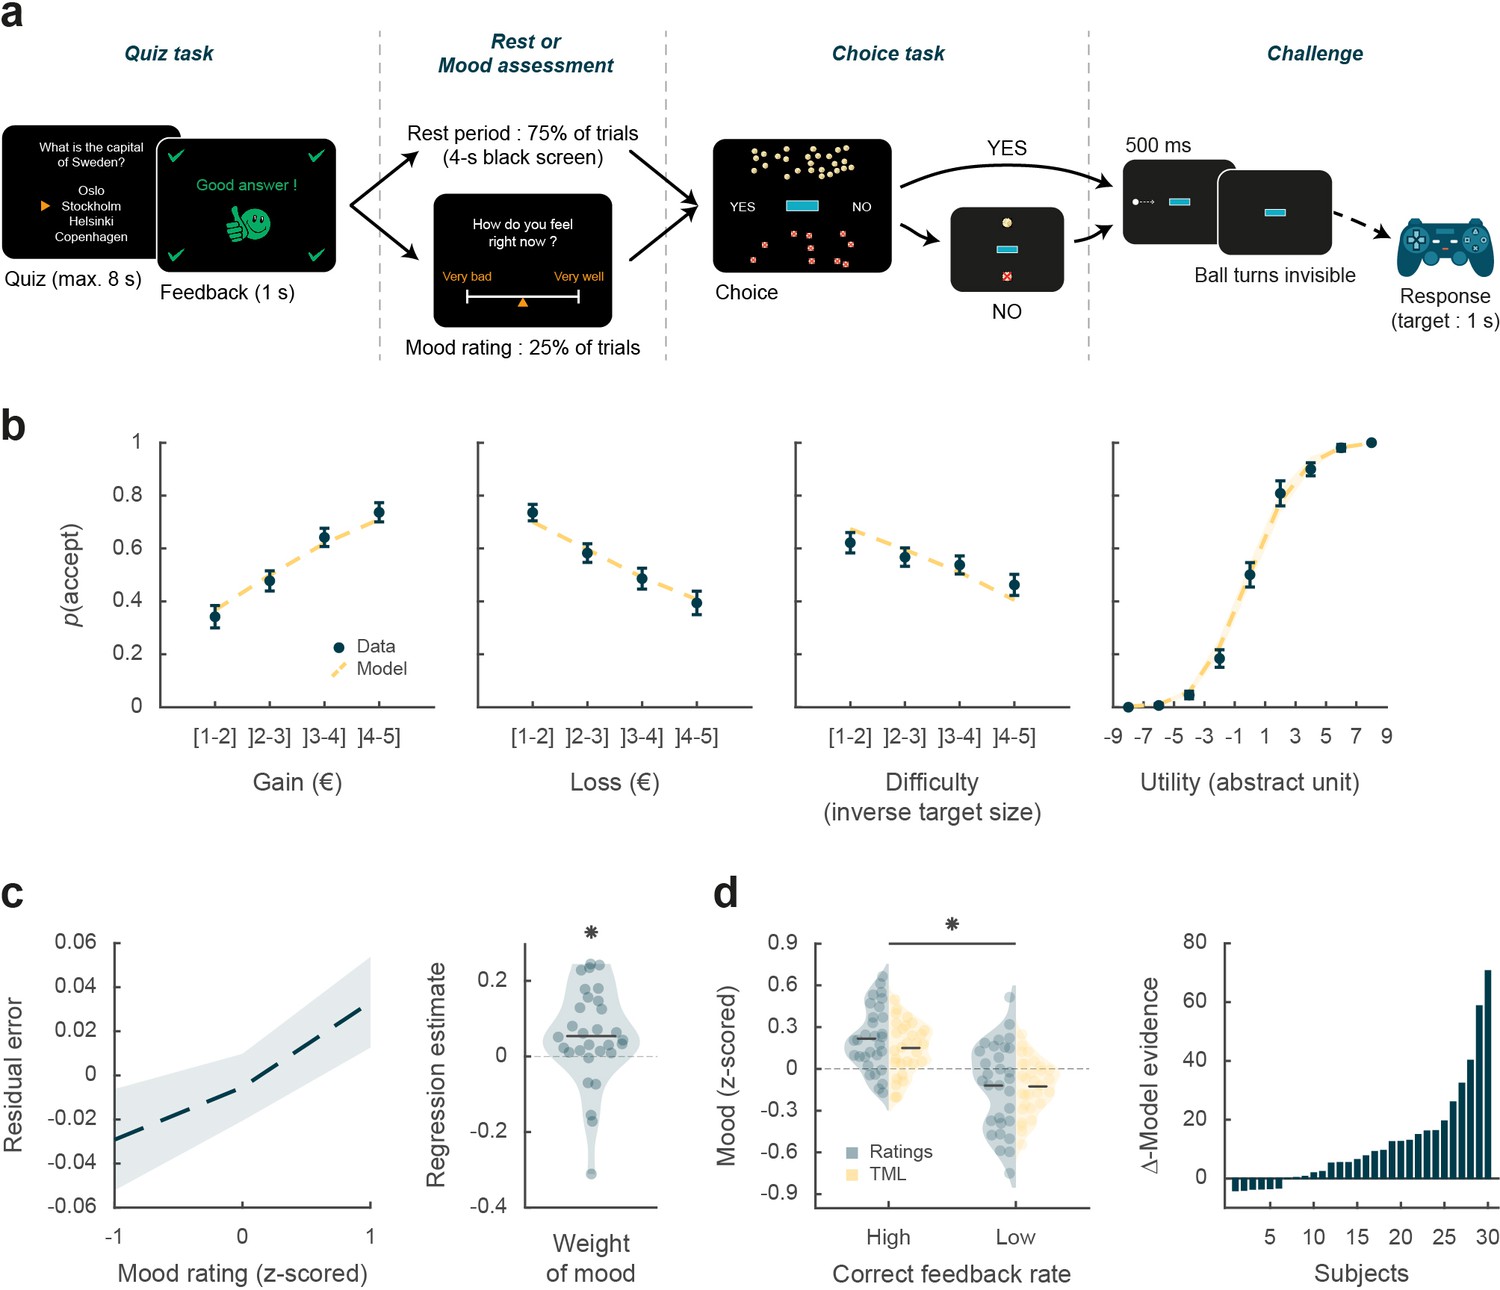
(a) Trial structure. Each trial included a quiz task, a rest or mood assessment period, and a choice task followed by a challenge. In the quiz task, subjects answered a general knowledge question and received a feedback. The quiz task was followed by a rest period (75% of trials) or a mood rating task (25% of trials) on a visual analog scale. In the choice task, subjects had to decide whether to accept or reject a given challenge by taking into account gain prospects (represented by a bunch of regular 10-cent coins), loss prospects (crossed out 10-cent coins), and difficulty (inversely proportional to the size of the blue bar in the middle of the screen). The challenge consisted in stopping a moving ball, invisible when inside the blue target. (b) Choice behavior. Acceptance probability is plotted as a function of the three objective dimensions (gain, loss, and difficulty) and modeled subjective utility of the proposed challenge. Circles are binned data averaged across subjects. Yellow dotted lines represent acceptance probability as computed by the choice model. Error bars represent inter-subject SEM (n = 30). (c) Impact of mood on the choice model residual error (actual choice – modeled acceptance probability). Left panel: residual error is plotted as a function of mood rating. Right panel: the weight of mood on residual error is shown as individual regression estimates. Circles represent individual data, and horizontal line represents mean across subjects (as in d, left panel). (d) Mood fluctuations. Left panel: effect of correct feedback rate on mood rating and theoretical mood level (TML). Right panel: difference in model evidence between TML and a null model in which feedback had no impact on mood. Bars show subjects ranked in ascending order. Stars indicate significance (p<0.05) using two-sided, one-sample (c) or paired (d), Student’s t-test.
Figure 1—figure supplement 1
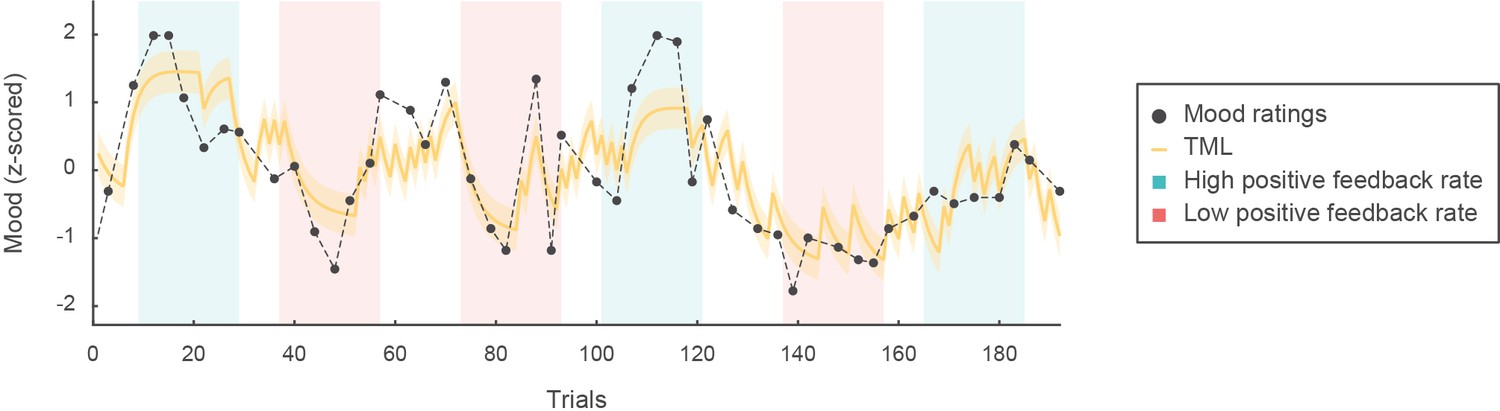
Variations in mood rating (black dots) and theoretical mood level (TML, yellow line) across all trials of an experimental session for a single subject, superimposed with episodes of high (blue) and low (red) positive feedback rates.
The rate of correct feedback was manipulated by asking more or less difficult questions in the quiz task. Note that between episodes of high and low positive feedback rates (trials in white), the difficulty of the questions was medium.
Figure 2 with 1 supplement
Intracerebral activity underpinning mood fluctuations.
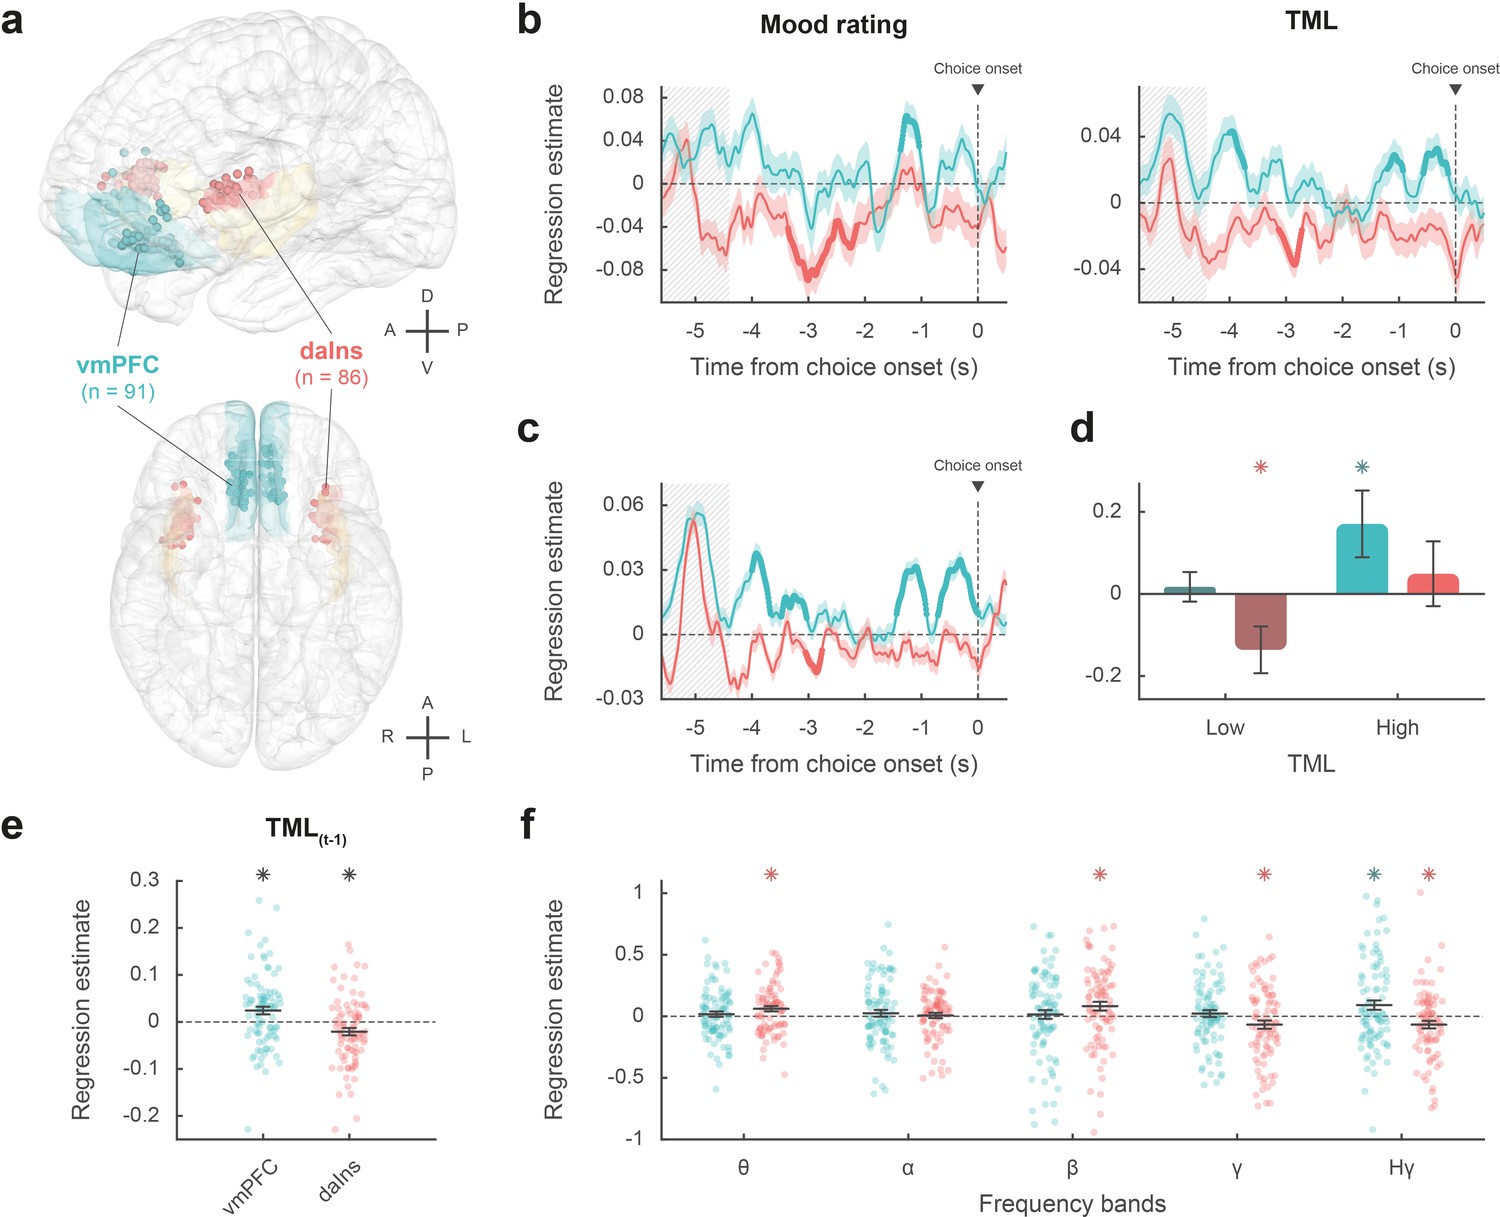
(a) Anatomical location of the ventromedial prefrontal cortex (vmPFC) (blue) and dorsal anterior insula (daIns) (red) in the standard Montreal Neurological Institute template brain, along with all recording sites located in these areas (dots) and the entire insula (in yellow). Anterior (A), posterior (P), dorsal (D), ventral (V), left (L), and right (R) directions are indicated. (b) Time course of estimates obtained from the regression of broadband gamma activity (BGA) against mood rating (left: using the 25% of trials with mood ratings) or theoretical mood level (TML) (right: using all trials – with and without ratings). (c) Time course of estimates obtained from the regression of vmPFC and daIns BGA included in a same general linear model (GLM) fitted to TML (using all trials). In panels b–c, lines indicate means and shaded areas ± SEM across recording sites. Bold lines indicate significant clusters (pcorr<0.05). Gray hatched areas indicate the time window within which the quiz feedback was provided to subjects. (d) Average estimates (within the best temporal cluster for each region of interest [ROI]) obtained from the regression of BGA against the 35% lower or higher TML. Bars are means and error bars are SEM across recording sites (vmPFC: n = 91; daIns: n = 86). (e) Average estimates (over the baseline window: –4 to 0 s before choice onset) obtained from the regression of BGA against TML after excluding the last feedback. Dots represent individual regression estimates for each recording site and horizontal lines and error bars respectively represent mean and SEM across sites within each ROI. (f) Association between TML and activity in frequency bands. For each frequency band, power time series were averaged over the baseline window and entered in a regression model meant to explain TML. θ: 4–8 Hz; α: 8–13 Hz; β: 13–33 Hz; γ: 33–49 Hz; Hγ: 50–150 Hz. In panels d–f, stars indicate significance (p<0.05) of regression estimates (two-sided, one-sample, Student’s t-test).
Figure 2—figure supplement 1
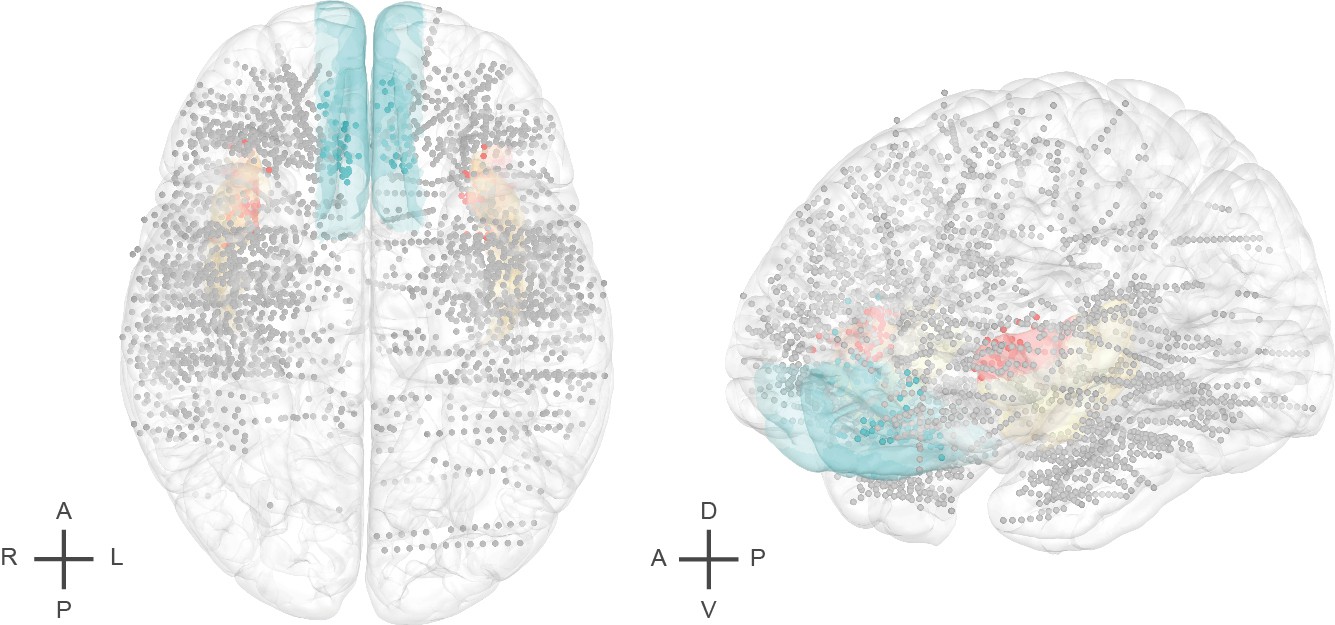
Anatomical location of all recording sites (n=3188 sites acquired from 30 epileptic patients) in the standard Montreal Neurological Institute template brain.
Colored brain regions represent the ventromedial prefrontal cortex (vmPFC) (blue) and the dorsal anterior insula (daIns) (red), and colored dots recording sites located in these region. The whole insula is shown in yellow as reference. Each dot (1 × 1 mm²) represents one recording site (i.e. a bipole). Anterior (A), posterior (P), dorsal (D), ventral (V), left (L), and right (R) directions are indicated.
Figure 3
Impact of intracerebral activity on decision making.
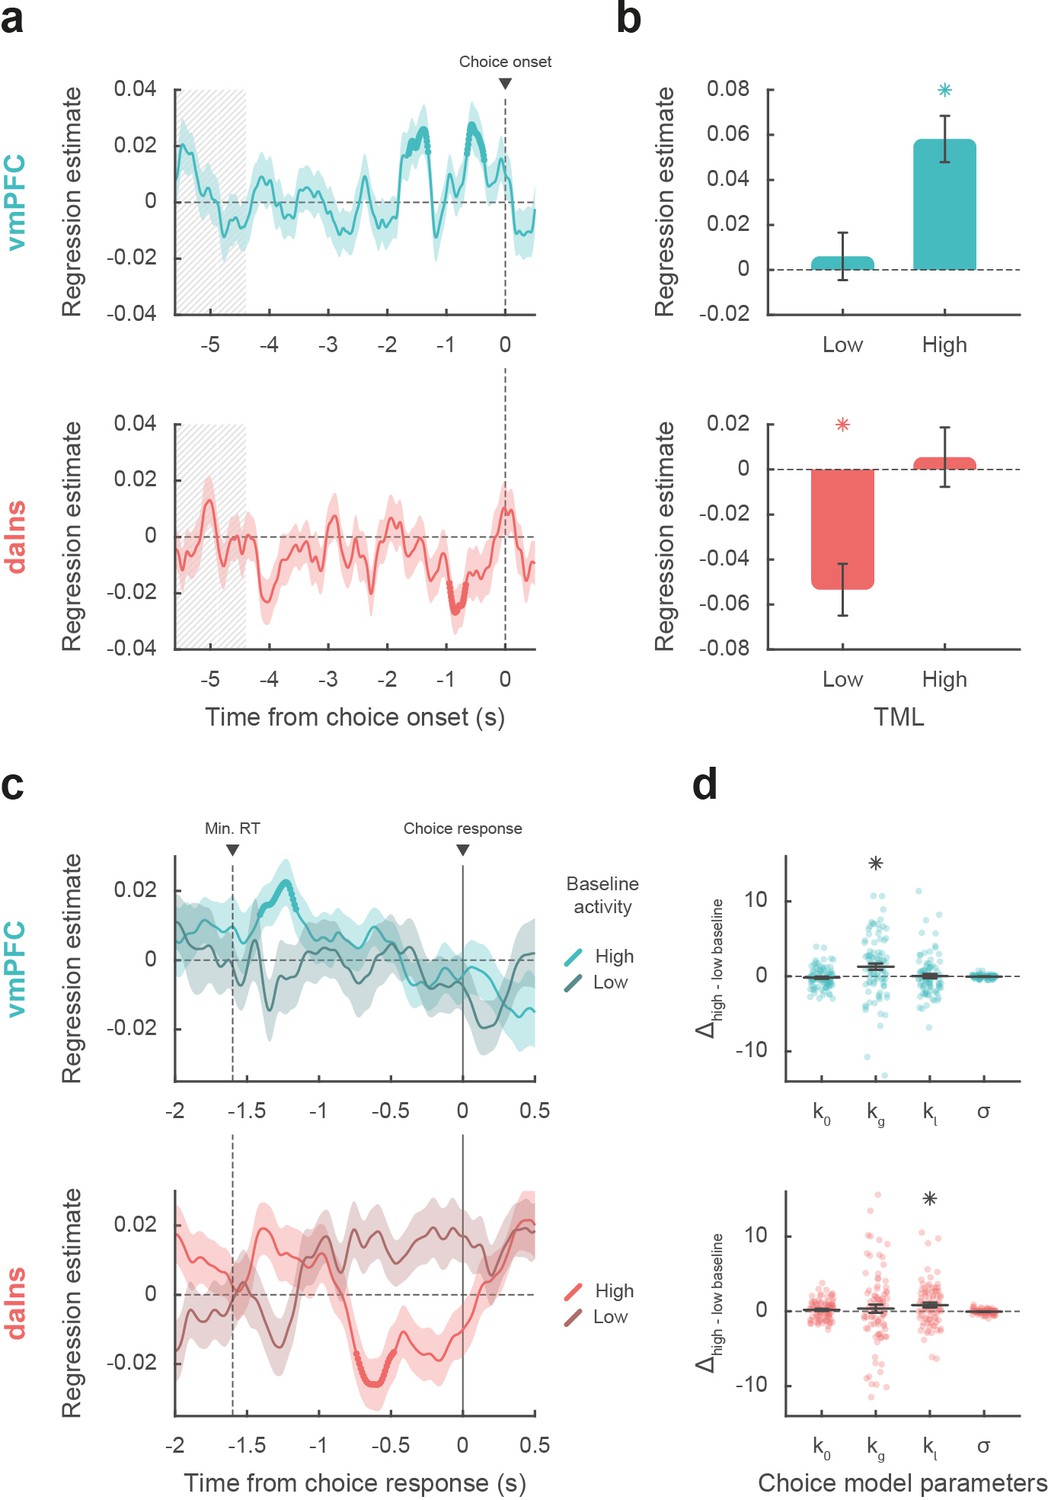
(a) Intracerebral electroencephalographic (iEEG) activity predicting choice. Plots show the time course of estimates obtained from the regression of choice residuals against broadband gamma activity (BGA) in ventromedial prefrontal cortex (vmPFC) (top, blue) and dorsal anterior insula (daIns) (bottom, red), averaged across recording sites ± SEM (shaded areas). Bold lines indicate significant clusters (pcorr<0.05). Gray hatched areas highlight the time window within which quiz feedback was provided to subjects. (b) Average estimates obtained from regression of choice residuals against BGA, separately in trials where theoretical mood level (TML) was low or high according to a median split. Bars are means and error bars are SEM across recording sites (vmPFC: n = 91; daIns: n = 86). (c) Time course of estimates from the regression of choices against BGA performed separately for high vs. low baseline BGA trials in vmPFC (top, blue) and daIns (bottom, red). Dashed line indicates the minimum response time of trials used in the regression (1.6 s). (d) Impact of baseline BGA on choice model parameters. Plots show the difference in model weights (posterior parameters) between fits to high- vs. low-BGA trials. Significant modulation was only found for kg (weight on potential gain) with vmPFC BGA and for kl (weight on potential loss) with daIns BGA. Dots represent individual data and horizontal lines and error bars respectively represent mean and SEM across recording sites. Stars indicate significance (p<0.05; two-sided, one-sample, Student’s t-test).
Figure 4
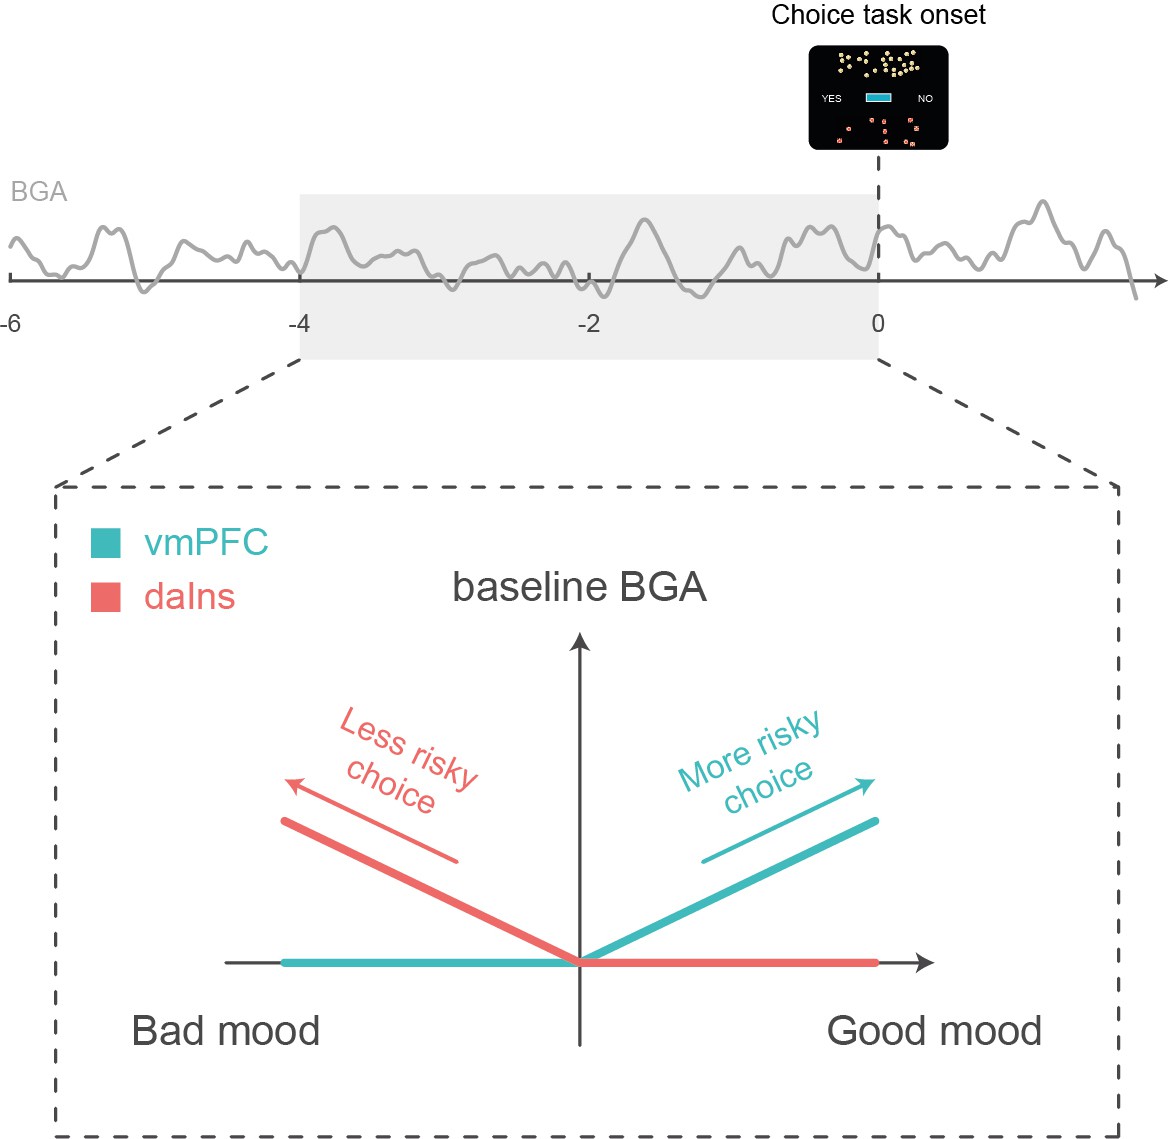
Schematic summary.
A higher baseline broadband gamma activity (BGA) in the ventromedial prefrontal cortex (vmPFC) was both predicted by good mood and associated with higher accept rates in the subsequent choice task, whereas a higher baseline BGA in the dorsal anterior insula (daIns) was both predicted by bad mood and associated with higher reject rates.
Additional files
-
Supplementary file 1
Tables of demographic data and statistical results.
- https://cdn.elifesciences.org/articles/72440/elife-72440-supp1-v2.docx
-
Transparent reporting form
- https://cdn.elifesciences.org/articles/72440/elife-72440-transrepform1-v2.docx
-
Source data 1
Estimates obtained from the regression of BGA against TML in vmPFC and daIns.
Rows: time course, columns: recording sites.
- https://cdn.elifesciences.org/articles/72440/elife-72440-data1-v2.mat
-
Source data 2
Estimates obtained from the regression of choice residuals against BGA in vmPFC and daIns.
Rows: time course, columns: recording sites.
- https://cdn.elifesciences.org/articles/72440/elife-72440-data2-v2.mat
Download links
A two-part list of links to download the article, or parts of the article, in various formats.
Downloads (link to download the article as PDF)
Open citations (links to open the citations from this article in various online reference manager services)
Cite this article (links to download the citations from this article in formats compatible with various reference manager tools)
Intracerebral mechanisms explaining the impact of incidental feedback on mood state and risky choice
eLife 11:e72440.
https://doi.org/10.7554/eLife.72440


