Remodeling of dermal adipose tissue alleviates cutaneous toxicity induced by anti-EGFR therapy
- School of Biomedical Engineering, Shanghai Jiao Tong University, China
- Department of Dermatology, Shanghai East Hospital, Tongji University, China
Figures
Figure 1 with 4 supplements
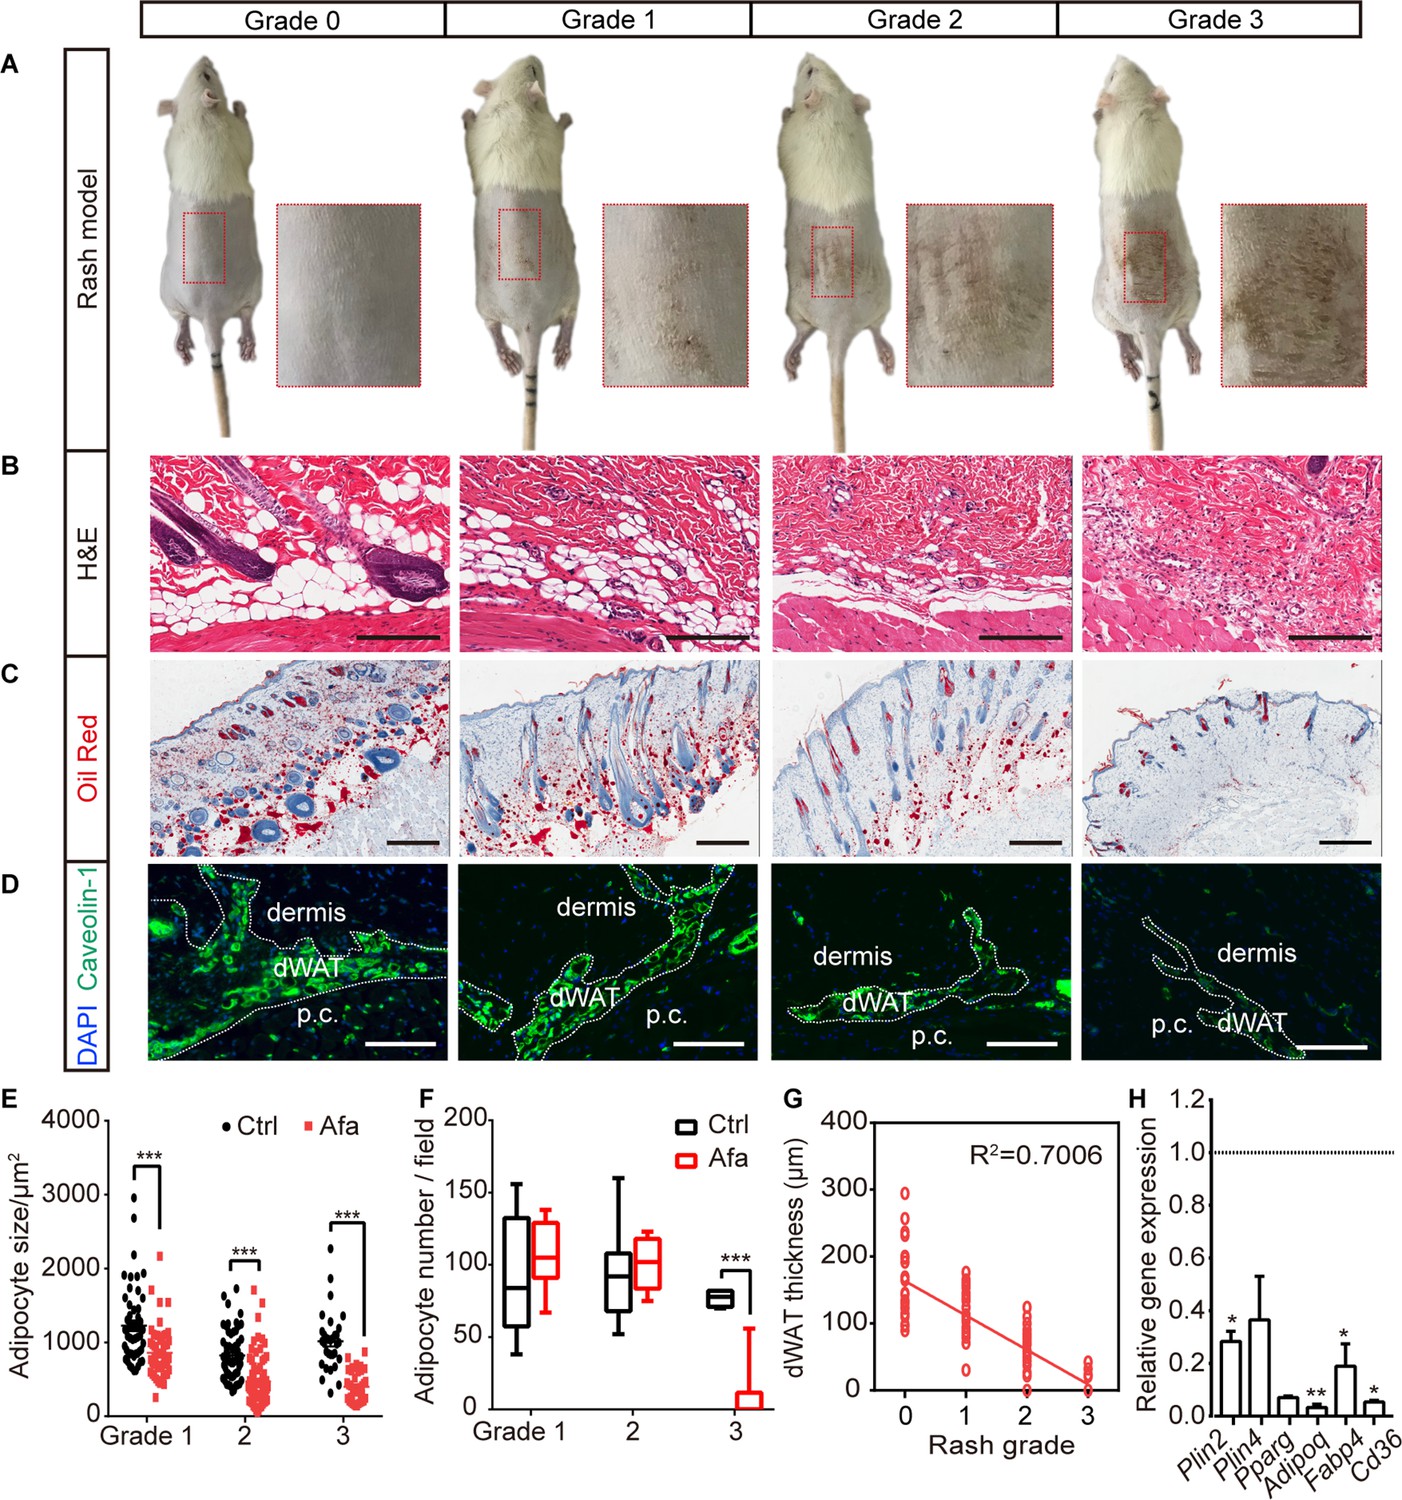
The response of dWAT to EGFR inhibition.
(A) Representative images of the rat rash model. (B–D) H&E (B), Oil Red (C), and Caveolin-1 (D) staining of skin from control and Afa-treated rats. Scale bars: 200 μm, 500 μm and 130 μm (top to bottom). p.c. refers to panniculus carnosus. (E and F) Quantification of the dWAT size (E), and adipocyte number (F) in rats with different rash grades compared with the control (Ctrl). n = 3–5 per group. (G) Relationship between dWAT thickness and rash grade. The square values of the Pearson’s correlation coefficients are shown. (H) RT-PCR measurements of mRNA levels of adipogenic genes in skin tissues from control and Afa-treated rats. n = 4–5 per group. Data are presented as the means ± SEM. *p < 0.05, **p < 0.01, and ***p < 0.001 using two-tailed unpaired Student’s t test.
Figure 1—figure supplement 1
Characteristics of rat rash model.
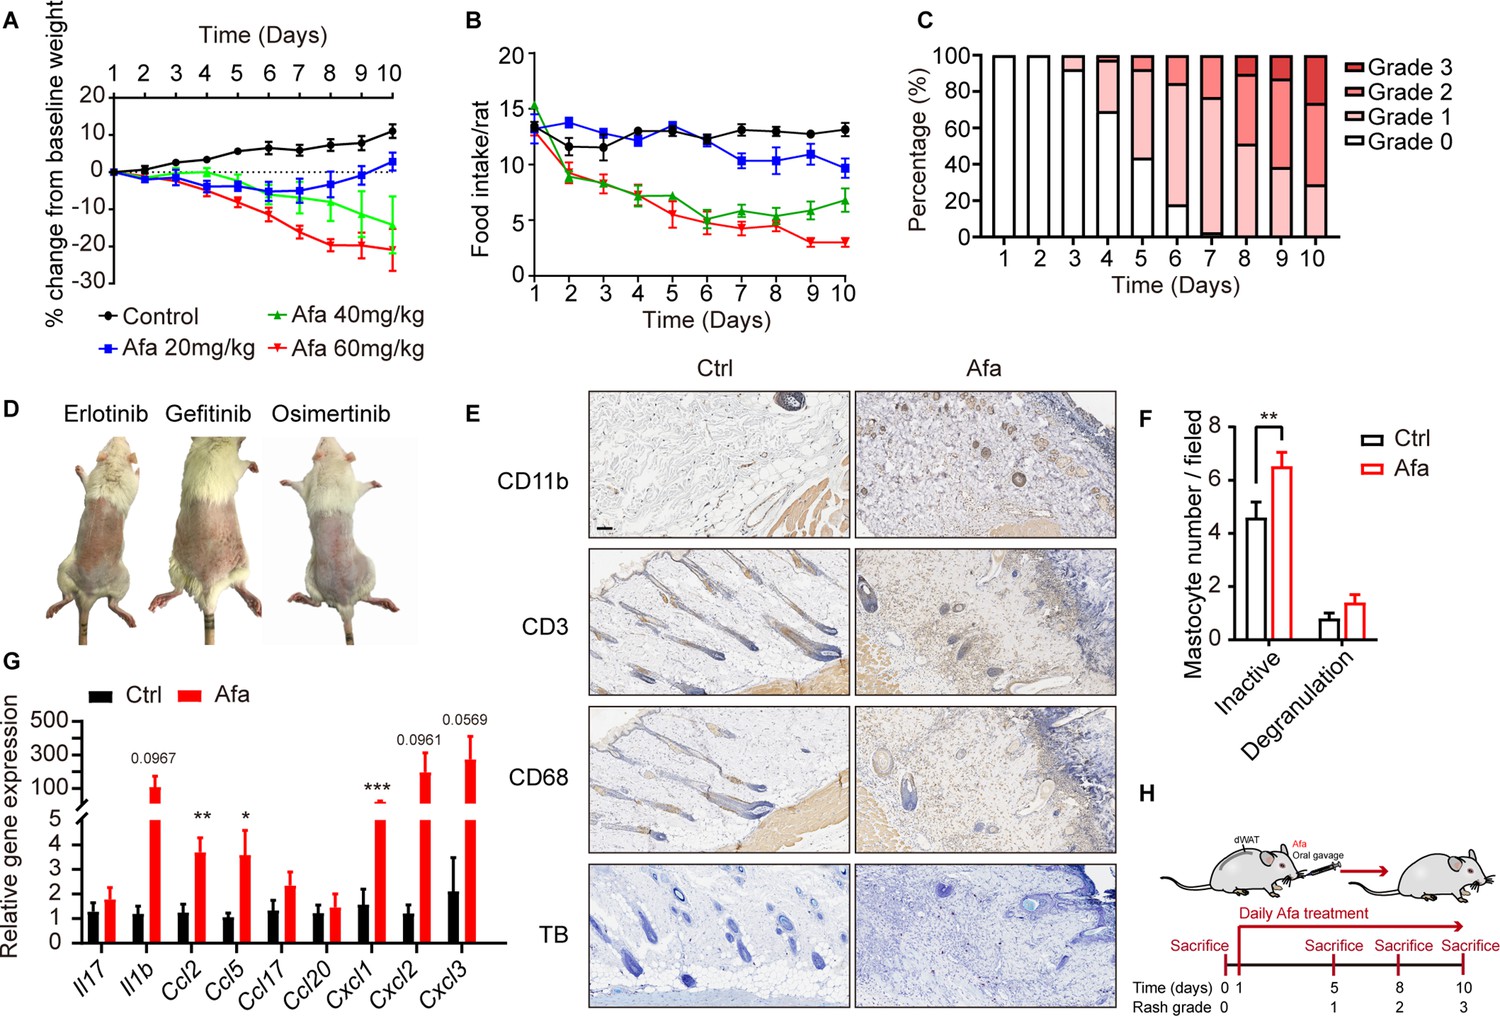
(A) Body weight change of control and Afa-treated rats. n = 8 per group. (B) Food intake per rat of different Afa dosage. (C) Percentages of different rash grade during Afa treatment. n = 39. (D) Representative photos of rat rash model induced by Erlotinib, Gefitinib, and Osimertinib. (E) CD11b, CD3 (T cell), CD68 (macrophage), and toluidine blue (TB, mastocyte) staining of skin from control and Afa-treated rats at Day 10. Scale bar: 100 μm. (F) Quantitative analysis of toluidine blue staining. The mastocytes were counted in 200 × fields (degranulated defined as eight or more granuli). (G) RT-PCR measurements of mRNA levels of inflammatory genes in skin tissues from Ctrl and Afa-treated rats. n = 5 per group. (H) Schematic of the strategy used to sacrifice rats at different rash grade. Data are presented as the means ± SEM. *p < 0.05, **p < 0.01, and ***p < 0.001 using two-tailed unpaired Student’s t test.
Figure 1—figure supplement 2
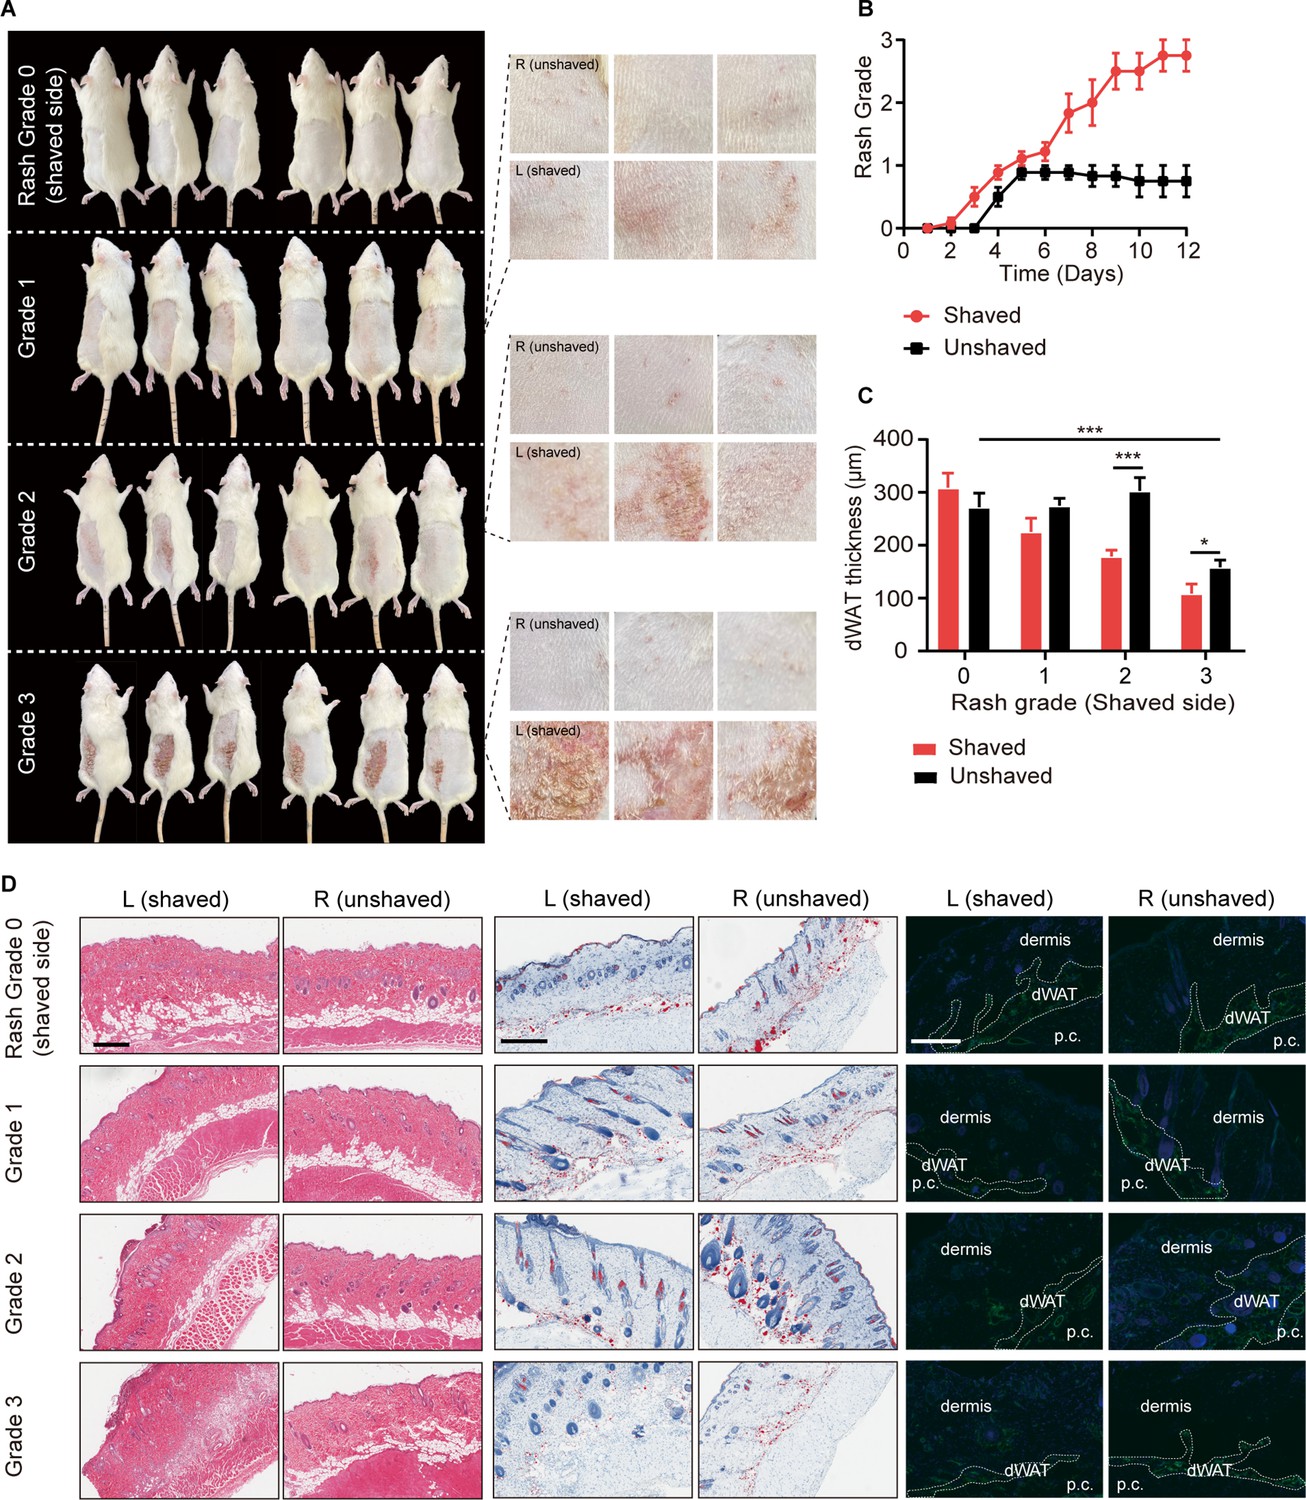
Shaving effects rash occurrence and progress.
The back hair on the left back side was shaved while the right side was unshaved at the beginning of Afa treatment, rats were sacrificed according to the rash process of the shaved area. After scarification, right side was shaved to observe the skin phenotype. (A) Representative images of rats before and after shaving and the zoom pictures for rash site. (B) Rash grade for shaved and unshaved area. (C) dWAT thickness. (D) H&E, Oil Red, and Caveolin-1 staining of skin from shaved and unshaved area. Scale bars: 100 μm. Data are presented as the means ± SEM. *p < 0.05, **p < 0.01, and ***p < 0.001 using two-tailed unpaired Student’s t test.
Figure 1—figure supplement 3
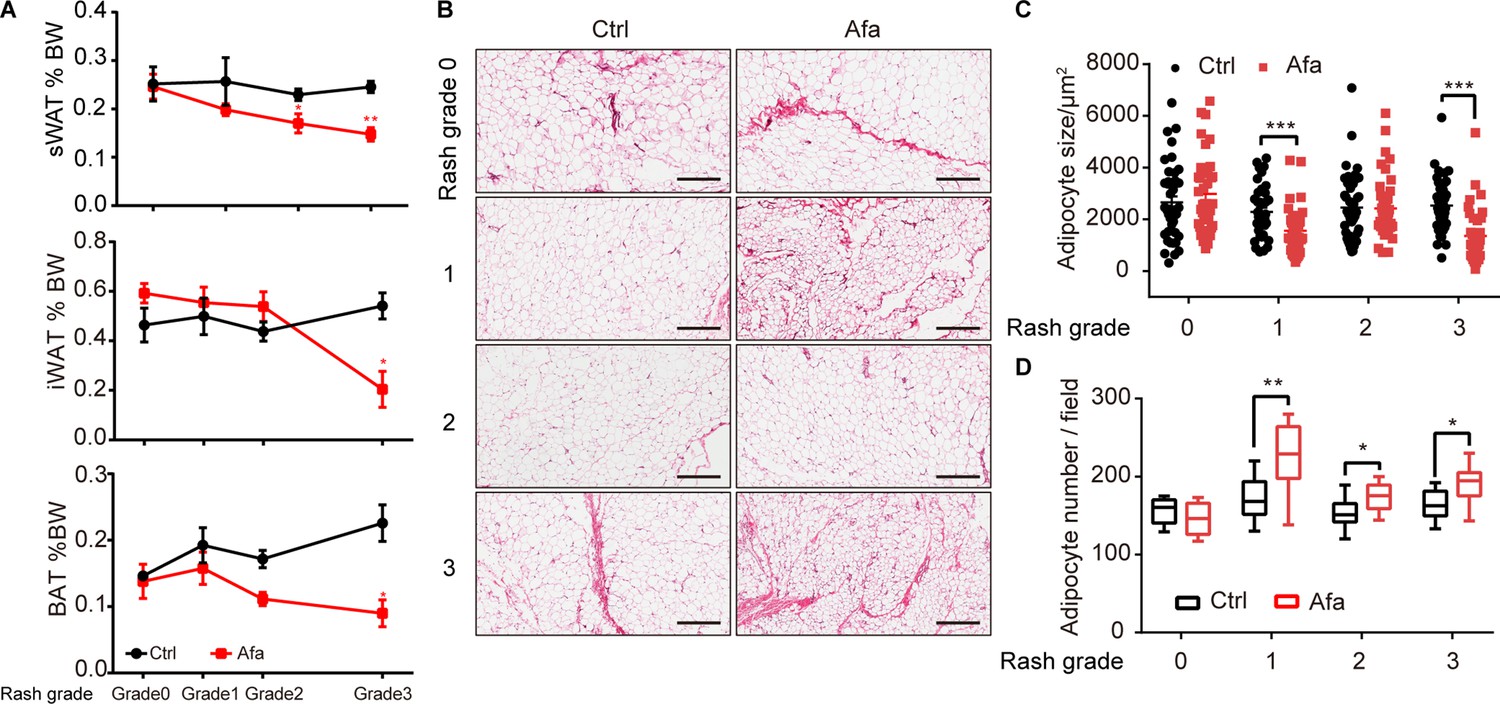
Characteristics of sWAT during EGFR inhibition.
(A) Percentage of BW change of sWAT, iWAT and BAT. sWAT was obtained under the same shaved-skin area. n = 3–5 per group. (B) H&E staining of subcutaneous white adipose tissue from Ctrl and Afa-treated rats at indicated time. Scale bars: 300 μm. (C and D) Quantification of the sWAT size (C) and number (D). Data are presented as the means ± SEM. *p < 0.05, **p < 0.01, ***p < 0.001 (Ctrl vs Afa) using two-tailed unpaired Student’s t test.
Figure 1—figure supplement 4
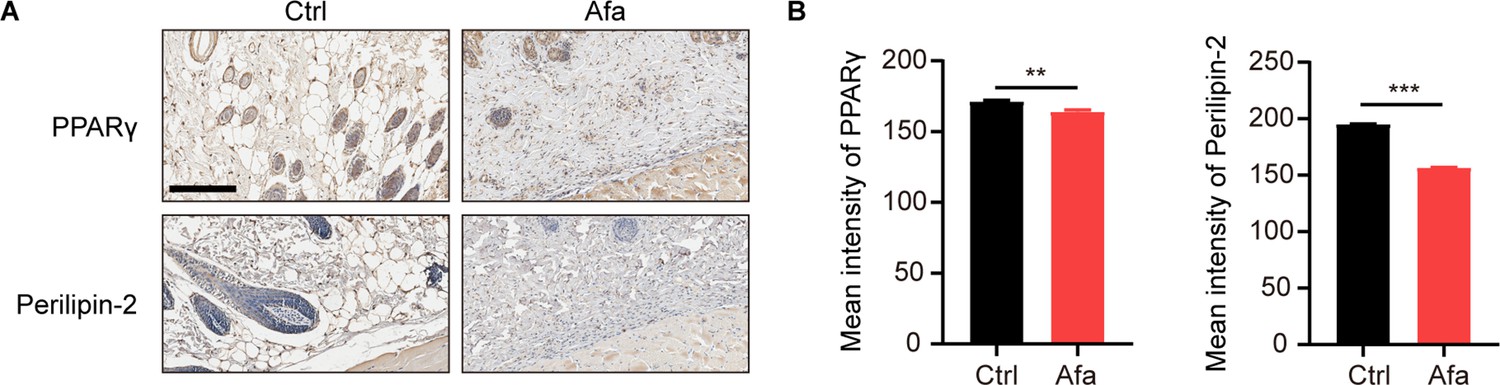
Reduced expression of PPARγ and Perilinpin-2 after Afa treatment.
(A) PPARγ and Perilinpin-2 staining of skin from Ctrl and Afa-treated rats at day 10. Scale bar: 100 μm. (B) Quantification of positive signal intensity. Data are presented as the means ± SEM. **p < 0.01, and ***p < 0.001 using two-tailed unpaired Student’s t test.
Figure 2 with 1 supplement
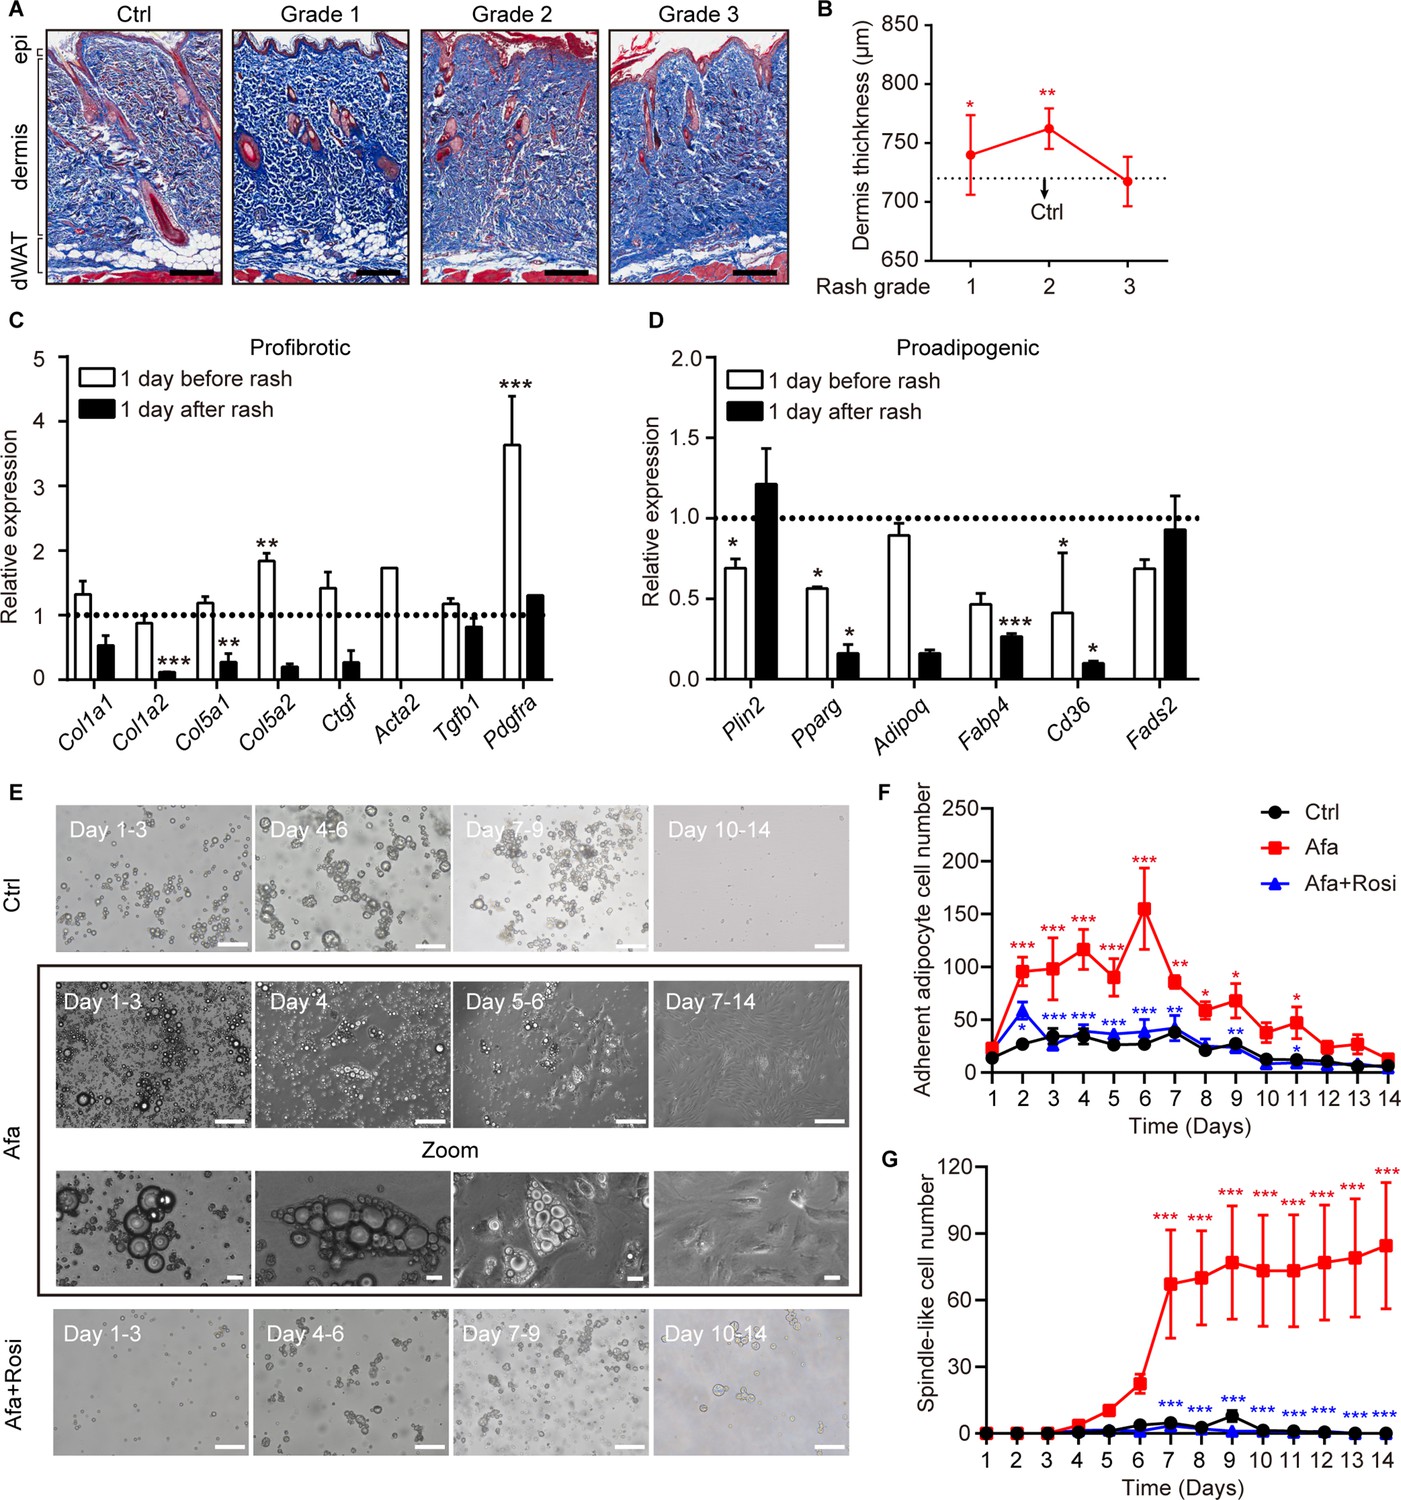
Dedifferentiation of mature dermal adipocytes upon EGFR inhibition.
(A) Masson’s trichrome staining of skin sections from rats at the indicated times. n = 3–5 per group. epi refers to epidermis. Scale bars: 500 μm. (B) Changes in the thickness of the dermis in Ctrl- and Afa-treated rats. n = 3–5 per group. (C and D) RT-PCR measurements of profibrotic genes (C), and proadipogenic genes (D) in isolated dermal adipocytes at the indicated times, n = 3–4 per group. Data was normalized to Ctrl. Dotted line represented the mean gene expression of the Ctrl group. (E) Morphological changes at different time points of Afa (100 nM) or Rosi (5 μM) treatment revealed a transition from mature dermal adipocytes to dedifferentiated adipocytes. Scale bars: 100 μm and 50 μm for zoom pictures. (F) Quantification of adherent adipocyte cells. (G) Quantification of dedifferentiated, spindle-like cells per field. Data are presented as the means ± SEM (Afa/Rosi group vs Ctrl group and Afa +Rosi group vs Afa group). *p < 0.05, **p < 0.01, ***p < 0.001 using two-tailed unpaired Student’s t test and one-way ANOVA.
Figure 2—figure supplement 1

Additional dedifferentiation changes of dWAT and sWAT.
(A and B) mRNA levels of pro-fibrotic and pro-adipogenic genes in sWAT at one day before, and one day after rash, n = 3 per group. Data was normalized to Ctrl. Dotted line represented the mean gene expression of the Ctrl group. (C) PDGFRα (green) and DAPI (bule) immunostaining of dedifferentiated adipocytes under Afa treatment at day 9. Scale bar: 100 μm. (D) mRNA level of Pparg of attatched-dWAT after 5 day Afa or Rosi treatment. n = 3. Data are presented as the means ± SEM. *p < 0.05, **p < 0.01, ***p < 0.001 (Ctrl vs Afa) using two-tailed unpaired Student’s t test.
Figure 3 with 1 supplement
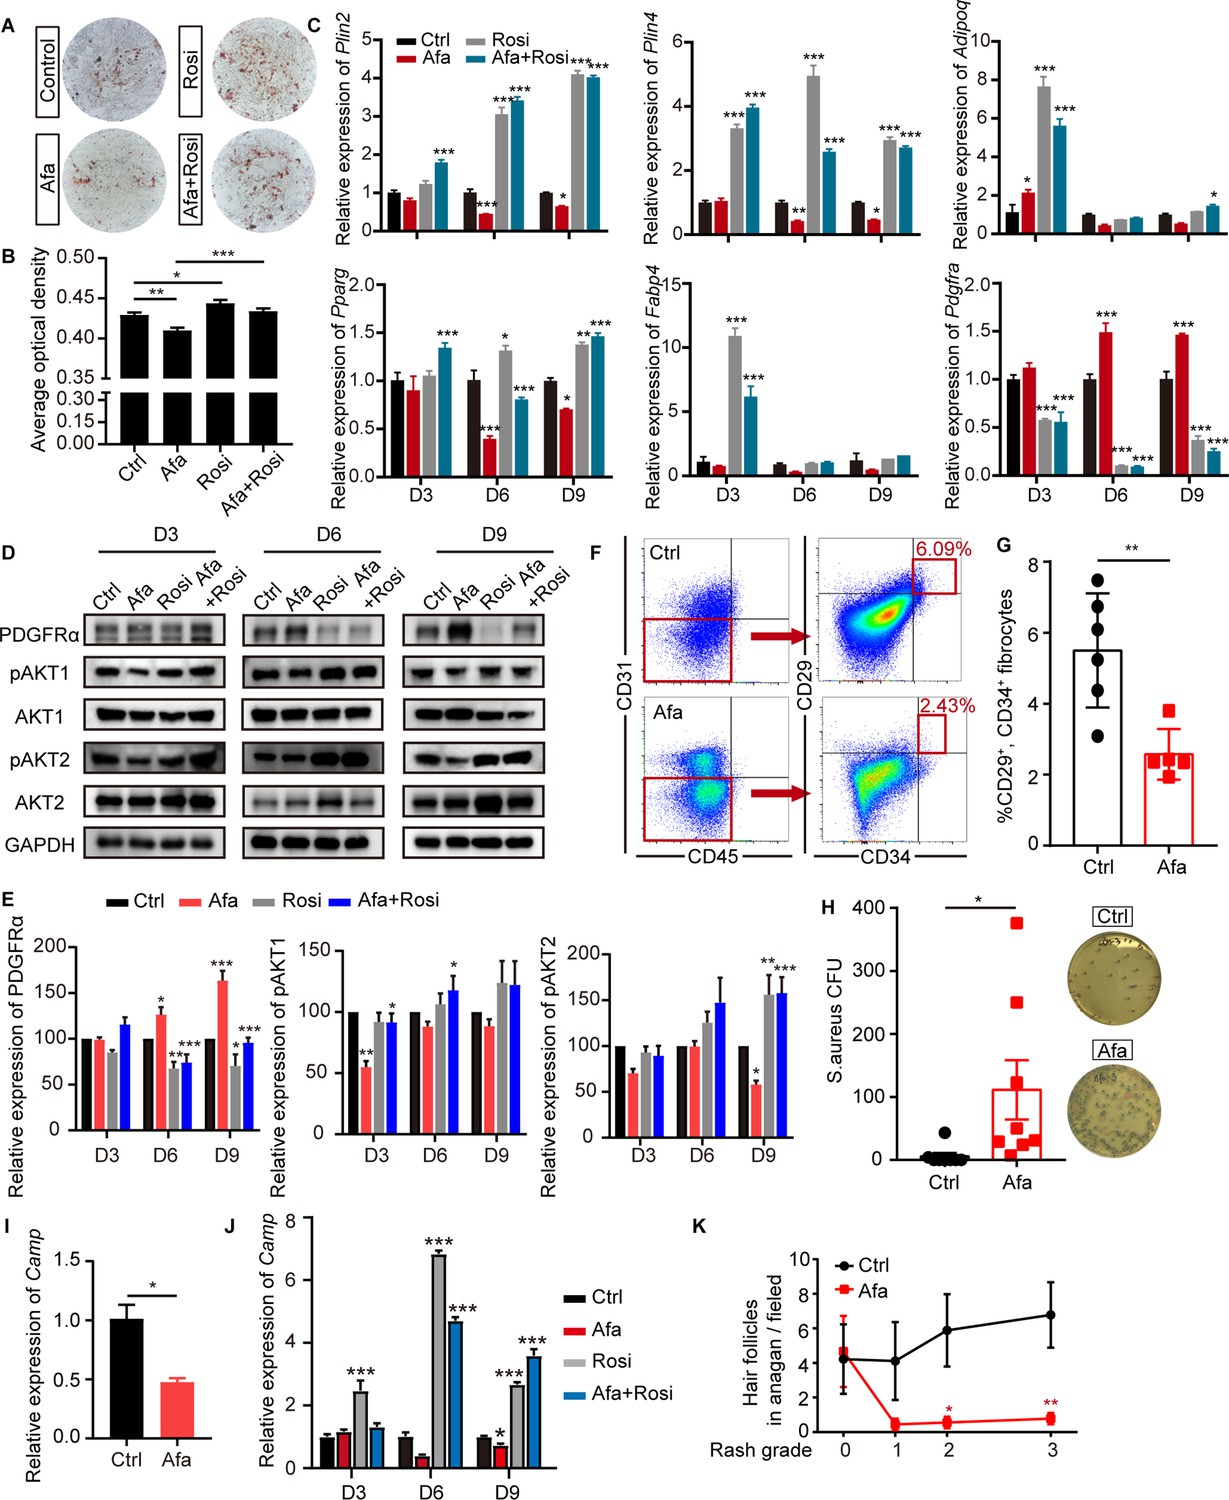
EGFR inhibition blocks adipocyte progenitor differentiation.
(A) dFB cells were isolated from P1 rat skin and then cultured with adipocyte differentiation medium for 9 days in the presence or absence of Afa (10 nM) or Rosi (5 μM). Lipid production was detected using Oil Red staining. (B) Quantification of Oil Red staining. (C) Relative mRNA expression of adipogenic genes at the indicated time points during differentiation. n = 3 per group. (D) Western blot analysis of differentiating dFB cells. (E) Quantification of expression level of PDGFRα, pAKT1 and pAKT2 relative to Ctrl. (F) FACS analysis of adipocyte progenitors in dFB from Ctrl- and Afa-treated rats. (G) The percentage of CD31-, CD45-, CD34+, and CD29+ fibrocytes was quantified. n = 5–6 per group. (H) S. aureus growth in media containing skin homogenates from Ctrl- or Afa-treated rats. n = 8 per group. (I) Relative mRNA expression of Camp from isolated-dWAT at Day 3. n = 5 per group. (J) Relative mRNA expression of Camp at the indicated time points during dFB differentiation. n = 5 per group. (K) Numbers of hair follicles in anagen phase during Afa treatment. n = 3 per group. Data are presented as the means ± SEM. *p < 0.05, **p < 0.01, and ***p < 0.001 (Afa/Rosi group vs Ctrl group and Afa +Rosi group vs Afa group) using two-tailed unpaired Student’s t test and one-way ANOVA.
-
Figure 3—source data 1
Original western blot data for Figure 3D.
- https://cdn.elifesciences.org/articles/72443/elife-72443-fig3-data1-v1.zip
Figure 3—figure supplement 1

Expression levels of inflammatory receptors during dFB differentiation.
(A) Viability of dFB cells under different Afa concentrations. (B) mRNA levels of IL4R, CCR2, IL6R, TNFR, and TLR2-3 of differentiating dFB with Afa (10 nM) or Rosi (5 μM) treatment. n = 4 per group. (C and D) Immunostaining for pEGFR and pERK (C), Ki67 and TUNEL (D) in skin biopsies from Ctrl- and Afa-treated rats. Scale bars: 50 μm. (E) Quantification of TUNEL-positive cell and mean Ki67 intensity per hair follicle. n = 6 per group. Data are presented as the means ± SEM. *p < 0.05, **p < 0.01, ***p < 0.001 (Afa/Rosi vs Ctrl, Afa +Rosi vs Afa) using two-tailed unpaired Student’s t test and one-way ANOVA.
Figure 4 with 1 supplement
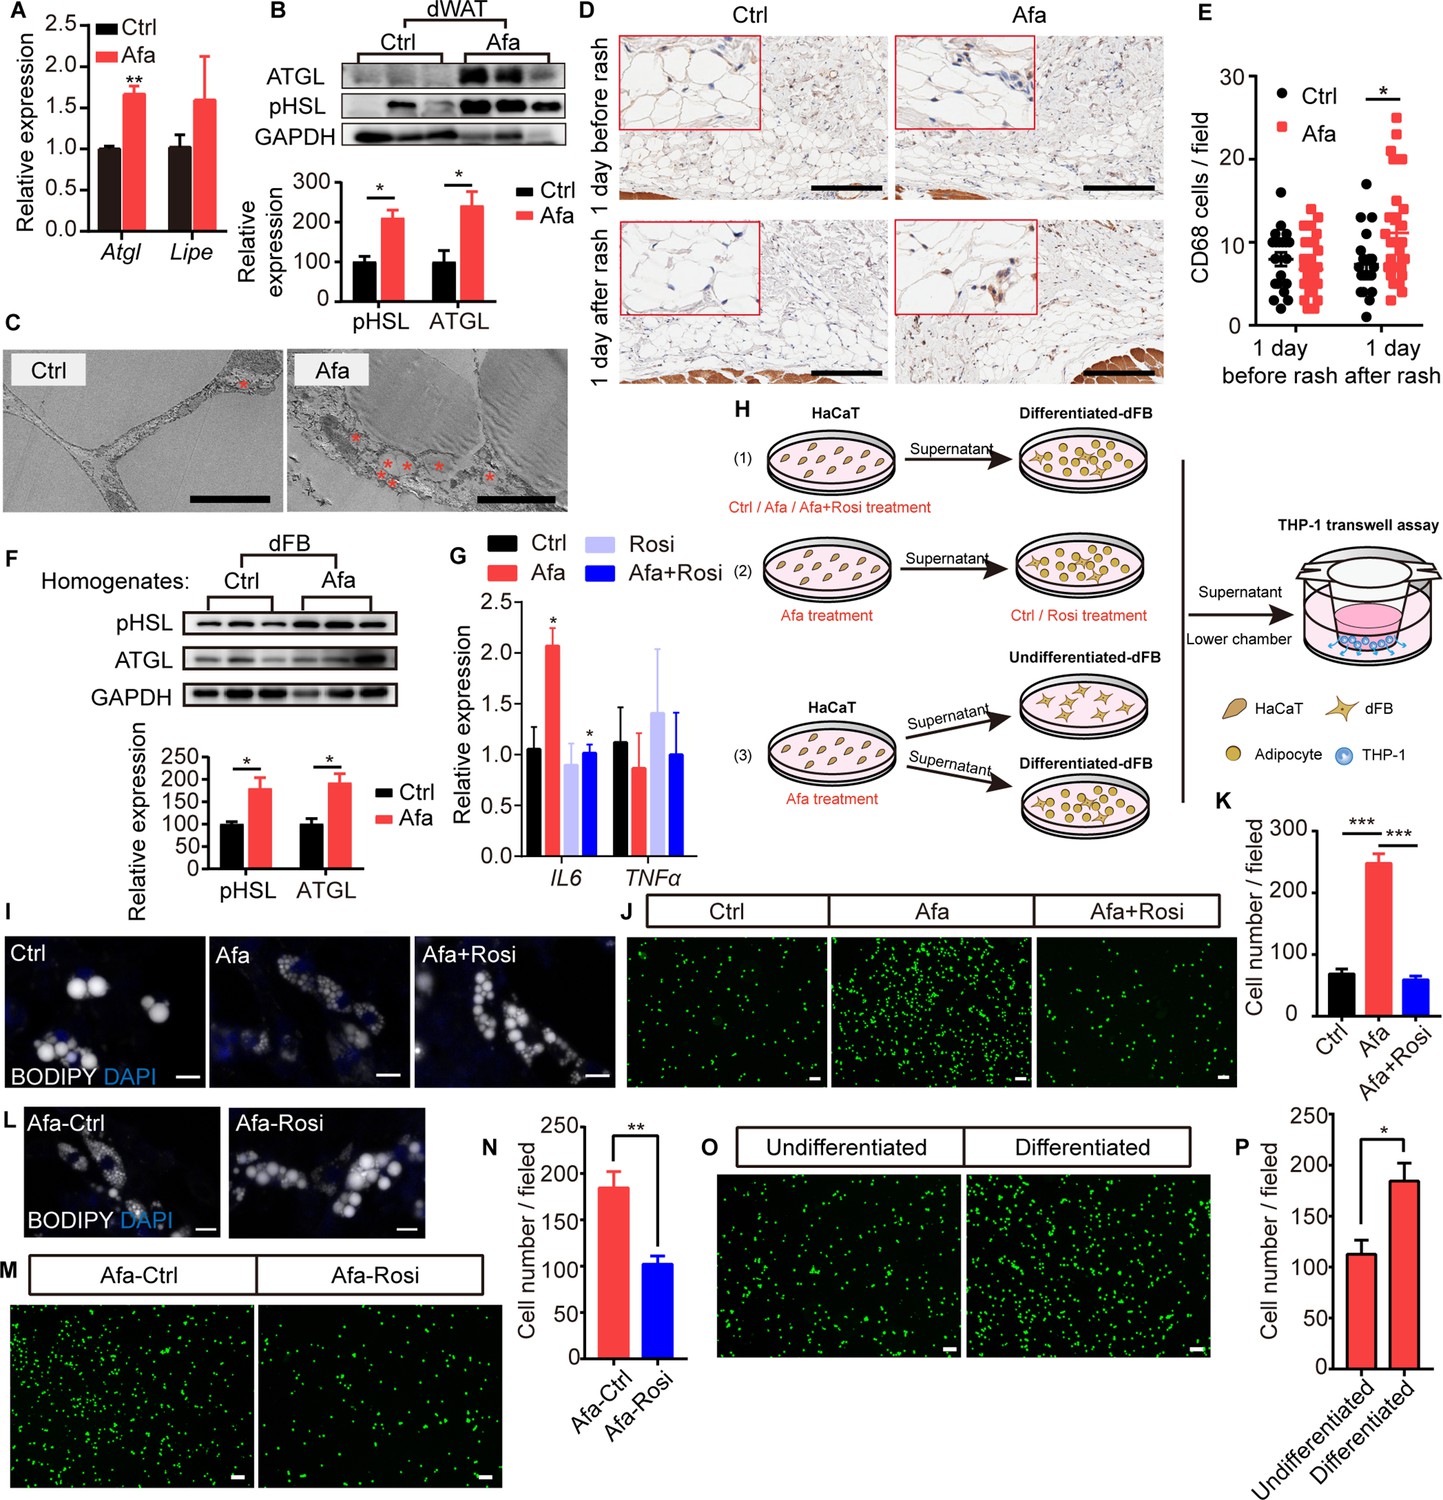
Rosiglitazone alleviates lipolysis and inflammatory response.
(A) Relative expression of the Atgl and Lipe (Hsl) mRNAs in isolated dWAT on day 5. n = 3 per group. (B) Western blot images and quantifications of lipase level from isolated dWAT cells at Grade 1. n = 3. (C) Transmission electron microscopy images of dermal adipocytes from Ctrl- and Afa-treated rat skin on day 5. Asterisks show small lipid droplets. Scale bars: 5 μm. (D and E) Representative images of CD68 immunostaining (D) and quantification (E) in skin from Ctrl- and Afa-treated rats at indicated times. Scale bars: 200 μm. (F) Western blot images and quantifications showing lipase levels in dFB-derived adipocytes stimulated by rat skin homogenates. n = 3 per group. (G) Relative expression of the IL6 and TNFα mRNAs in HaCaT cells after 4 hr of treatment with 100 nM Afa. n = 3 per group. (H) Schematic diagram of the experimental setup used to evaluate the roles of Rosi and adipocytes. HaCaT cells were treated with drugs for 24 h, then the supernatants were transferred directly to dFBs for another 24 hr incubation. For transwell assay, the supernatants of dFBs were added to the low chamber. (I) Confocal microscopic images of differentiated-dFBs after treatments of HaCaT supernatants from Ctrl, Afa and Afa +Rosi. Lipids were stained with BODIPY 493/503. Scale bars: 50 μm. (J and K) Representative images (J) and quantification (K) of migrated THP-1 cells stimulated with culture media from HaCaT supernatants (Ctrl, Afa, Afa +Rosi)-treated dFB cells. (L) Confocal microscopic images of HaCaT supernatant (Afa)-treated dFBs after treatment with Ctrl or Rosi. Scale bars: 50 μm. (M and N) Representative images (M) and quantification (N) of migrated THP-1 cells stimulated with culture media from HaCaT supernatant (Afa)-treated dFB cells. Then, 5 μM Rosi or vehicle was added to dFBs. (O and P) Representative images (O) and quantification (P) of migrated THP-1 cells stimulated with culture media from HaCaT supernatant (Afa)-treated undifferentiated or differentiated dFB cells. Data are presented as the means ± SEM. *p < 0.05, **p < 0.01, and ***p < 0.001 (Afa/Rosi group vs Ctrl group and Afa +Rosi group vs Afa group) using two-tailed unpaired Student’s t test and one-way ANOVA.
-
Figure 4—source data 1
Original western blot data for Figure 4B.
- https://cdn.elifesciences.org/articles/72443/elife-72443-fig4-data1-v1.zip
-
Figure 4—source data 2
Original western blot data for Figure 4F.
- https://cdn.elifesciences.org/articles/72443/elife-72443-fig4-data2-v1.zip
Figure 4—figure supplement 1
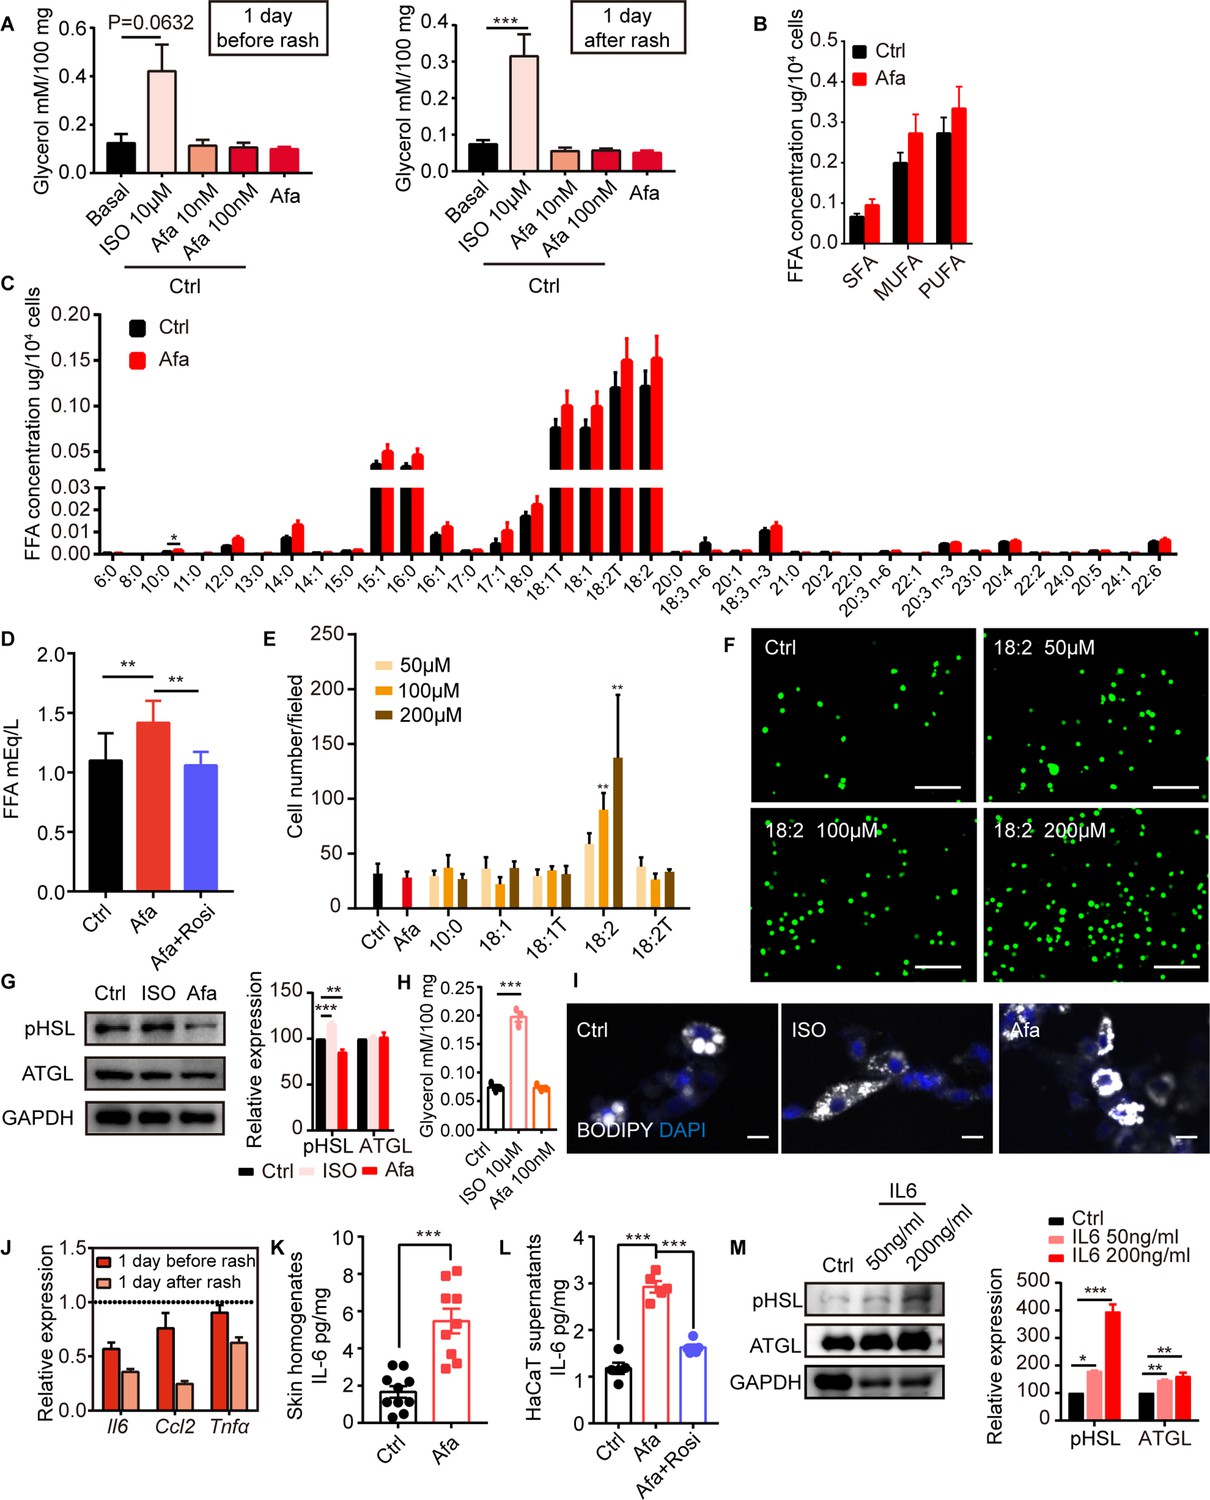
Lipolytic effects of direct EGFRI stimulation on adipocytes.
(A) Glycerol concentration after 2 hr ISO or Afa treatment on isolated sWAT at indicated times. n = 3–5. (B and C) Lipid mass spectrometry quantification of medium- and long-free fatty acids. n = 6 per group. SFA: saturated fatty acid. MUFA: monounsaturated fatty acid. PUFA: polyunsaturated fatty acid. (D) FFA concentration of differentiated-dFBs after treatments of HaCaT supernatants from Ctrl, Afa and Afa + Rosi. n = 3. (E) Quantification of migrated THP-1 cells after stimulation by different FAs. (F) Representative images of migrated THP-1 cells treated with different concentrations of 18:2 FA. Scale bars: 30 μm. (G) Western-blotting images and quantifications of lipase in dFB-derived adipocytes stimulated by 10 μM ISO or 100 nM Afa. n = 3. (H) Glycerol concentration after 2 h ISO or Afa treatment on isolated dWAT. n = 3. (I) Confocal microscopic images of differentiated dFB cells in basal, ISO and Afa treatment. Lipids were stained with BODIPY 493/503. (J) Relative mRNA expression of Il6, Ccl2 and Tnfα in isolated dWAT. n = 3 per group. (K) IL6 levels in skin homogenates from Ctrl- and Afa-treated rats. n = 9–10. (L) IL6 levels in HaCaT supernatants after Ctrl, Afa or Afa + Rosi treatment. n = 5. (M) Western-blotting images and quantifications of lipases in differentiated-dFB stimulated by Ctrl or IL6. n = 3. Data are presented as the means. *p < 0.05, **p < 0.01, ***p < 0.001 using two-tailed unpaired Student’s t test.
-
Figure 4—figure supplement 1—source data 1
Original western blot data for Figure 4—figure supplement 1G.
- https://cdn.elifesciences.org/articles/72443/elife-72443-fig4-figsupp1-data1-v1.zip
-
Figure 4—figure supplement 1—source data 2
Original western blot data for Figure 4—figure supplement 1M.
- https://cdn.elifesciences.org/articles/72443/elife-72443-fig4-figsupp1-data2-v1.zip
Figure 5 with 2 supplements
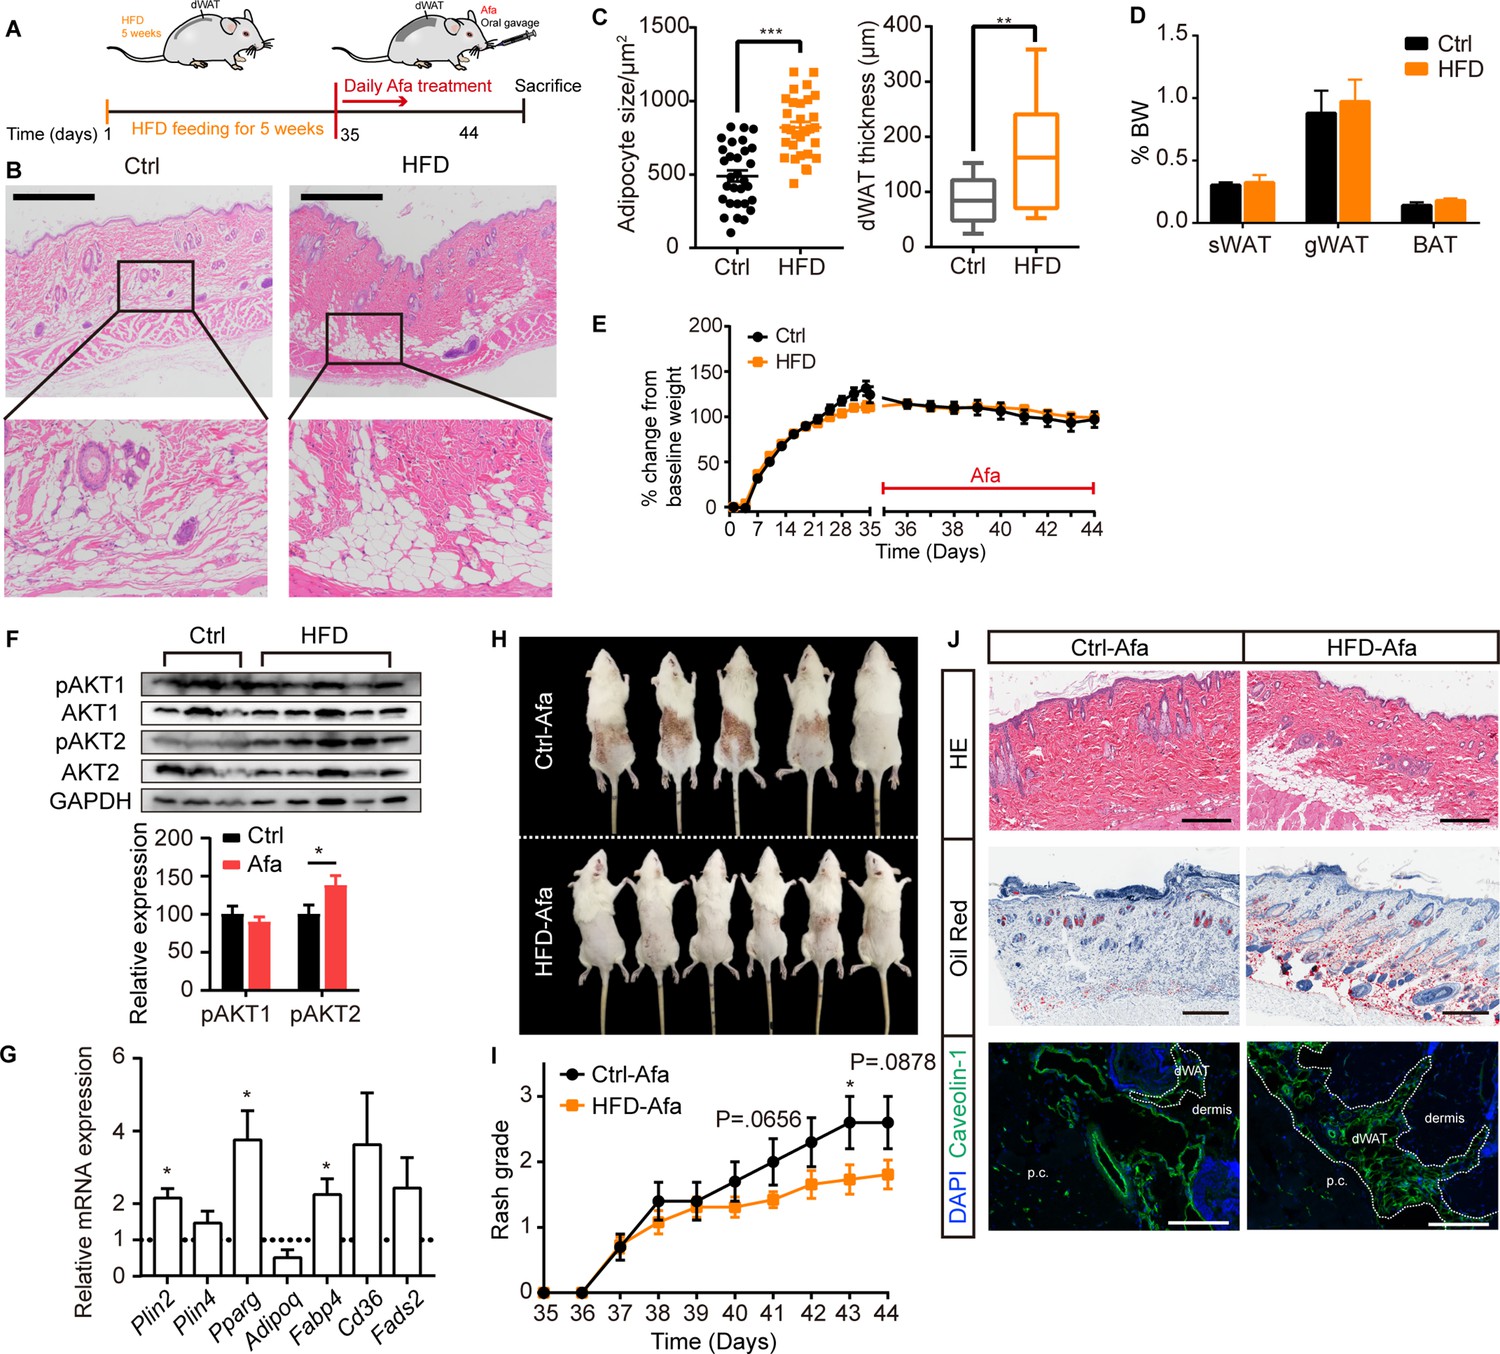
HFD-induced dWAT expansion ameliorates rash phenotypes.
(A) Schematic of the strategy used to expand dWAT by the short-term administration of a HFD. (B) H&E staining of skin from normal diet- and HFD-fed rats. Scale bars: 600 μm. (C) Size and thickness of dermal adipocytes. (D) Percentage of sWAT, gWAT and BAT relative to BW. (E) Body weight change. (F) Western blot analysis and quantifications of isolated-dWAT cells. n = 3–5 per group. (G) Relative mRNA expression of adipogenic genes of isolated-dWAT cells. n = 5 per group. (H) Photos of the rash at 44 days. (I) Changes in the rash grade after Afa treatment. (J) H&E, Oil Red and Caveolin-1 staining of skin biopsies from Ctrl and HFD rats. Scale bars: 300, 500 and 130 μm (top to bottom). Data are presented as the means ± SEM. *p < 0.05, **p < 0.01, and ***p < 0.001 (HFD group vs Ctrl group) using two-tailed unpaired Student’s t test.
-
Figure 5—source data 1
Original western blot data for Figure 5F.
- https://cdn.elifesciences.org/articles/72443/elife-72443-fig5-data1-v1.zip
Figure 5—figure supplement 1
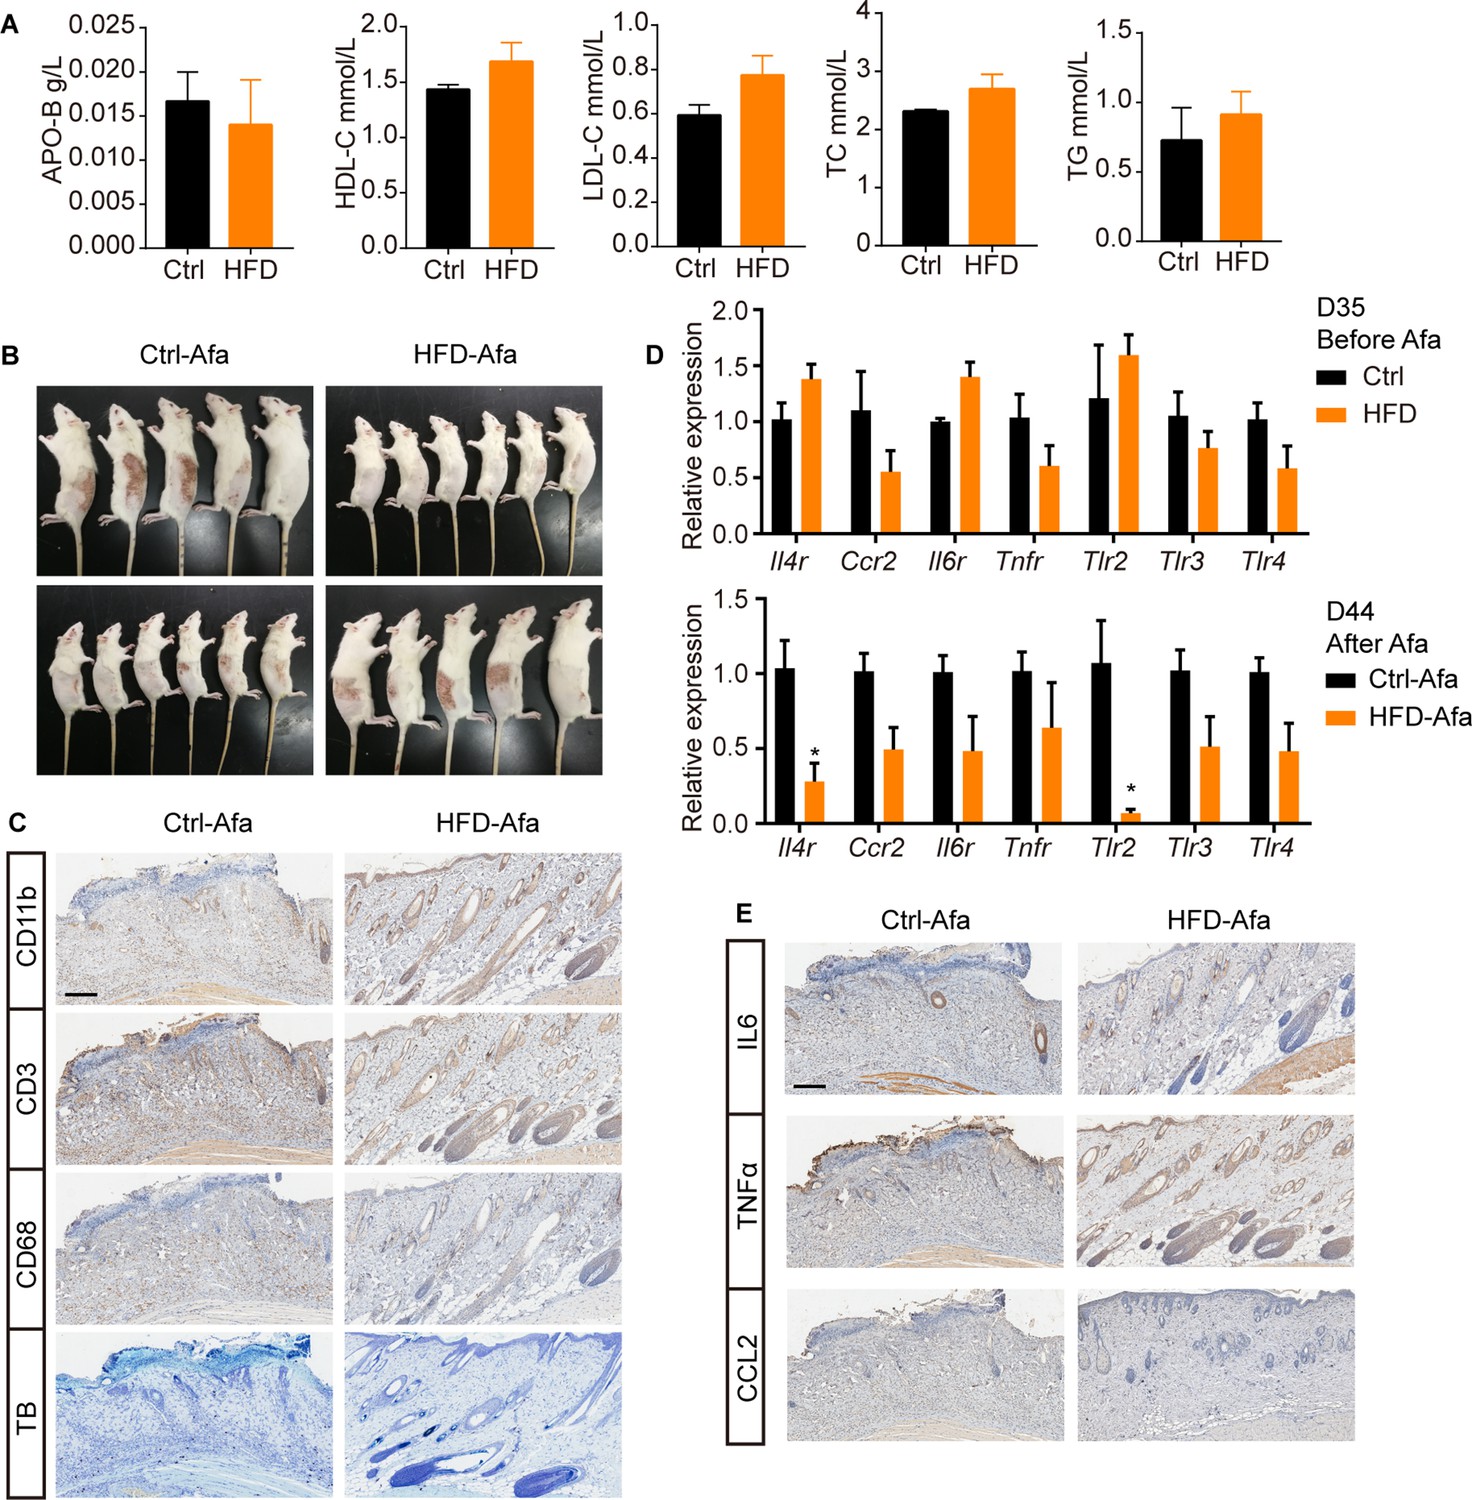
Additional characterization of HFD rats.
(A) Serum lipids of Ctrl and HFD rats. APO-B refers to apolipoprotein B, HDL-C refers to high-density lipoproteincholesterol, LDL-C refers to low-density lipoproteincholesterol, TC refers to total cholesterol, TG refers to triglyceride. n = 3 per group. (B) Left and right photos of rash from Ctrl and HFD rats. (C) CD11b, CD3 (T cell), CD68 (macrophage), and toluidine blue (TB, mastocyte) staining of skin biopsies from Ctrl-Afa and HFD-Afa rats at day 44. Scale bar: 200 μm. (D) Relative expression of inflammatory receptors in dFB assayed by RT-PCR from rats at day 35 and day 44. n = 5 per group. (E) IL6, TNFα, CCL2 staining of skin biopsies from Ctrl-Afa and HFD-Afa rats at day 44. Scale bar: 200 μm. Data are presented as the means ± SEM. *p < 0.05 using two-tailed unpaired Student’s t test.
Figure 5—figure supplement 2
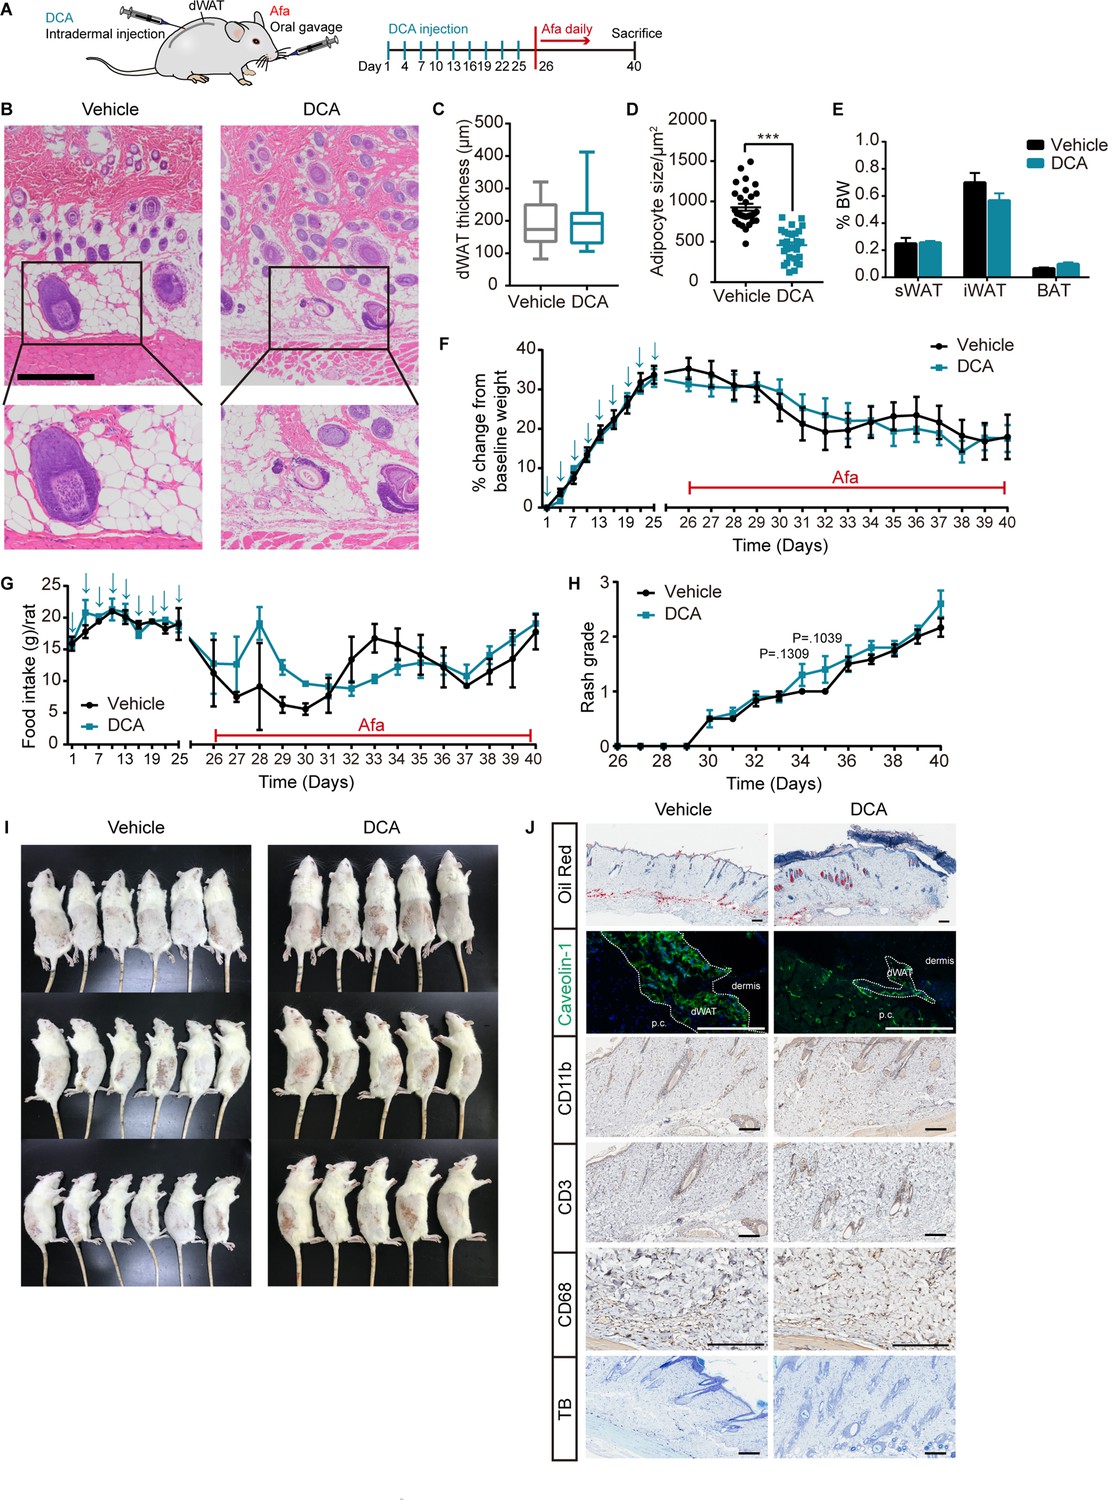
DCA-induced dWAT ablation aggravates rash phenotypes.
(A) Schematic of the strategy to ablate dWAT by repeatedly DCA intradermal injection. (B) H&E staining of skin from Vehicle and DCA rats. Scale bars: 300 μm. (C and D) Size (C) and thickness (D) of dermal adipocytes. (E) Percentage of BW of sWAT, gWAT and BAT. (F) Body weight. (G) Food intake. (H) Rash grade. (I) Photos of rash at 40 days. (J) Oil Red, Caveolin-1, CD11b, CD3 (T cell), CD68 (macrophage), and toluidine blue (TB, mastocyte) staining of skin biopsies from Ctrl and DCA rats at day 40. Scale bars: 200 μm. Data are presented as the means ± SEM. ***p < 0.001 using two-tailed unpaired Student’s t test.
Figure 6 with 3 supplements
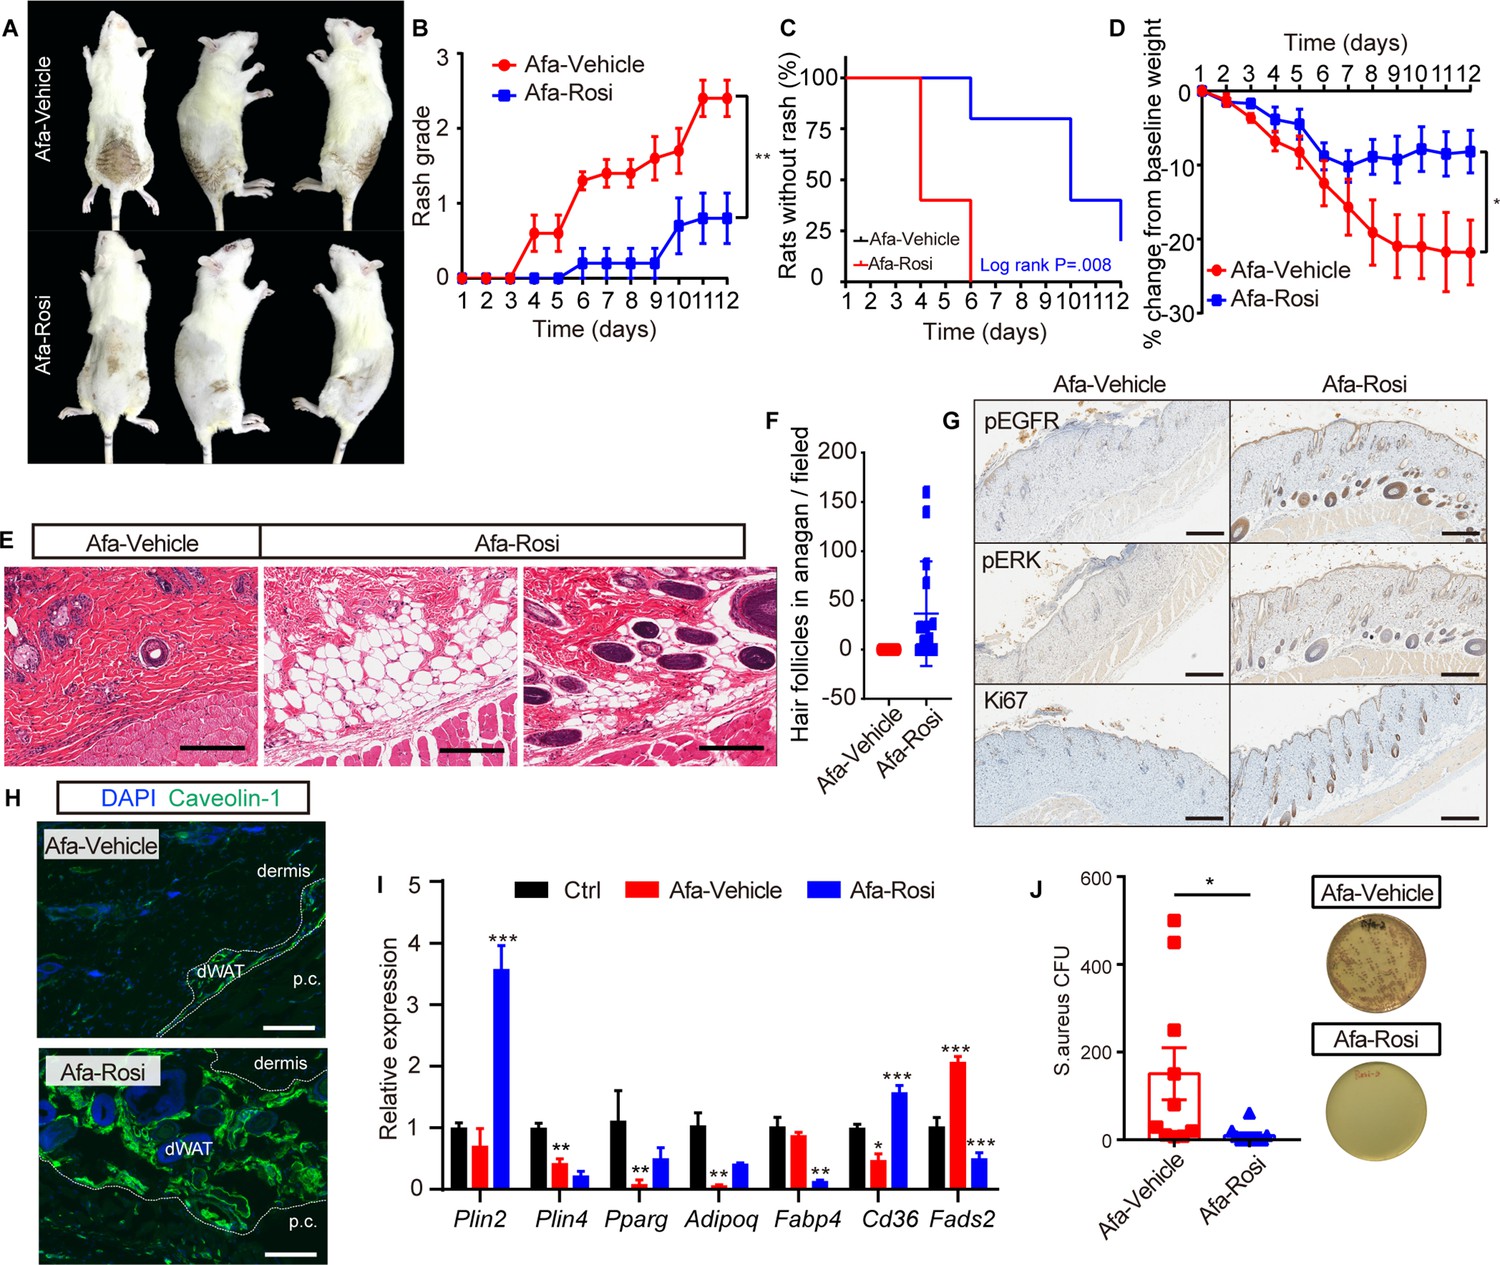
Prophylactic application of Rosi prevents skin toxicities.
(A) Representative photos of rash from Vehicle- and Rosi-treated rats. (B) Rash grade. (C) Rash occurrence. (D) Body weight change. (E) H&E staining of skin biopsies. Scale bars: 200 μm. (F) Number of hair follicles in anagen phase. (G) Immunostaining for pEGFR, pERK, and Ki67 in skin biopsies from Vehicle- and Rosi-treated rats. n = 3 per group. Scale bars: 500 μm. (H) Immunostaining for Caveolin-1. Scale bars: 130 μm. (I) Relative expression of adipogenic genes in isolated dWAT cells after Vehicle or Rosi treatment. n = 3. (J) S. aureus growth in media supplemented with skin homogenates from Vehicle- or Rosi-treated rats. n = 5 per group. Data are presented as the means ± SEM. *p < 0.05, **p < 0.01, and ***p < 0.001 (Rosi group vs Vehicle group) using two-tailed unpaired Student’s t test.
Figure 6—figure supplement 1
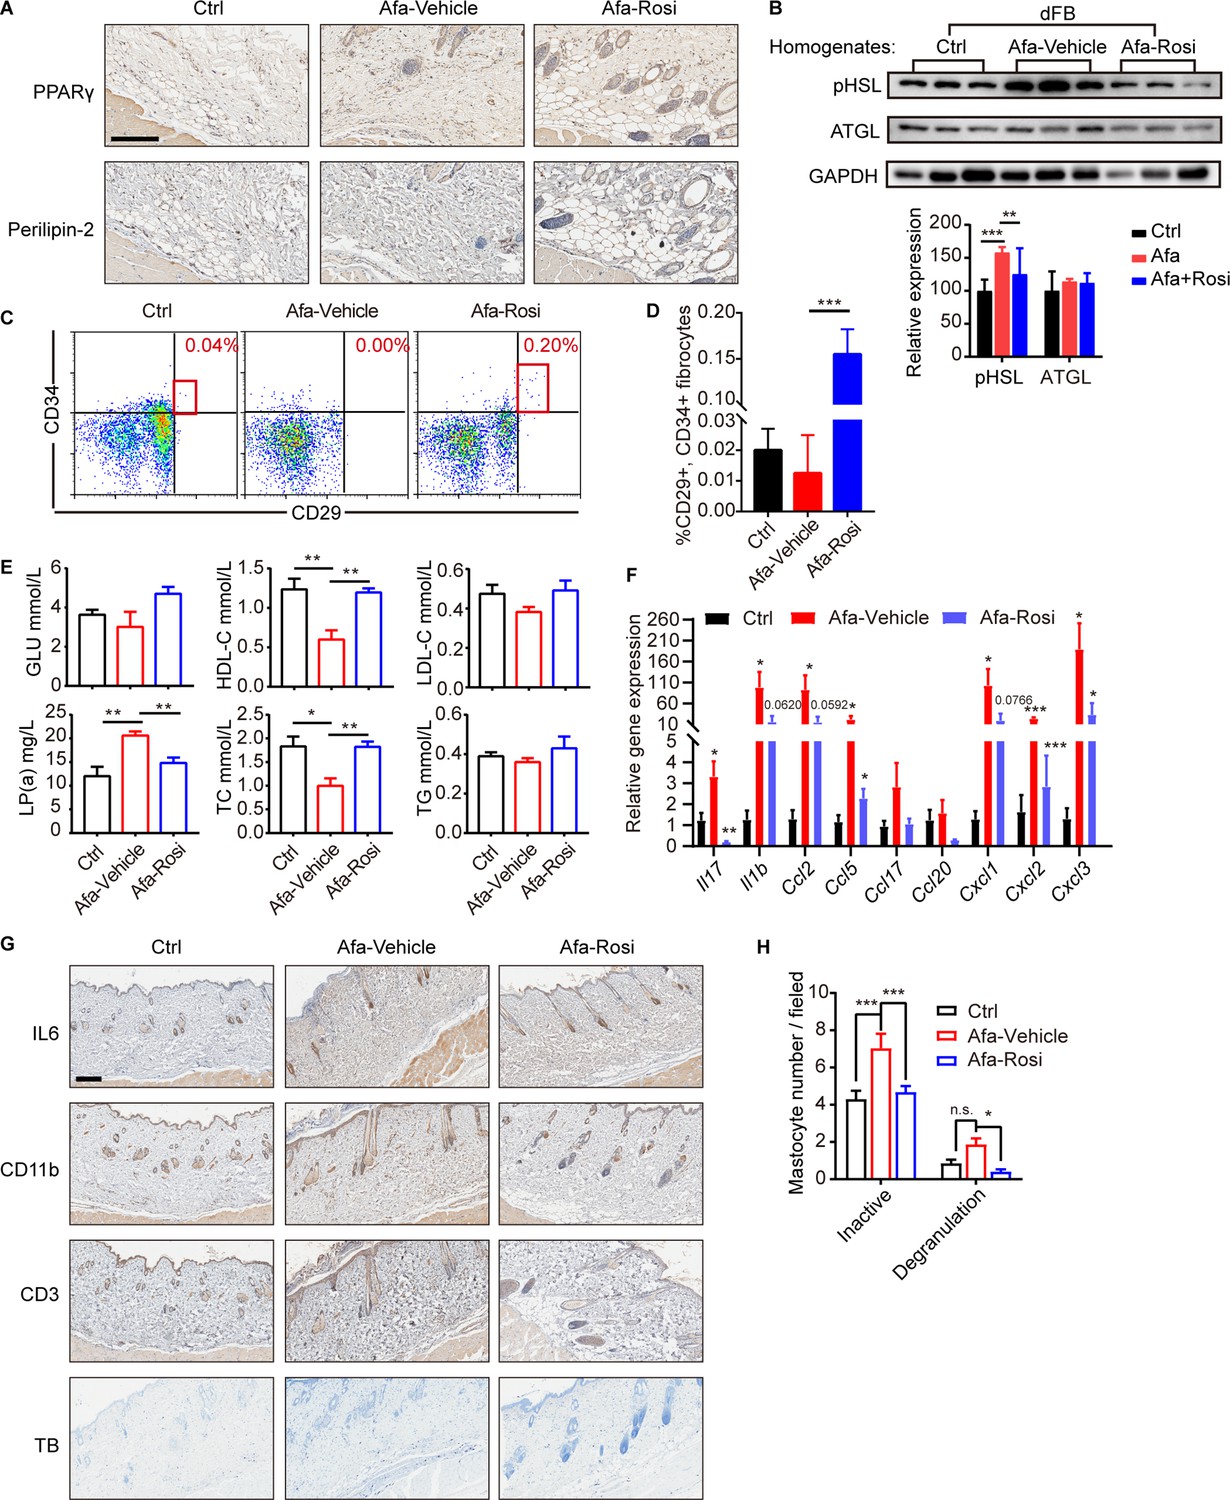
Additional effects of Rosi prevention in Afa-treated rats.
(A) PPARγ, Perilipin-2 staining of skin biopsies from Ctrl, Afa-Vehicle, Afa-Rosi rats at day 10. Scale bar: 100 μm. (B) Western-blotting images and quantifications of lipases in dFB-derived adipocytes stimulated by rat skin homogenates. n = 3 per group. (C) FACS analysis of APs. (D) Quantification of APs. (E) Serum lipids of Ctrl, Afa-Vehicle and Afa-Rosi groups. GLU refers to glucose, HDL-C refers to high-density lipoproteincholesterol, LDL-C refers to low-density lipoproteincholesterol, LP (a) refers to lipoprotein (a), TC refers to total cholesterol, TG refers to triglyceride. n = 5 per group. (F) RT-PCR measurements of mRNA levels of inflammatory genes in skin tissues from Ctrl, Afa-Vehicle, and Afa-Rosi rats. n = 5 per group. (G) IL6, CD11b, CD3 (T cell), CD68 (macrophage), and toluidine blue (TB, mastocyte) staining of skin biopsies from Ctrl, Afa-Vehicle, Afa-Rosi rats at day 10. Scale bar: 200 μm. (H) Quantitative analysis of toluidine blue staining. The mastocytes were counted in 200 × fields (degranulated defined as eight or more granuli). Data are presented as the means ± SEM. *p < 0.05, **p < 0.01, ***p < 0.001 (Ctrl/Rosi vs Afa) using one-way ANOVA.
-
Figure 6—figure supplement 1—source data 1
Original western blot data for Figure 6—figure supplement 1B.
- https://cdn.elifesciences.org/articles/72443/elife-72443-fig6-figsupp1-data1-v1.zip
Figure 6—figure supplement 2
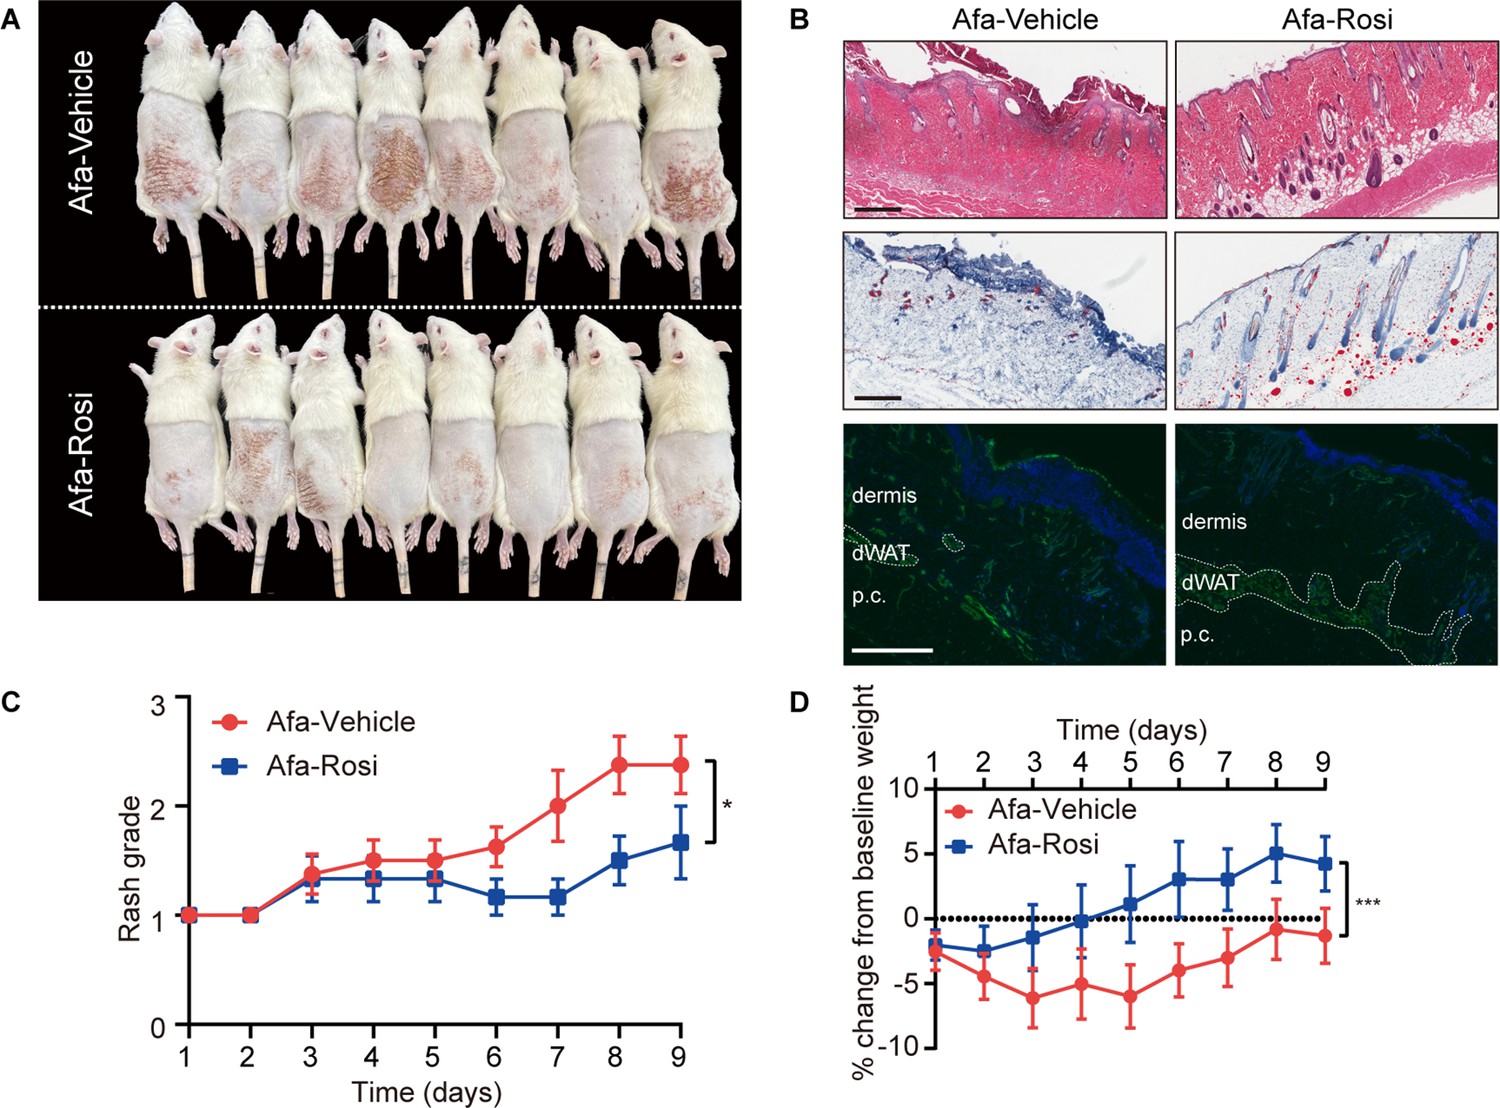
Therapeutic application of Rosi ameliorates skin rash.
After oral gavage of Afa, Vehicle or Rosi gel was applied topically after Grade one rash occurred. (A) Representative photos of rash from Vehicle- and Rosi-treated rats. (B) H&E, Oil Red and Caveolin-1 staining of skin biopsies. Scale bars: 200 μm, 200 μm and 100 μm (top to bottom). (C) Rash grade. (D) Body weight change. n = 8. Data are presented as the means ± SEM. *p < 0.05, ***p < 0.001 using t-test.
Figure 6—figure supplement 3
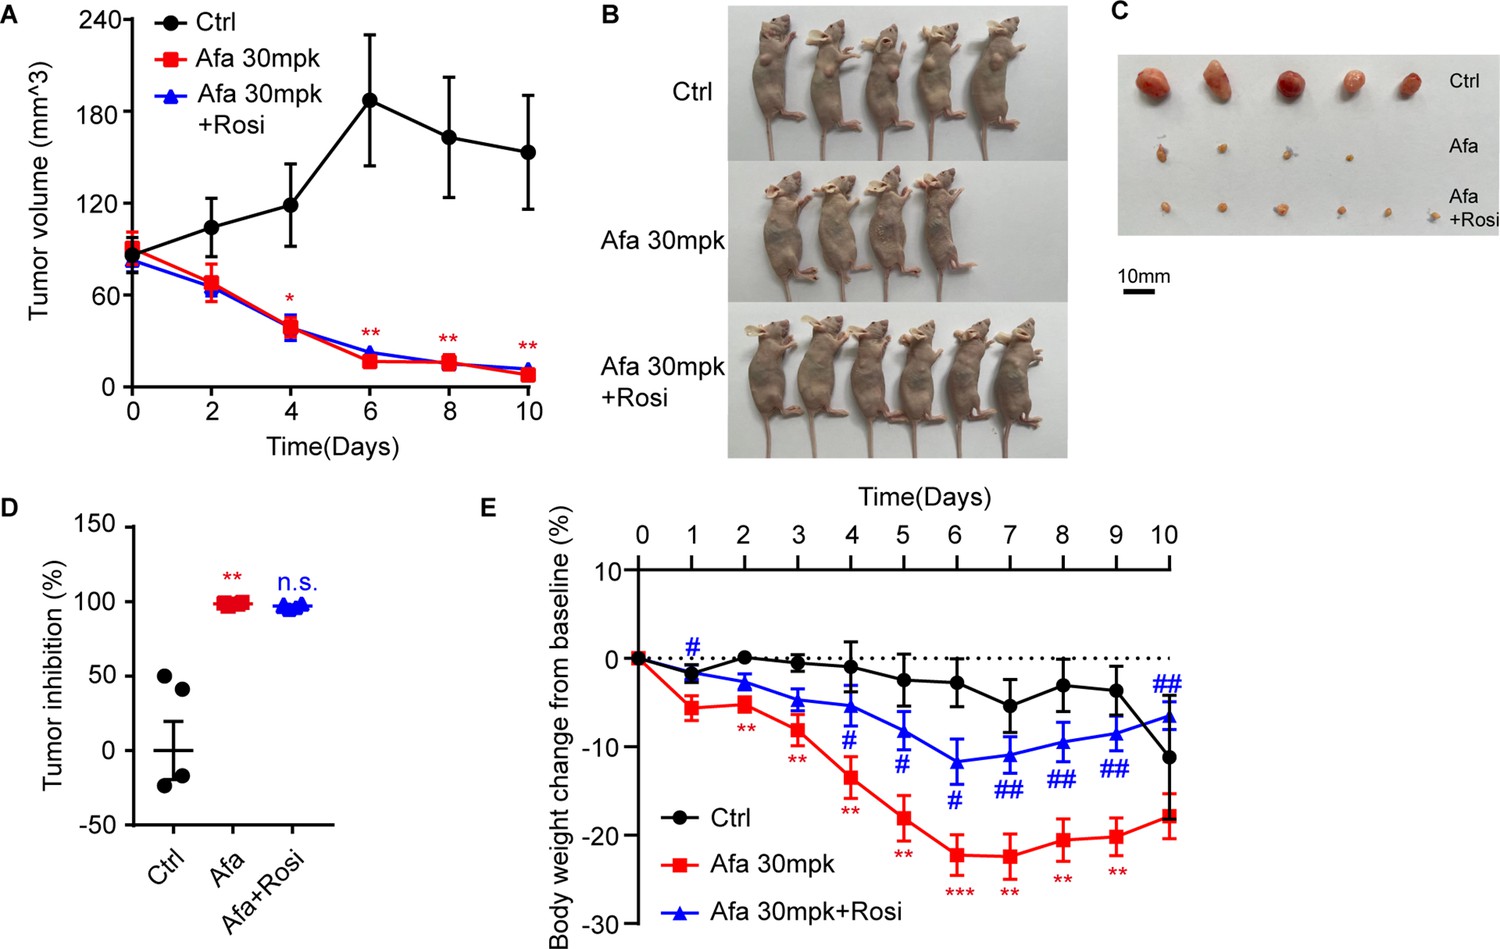
Rosi did not interfere the anti-tumor effect of EGFRI.
Ctrl: mice gavaged with solvent. Afa 30 mpk (mg/kg): Mice were gavaged with Afa and topically administered vehicle gel. Afa 30 mpk +Rosi: Mice gavaged with Afa and topically administered Rosi gel. (A) Tumor volume. (B and C) Photos of nude mice (B) and tumors (C) at day 10. (D) Tumor inhibition. (E) Body weight. n = 4–6 per group. Data are presented as the means ± SEM. p < 0.05, **p < 0.01, ***p < 0.001 (Ctrl/Afa +Rosi vs Afa) using one-way ANOVA.
Figure 7
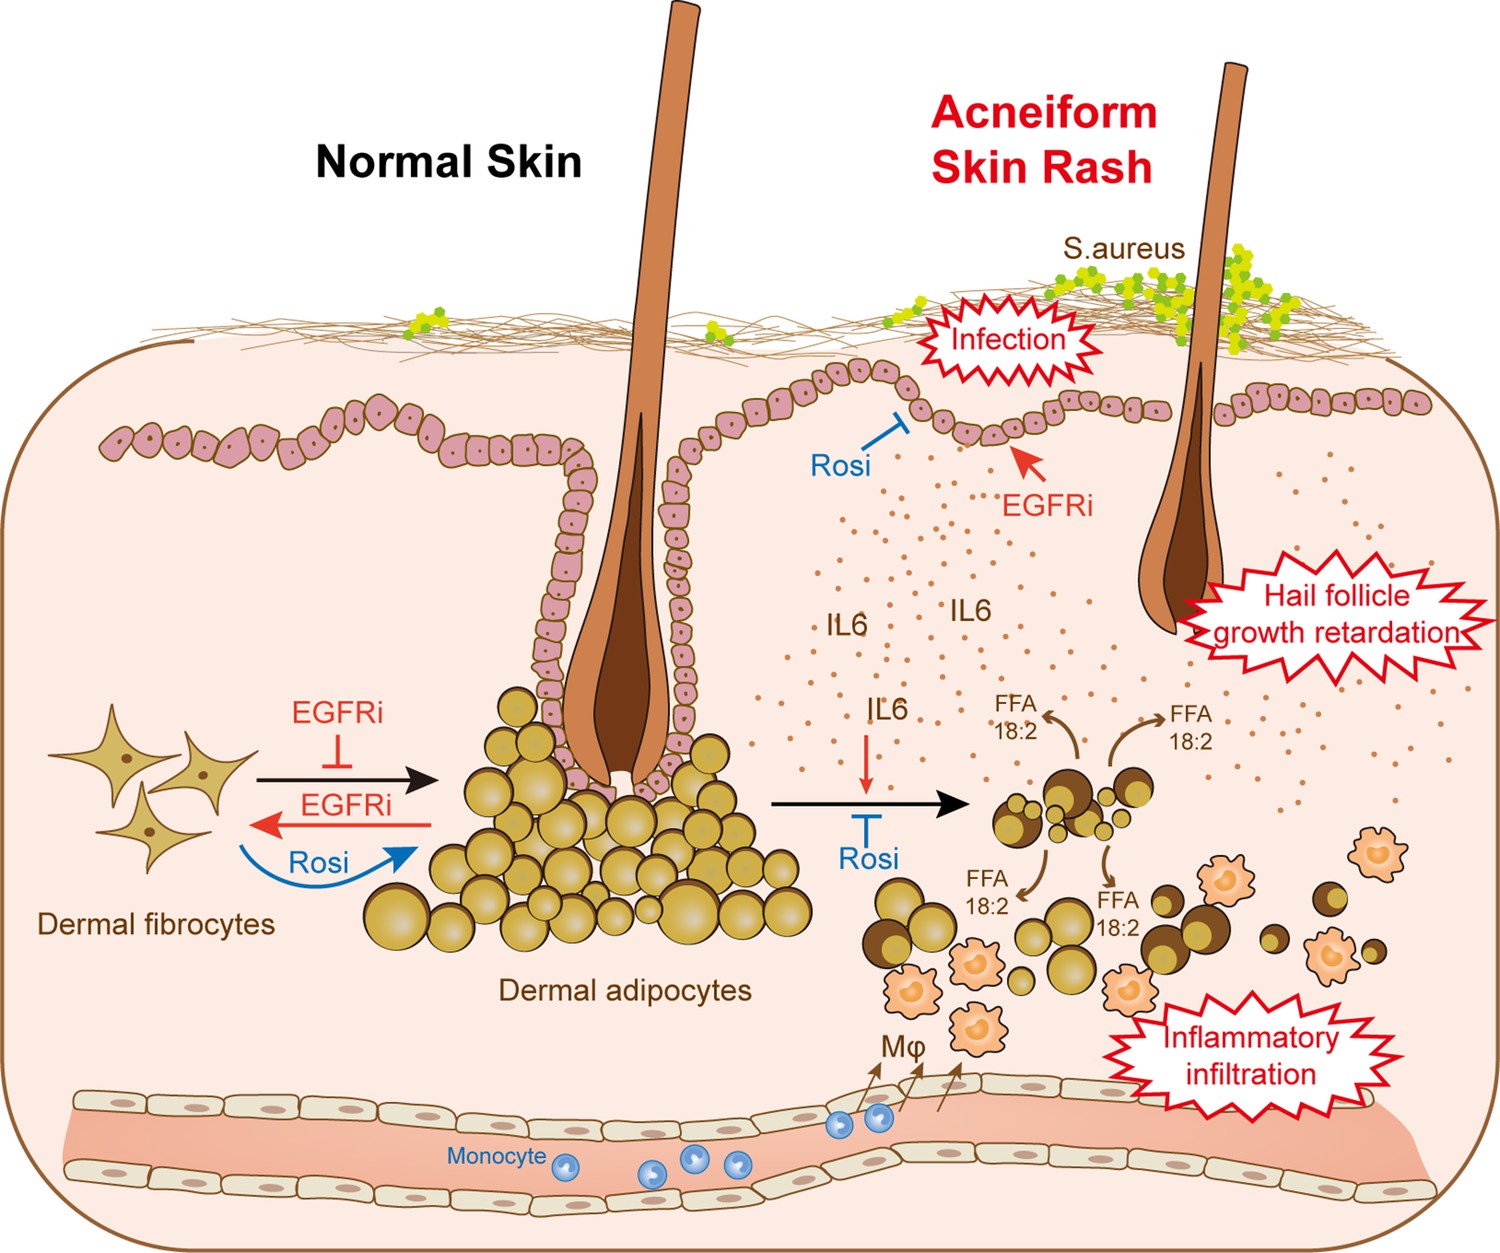
dWAT contributes to skin homeostasis during anti-EGFR therapy.
Reduction of dWAT is a hallmark of EGFRi-induced cutaneous toxicity. EGFR inhibition blocks adipocyte progenitor differentiation and induces dedifferentiation of mature dermal adipocytes. In addition, lipolysis is activated by the up-regulation of the lipolytic cytokine IL6 through epidermal keratinocytes, leading to the infiltration of monocyte-derived macrophages. Lack of dWAT also impairs skin host defense and hair follicle growth. Activation of PPARγ by Rosi could both alleviate the block of differentiation and suppress the increased lipolysis through transcription inhibition of IL6, thus relieving the abnormal skin phenotypes in vivo.
Author response image 1
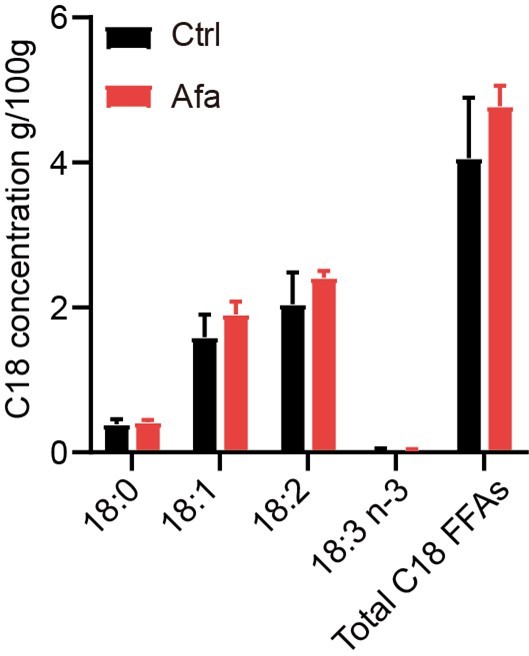
C18 concentrations in skin tissues from Ctrl and Afa groups after 3-day treatment.
n=3.
Tables
Key resources table
| Reagent type (species) or resource | Designation | Source or reference | Identifiers | Additional information |
|---|---|---|---|---|
| Cell line (Homo sapiens) | HaCaT | Cell Research | Cat. #: ZQ0044 | |
| Cell line (Homo sapiens) | PC-9 | Cell Bank of Chinese Academy of Sciences | Cat. #: SCSP-5085CSTR:19375.09.3101HUMSCSP5085 | |
| Cell line (Homo sapiens) | THP-1 | Cell Bank of Chinese Academy of Sciences | Cat. #: TCHu 57CSTR:19375.09.3101HUMTCHu57 | |
| Antibody | Rabbit monoclonal anti-ATGL | Abcam | Cat. #: ab109251 | WB (1:1000) |
| Antibody | Rabbit monoclonal anti-caveolin-1 | CST | Cat. #: 3,267 | WB (1:1000) |
| Antibody | Rabbit monoclonal anti-phoso-AKT1 | CST | Cat. #: 5,012 | WB (1:1000) |
| Antibody | Rabbit monoclonal anti-phoso-AKT2 | CST | Cat. #: 8,599 | WB (1:1000) |
| Antibody | Rabbit polyclonal anti- phospho-HSL | Absin | Cat. #: abs139855 | WB (1:1000) |
| Antibody | PE Mouse Monoclonal Anti-rat CD31 | BD Pharmingen | Cat. #: 555,027RRID: AB_395657 | FACS(0.25 µg per million cells in 100 µl volume) |
| Antibody | FITC Mouse Monoclonal anti-rat CD45 | BioLegend | Cat. #: 202,205RRIS: AB_314005 | FACS(0.25 µg per million cells in 100 µl volume) |
| Antibody | PerCP/Cyanine5.5 Armenian Hamster Monoclonal Anti-mouse/rat CD29 | BioLegend | Cat. #: 102,227RRIS: AB_2572078 | FACS(0.25 µg per million cells in 100 µl volume) |
| Antibody | Pe-Cy7 Mouse Monoclonal Anti-mouse/rat/human CD34 | Santa Cruz Biotechnology | Cat. #: sc-7324RRIS: AB_2572078 | FACS(1 µg per million cells in 100 µl volume) |
| Peptide, recombinant protein | Recombinant human insulin | Sigma | Cat. #: 407,709 | |
| Commercial assay or kit | NEFA LabAssay | Wako Diagnostics | Cat. #: 294–63601 | |
| Chemical compound, drug | Liberase TL | Roche | Cat. #: 05401020001 | |
| Chemical compound, drug | Dexamethasone | Sigma | Cat. #: D4902 | |
| Chemical compound, drug | Indomethacin | Sigma | Cat. #: I8280 | |
| Chemical compound, drug | 3-isobutyl-1-methylxanthine (IBMX) | Sigma | Cat. #: I7018 | |
| Chemical compound, drug | BODIPY 493/503 | ThermoFisher | Cat. #: D3922 | |
| Software, algorithm | Aperio ImageScope | Leica |
Additional files
-
Supplementary file 1
Weight loss in EGFRI-related clinical trials.
- https://cdn.elifesciences.org/articles/72443/elife-72443-supp1-v1.docx
-
Supplementary file 2
Blood cell analysis of Vehicle and HFD rats.
WBC: white blood cells. W-SCR: WBC-small cell ratio. W-MCR: WBC-middle cell ratio. W-LCR: WBC-large cell ratio. W-SCC: WBC-small cell count. WBC-MCC: WBC-middle cell count. WBC-LCC: WBC-large cell count. RBC: red blood cells. HGB: Haemohlobin. HCT: Haematocrit. MCV: Mean corpuscular volume. MCH: Mean corpuscular haemoglobin. MCHC: Mean corpuscular haemoglobin concentration. RDW-SD: RBC-distribution width standard deviation. RDW-CV: RBC-distribution width variation coefficient. PLT: Platelets. PDW: Platelets distribution width. MPV: Mean platelet volume. P-LCR: Platelet large cell ratio. Data are presented as the means ± SEM. P < 0.05 using 2-tailed unpaired Student’s t test.
- https://cdn.elifesciences.org/articles/72443/elife-72443-supp2-v1.xlsx
-
Supplementary file 3
Blood cell analysis of Vehicle and DCA rats.
WBC: white blood cells. W-SCR: WBC-small cell ratio. W-MCR: WBC-middle cell ratio. W-LCR: WBC-large cell ratio. W-SCC: WBC-small cell count. WBC-MCC: WBC-middle cell count. WBC-LCC: WBC-large cell count. RBC: red blood cells. HGB: Haemohlobin. HCT: Haematocrit. MCV: Mean corpuscular volume. MCH: Mean corpuscular haemoglobin. MCHC: Mean corpuscular haemoglobin concentration. RDW-SD: RBC-distribution width standard deviation. RDW-CV: RBC-distribution width variation coefficient. PLT: Platelets. PDW: Platelets distribution width. MPV: Mean platelet volume. P-LCR: Platelet large cell ratio. Data are presented as the means ± SEM. P < 0.05 using 2-tailed unpaired Student’s t test.
- https://cdn.elifesciences.org/articles/72443/elife-72443-supp3-v1.xlsx
-
Supplementary file 4
Primer sequence information.
- https://cdn.elifesciences.org/articles/72443/elife-72443-supp4-v1.docx
-
Transparent reporting form
- https://cdn.elifesciences.org/articles/72443/elife-72443-transrepform1-v1.docx
Download links
A two-part list of links to download the article, or parts of the article, in various formats.
Downloads (link to download the article as PDF)
Open citations (links to open the citations from this article in various online reference manager services)
Cite this article (links to download the citations from this article in formats compatible with various reference manager tools)
Remodeling of dermal adipose tissue alleviates cutaneous toxicity induced by anti-EGFR therapy
eLife 11:e72443.
https://doi.org/10.7554/eLife.72443


