Disease consequences of higher adiposity uncoupled from its adverse metabolic effects using Mendelian randomisation
- Institute of Biomedical and Clinical Science, University of Exeter Medical School, Research, Innovation, Learning and Development building, Royal Devon & Exeter Hospital, United Kingdom
- Research Centre for Optimal Health, School of Life Sciences, University of Westminster, United Kingdom
- Department of Cardiovascular Sciences, University of Leicester, United Kingdom
- NIHR Leicester Biomedical Research Centre, United Kingdom
- Department of Dermatology, University of Michigan, United States
- Ann Arbor Veterans Affairs Hospital, United States
- The Institute of Cancer Research, United Kingdom
- Department of Emergency Medicine, Massachusetts General Hospital, United States
- Department of Emergency Medicine, Harvard Medical School, United States
- Nutrition and Metabolism Branch, International Agency for Research on Cancer, France
- MRC Integrative Epidemiology Unit at the University of Bristol, United Kingdom
- Population Health Sciences, Bristol Medical School, University of Bristol, United Kingdom
- School of Cellular and Molecular Medicine, University of Bristol, United Kingdom
- Institute of Cardiovascular and Medical Sciences, University of Glasgow, United Kingdom
- University of Edinburgh, United Kingdom
- Western General Hospital, United Kingdom
- Edinburgh Cancer Research Centre, IGMM, University of Edinburgh, United Kingdom
- Department of Epidemiology, University of Washington, United States
- Division of Public Health Sciences, Fred Hutchinson Cancer Research Center, United States
- Centre for Inflammation Research and Translational Medicine (CIRTM), Department of Life Sciences, Brunel University London, United Kingdom
Figures
Figure 1
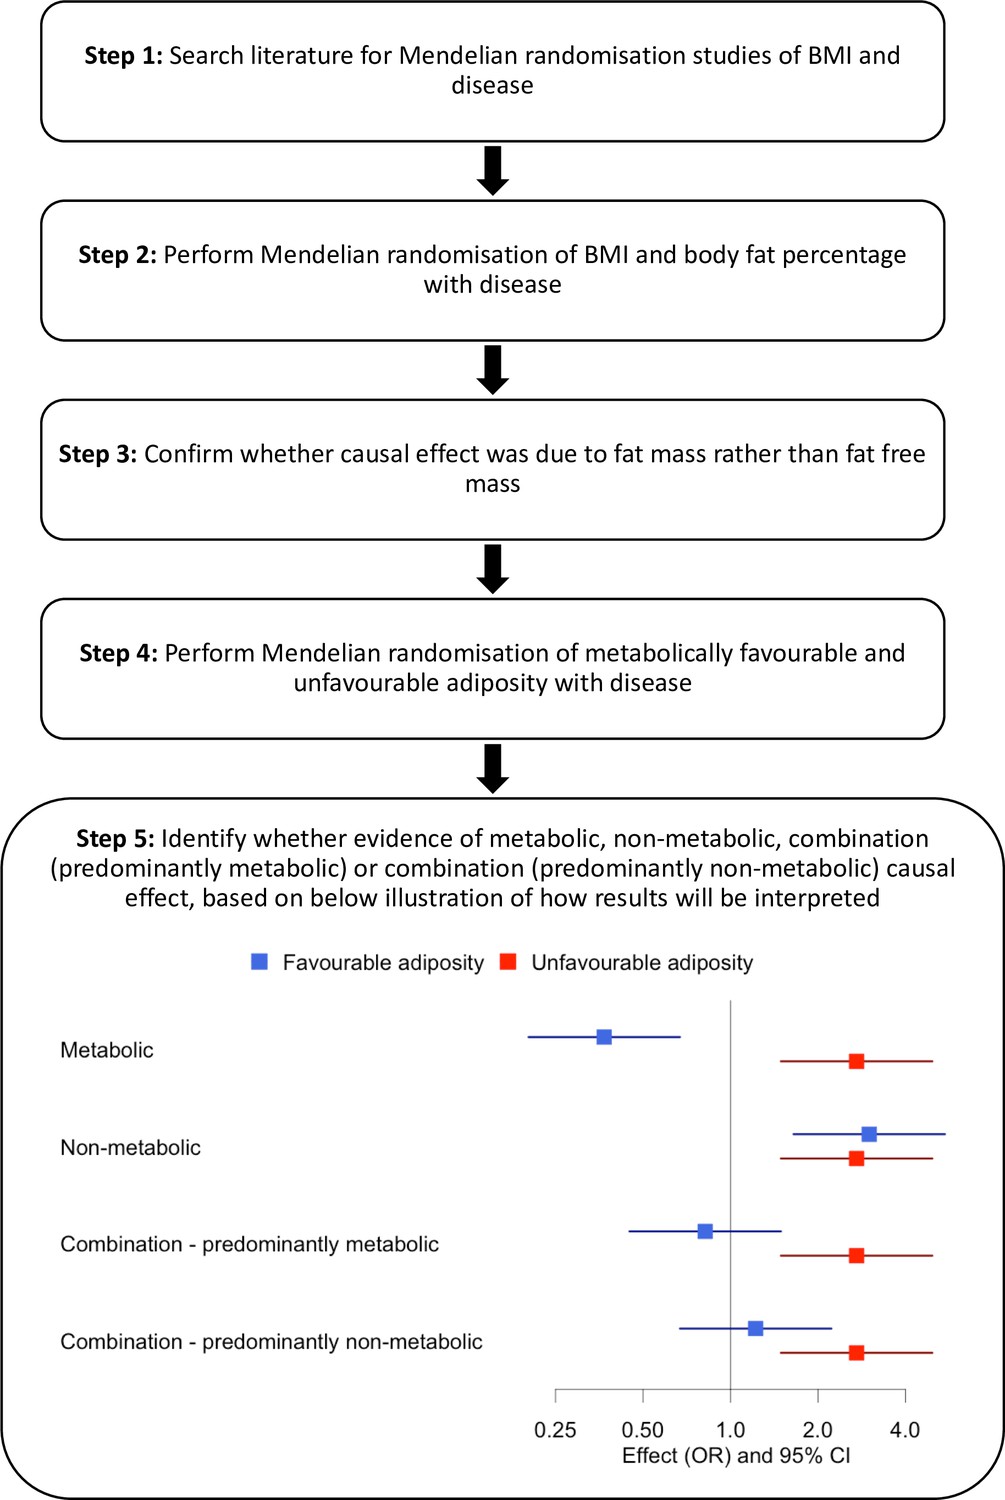
Study design.
Figure 2
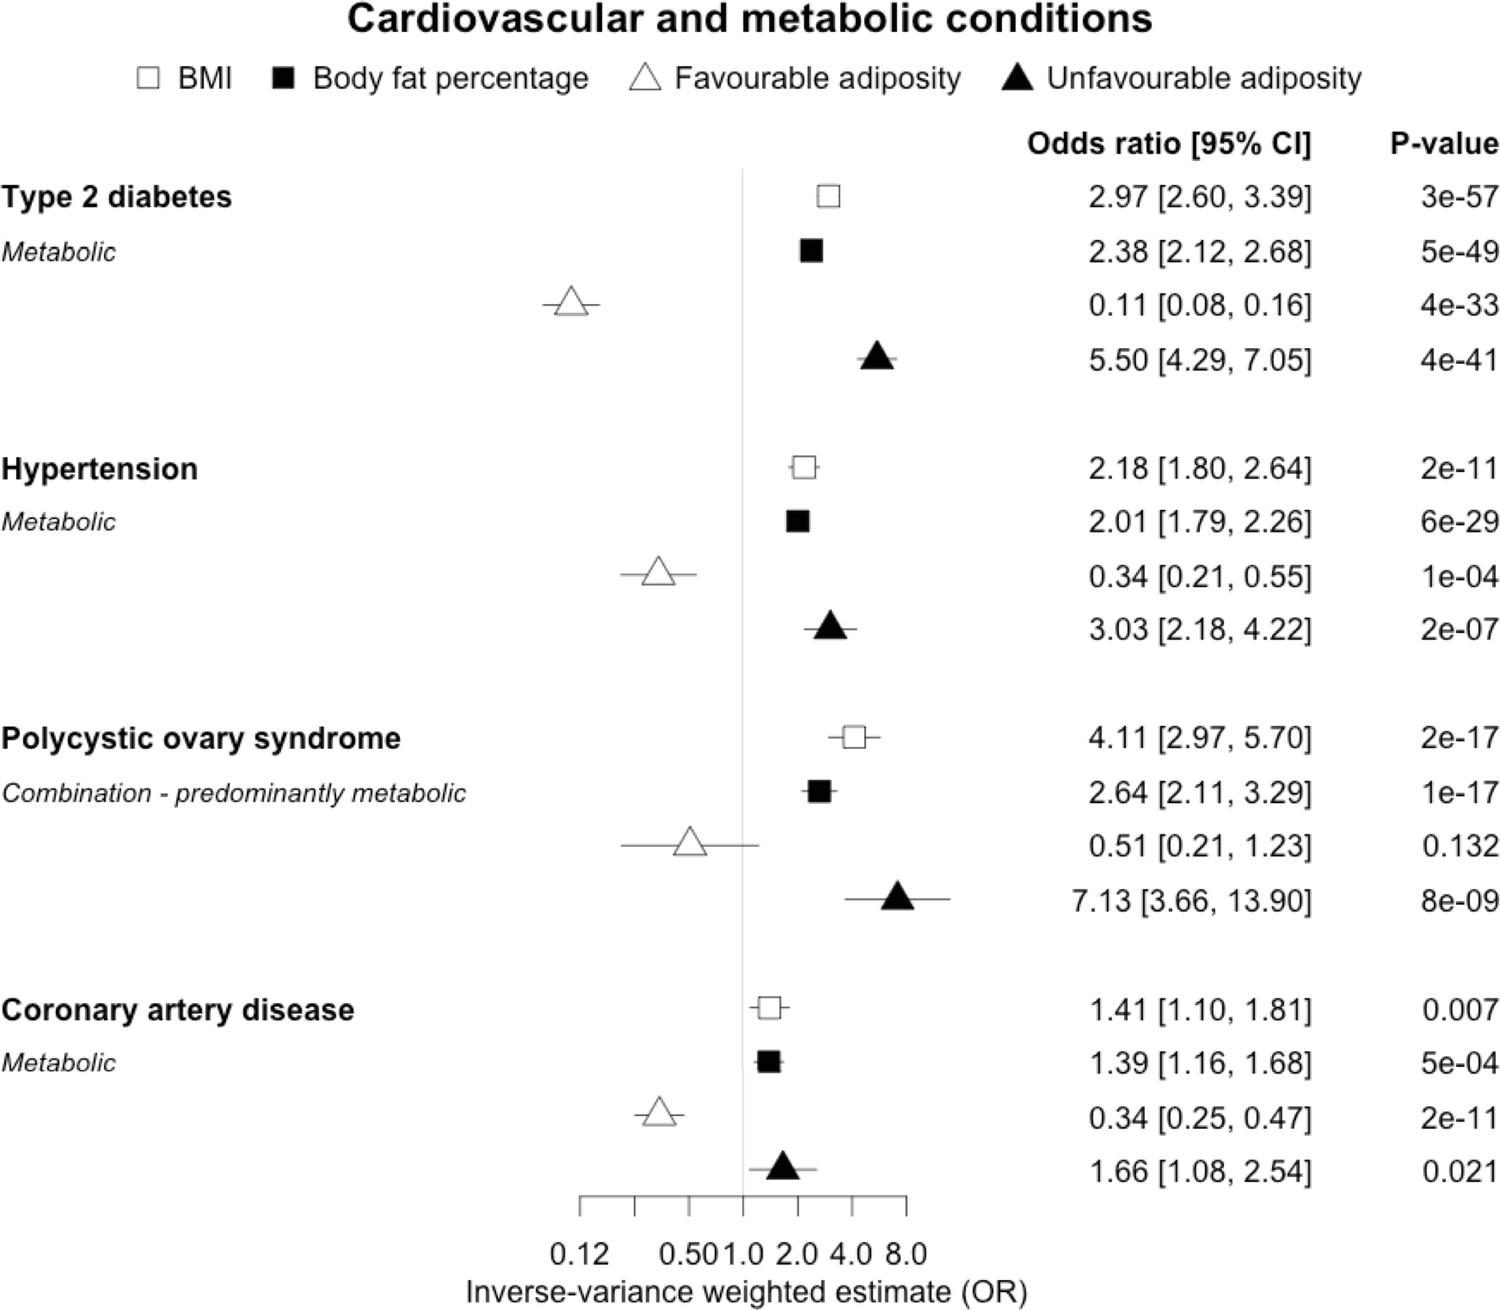
The inverse-variance weighted (IVW) two-sample MR analysis/meta-analysis of the effects of body mass index (BMI), body fat percentage (BFP), “favourable adiposity” (FA) and “unfavourable adiposity” (UFA) on type 2 diabetes, hypertension, polycystic ovary syndrome and coronary artery disease.
The error bars represent the 95% confidence intervals of the IVW estimates in odds ratio per standard deviation change in genetically determined BMI, body fat percentage, FA and UFA. Italics give our best interpretation of the data using the FDR 0.1 results.
Figure 3 with 1 supplement
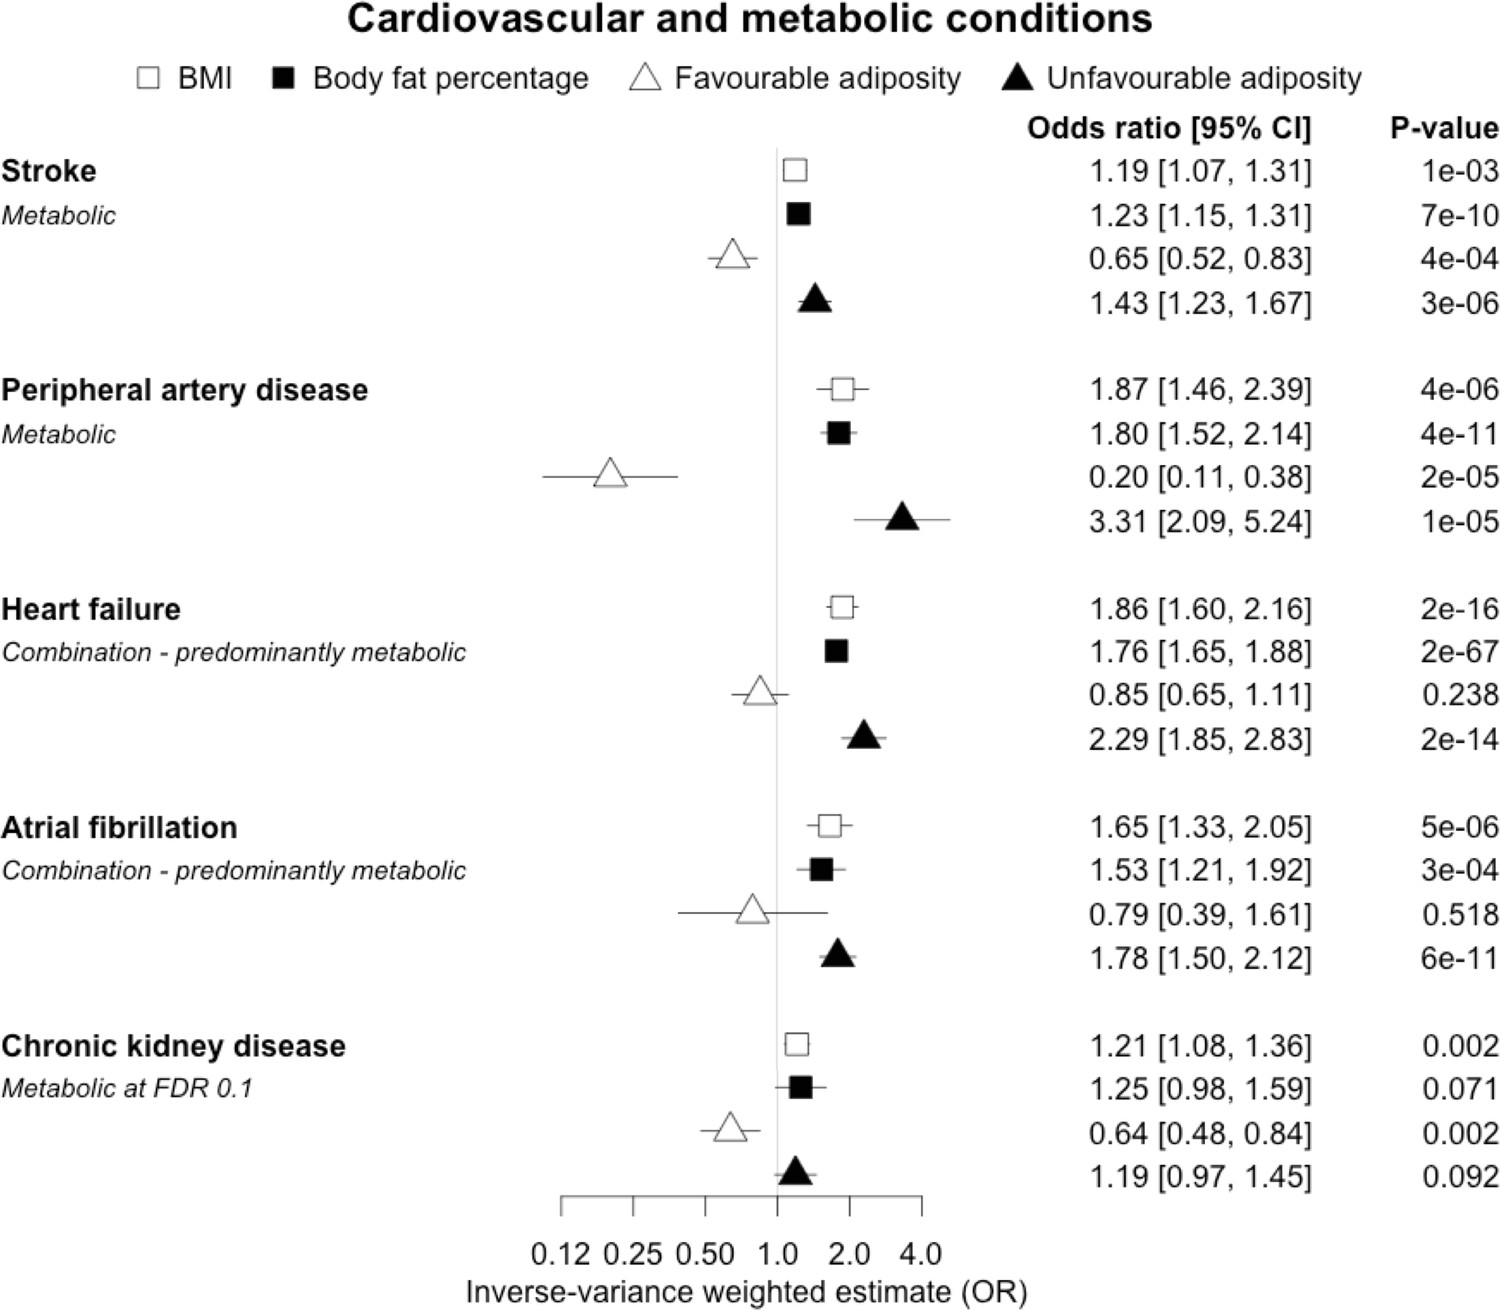
The inverse-variance weighted (IVW) two-sample MR analysis/meta-analysis of the effects of body mass index (BMI), body fat percentage (BFP), “favourable adiposity” (FA) and “unfavourable adiposity” (UFA) on stroke, peripheral artery disease, heart failure, atrial fibrillation and chronic kidney disease.
The error bars represent the 95% confidence intervals of the IVW estimates in odds ratio per standard deviation change in genetically determined BMI, body fat percentage, FA and UFA. Italics give our best interpretation of the data using the FDR 0.1 results.
Figure 3—figure supplement 1
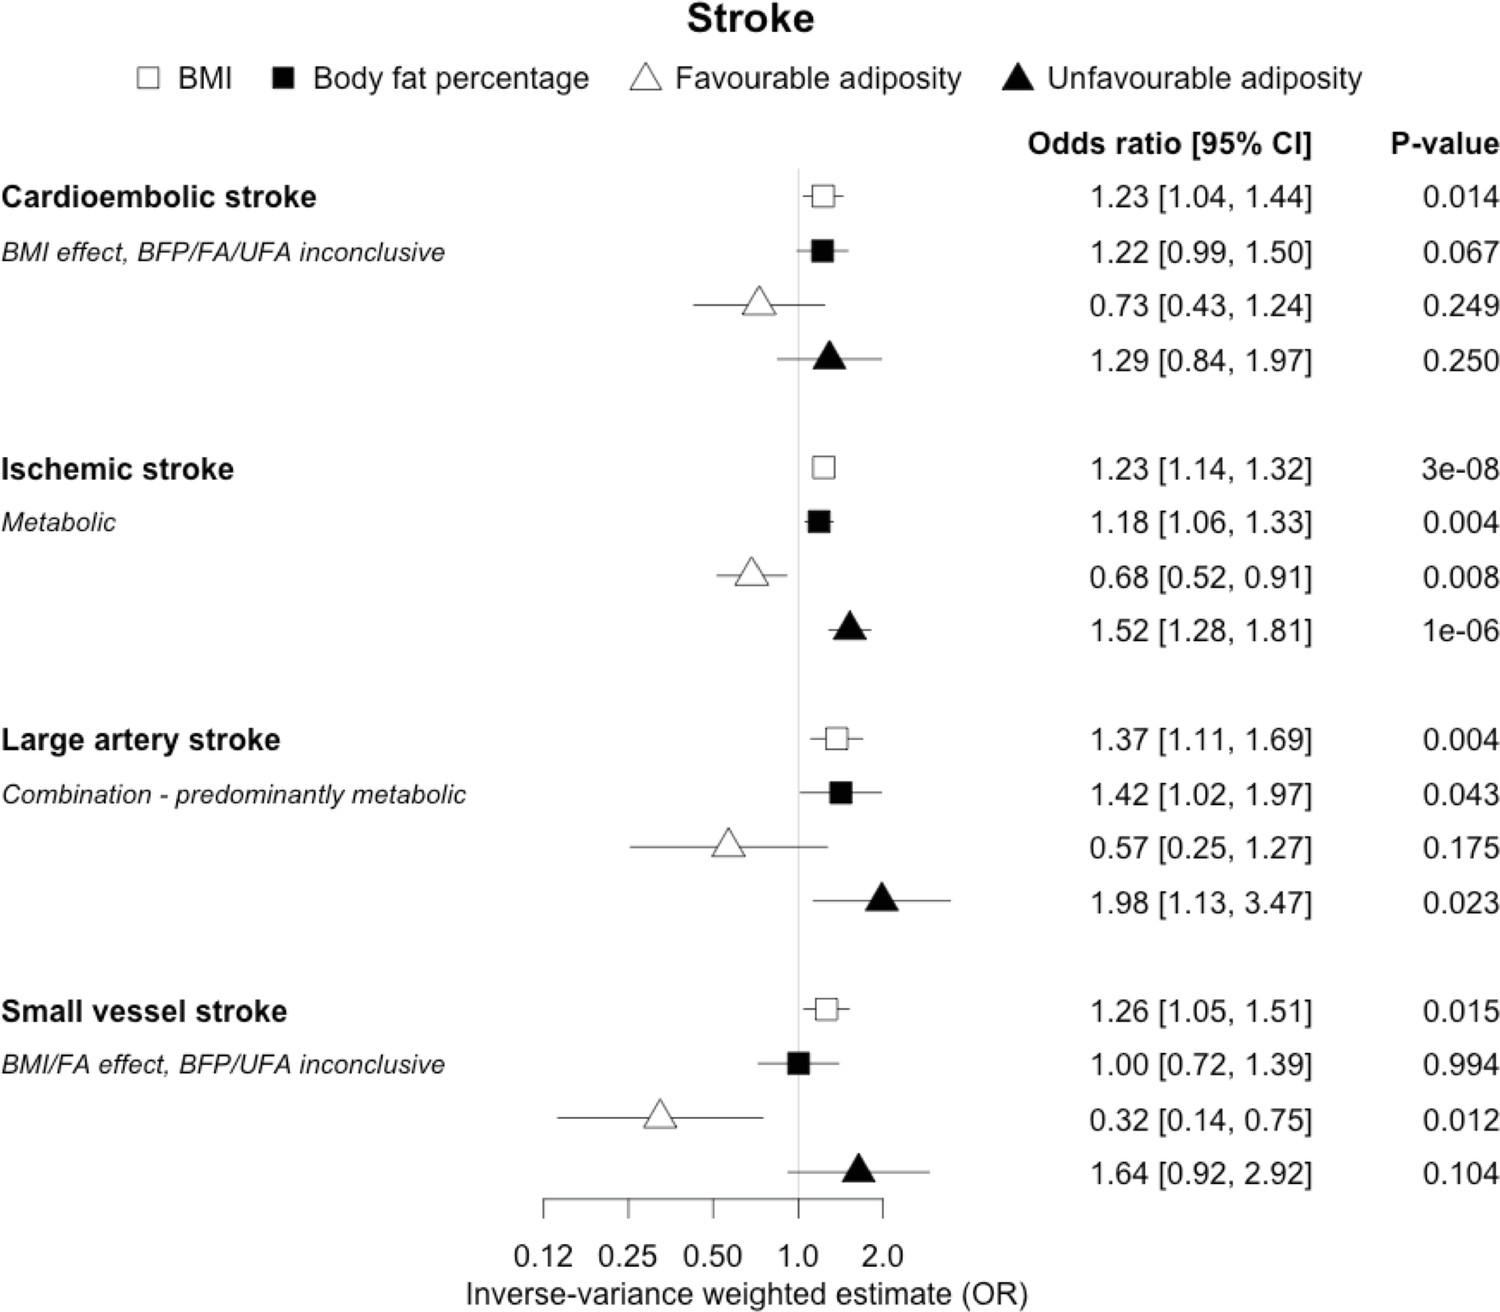
The inverse-variance weighted (IVW) two-sample MR analysis/meta-analysis of the effects of body mass index (BMI), body fat percentage (BFP), “favourable adiposity” (FA) and “unfavourable adiposity” (UFA) on sub-types of stroke.
The error bars represent the 95% confidence intervals of the IVW estimates in odds ratio per standard deviation change in genetically determined BMI, body fat percentage, FA and UFA. Italics give our best interpretation of the data using the confidence intervals.
Figure 4
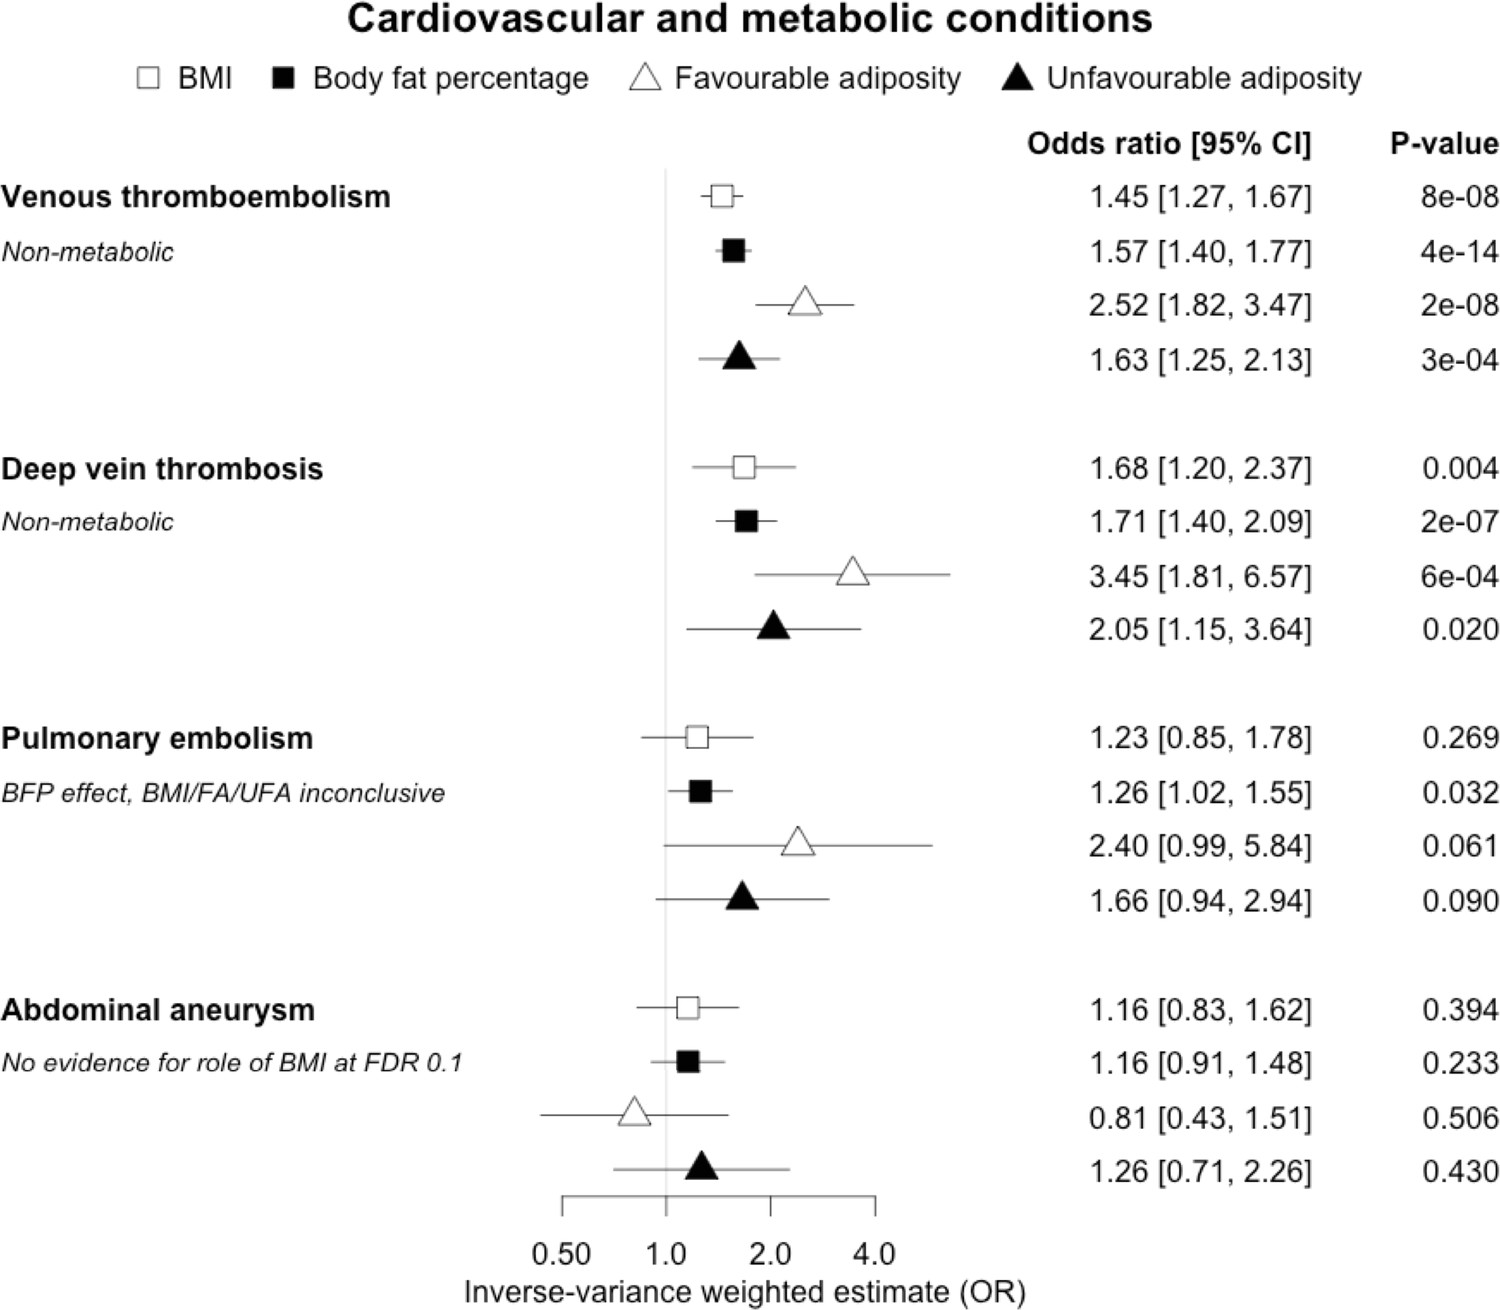
The inverse-variance weighted (IVW) two-sample MR analysis/meta-analysis of the effects of body mass index (BMI), body fat percentage (BFP), “favourable adiposity” (FA) and “unfavourable adiposity” (UFA) on venous thromboembolism, deep vein thrombosis, pulmonary embolism and abdominal aneurysm.
The error bars represent the 95% confidence intervals of the IVW estimates in odds ratio per standard deviation change in genetically determined BMI, body fat percentage, FA and UFA. Italics give our best interpretation of the data using the FDR 0.1 results.
Figure 5 with 1 supplement
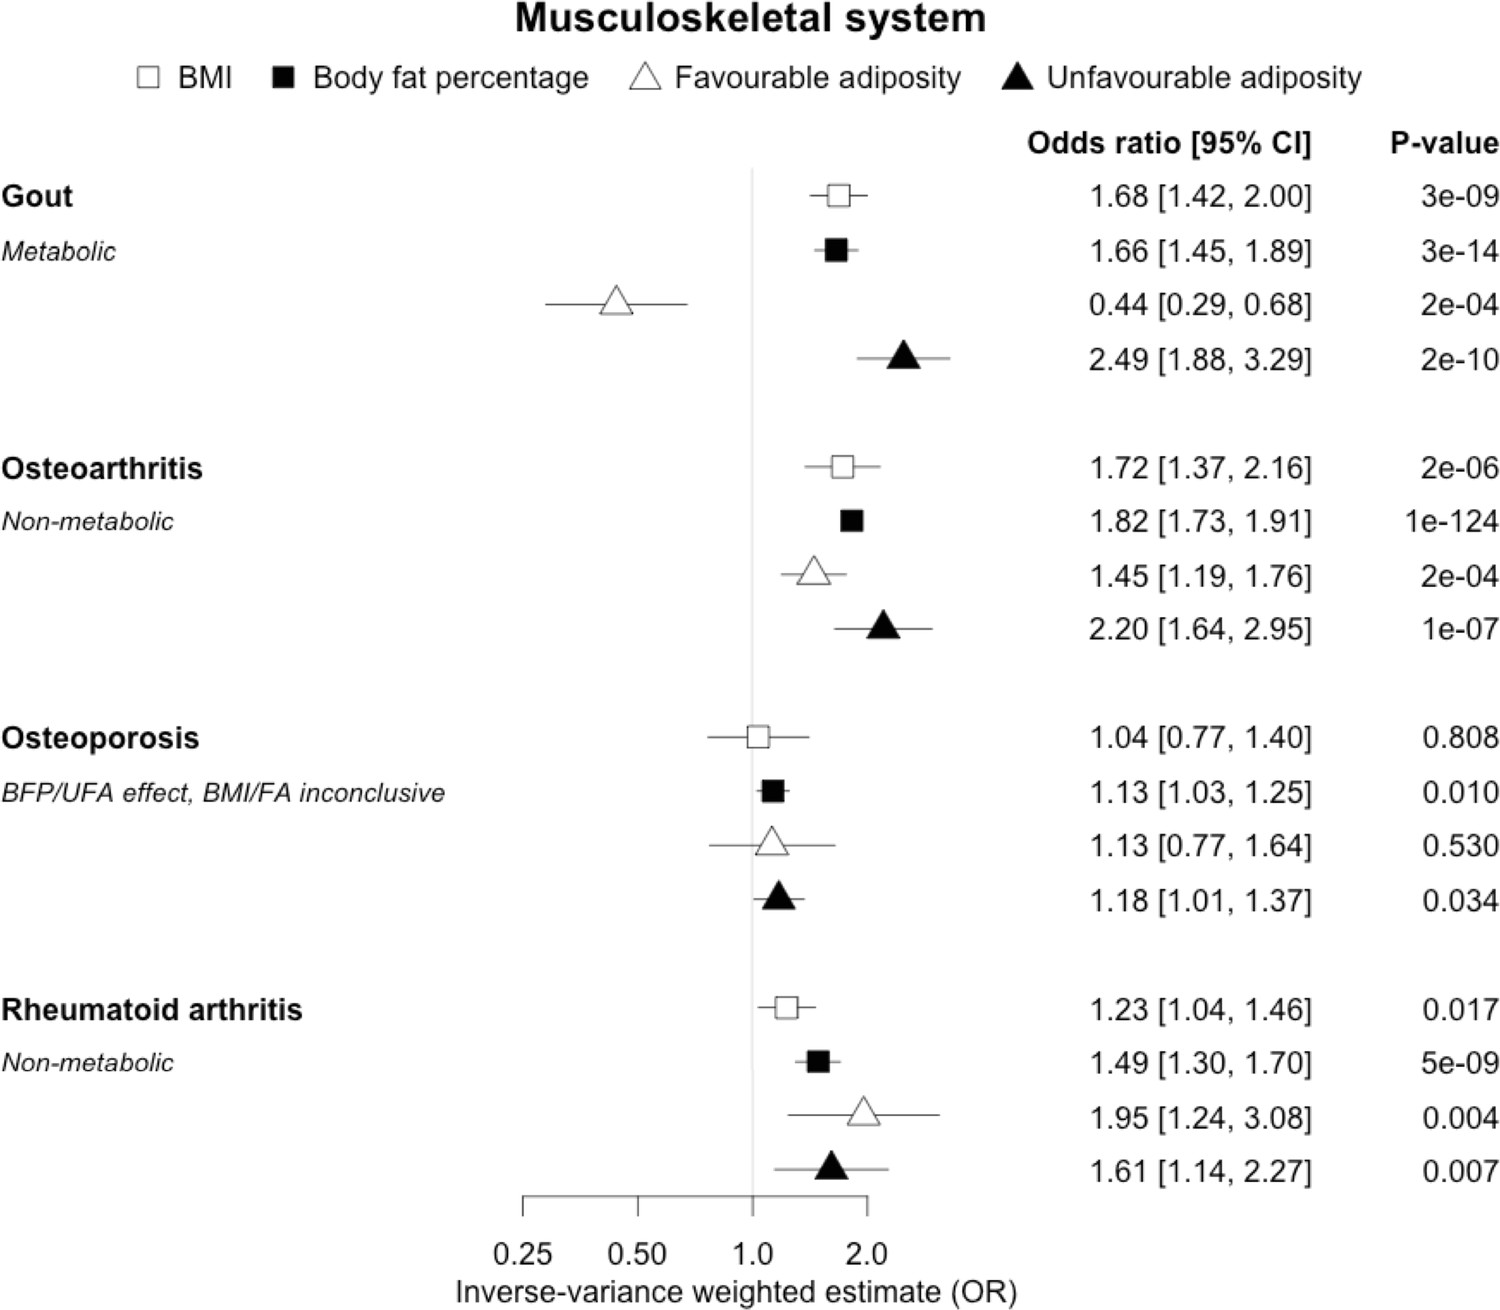
The inverse-variance weighted (IVW) two-sample MR analysis/meta-analysis of the effects of body mass index (BMI), body fat percentage (BFP), “favourable adiposity” (FA) and “unfavourable adiposity” (UFA) on gout, osteoarthritis, osteoporosis and rheumatoid arthritis.
The error bars represent the 95% confidence intervals of the IVW estimates in odds ratio per standard deviation change in genetically determined BMI, body fat percentage, FA and UFA. Italics give our best interpretation of the data using the FDR 0.1 results.
Figure 5—figure supplement 1
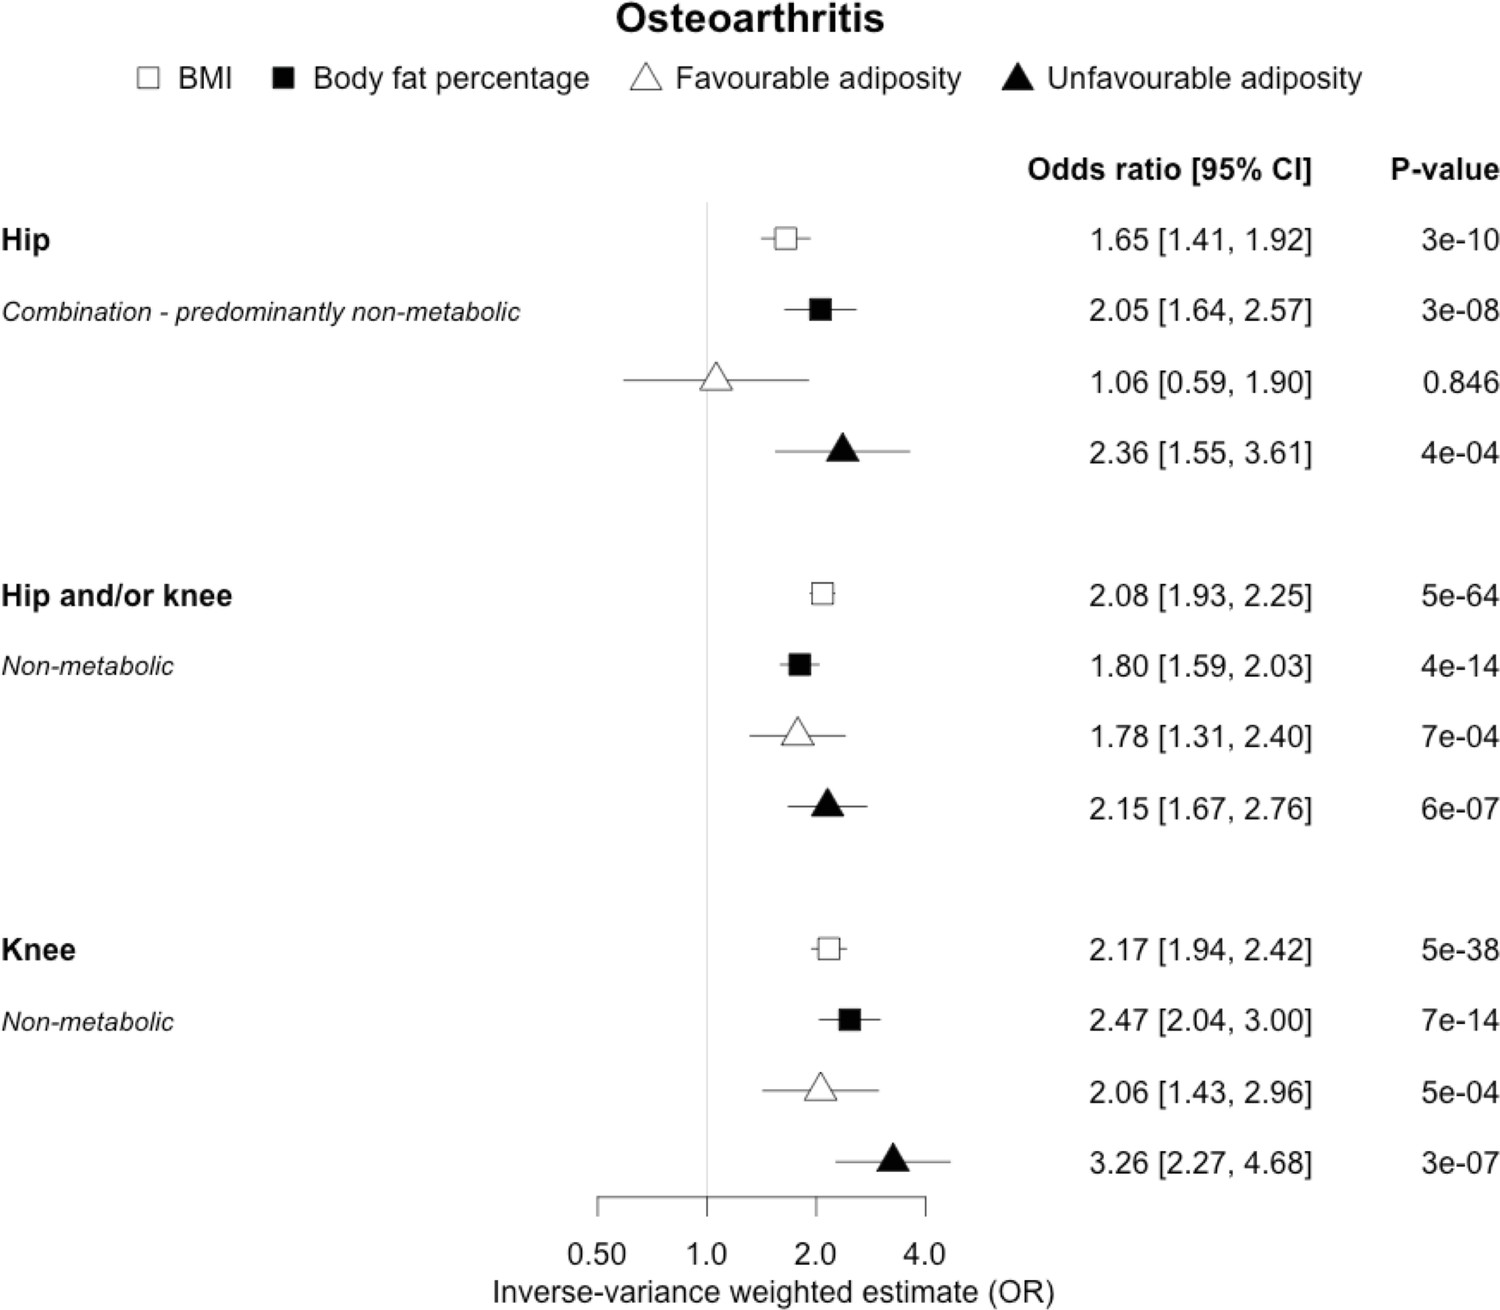
The inverse-variance weighted (IVW) two-sample MR analysis/meta-analysis of the effects of body mass index (BMI), body fat percentage (BFP), “favourable adiposity” (FA) and “unfavourable adiposity” (UFA) on sub-types of osteoarthritis.
The error bars represent the 95% confidence intervals of the IVW estimates in odds ratio per standard deviation change in genetically determined BMI, body fat percentage, FA and UFA. Italics give our best interpretation of the data using the confidence intervals.
Figure 6

The inverse-variance weighted (IVW) two-sample MR analysis/meta-analysis of the effects of body mass index (BMI), body fat percentage (BFP), “favourable adiposity” (FA) and “unfavourable adiposity” (UFA) on gallstones and gastro-oesophageal reflux disease.
The error bars represent the 95% confidence intervals of the IVW estimates in odds ratio per standard deviation change in genetically determined BMI, body fat percentage, FA and UFA. Italics give our best interpretation of the data using the FDR 0.1 results.
Figure 7

The inverse-variance weighted (IVW) two-sample MR analysis/meta-analysis of the effects of body mass index (BMI), body fat percentage (BFP), “favourable adiposity” (FA) and “unfavourable adiposity” (UFA) on Alzheimer’s disease, depression, multiple sclerosis and Parkinson’s disease.
The error bars represent the 95% confidence intervals of the IVW estimates in odds ratio per standard deviation change in genetically determined BMI, body fat percentage, FA and UFA. Italics give our best interpretation of the data using the FDR 0.1 results.
Figure 8
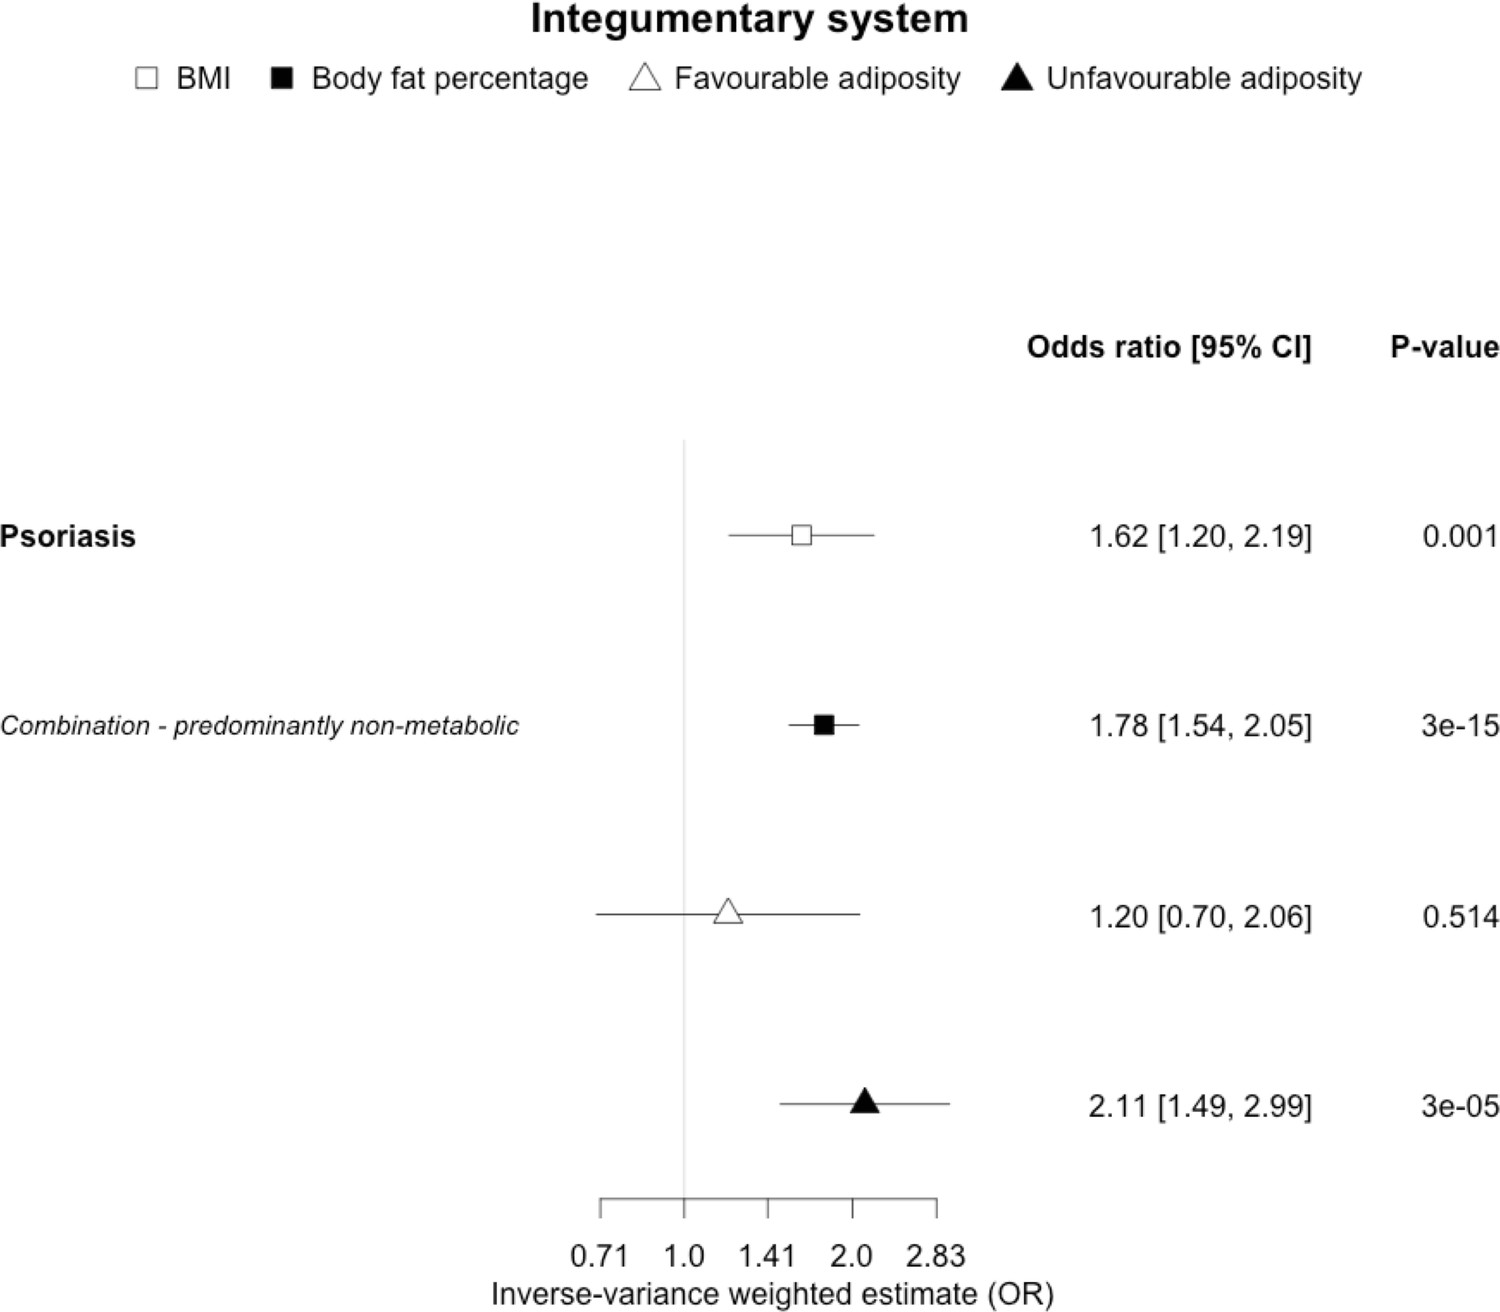
The inverse-variance weighted (IVW) two-sample MR analysis/meta-analysis of the effects of body mass index (BMI), body fat percentage (BFP), “favourable adiposity” (FA) and “unfavourable adiposity” (UFA) on psoriasis.
The error bars represent the 95% confidence intervals of the IVW estimates in odds ratio per standard deviation change in genetically determined BMI, body fat percentage, FA and UFA. Italics give our best interpretation of the data using the FDR 0.1 results.
Figure 9 with 1 supplement
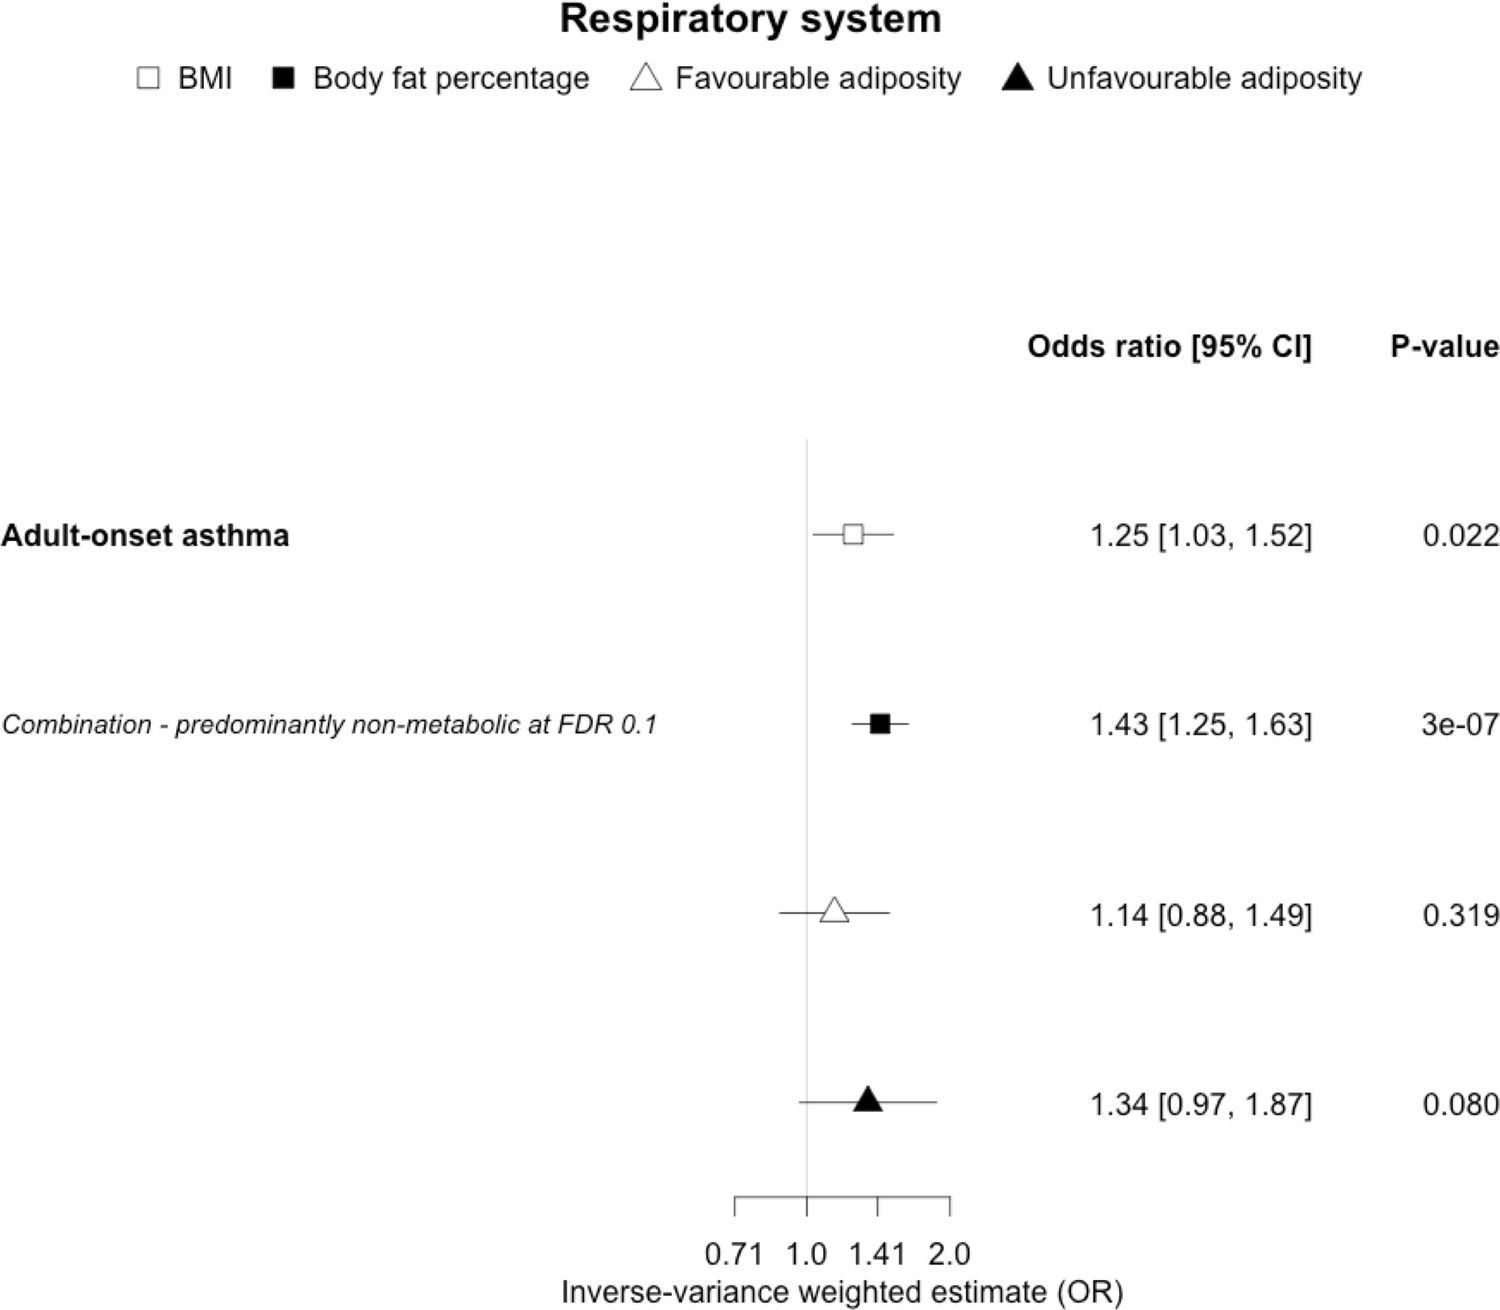
The inverse-variance weighted (IVW) two-sample MR analysis/meta-analysis of the effects of body mass index (BMI), body fat percentage (BFP), “favourable adiposity” (FA) and “unfavourable adiposity” (UFA) on adult-onset asthma.
The error bars represent the 95% confidence intervals of the IVW estimates in odds ratio per standard deviation change in genetically determined BMI, body fat percentage, FA and UFA. Italics give our best interpretation of the data using the FDR 0.1 results.
Figure 9—figure supplement 1

The inverse-variance weighted (IVW) two-sample MR analysis/meta-analysis of the effects of body mass index (BMI), body fat percentage (BFP), “favourable adiposity” (FA) and “unfavourable adiposity” (UFA) on sub-types of asthma.
The error bars represent the 95% confidence intervals of the IVW estimates in odds ratio per standard deviation change in genetically determined BMI, body fat percentage, FA and UFA. Italics give our best interpretation of the data using the confidence intervals (†or FDR 0.1 results).
Figure 10 with 1 supplement

The inverse-variance weighted (IVW) two-sample MR analysis/meta-analysis of the effects of body mass index (BMI), body fat percentage (BFP), “favourable adiposity” (FA) and “unfavourable adiposity” (UFA) on Barrett’s oesophagus, breast cancer, cancer myeloma and colorectal cancer.
The error bars represent the 95% confidence intervals of the IVW estimates in odds ratio per standard deviation change in genetically determined BMI, body fat percentage, FA and UFA. Italics give our best interpretation of the data using the FDR 0.1 results.
Figure 10—figure supplement 1

The inverse-variance weighted (IVW) two-sample MR analysis/meta-analysis of the effects of body mass index (BMI), body fat percentage (BFP), “favourable adiposity” (FA) and “unfavourable adiposity” (UFA) on sub-types of colorectal cancer.
The error bars represent the 95% confidence intervals of the IVW estimates in odds ratio per standard deviation change in genetically determined BMI, body fat percentage, FA and UFA. *Interpretations are limited to FA and UFA because SNPs were not available from the full BMI and body fat percentage list for this dataset. Italics give our best interpretation of the data using the confidence intervals.
Figure 11 with 2 supplements
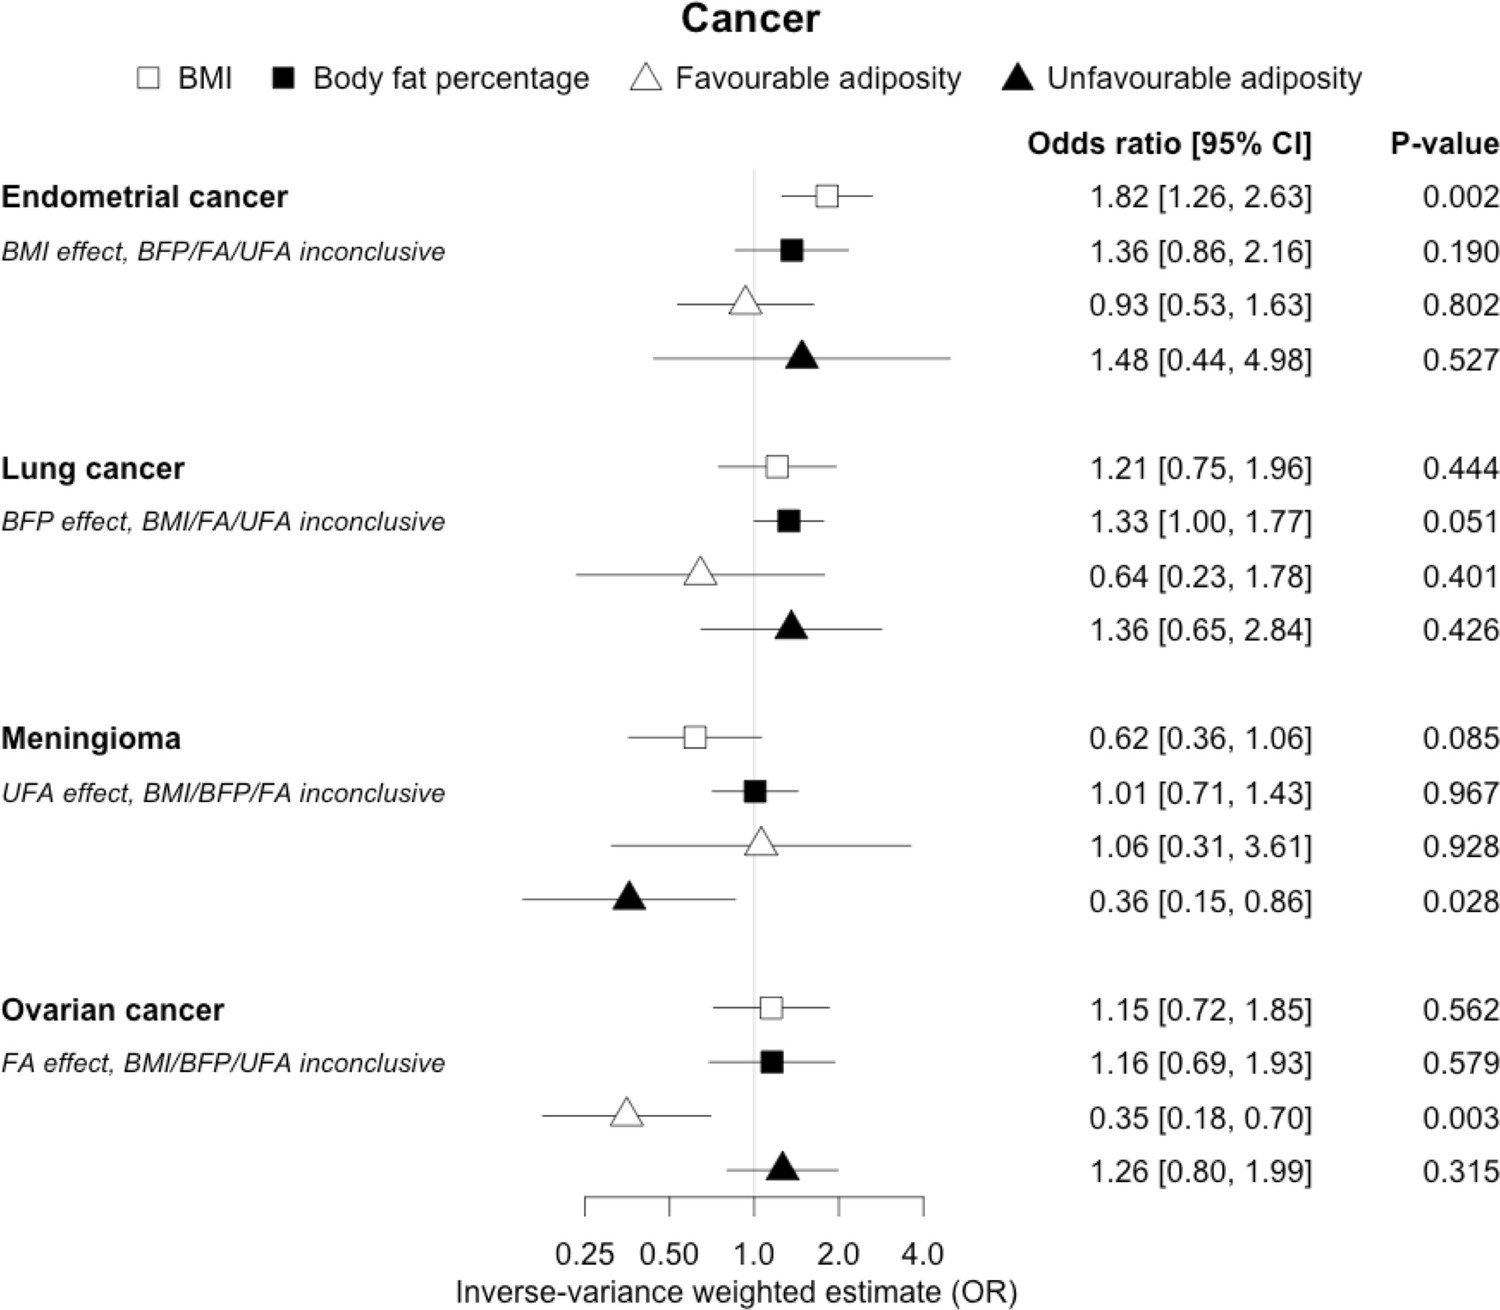
The inverse-variance weighted (IVW) two-sample MR analysis/meta-analysis of the effects of body mass index (BMI), body fat percentage (BFP), “favourable adiposity” (FA) and “unfavourable adiposity” (UFA) on endometrial and lung cancer, meningioma and ovarian cancer.
The error bars represent the 95% confidence intervals of the IVW estimates in odds ratio per standard deviation change in genetically determined BMI, body fat percentage, FA and UFA. Italics give our best interpretation of the data using the FDR 0.1 results.
Figure 11—figure supplement 1
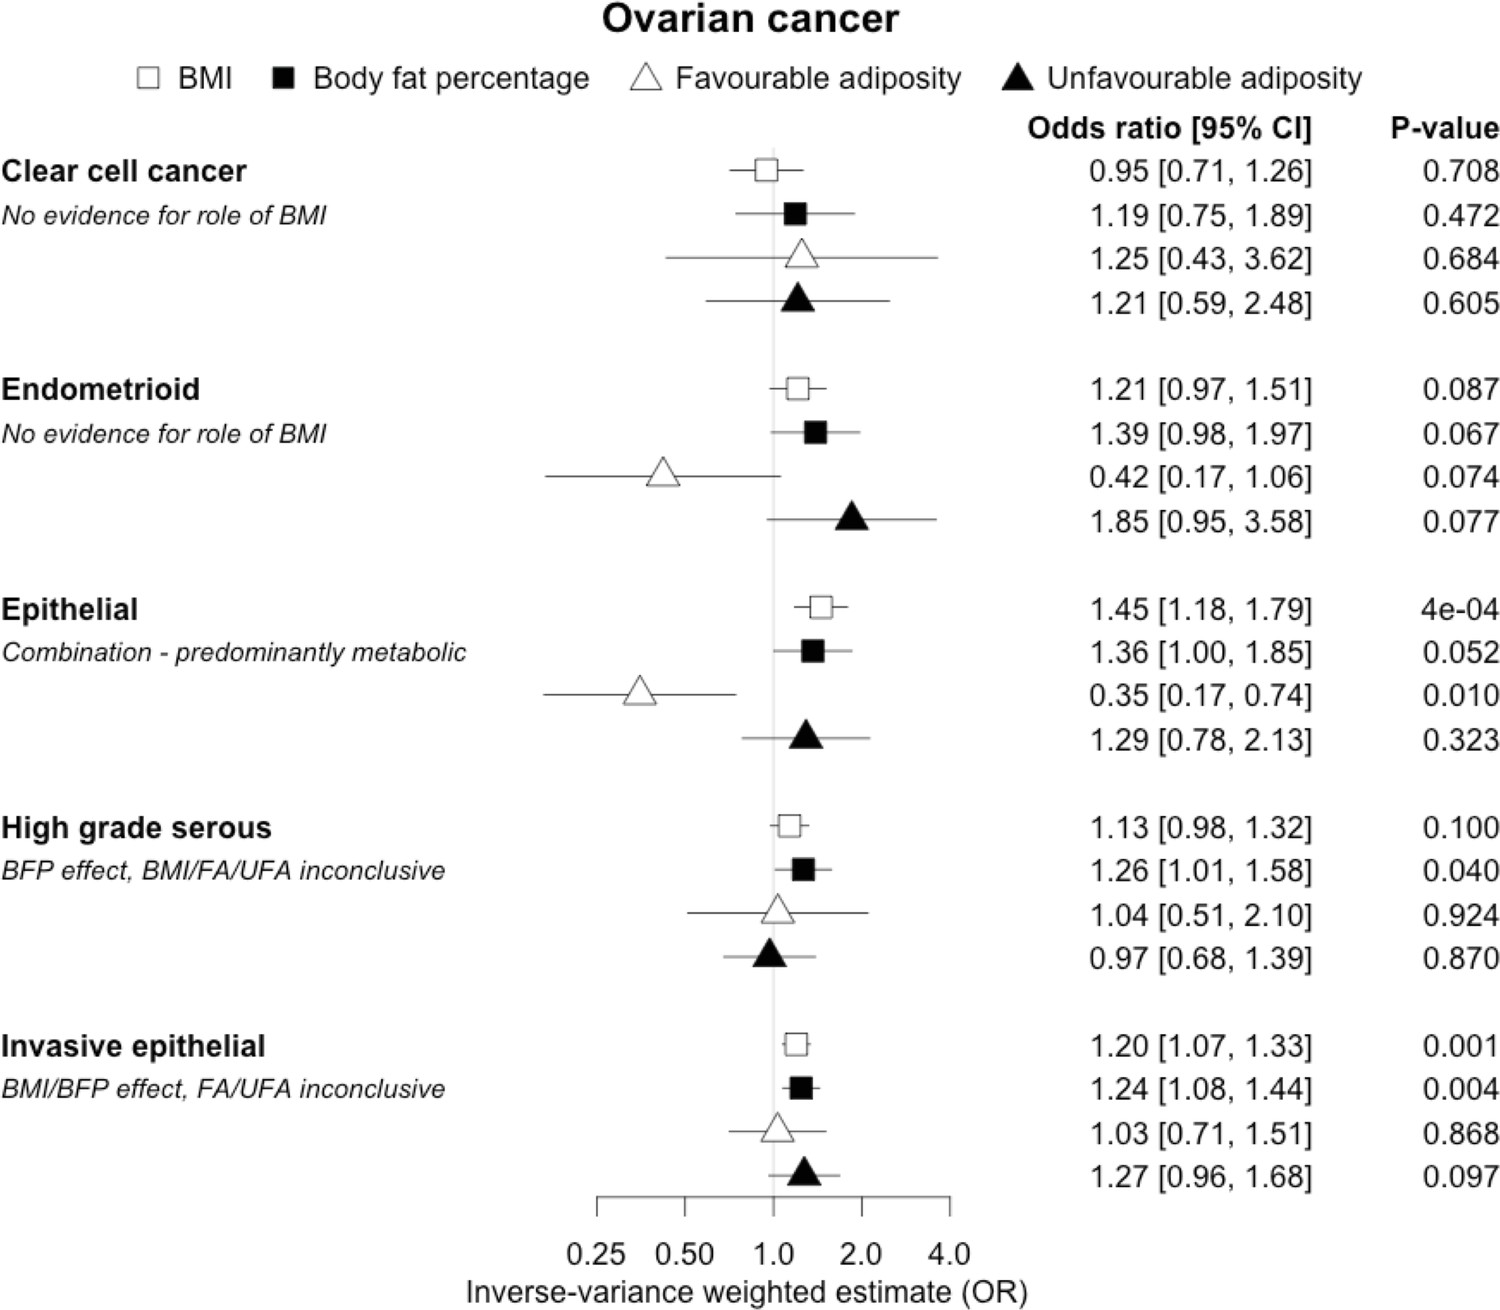
The inverse-variance weighted (IVW) two-sample MR analysis/meta-analysis of the effects of body mass index (BMI), body fat percentage (BFP), “favourable adiposity” (FA) and “unfavourable adiposity” (UFA) on 5 sub-types of ovarian cancer.
The error bars represent the 95% confidence intervals of the IVW estimates in odds ratio per standard deviation change in genetically determined BMI, body fat percentage, FA and UFA. Italics give our best interpretation of the data using the confidence intervals.
Figure 11—figure supplement 2
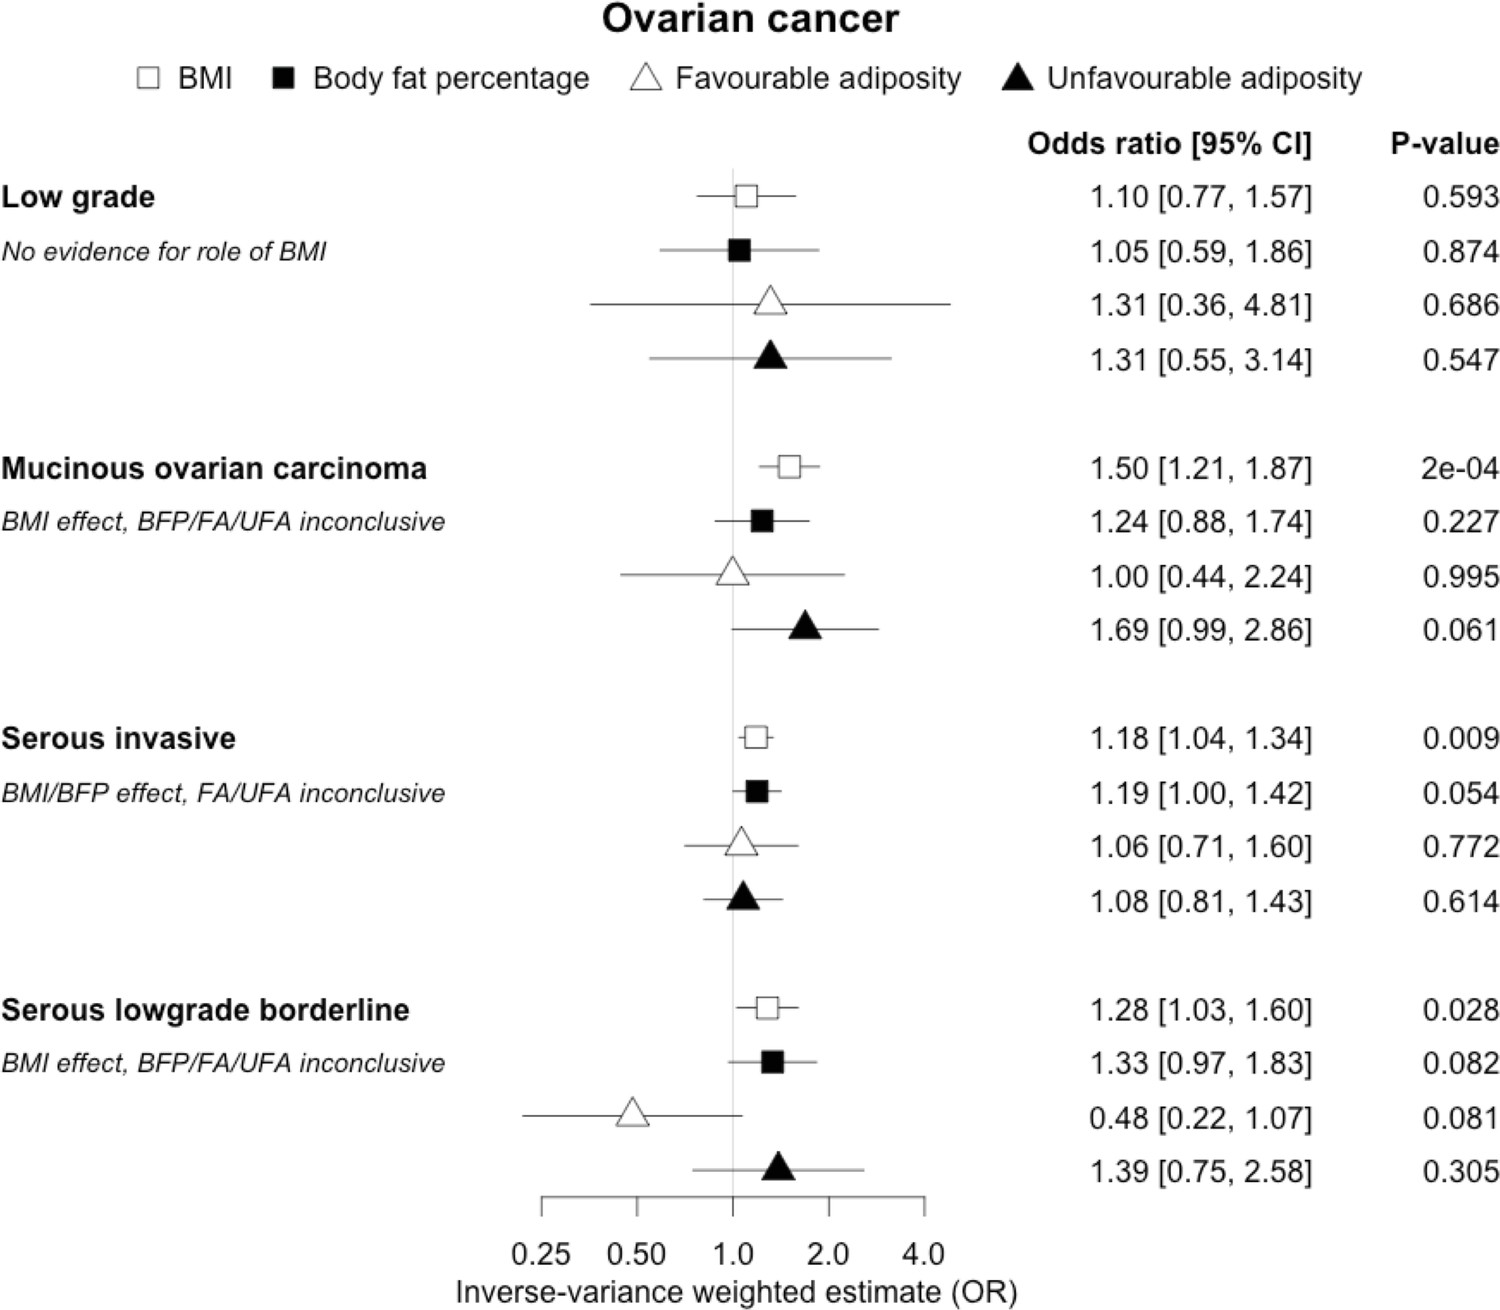
The inverse-variance weighted (IVW) two-sample MR analysis/meta-analysis of the effects of body mass index (BMI), body fat percentage (BFP), “favourable adiposity” (FA) and “unfavourable adiposity” (UFA) on 4 sub-types of ovarian cancer.
The error bars represent the 95% confidence intervals of the IVW estimates in odds ratio per standard deviation change in genetically determined BMI, body fat percentage, FA and UFA. Italics give our best interpretation of the data using the confidence intervals.
Figure 12
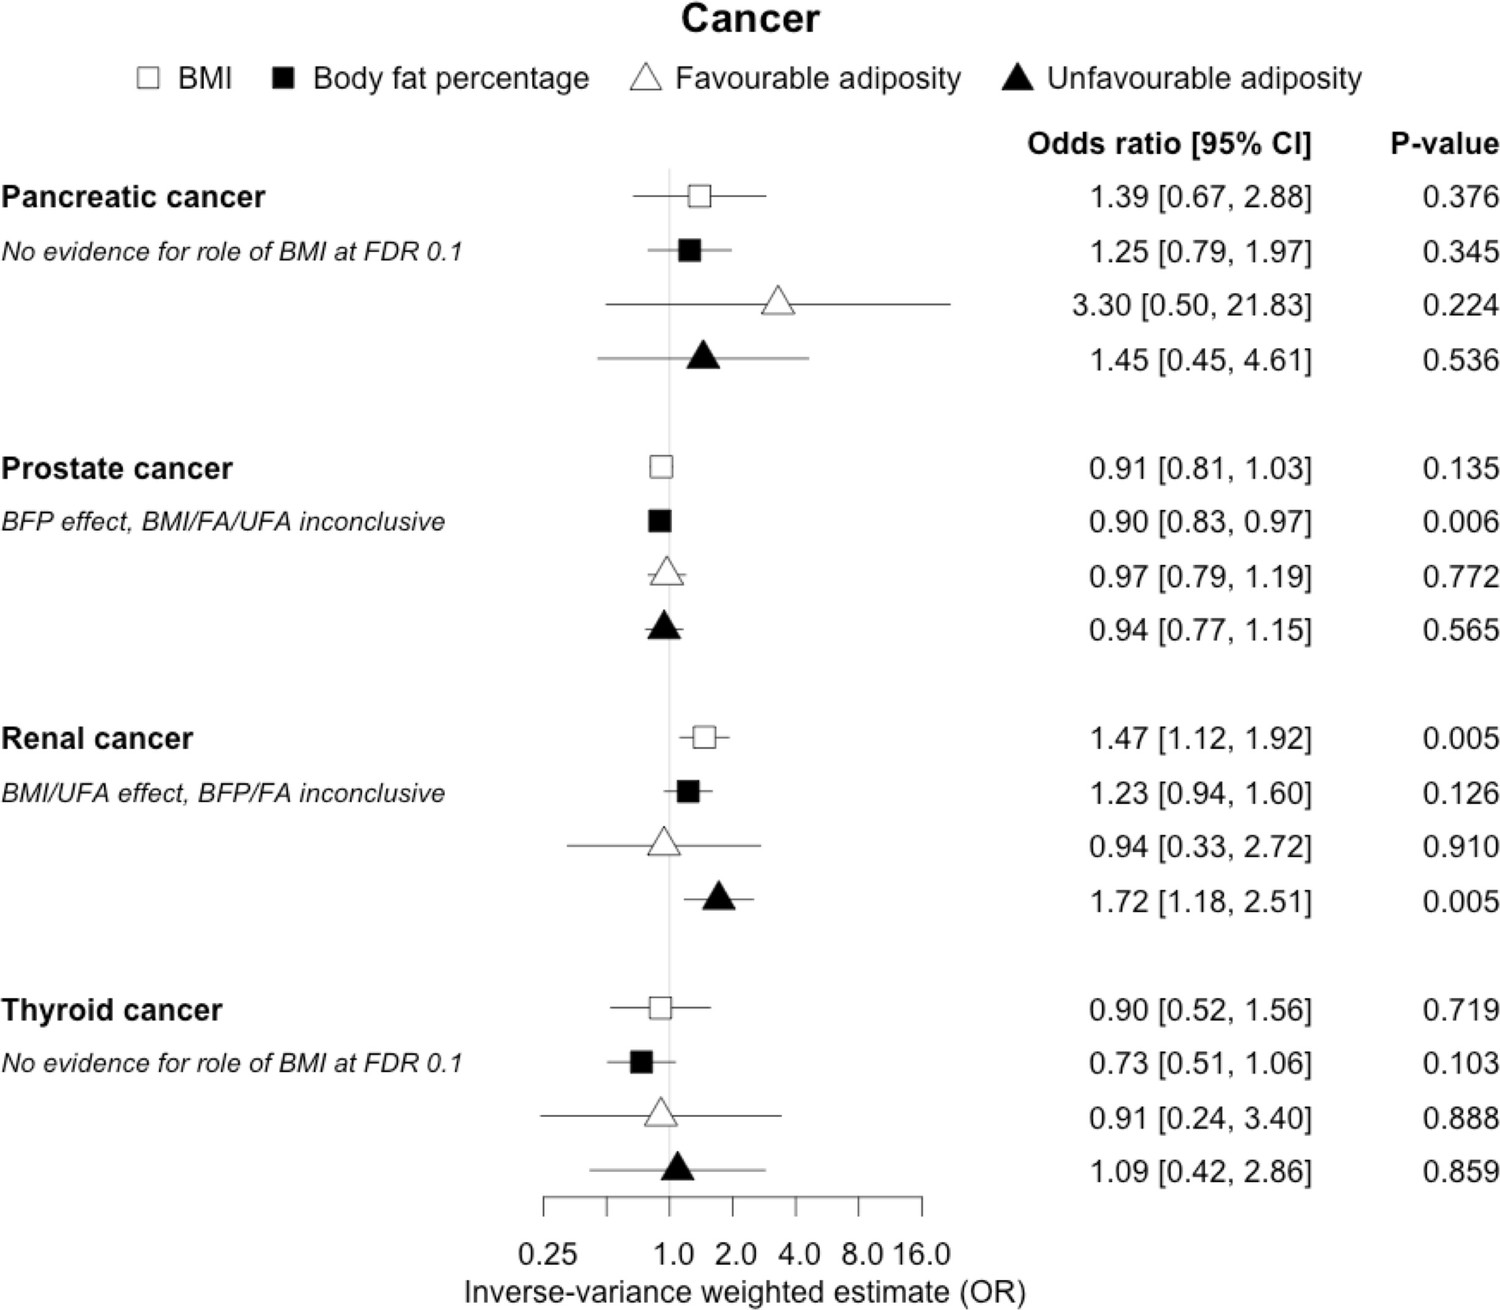
The inverse-variance weighted (IVW) two-sample MR analysis/meta-analysis of the effects of body mass index (BMI), body fat percentage (BFP), “favourable adiposity” (FA) and “unfavourable adiposity” (UFA) on pancreatic, prostate, renal and thyroid cancer.
The error bars represent the 95% confidence intervals of the IVW estimates in odds ratio per standard deviation change in genetically determined BMI, body fat percentage, FA and UFA. Italics give our best interpretation of the data using the FDR 0.1 results.
Additional files
-
Supplementary file 1
Supplementary methods and Mendelian randomisation (MR) results file.
(a) Characterisation of monogenic obesity, lipodystrophy, unfavourable adiposity (UFA), and favourable adiposity (FA) using body fat percentage and a selection of metabolic biomarkers. (b) Mendelian randomisation (MR) studies testing the role of obesity (usually as body mass index [BMI]) identified in literature search. (c) (i) Summary statistics of published genome-wide association studies (GWAS) used. Mean (standard deviation [SD] or range) are given for continuous study characteristics where available, mean ranges are given for meta-analyses unless otherwise specified. *Statistics represent only UK Biobank cohort of those included in meta-analysis. (c) (ii) Summary statistics of FinnGen studies used. Mean age of cases is given where available, BMI is not adjusted for, and UK Biobank is not included in these studies. ICD codes taken from hospital discharge register and/or causes of death register. (c) (iii) Summary statistics of UK Biobank studies used. Mean (SD) are given for continuous study characteristics of cases. Self-report code is from n_20002_* variable in UK Biobank. (d) The summary of 73 BMI and 696 body fat percentage genetic variants, the latter including 36 FA and 38 UFA genetic variants. Beta, SE, and p are from the GWAS of BMI and body fat percentage in UK Biobank, respectively. BMI variants were discovered using non-UK Biobank cohorts, and so some SNPs listed may have zero effect size in the UK Biobank GWAS of BMI. (e) The inverse-variance weighted two-sample MR analysis/meta-analysis of 37 identified diseases from published GWAS and/or FinnGen for BMI, body fat percentage, FA, and UFA clusters. Italicised results are those that were interpreted – including all BMI, body fat percentage if a causal effect of BMI was indicated, and FA/UFA if a causal effect of BMI and body fat percentage was indicated. (f) Heterogeneity statistics from random-effects meta-analysis of inverse-variance weighted MR of published GWAS and FinnGen studies. (g) (i) The inverse-variance weighted, weighted median, Egger, and penalised weighted median MR analyses for BMI using FinnGen and published GWAS. (g) (ii) The inverse-variance weighted, weighted median, Egger, and penalised weighted median MR analyses for body fat percentage using FinnGen and published GWAS. (g) (iii) The inverse-variance weighted, weighted median, Egger, and penalised weighted median MR analyses for FA using FinnGen and published GWAS. (g) (iv) The inverse-variance weighted, weighted median, Egger, and penalised weighted median MR analyses for UFA using FinnGen and published GWAS. (h) The inverse-variance weighted MR analysis of identified diseases from UK Biobank for BMI, body fat percentage, FA, and UFA clusters. PMID, PubMed ID; N, sample size; OPCS, operating procedure codes; SE, standard error; p, p-value; OR, odds ratio; 95% CI, 95% confidence interval; Q, Q-statistic; I2, I2-statistic; LCI, lower 95% confidence interval; UCI, upper 95% confidence interval; Intercept p, intercept p-value; I2 MR-Egger, I2-statistic MR-Egger.
- https://cdn.elifesciences.org/articles/72452/elife-72452-supp1-v2.doc
-
Transparent reporting form
- https://cdn.elifesciences.org/articles/72452/elife-72452-transrepform1-v2.docx
Download links
A two-part list of links to download the article, or parts of the article, in various formats.
Downloads (link to download the article as PDF)
Open citations (links to open the citations from this article in various online reference manager services)
Cite this article (links to download the citations from this article in formats compatible with various reference manager tools)
Disease consequences of higher adiposity uncoupled from its adverse metabolic effects using Mendelian randomisation
eLife 11:e72452.
https://doi.org/10.7554/eLife.72452


