Investigating phenotypes of pulmonary COVID-19 recovery: A longitudinal observational prospective multicenter trial
- Department of Internal Medicine II, Medical University of Innsbruck, Austria
- Department of Radiology, Medical University of Innsbruck, Austria
- The Karl Landsteiner Institute, Austria
- Central Institute of Medical and Chemical Laboratory Diagnostics, University Hospital Innsbruck, Austria
- Munich Leukemia Laboratory, Germany
- Department of Internal Medicine, St. Vinzenz Hospital, Austria
Figures
Figure 1
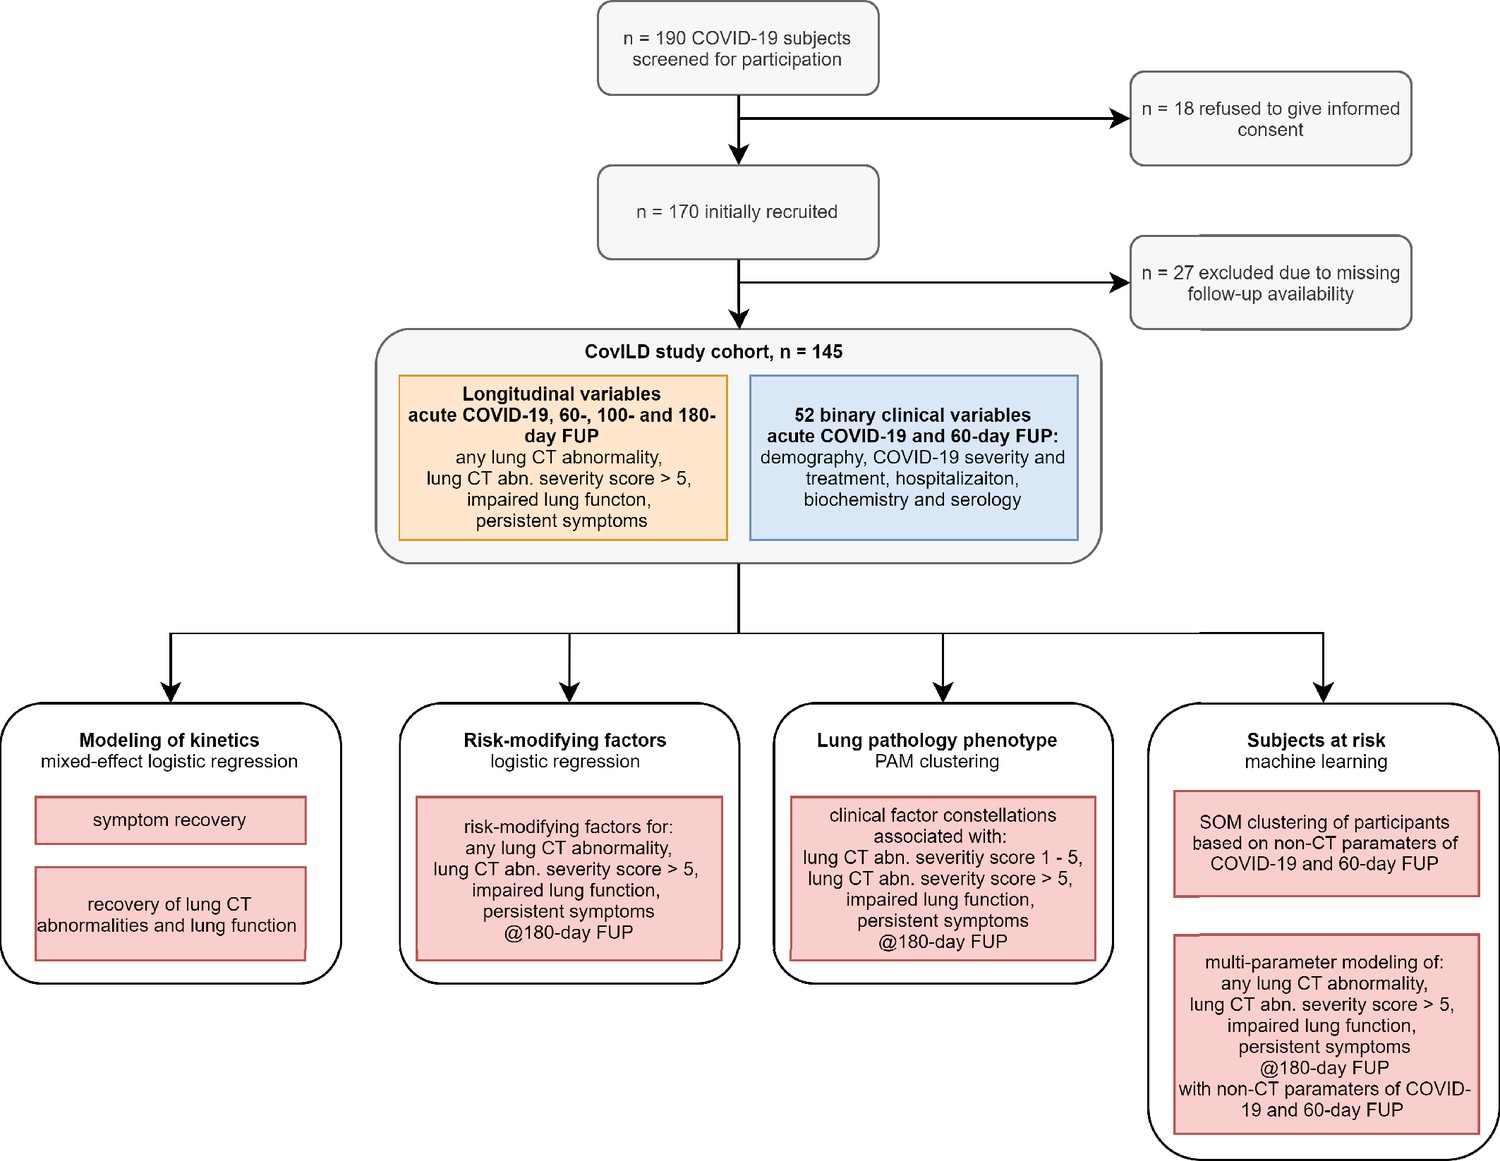
Study inclusion flow diagram and analysis scheme.
Figure 2
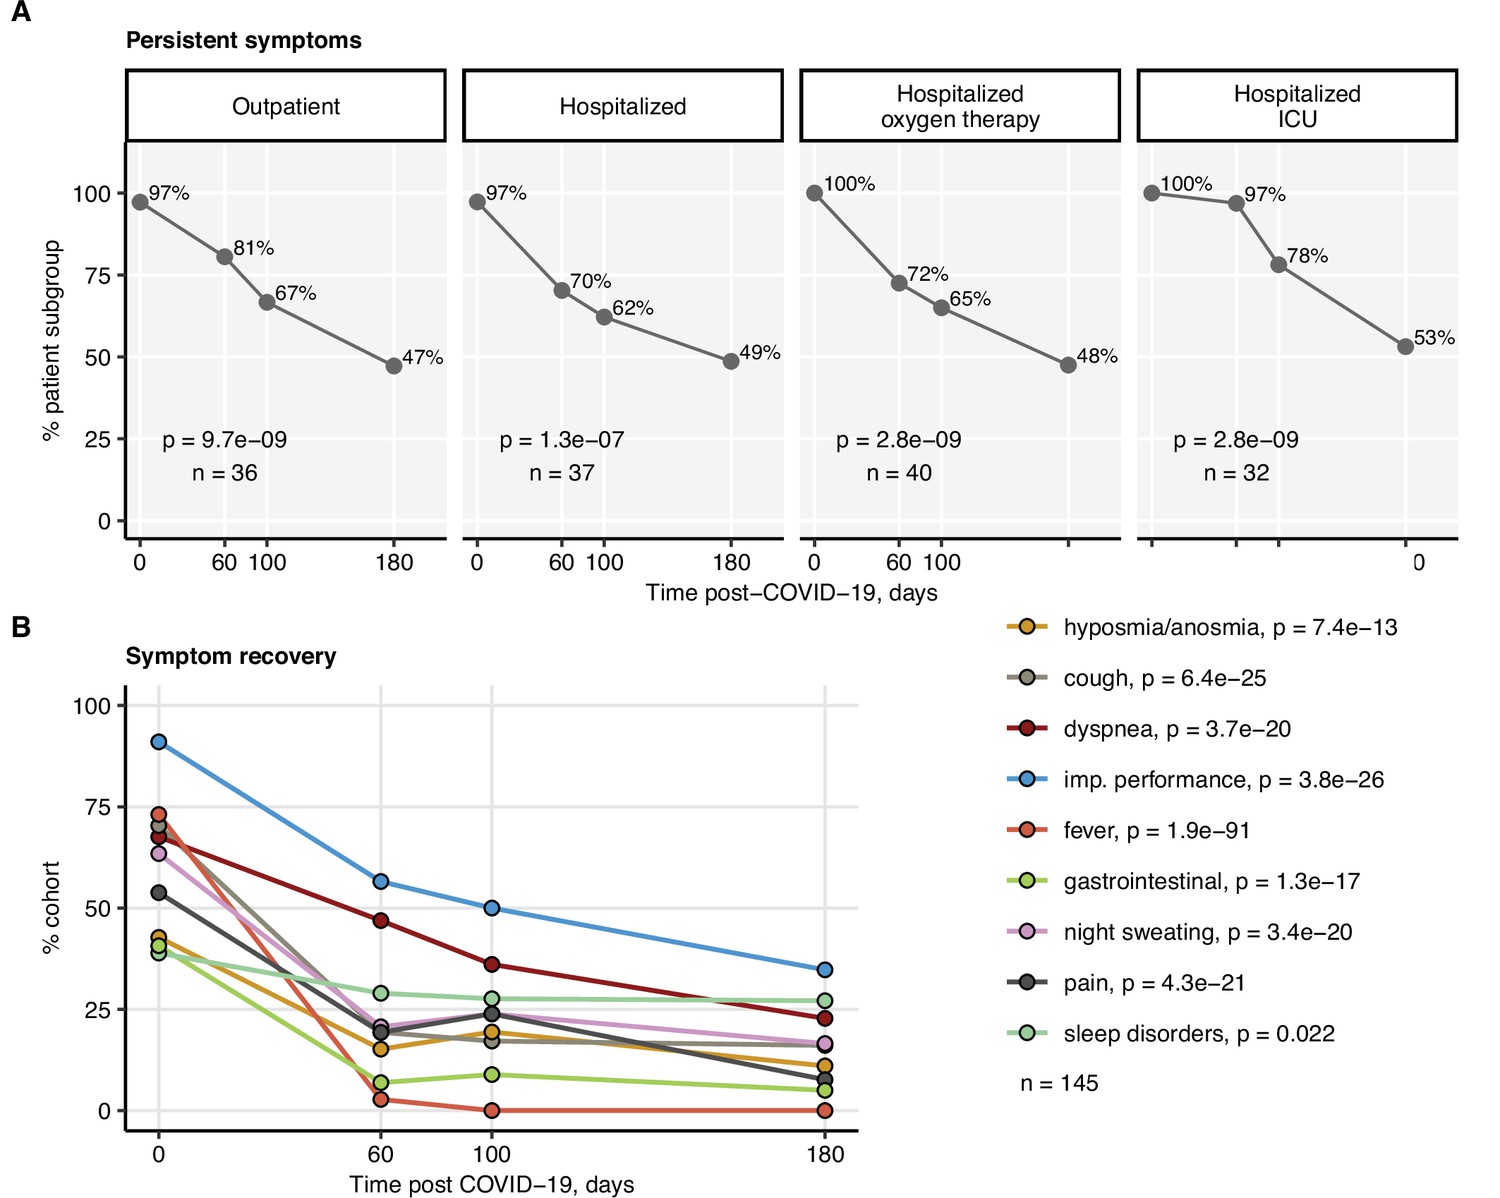
Kinetic of recovery from COVID-19 symptoms.
Recovery from any COVID-19 symptoms was investigated by mixed-effect logistic modeling (random effect: individual; fixed effect: time). Significance was determined by the likelihood ratio test corrected for multiple testing with the Benjamini–Hochberg method, and p-values and the numbers of complete observations are indicated in the plots. (A) Frequencies of individuals with any symptoms in the study cohort stratified by acute COVID-19 severity. (B) Frequencies of participants with particular symptoms. imp.: impaired.
Figure 3 with 3 supplements
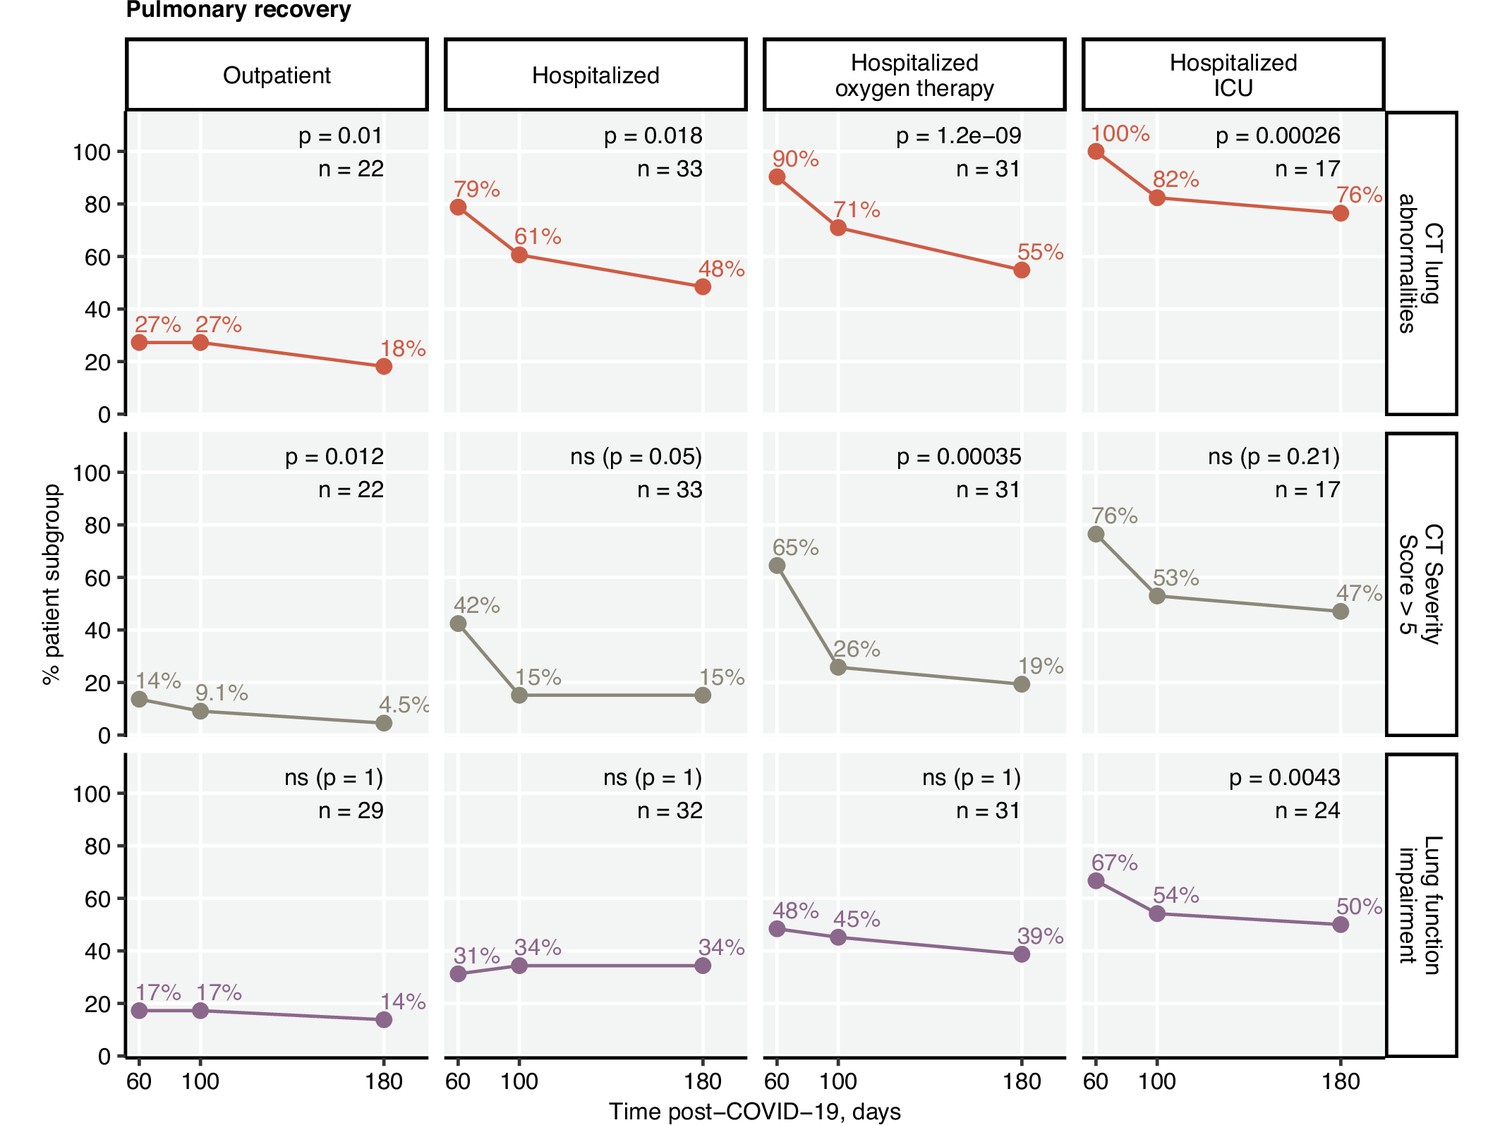
Kinetic of pulmonary recovery.
Recovery from any lung computed tomography (CT) abnormalities, moderate-to-severe lung CT abnormalities (severity score > 5), and recovery from functional lung impairment were investigated in the participants stratified by acute COVID-19 severity by mixed-effect logistic modeling (random effect: individual; fixed effect: time). Significance was determined by the likelihood ratio test corrected for multiple testing with the Benjamini–Hochberg method. Frequencies of the given abnormality at the indicated time points are presented, and p-values and the numbers of complete observations are indicated in the plots.
Figure 3—figure supplement 1
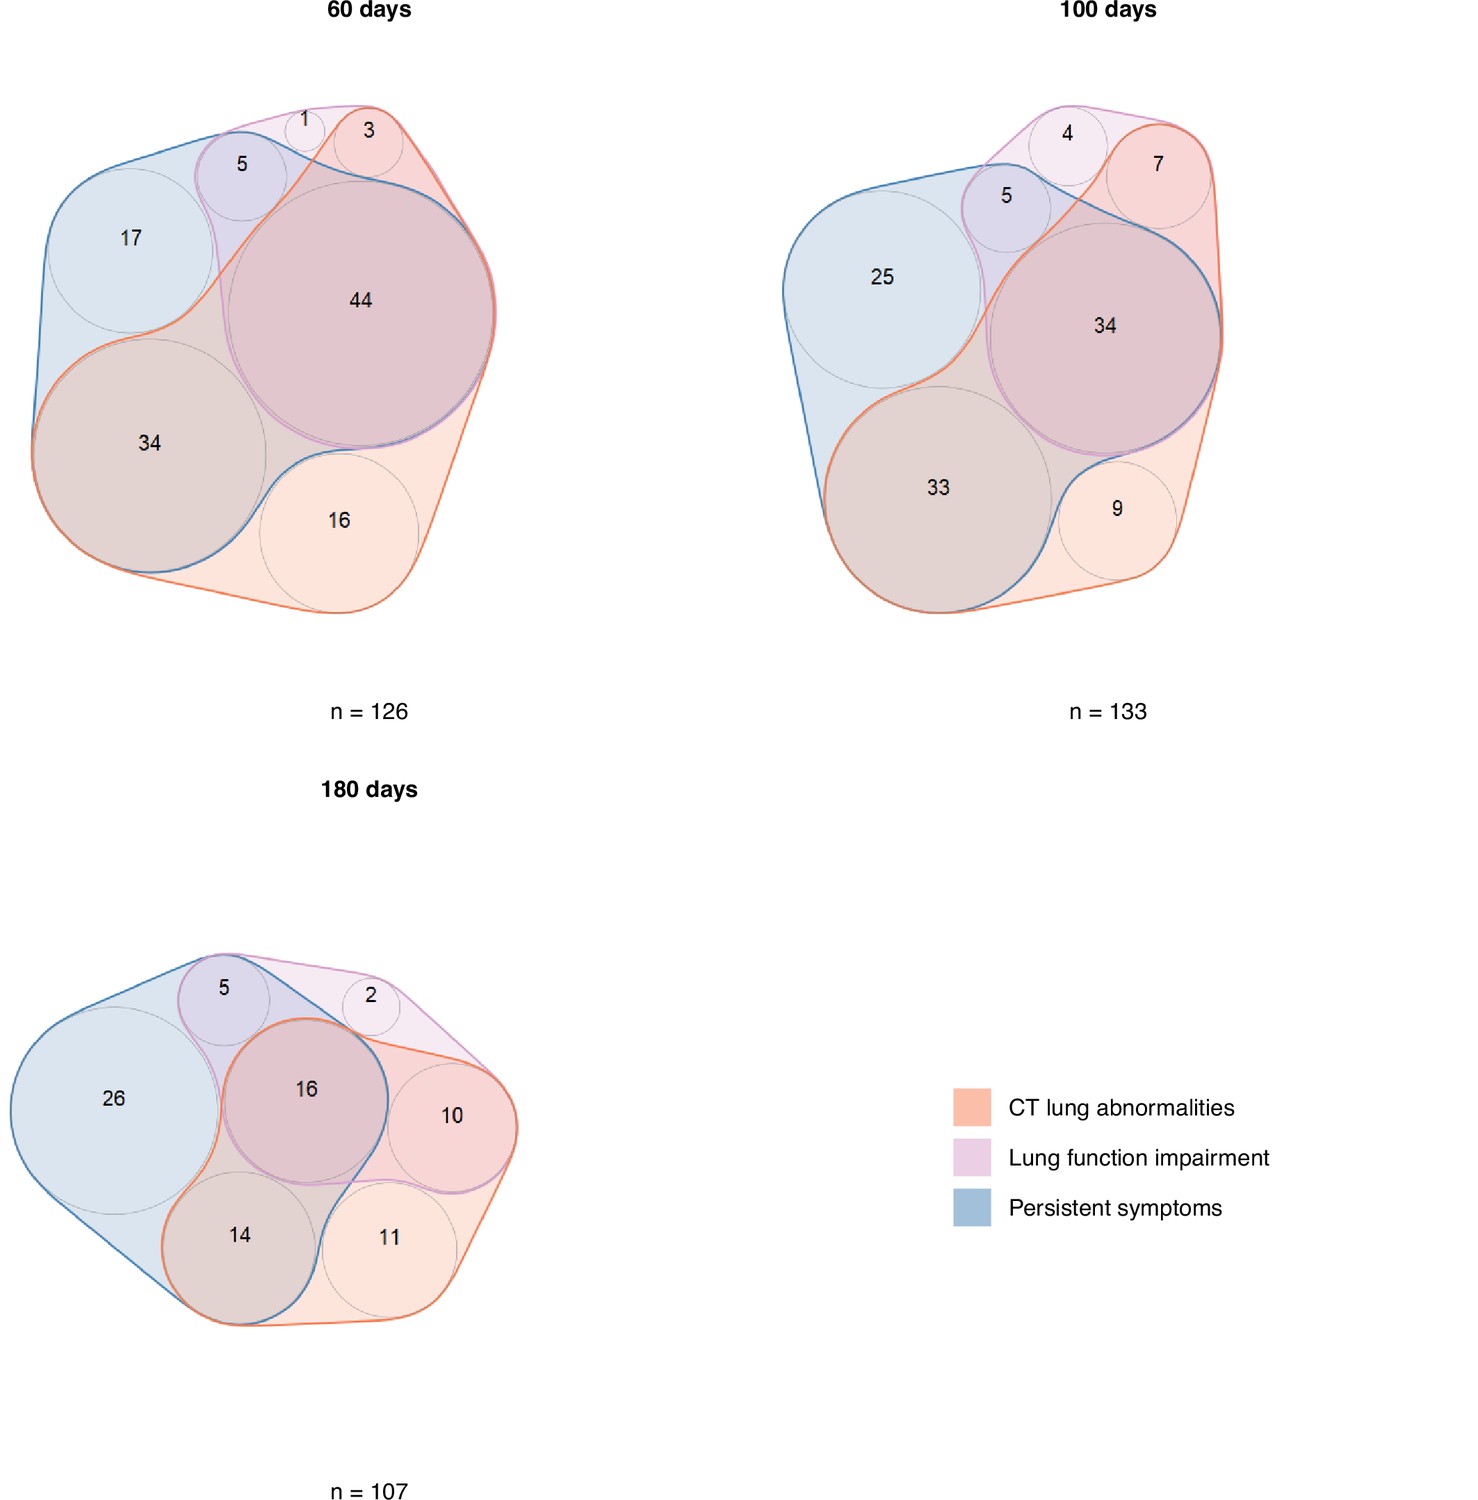
Co-occurrence of lung computed tomography (CT) abnormalities, functional lung impairment, and any persistent symptoms.
Numbers and percentages of the study participants with any persistent symptoms, functional lung impairment, or lung CT abnormalities at the consecutive follow-up visits presented in quasi-proportional Venn diagrams. The numbers of participants with CT abnormalities, lung function (LF) impairment, and persistent symptoms are indicated in the diagrams, and the numbers of complete observations are shown under the plots.
Figure 3—figure supplement 2

Co-occurrence of moderate-to-severe lung computed tomography (CT) abnormalities, functional lung impairment, and any persistent symptoms.
Numbers and percentages of the study participants with any persistent symptoms, functional lung impairment, or moderate-to-severe lung CT abnormalities (severity score > 5) at the consecutive follow-up visits presented in quasi-proportional Venn diagrams. The numbers of participants with CT abnormalities, lung function (LF) impairment, and persistent symptoms are indicated in the diagrams, and the numbers of complete observations are shown under the plots.
Figure 3—figure supplement 3

Frequency of mild and moderate-to-severe lung computed tomography (CT) abnormalities.
Prognostic value of functional lung impairment and persistent symptoms for prediction of radiological lung abnormalities. (A) Relevance of functional lung impairment and persistent COVID-19 symptoms at predicting any lung CT abnormalities and moderate-to-severe lung CT abnormalities (severity score > 5) at the consecutive follow-up visits. The concordance of the outcome variables was determined by Cohen’s κ coefficient. Statistical significance (κ ̸ = 0) was assessed by two-tailed t-test corrected for multiple testing with the Benjamini–Hochberg method. Kappa with 95% confidence intervals and p values are presented as a heat map. The number of complete observations is indicated in the plot. (B) Percentages of mild (severity score ≤ 5) and moderate-to-severe lung CT abnormalities at the consecutive follow-up visits in the study participants stratified by the severity of acute COVID-19. Statistical significance of frequency differences was determined by χ2 test for trend corrected for multiple testing with the Benjamini–Hochberg method. The number of complete observations is indicated under the plots.
Figure 4

Risk factors of persistent radiological lung abnormalities.
Association of 52 binary explanatory variables (Appendix 1—table 1) with the presence of any lung computed tomography (CT) abnormalities (A) or moderate-to-severe lung CT abnormalities (severity score > 5) (B) at the 180-day follow-up visit was investigated with a series of univariate logistic models (Appendix 1—table 2). Odds ratio (OR) significance was determined by Wald Z test and corrected for multiple testing with the Benjamini–Hochberg method. ORs with 95% confidence intervals for significant favorable and unfavorable factors are presented in forest plots. Model baseline (ref) and numbers of complete observations are presented in the plot axis text. Q1, Q2, Q3, Q4: first, second, third, and fourth quartile of anti-S1/S2 IgG titer; ICU: intensive care unit.
Figure 5
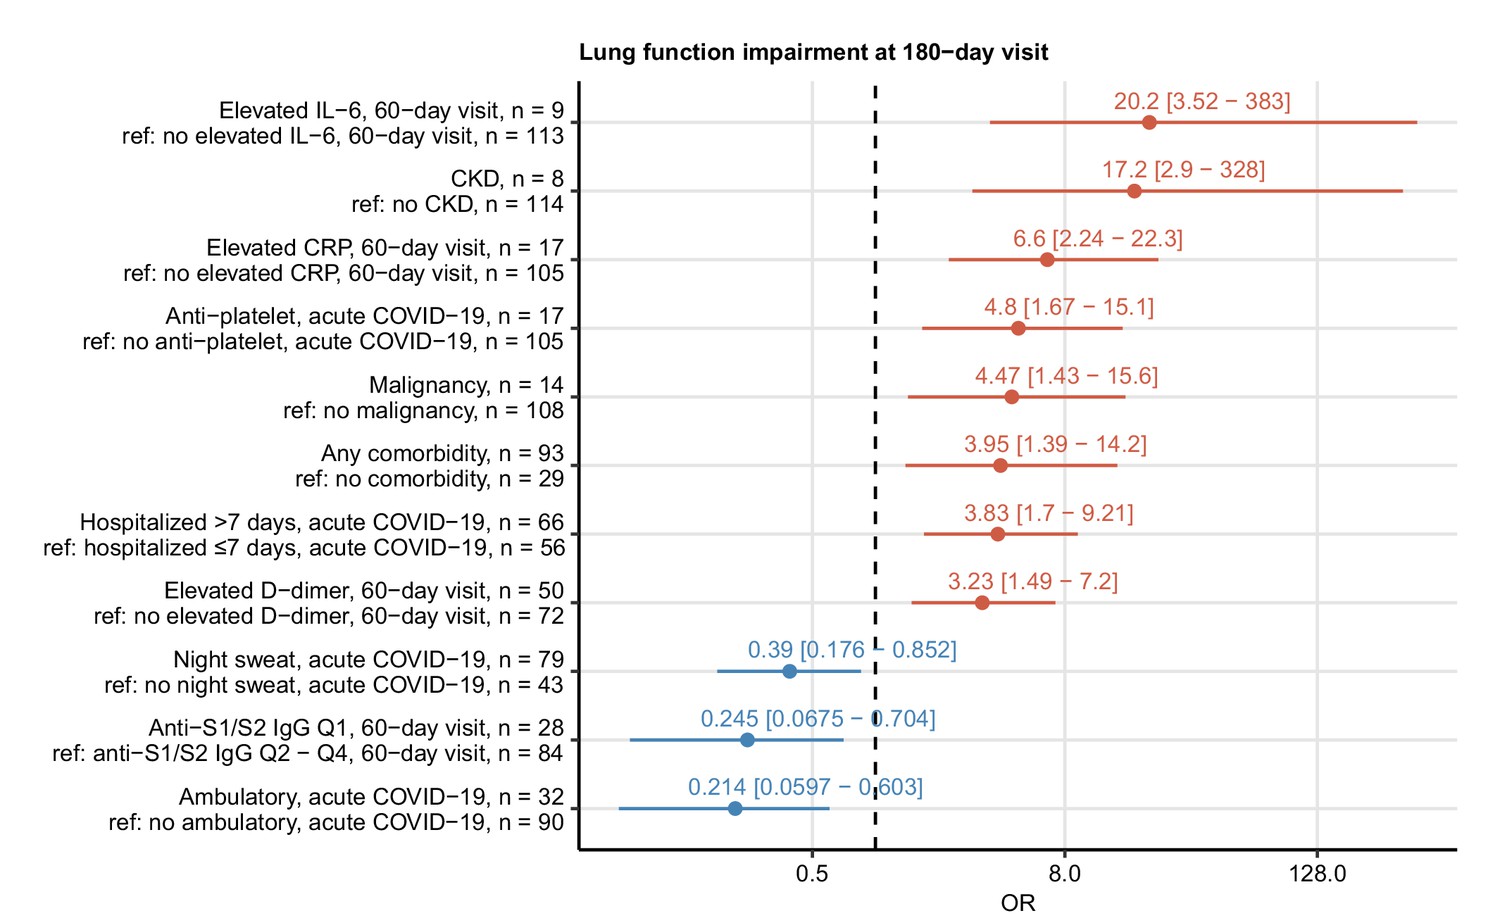
Risk factors of persistent functional lung impairment.
Association of 52 binary explanatory variables (Appendix 1—table 1) with the presence of functional lung impairment at the 180-day follow-up visit was investigated with a series of univariate logistic models (Appendix 1—table 2). Odds ratio (OR) significance was determined by Wald Z test and corrected for multiple testing with the Benjamini–Hochberg method. ORs with 95% confidence intervals for the significant favorable and unfavorable factors are presented in a forest plot. Model baseline (ref) and n numbers of complete observations are presented in the plot axis text. Q1, Q2, Q3, Q4: first, second, third, and fourth quartile of anti-S1/S2 IgG titer; CKD: chronic kidney disease.
Figure 6 with 2 supplements
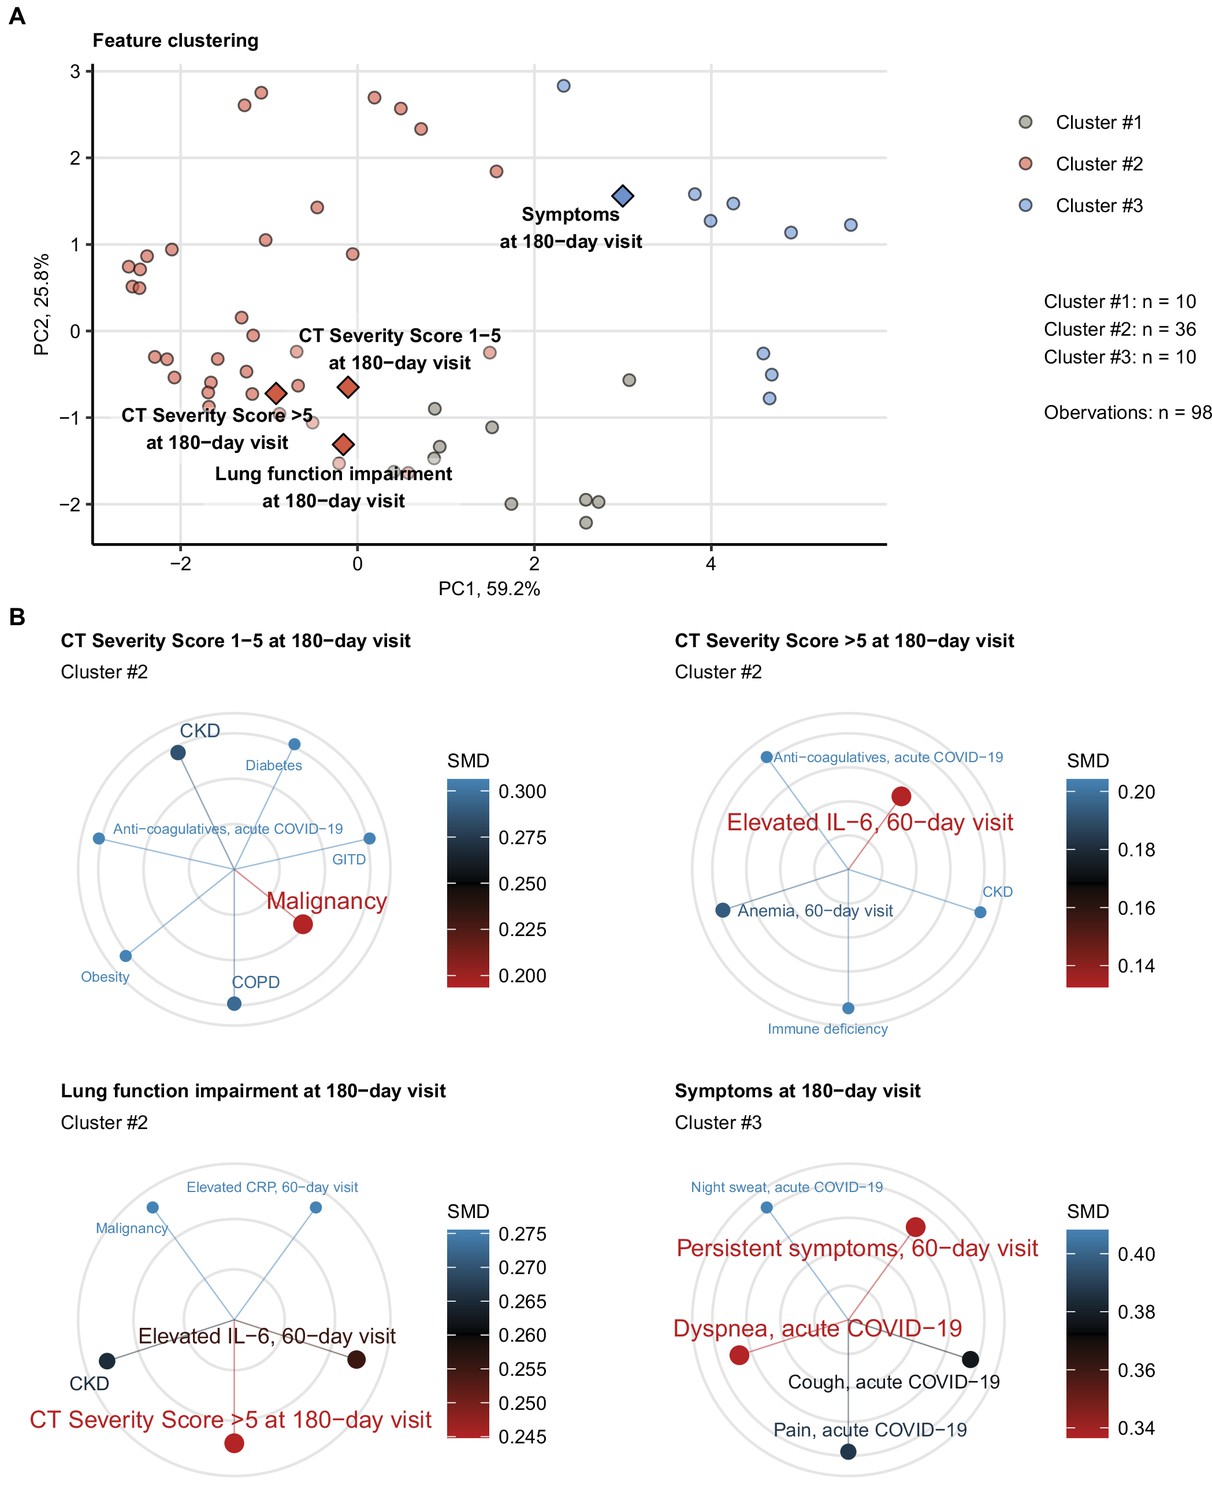
Association of incomplete symptom, lung function, and radiological lung recovery with demographic and clinical parameters of acute COVID-19 and early recovery.
Clustering of 52 non-computed tomography (non-CT) and non-lung function binary explanatory variables recorded for acute COVID-19 or at the early 60-day follow-up visit (Appendix 1—table 1) was investigated by partitioning around medoids (PAM) algorithm with simple matching distance (SMD) dissimilarity measure (Figure 6—figure supplement 1, Appendix 1—table 3). The cluster assignment for the outcome variables at the 180-day follow-up visit (persistent symptoms, functional lung impairment, mild lung CT abnormalities [severity score ≤ 5] and moderate-to-severe lung CT abnormalities [severity score > 5]) was predicted by k-nearest neighbor (kNN) label propagation procedure. Numbers of complete observations and numbers of features in the clusters are indicated in (A). (A) Cluster assignment of the outcome variables (diamonds) presented in the plot of principal component (PC) scores. The first two major PCs are displayed. The explanatory variables are visualized as points. Percentages of the data set variance associated with the PC are presented in the plot axes. (B) Five nearest neighbors (lowest SMD) of the outcome variables presented in radial plots. Font size, point radius, and color code for SMD values. Q1, Q2, Q3, Q4: first, second, third, and fourth quartile of anti-S1/S2 IgG titer; GITD: gastrointestinal disease; CKD: chronic kidney disease; ICU: intensive care unit; COPD: chronic obstructive pulmonary disease.
Figure 6—figure supplement 1
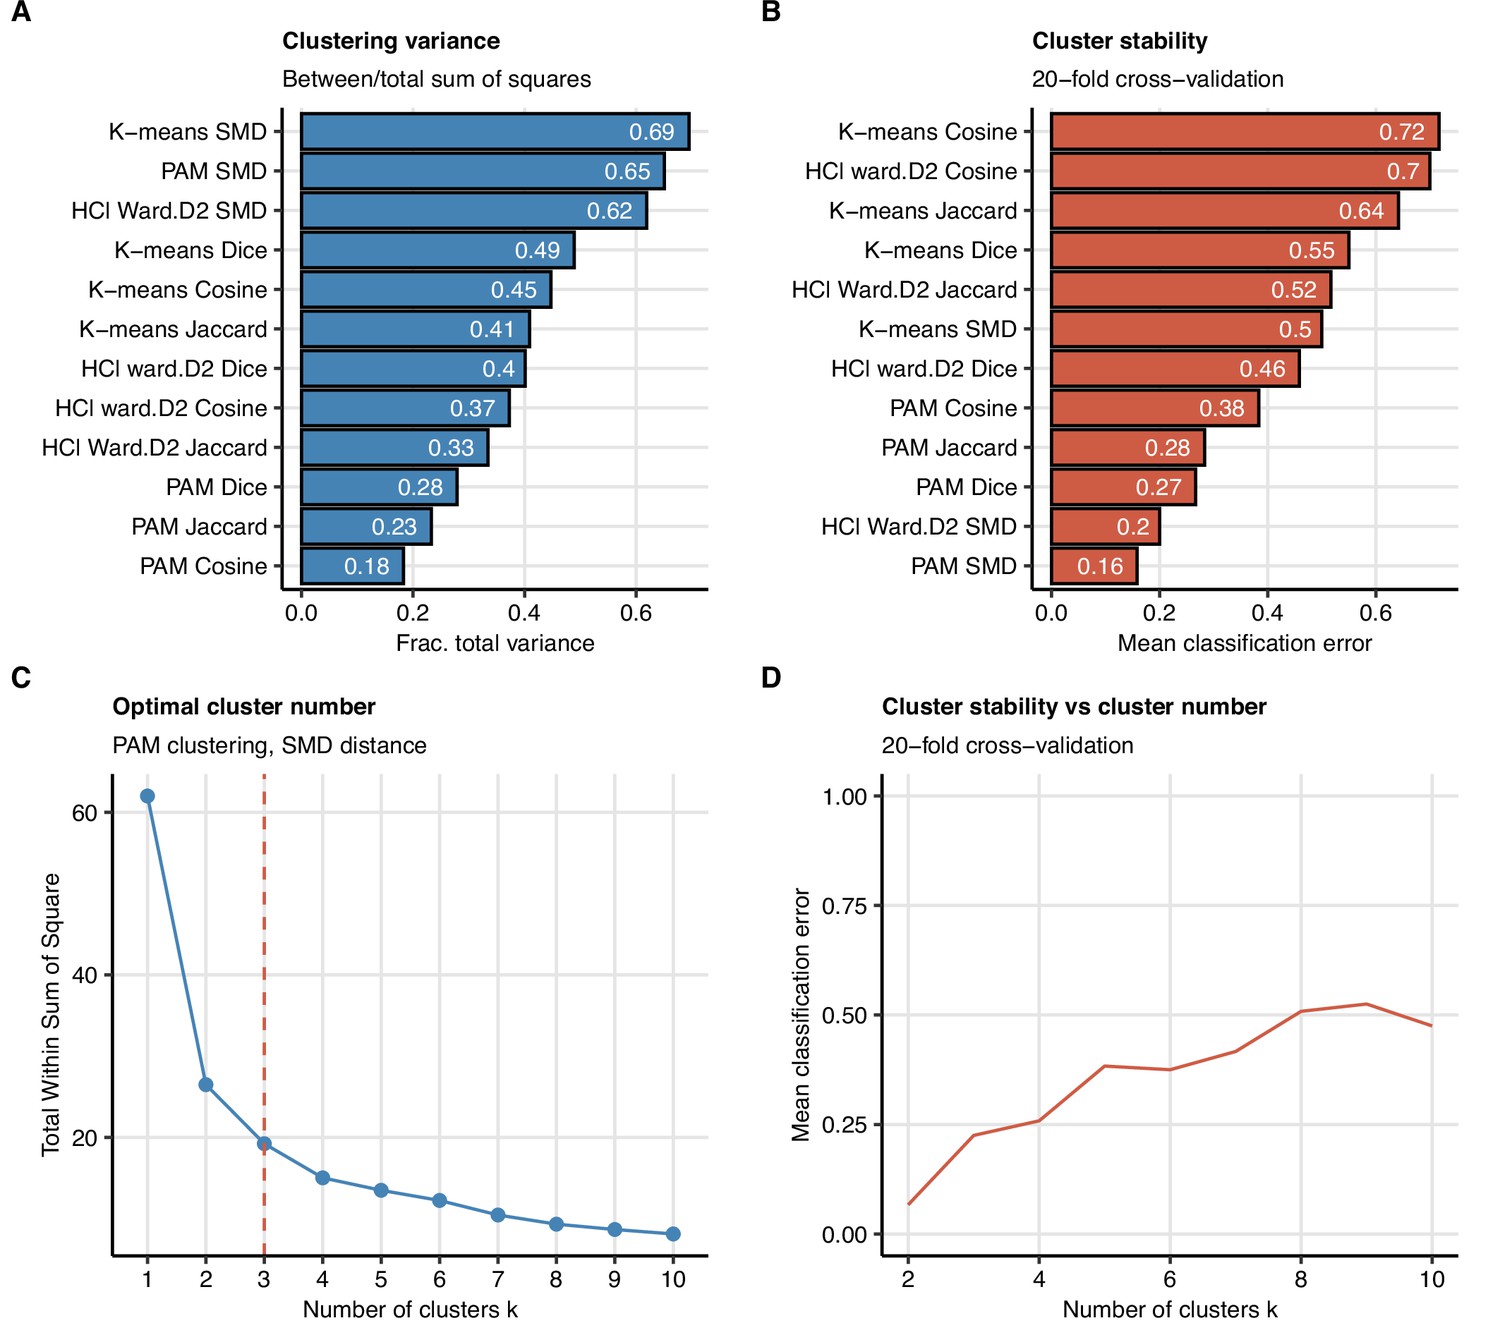
Study feature clustering algorithm.
Clustering of 52 non-computed tomography (non-CT) and non-lung function binary explanatory variables recorded for acute COVID-19 or at the early 60-day follow-up visit (Appendix 1—table 1). (A, B) Comparison of ‘explained’ variances (between-cluster to total sum-of-squares ratio) (A) and cluster stability (mean classification error in 20-fold cross-validation) (B) in clustering of the data set with several algorithms with k = 3 centers/branches (algorithms: K-means; PAM: partitioning around medoids; HCl Ward.D2: hierarchical clustering with Ward.D2 method; distances: SMD: simple matching distance; Jaccard, Dice, and Cosine). (C, D) The optimal number of the feature clusters in clustering with the optimally performing PAM algorithm with SMD dissimilarity measure was determined by the bend of the total within-cluster sum-of-squares curve (C) and confirmed by good stability (low mean classification error) in 20-fold cross-validation (D).
Figure 6—figure supplement 2
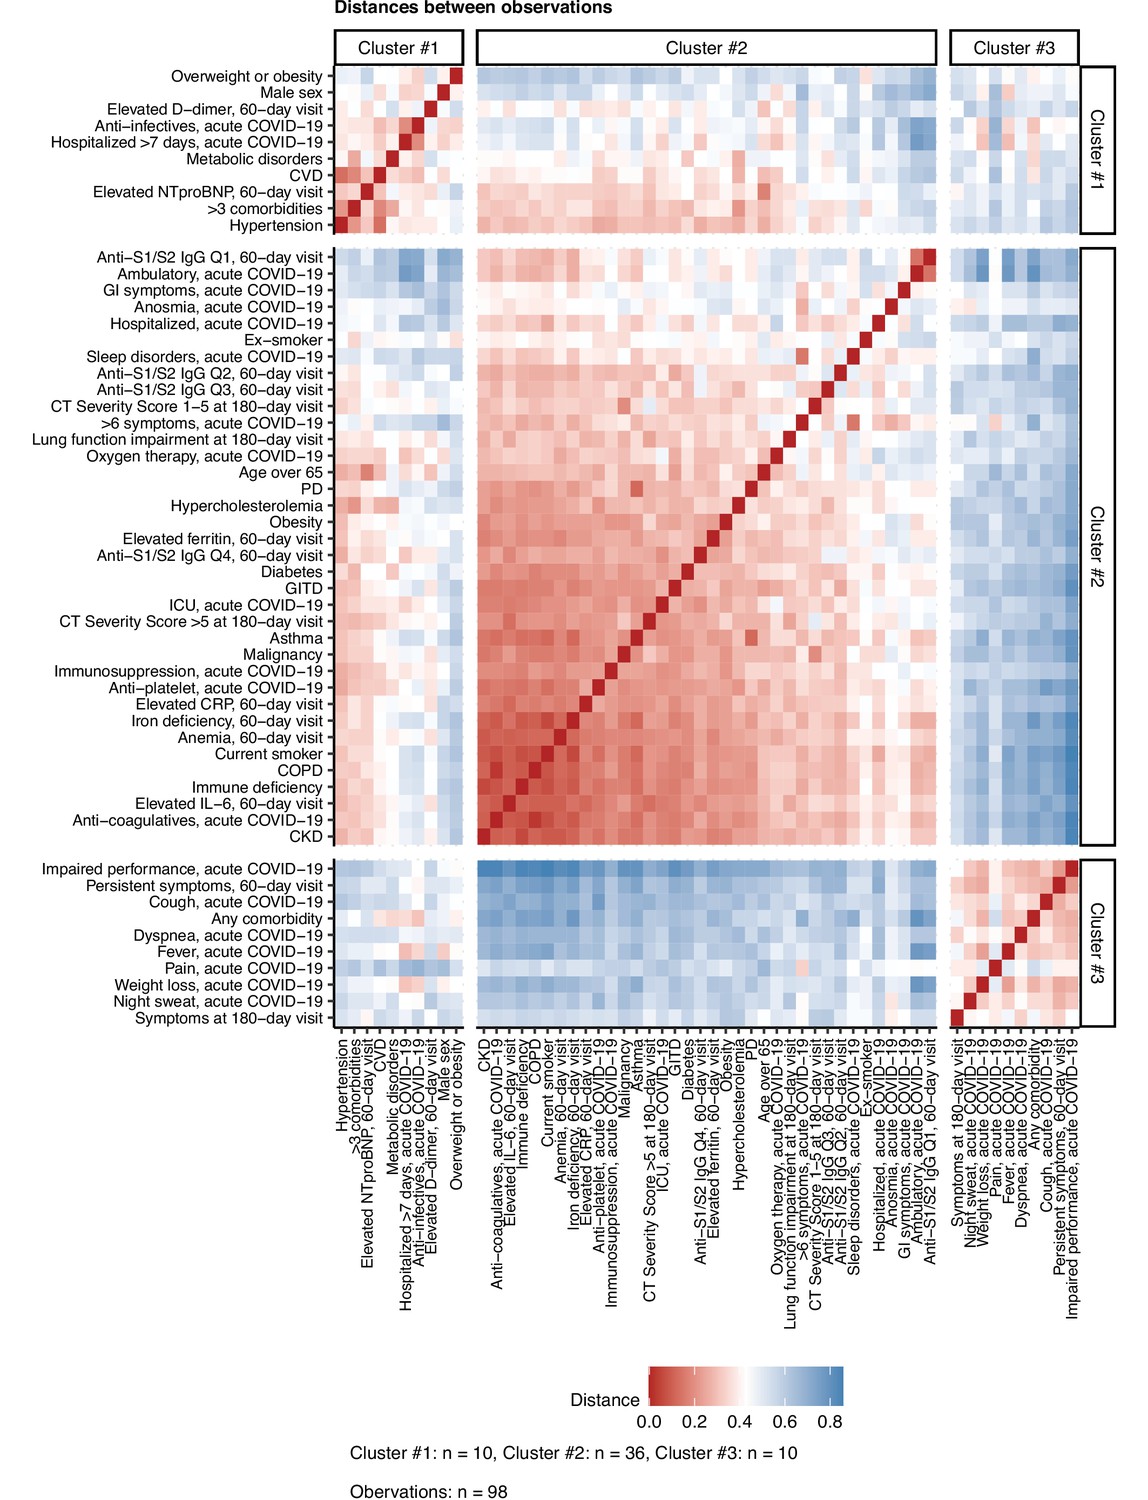
Semi-supervised clustering of mild and moderate-to-severe lung computed tomography (CT) abnormalities, functional lung impairment, and persistent symptoms at the 180-day follow-up with parameters of acute COVID-19 and early convalescence.
Clusters of 52 non-CT and non-lung function binary explanatory variables recorded for acute COVID-19 or at the 60-day follow-up visit (Appendix 1—table 1) were defined by the optimally performing partitioning around medoids (PAM) algorithm and simple matching distance (SMD) dissimilarity measure (Figure 6A, Figure 6—figure supplement 1, Appendix 1—table 3). The cluster assignment for the outcome variables at the 180-day follow-up visit (persistent symptoms, functional lung impairment, mild lung CT abnormalities [severity score ≤ 5], and moderate-to-severe lung CT abnormalities [severity score > 5]) was predicted by k-nearest neighbor (kNN) label propagation procedure. SMD between the features and their cluster assignments are shown in a heat map. The numbers of features in the clusters and the total number of observations are indicated under the plot. CVD: cardiovascular disease; Q1, Q2, Q3, Q4: first, second, third, and fourth quartile of anti-S1/S2 IgG titer; GI: gastrointestinal; PD: pulmonary disease; GITD: gastrointestinal disease; ICU: intensive care unit; COPD: chronic obstructive pulmonary disease; CKD: chronic kidney disease.
Figure 7 with 2 supplements
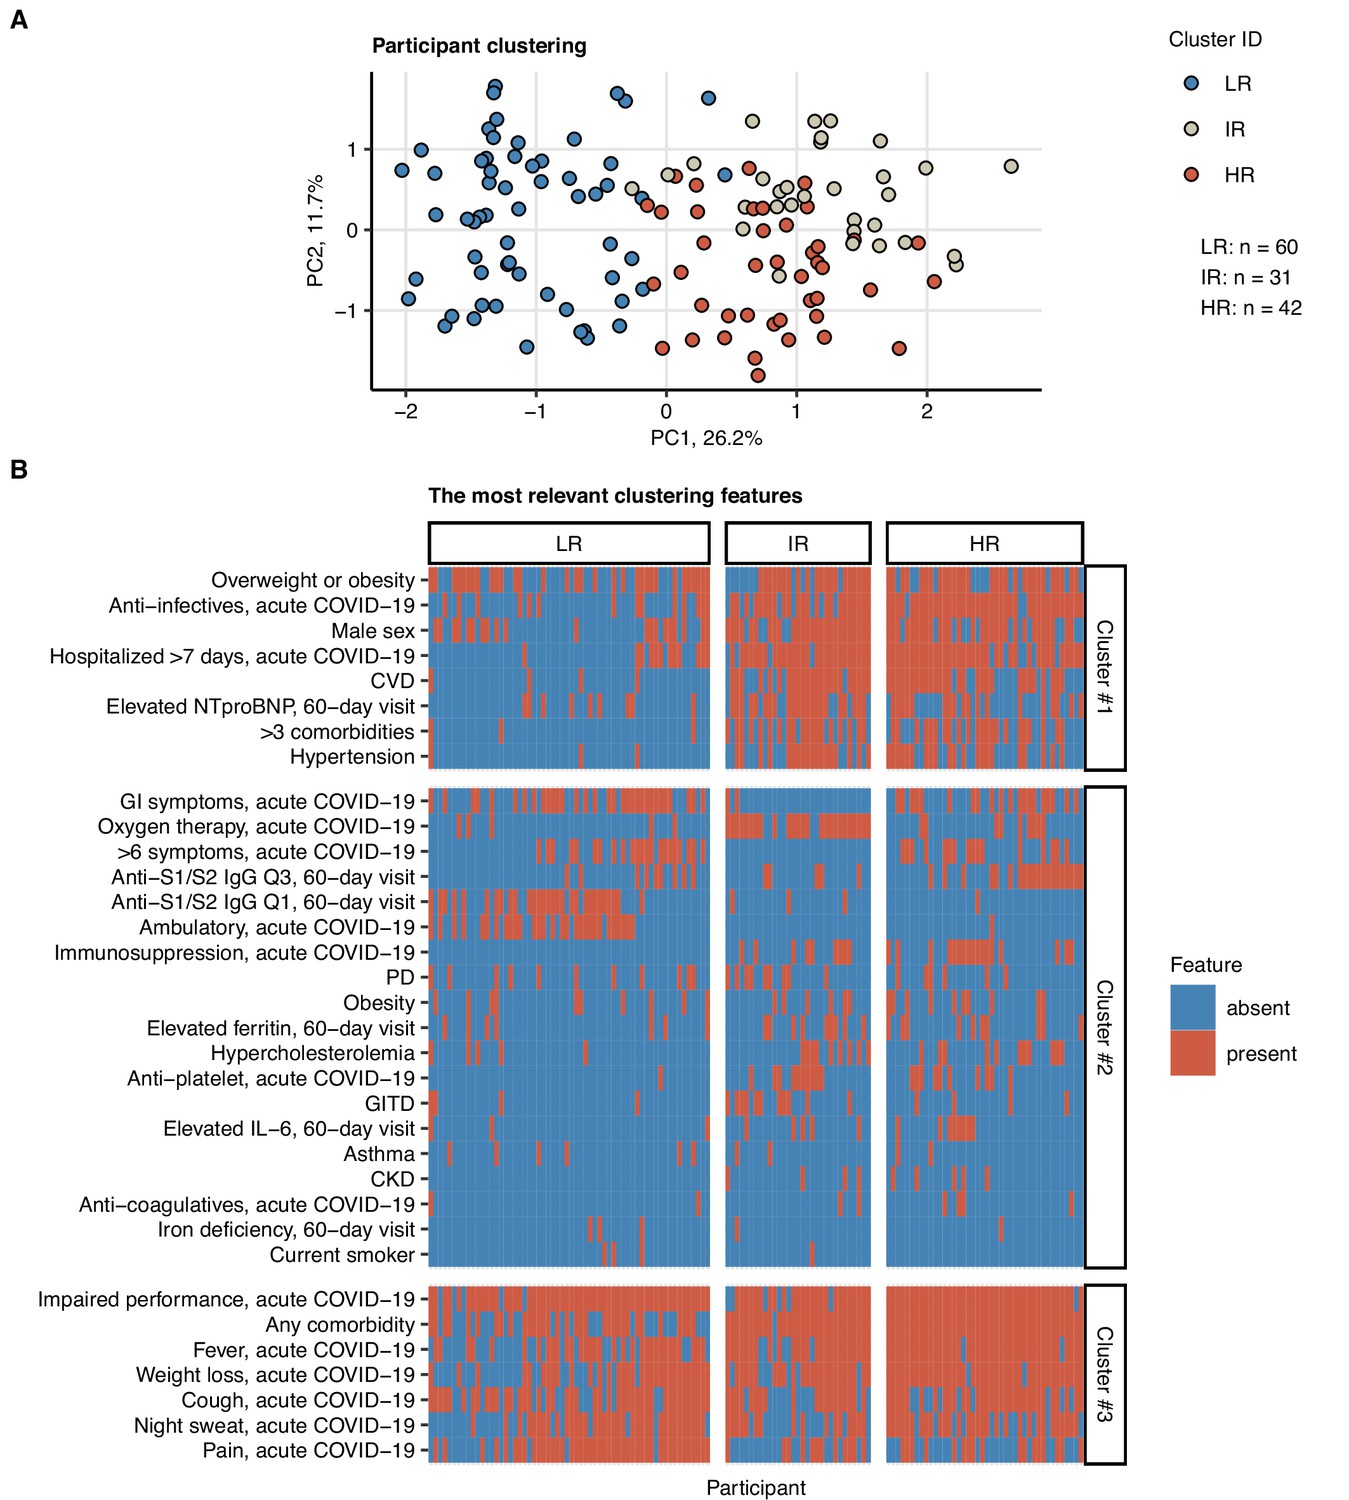
Clustering of the study participants by non-lung function and non-computed tomography (non-CT) clinical features.
Study participants (n = 133 with the complete variable set) were clustered with respect to 52 non-CT and non-lung function binary explanatory variables recorded for acute COVID-19 or at the 60-day follow-up visit (Appendix 1—table 1) using a combined self-organizing map (SOM: simple matching distance) and hierarchical clustering (Ward.D2 method, Euclidean distance) procedure (Figure 7—figure supplement 1). The numbers of participants assigned to low-risk (LR), intermediate-risk (IR), and high-risk (HR) clusters are indicated in (A). (A) Cluster assignment of the study participants in the plot of principal component (PC) scores. The first two major PCs are displayed. Percentages of the data set variance associated with the PC are presented in the plot axes. (B) Presence of the most influential clustering features (Figure 7—figure supplement 2) in the participant clusters presented as a heat map. Cluster #1, #2, and #3 refer to the feature clusters defined in Figure 6. Q1, Q2, Q3, Q4: first, second, third, and fourth quartile of anti-S1/S2 IgG titer; GITD: gastrointestinal disease; CKD: chronic kidney disease; CVD: cardiovascular disease; GI: gastrointestinal; PD: pulmonary disease.
Figure 7—figure supplement 1
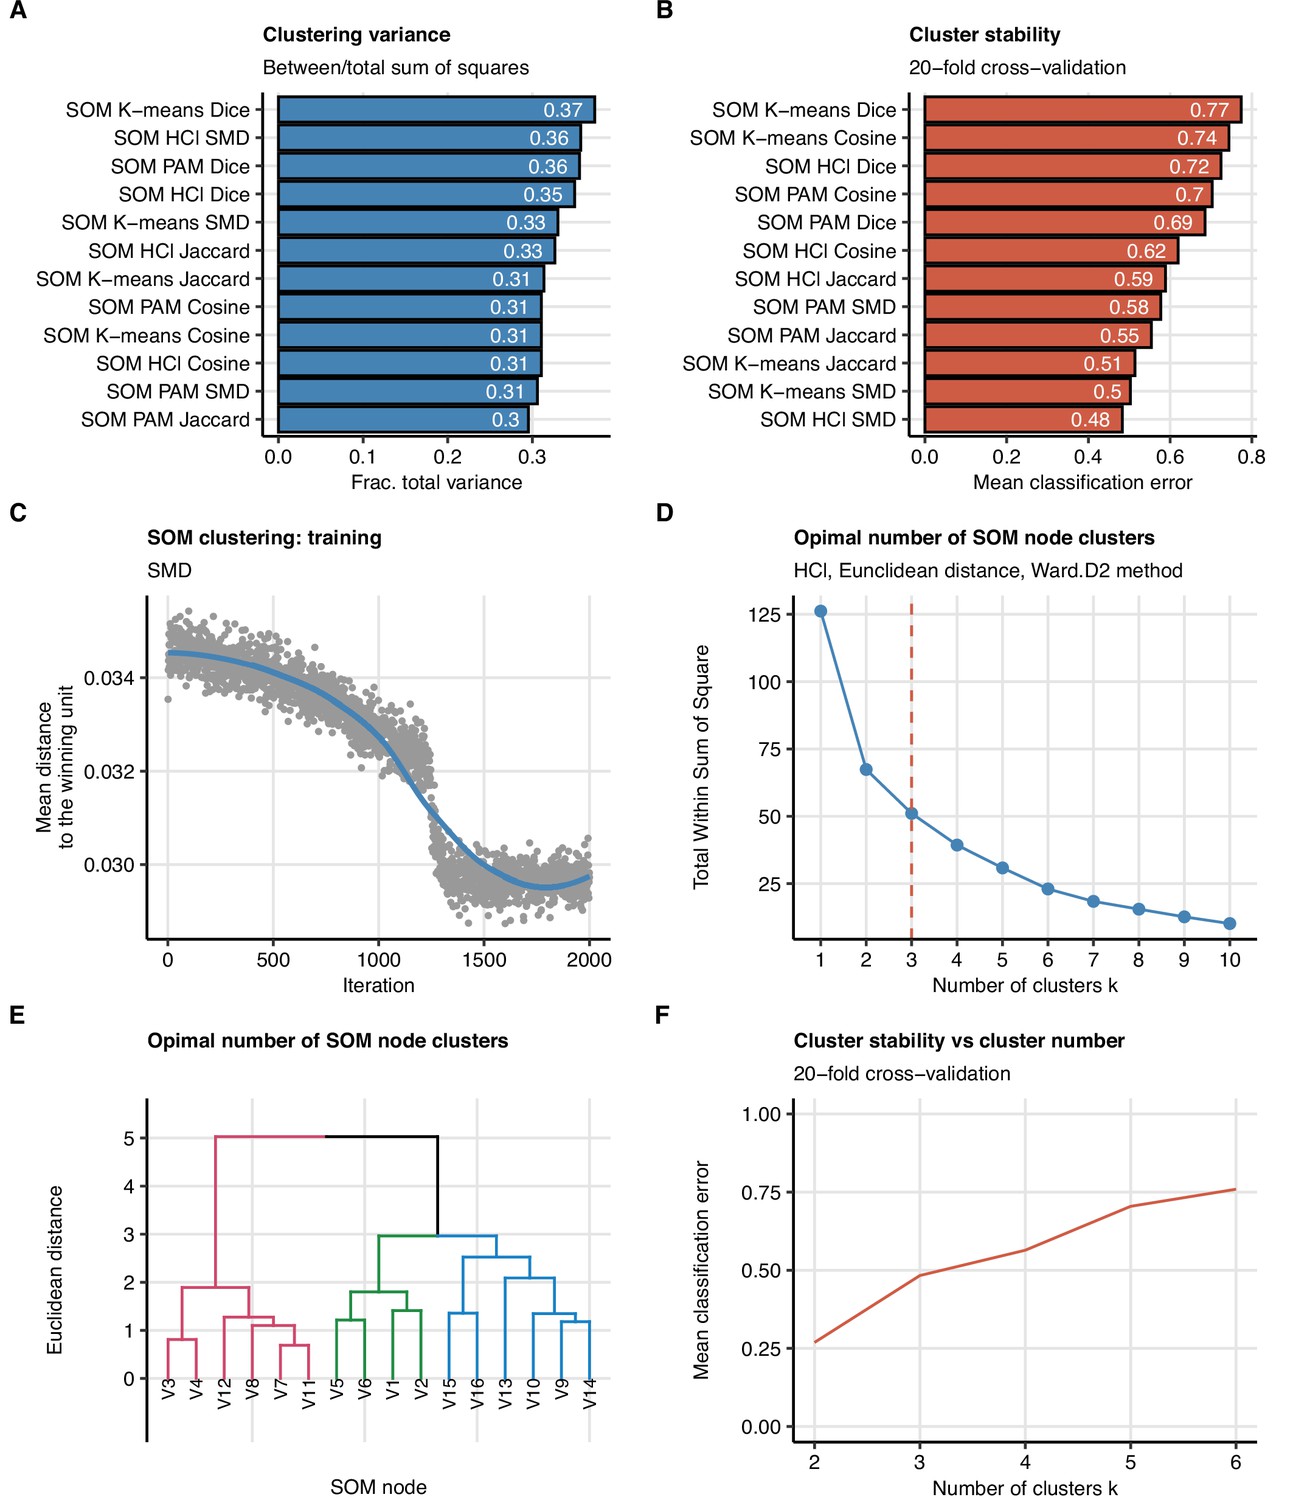
Study participant clustering algorithm.
Clustering of the study participants (n = 133 with the complete variable set) with respect to 52 non-computed tomography (non-CT) and non-lung function binary explanatory variables recorded for acute COVID-19 or at the 60-day follow-up visit (Appendix 1—table 1). The procedure involved clustering of the observations with self-organizing maps (SOM, 4 × 4 hexagonal grid, distances: SMD: simple matching distance, Jaccard, Dice, or Cosine) followed by clustering of the SOM nodes (algorithms: HCl ward.D2: hierarchical clustering with Ward.D2 method; K-means; PAM: partitioning around medoids; distance: Euclidean). Different combinations of observation dissimilarity measures and SOM node clustering algorithms were tested in the search for the optimal clustering algorithm. (A, B) Comparison of ‘explained’ variances (between-cluster to total sum-of-squares ratio) (A) and cluster stability (mean classification error in 20-fold cross-validation) (B) in clustering of the data set with different observation distance measures and SOM node clustering algorithms. (C) Training of the SOM algorithm, mean distance to the winning un as a function of lgorithm iterations is presented. Note the mean distance plateau indicative of the algorithm convergence (D–F) The optimal number of the SOM node clusters in clustering with the optimally performing SOM HCl algorithm with SMD observation dissimilarity measure. The optimal cluster number was determined by the bend of the total within-cluster sum-of-squares curve (D) and confirmed by visual inspection of the HCl dendrogram (E) and good stability (low mean classification error) in 20-fold cross-validation (F).
Figure 7—figure supplement 2

Impact of specific variables on the quality of participant clustering.
The clusters of participants clusters were defined with the optimally performing self-organizing map (SOM)/HCl algorithm with simple matching distance (SMD) observation dissimilarity measure as presented in Figure 7 and Figure 7—figure supplement 1. The impact of a particular clustering variable was determined by comparing the ‘explained’ clustering variance (between-cluster to total sum-of-squares ratio) between the initial cluster structure and the structure with random resampling of the variable. Differences in the clustering variances for the most influential clustering variables (Δ clustering variance > 0) are presented in the plot. Q1, Q3: first, third quartile of anti-S1/S2 IgG titer; CKD: chronic kidney disease; GI: gastrointestinal; CVD: cardiovascular disease; PD: pulmonary disease; GITD: gastrointestinal disease.
Figure 8 with 1 supplement
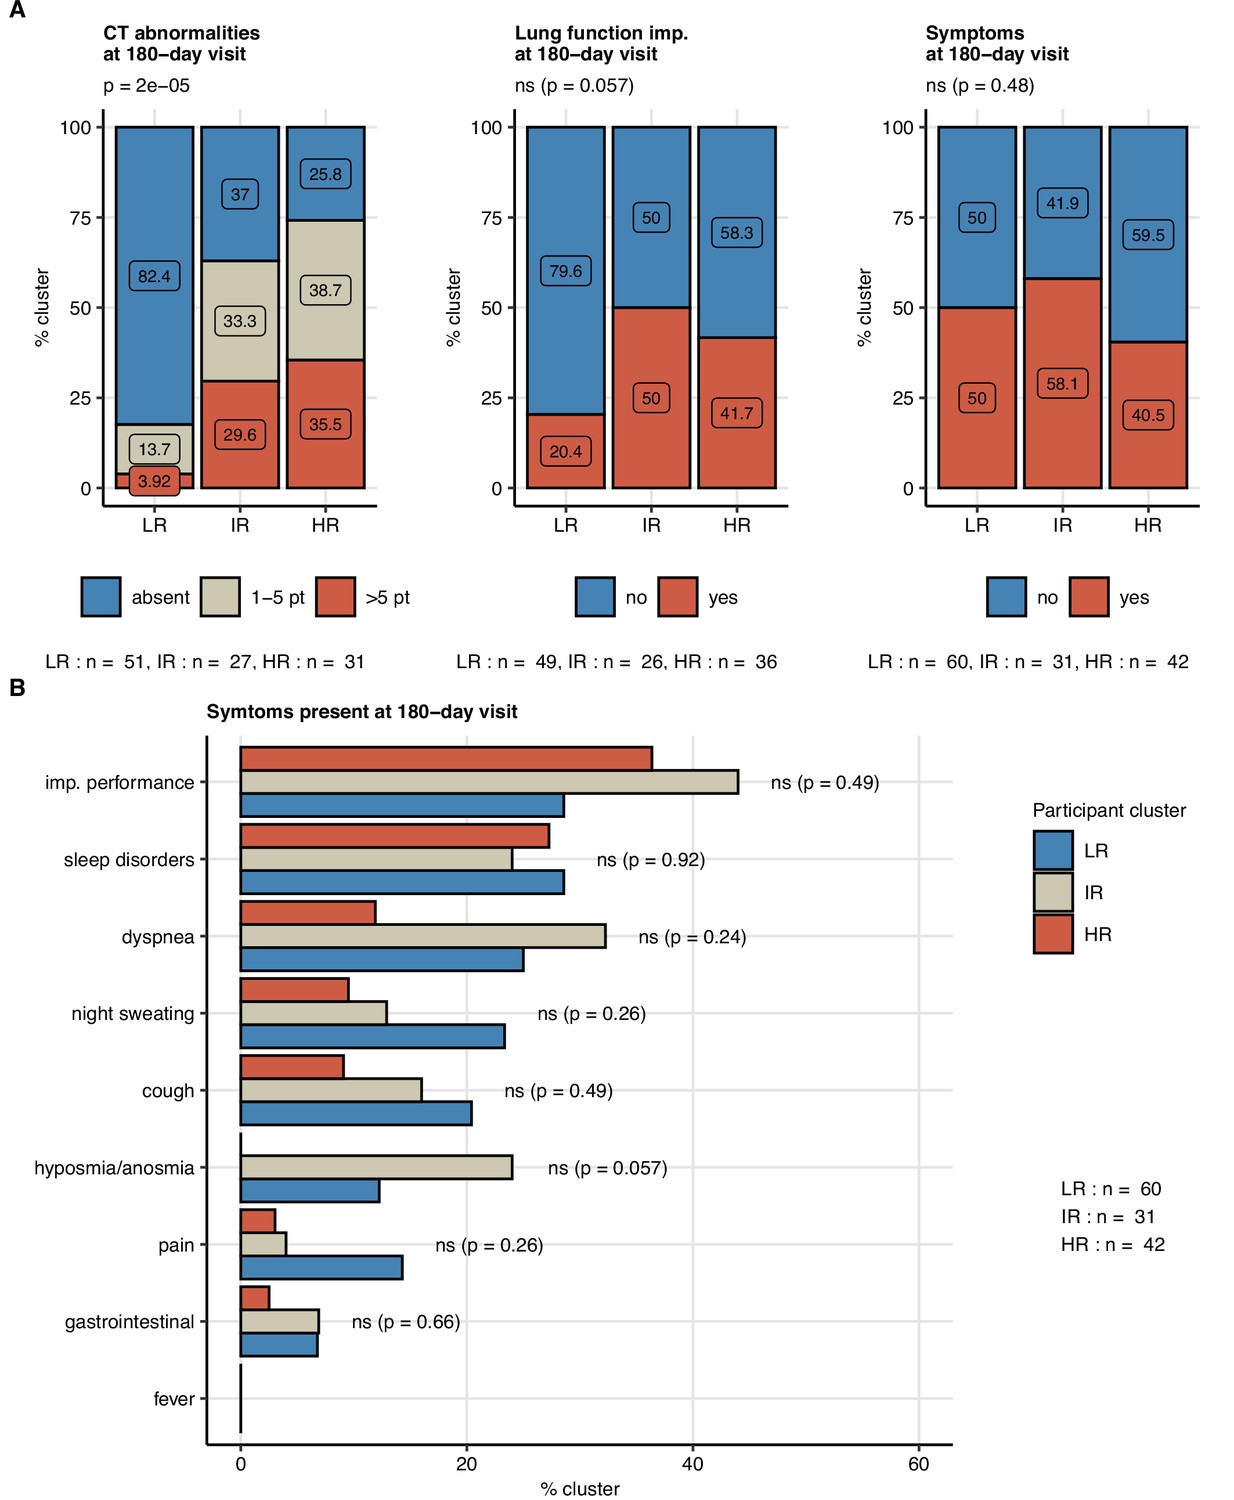
Frequency of persistent radiological lung abnormalities, functional lung impairment, and symptoms in the participant clusters.
The clusters of study participants were defined by non-lung function and non-computed tomography (non-CT) features as presented in Figure 7. Frequencies of outcome variables at the 180-day follow-up visit (mild [severity score ≤ 5], moderate-to-severe lung CT abnormalities [severity score > 5], functional lung impairment, and persistent symptoms) were compared between the low-risk (LR), intermediate-risk (IR), and high-risk (HR) participant clusters by χ2 test corrected for multiple testing with the Benjamini–Hochberg method. p-Values and numbers of participants assigned to the clusters are indicated in the plots. (A) Frequencies of the outcome features in the participant clusters. (B) Frequencies of specific symptoms in the participant clusters.
Figure 8—figure supplement 1
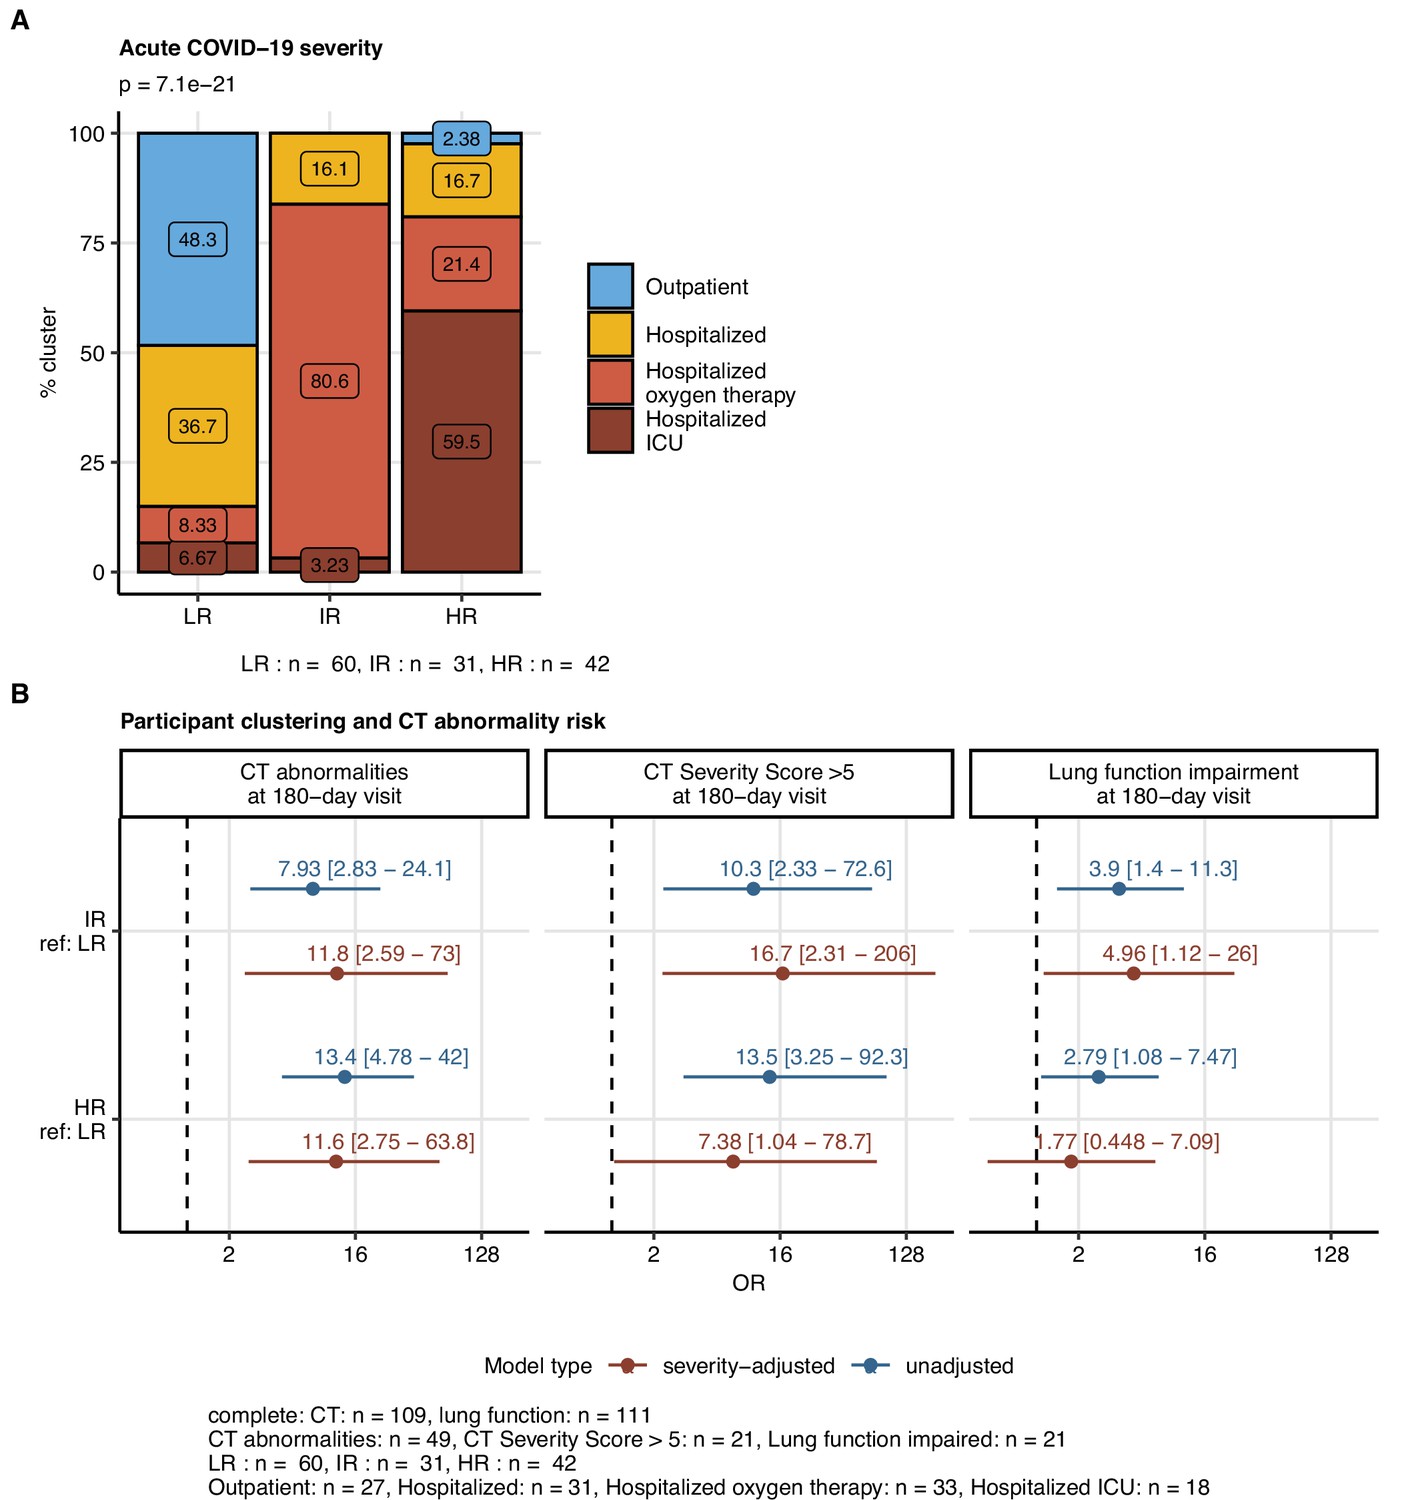
Risk of radiological lung abnormalities at the 180-day follow-up in the participant clusters.
The clusters of participants were defined by non-lung function and non-computed tomography (non-CT) clinical features of acute COVID-19 and early convalescence (60-day follow-up visit, Appendix 1—table 1) with the optimally performing HCl algorithm with simple matching distance (SMD) observation dissimilarity measure as presented in Figure 7 and Figure 7—figure supplement 1. (A) Distribution of mild, moderate, severe, and critical acute COVID-19 cases in the participant clusters. Significance of the distribution differences was assessed with χ2 test. The numbers of participants assigned to the clusters are indicated under the plot. (B) Association of the participant cluster assignment (LR: low-risk; IR: intermediate-risk; HR: high-risk cluster) with the risk of any lung CT abnormalities and moderate-to-severe lung CT abnormalities (severity score > 5) at the 180-day follow-up visit was investigated by logistic modeling with and without inclusion of the acute COVID-19 severity effect (severity-adjusted). Odds ratio (OR) significance was determined by Wald Z test and corrected for multiple testing with the Benjamini–Hochberg method. ORs with 95% confidence intervals are presented in forest plots. Numbers of complete observations, outcome events, participants in the clusters, and the acute COVID-19 severity subsets are indicated under the plot.
Figure 9 with 7 supplements
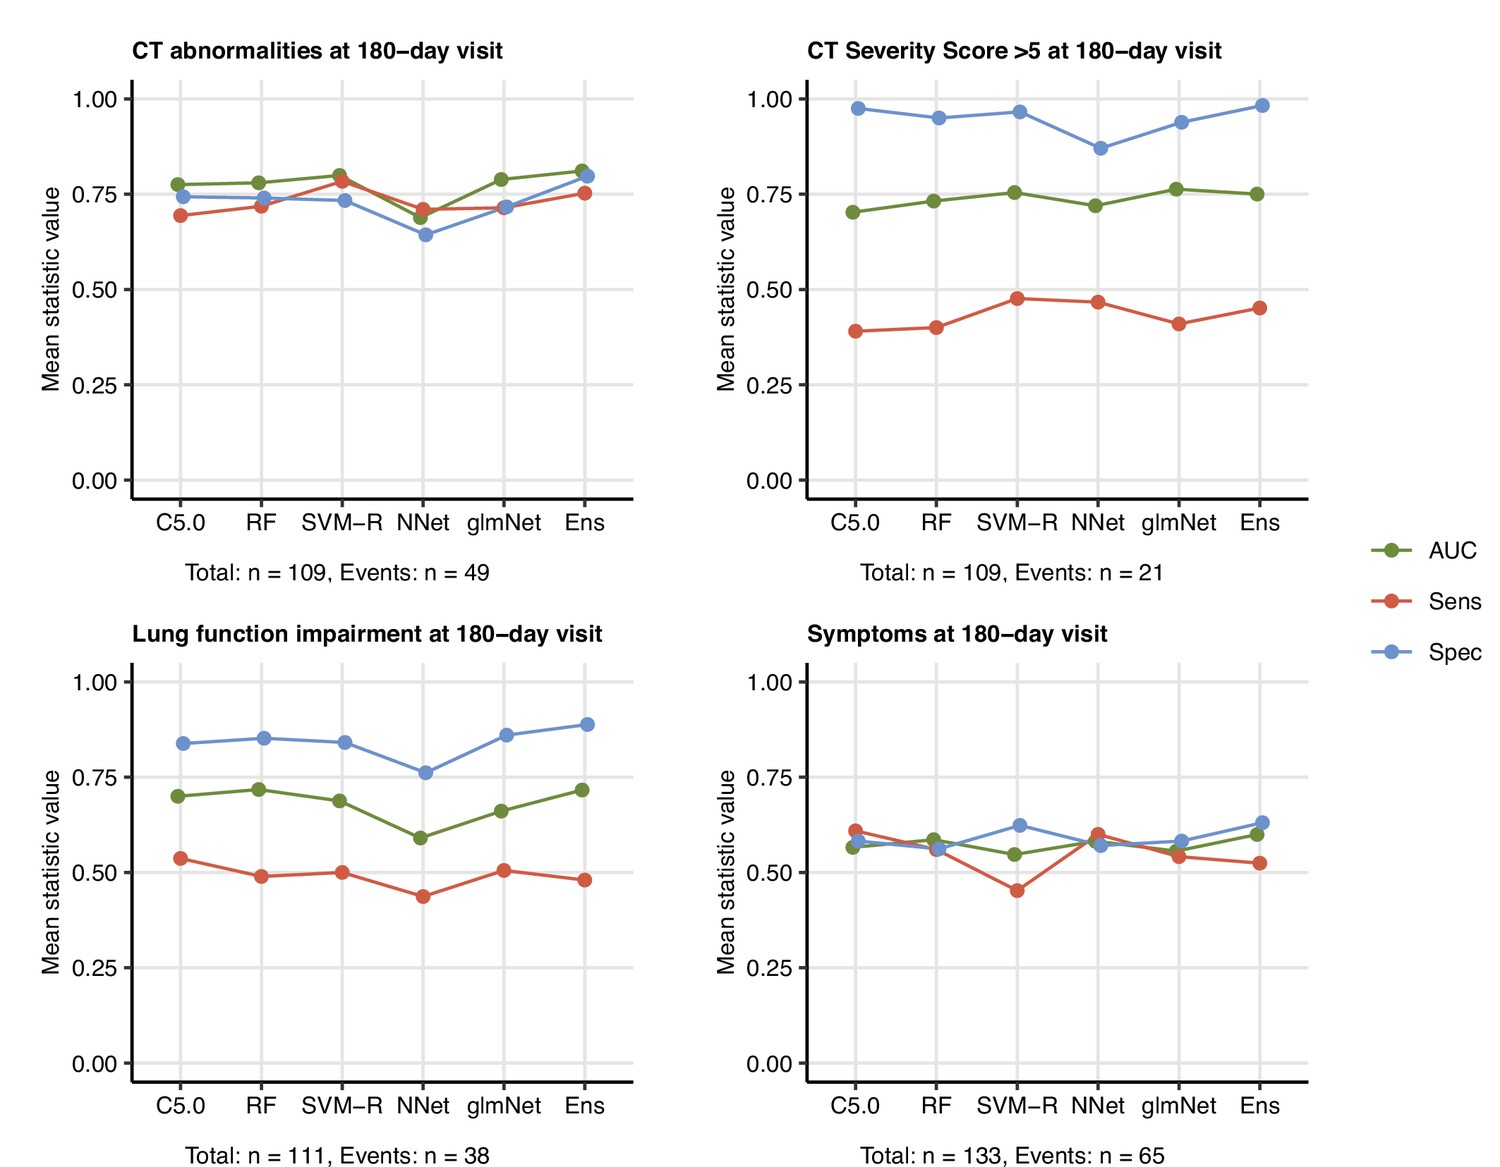
Prediction of persistent radiological lung abnormalities, functional lung impairment, and symptoms by machine learning algorithms.
Single machine learning classifiers (C5.0; RF: random forests; SVM-R: support vector machines with radial kernel; NNet: neural network; glmNet: elastic net) and their ensemble (Ens) were trained in the cohort data set with 52 non-computed tomography (non-CT) and non-lung function binary explanatory variables recorded for acute COVID-19 or at the 60-day follow-up visit (Appendix 1—table 1) for predicting outcome variables at the 180-day follow-up visit (any lung CT abnormalities, moderate-to-severe lung CT abnormalities [severity score > 5], functional lung impairment, and persistent symptoms) (Appendix 1—table 4). The prediction accuracy was verified by repeated 20-fold cross-validation (five repeats). Receiver-operating characteristics (ROCs) of the algorithms in the cross-validation are presented: area under the curve (AUC), sensitivity (Sens), and specificity (Spec) (Appendix 1—table 5). The numbers of complete observations and outcome events are indicated under the plots.
Figure 9—figure supplement 1
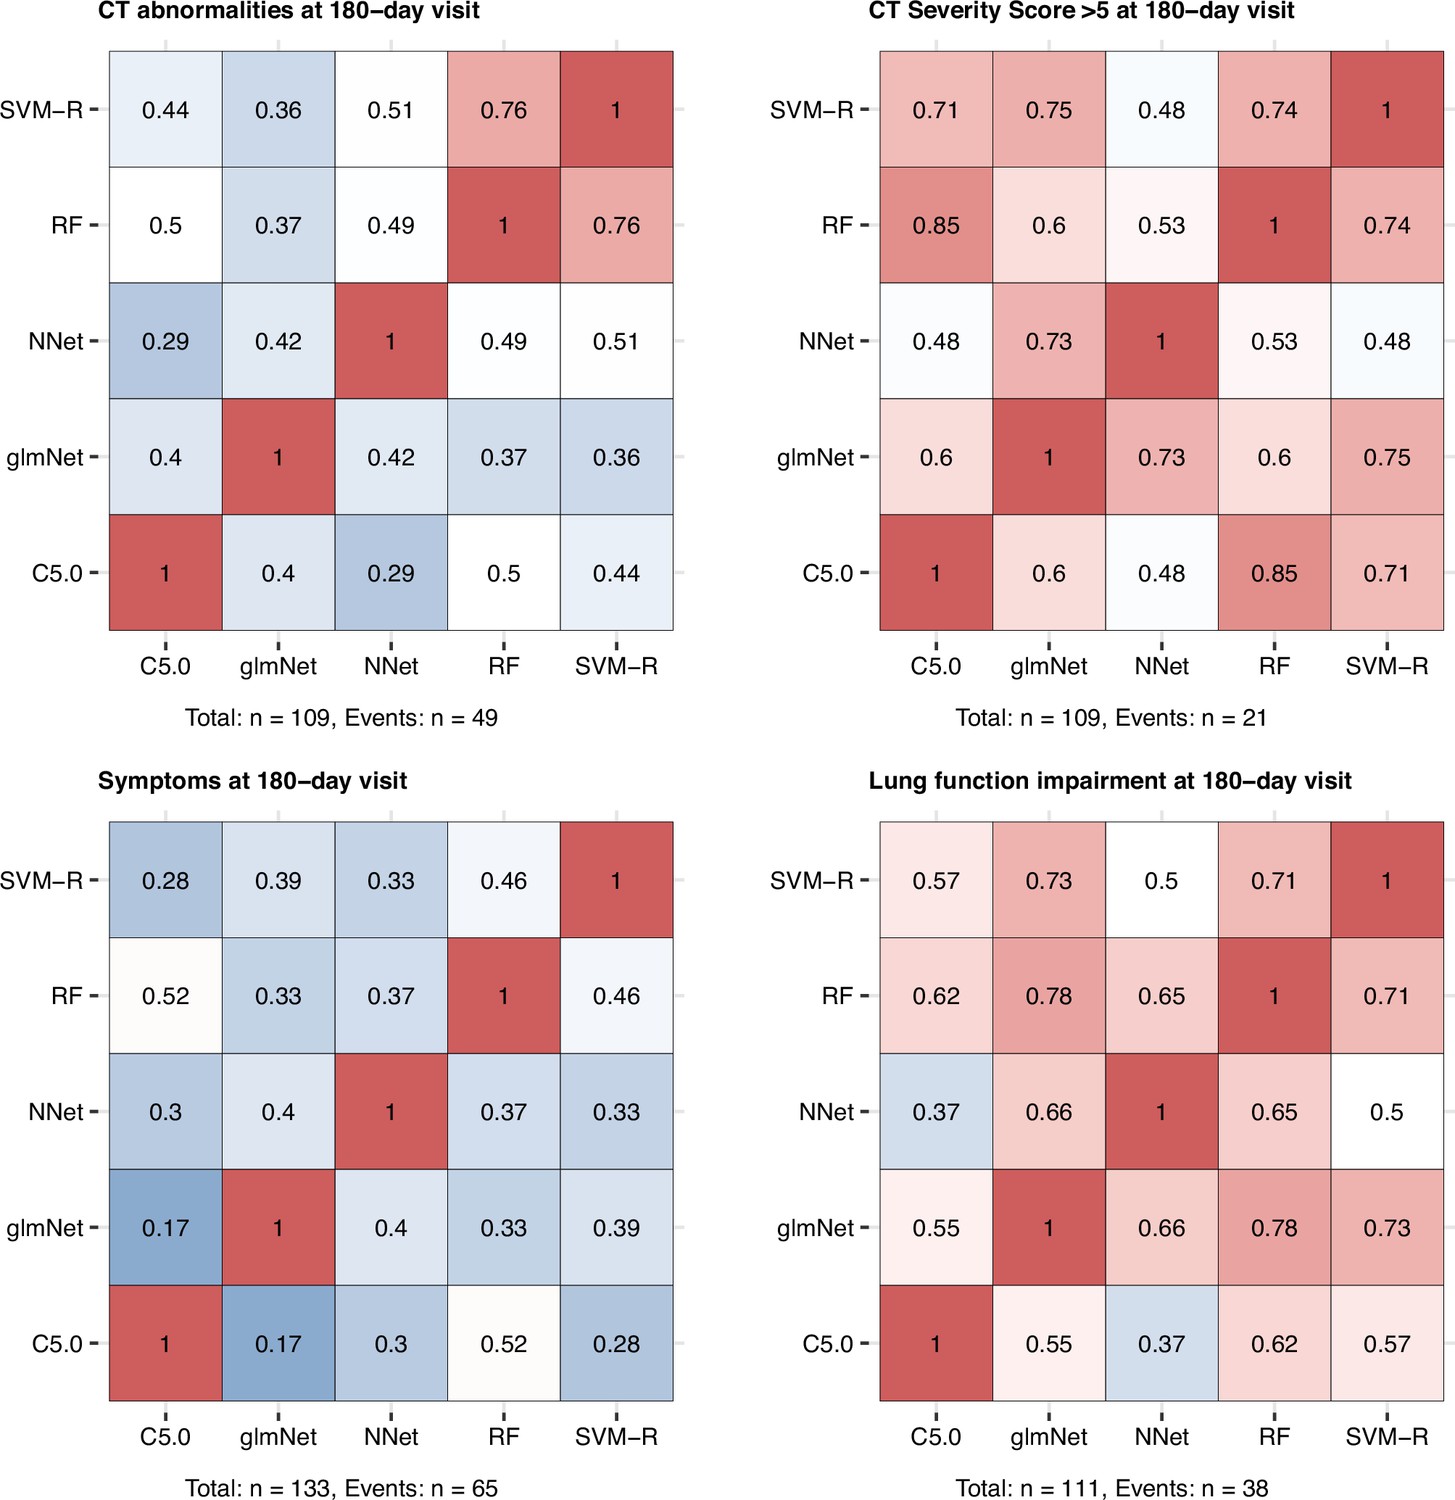
Correlation of the machine learning algorithm prediction accuracy.
Machine learning classifiers (C5.0; RF: random forests; SVM-R: support vector machines with radial kernel; NNet: neural network; glmNet: elastic net) were trained in the cohort data set with 52 non-computed tomography (non-CT) and non-lung function binary explanatory variables recorded for acute COVID-19 or at the early 60-day follow-up visit (Appendix 1—table 1) for predicting outcome variables at the 180-day follow-up visit (any lung CT abnormalities, moderate-to-severe lung CT abnormalities [severity score > 5], functional lung impairment, and persistent symptoms) (Figure 9, Appendix 1—table 4). The prediction accuracy was verified by repeated 20-fold cross-validation (five repeats). Pearson’s correlation coefficients of the classifier prediction accuracy in the cross-validation are presented as heat maps. Numbers of complete observations and outcome events are indicated under the plots.
Figure 9—figure supplement 2

Machine learning model ensembles.
Single machine learning classifiers (C5.0; RF: random forests; SVM-R: support vector machines with radial kernel; NNet: neural network; glmNet: elastic net) were trained as shown in Figure 9. The model ensembles based on the single classifiers were constructed with the glmNet procedure (Appendix 1—table 4). glmNet regression coefficients (β) are presented in the plots. Point and text color correspond to the β value. Numbers of complete observations and outcome events are indicated under the plots.
Figure 9—figure supplement 3

Prediction of persistent radiological lung abnormalities, functional lung impairment, and symptoms by machine learning algorithms in the training data sets.
Single machine learning classifiers (C5.0; RF: random forests; SVM-R: support vector machines with radial kernel; NNet: neural network; glmNet: elastic net) and their ensembles were trained as shown in Figure 9. Performance of the classifiers in the training data sets was investigated by receiver-operating characteristic (ROC) of the algorithms (AUC: area under the curve; Sens: sensitivity; Spec: specificity, Appendix 1—table 5). Numbers of complete observations and outcome events are indicated under the plots.
Figure 9—figure supplement 4
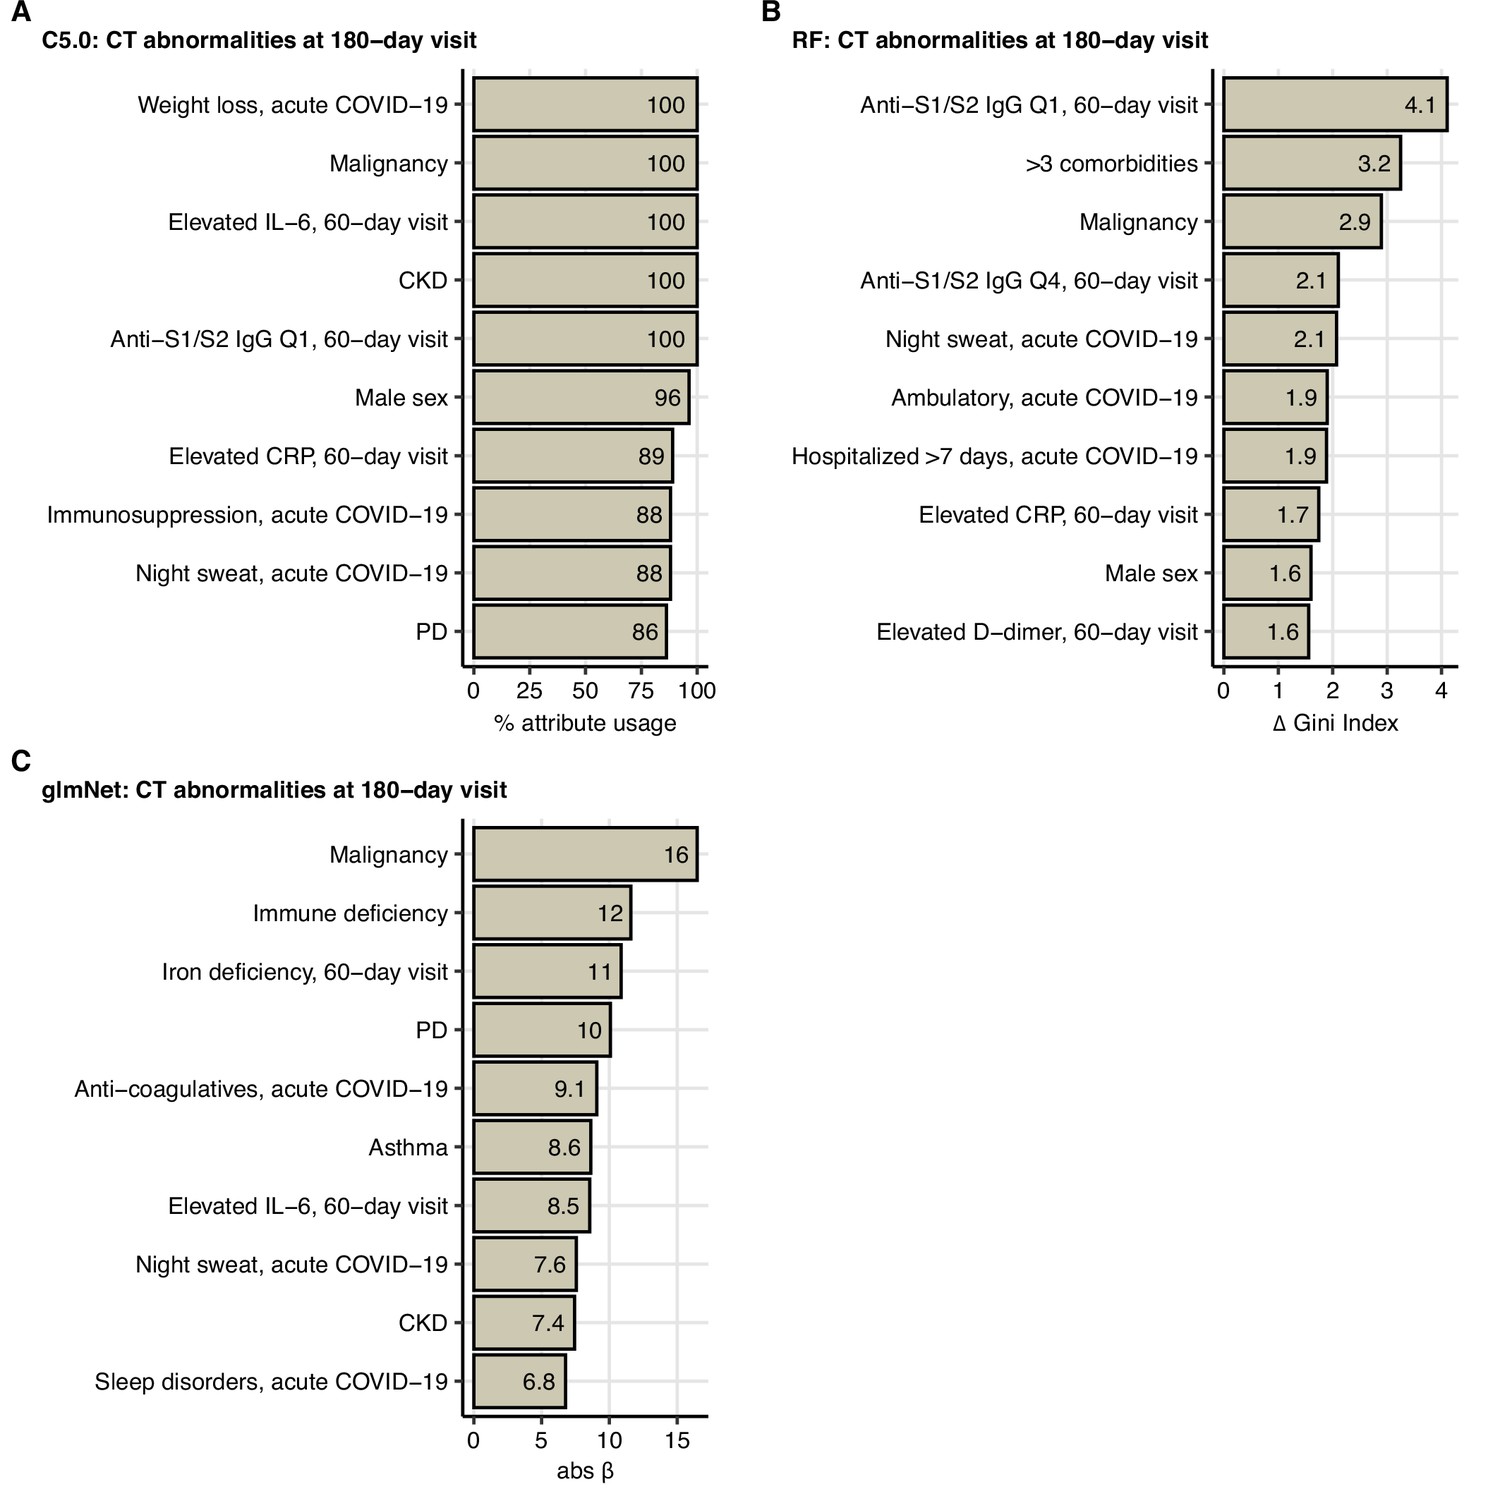
Variable importance statistics for prediction of lung computed tomography (CT) abnormalities at the 180-day follow-up by machine learning classifiers.
C5.0, random forests (RF), and elastic net (glmNet) classifiers were trained as presented in Figure 9 for prediction of any lung CT abnormalities at the 180-day follow-up visit. Variable importance measures (C5.0: % attribute/variable usage in the tree model (A); RF: difference in Gini index (B); glmNet: absolute value of the regression coefficient β (C)) for the 10 most influential explanatory variables are presented. CKD: chronic kidney disease; Q1, Q4: first, fourth quartile of anti-S1/S2 IgG titer; PD: pulmonary disease; CKD: chronic kidney disease.
Figure 9—figure supplement 5

Variable importance statistics for prediction of moderate-to-severe lung computed tomography (CT) abnormalities at the 180-day follow-up by machine learning classifiers.
C5.0, random forests (RF), and elastic net (glmNet) classifiers were trained as presented in Figure 9 for prediction of moderate-to-severe lung CT abnormalities (severity score > 5) at the 180-day follow-up visit. Variable importance measures (C5.0: % attribute/variable usage in the tree model (A); RF: difference in Gini index (B); glmNet: absolute value of the regression coefficient β (C)) for the 10 most influential explanatory variables are presented. PD: pulmonary disease; GITD: gastrointestinal disease; Q1, Q2, Q4: first, second, fourth quartile of anti-S1/S2 IgG titer.
Figure 9—figure supplement 6
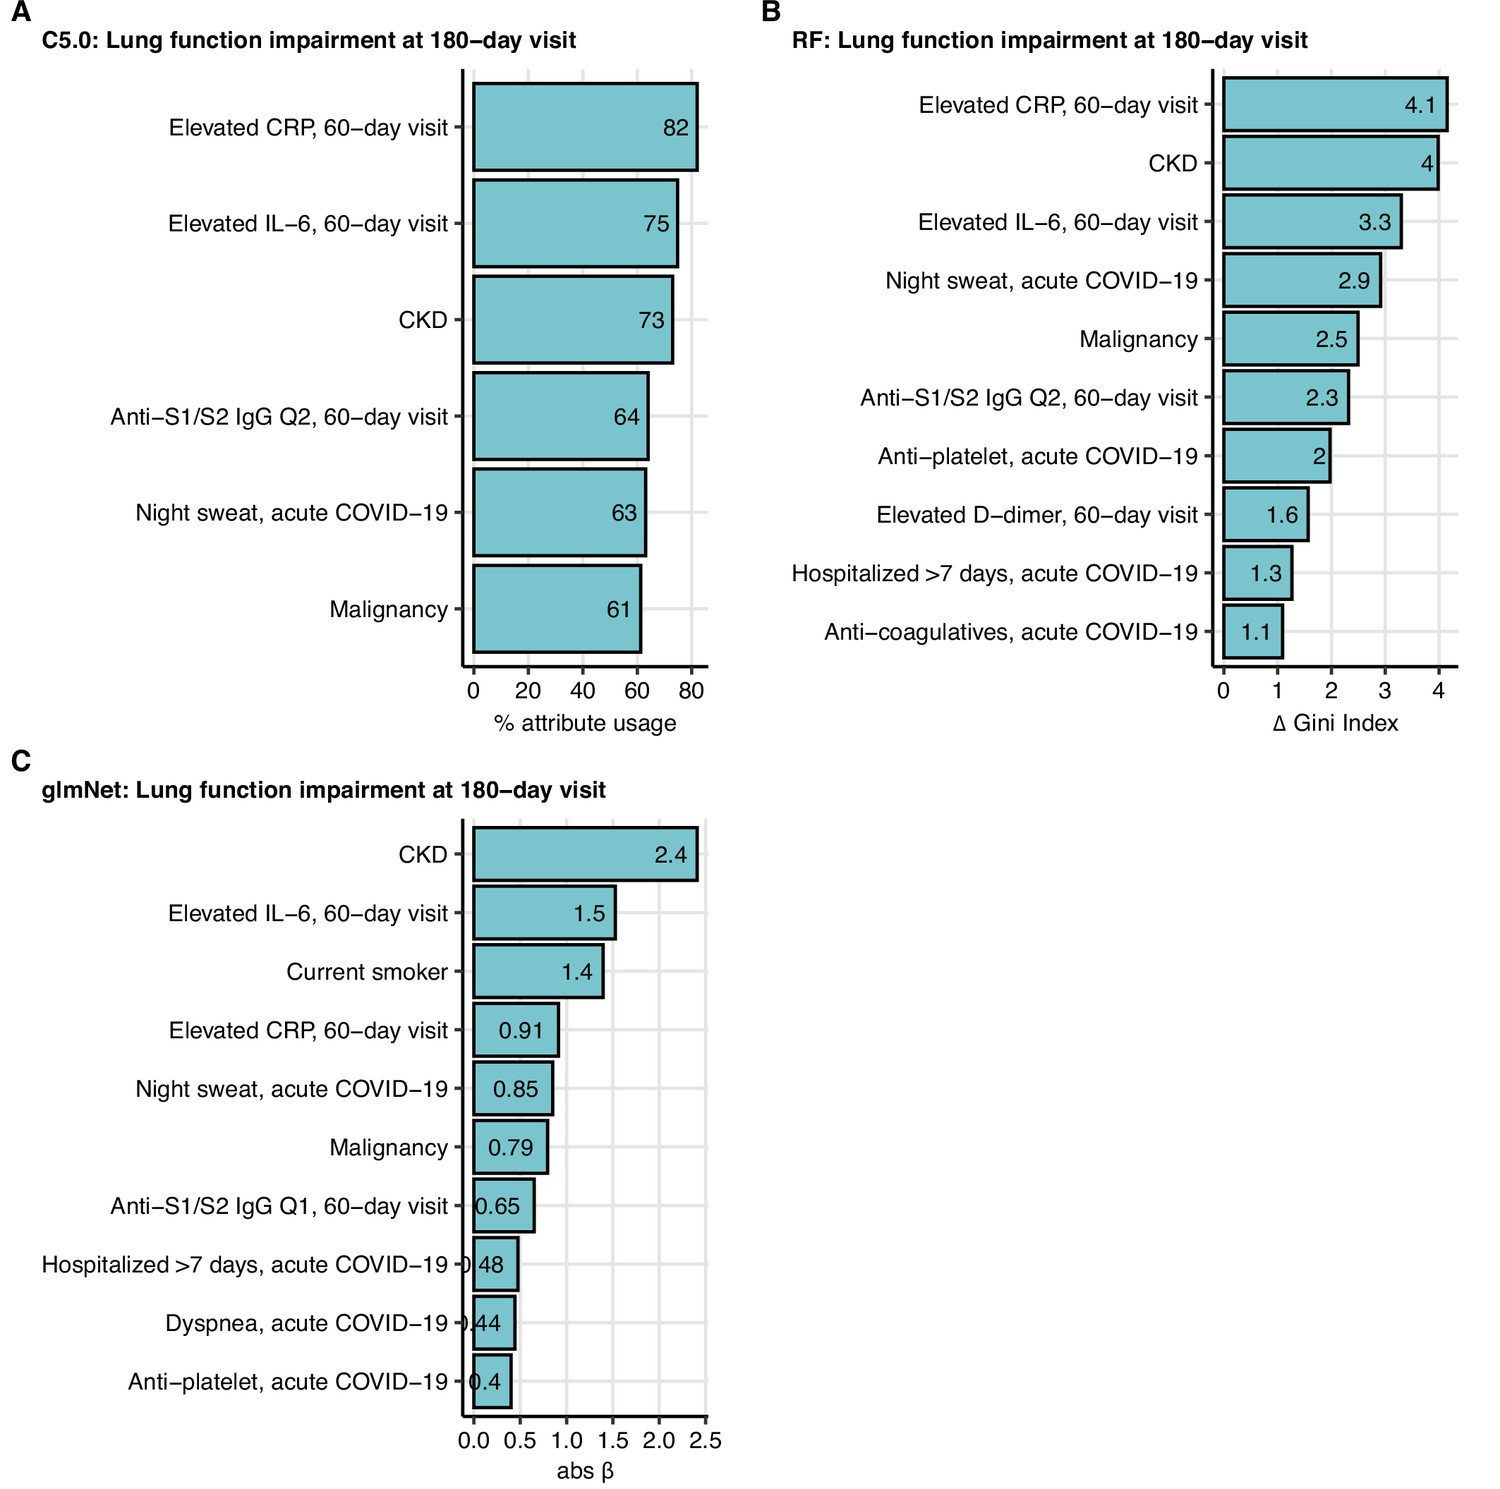
Variable importance statistics for prediction of functional lung impairment at the 180-day follow-up by machine learning classifiers.
C5.0, random forests (RF), and elastic net (glmNet) classifiers were trained as presented in Figure 9 for prediction of functional lung impairment at the 180-day follow-up visit. Variable importance measures (C5.0: % attribute/variable usage in the tree model (A); RF: difference in Gini index (B); glmNet: absolute value of the regression coefficient β (C)) for the 10 most influential explanatory variables are presented. CKD: chronic kidney disease; Q1, Q2: first. second quartile of anti-S1/S2 IgG titer.
Figure 9—figure supplement 7
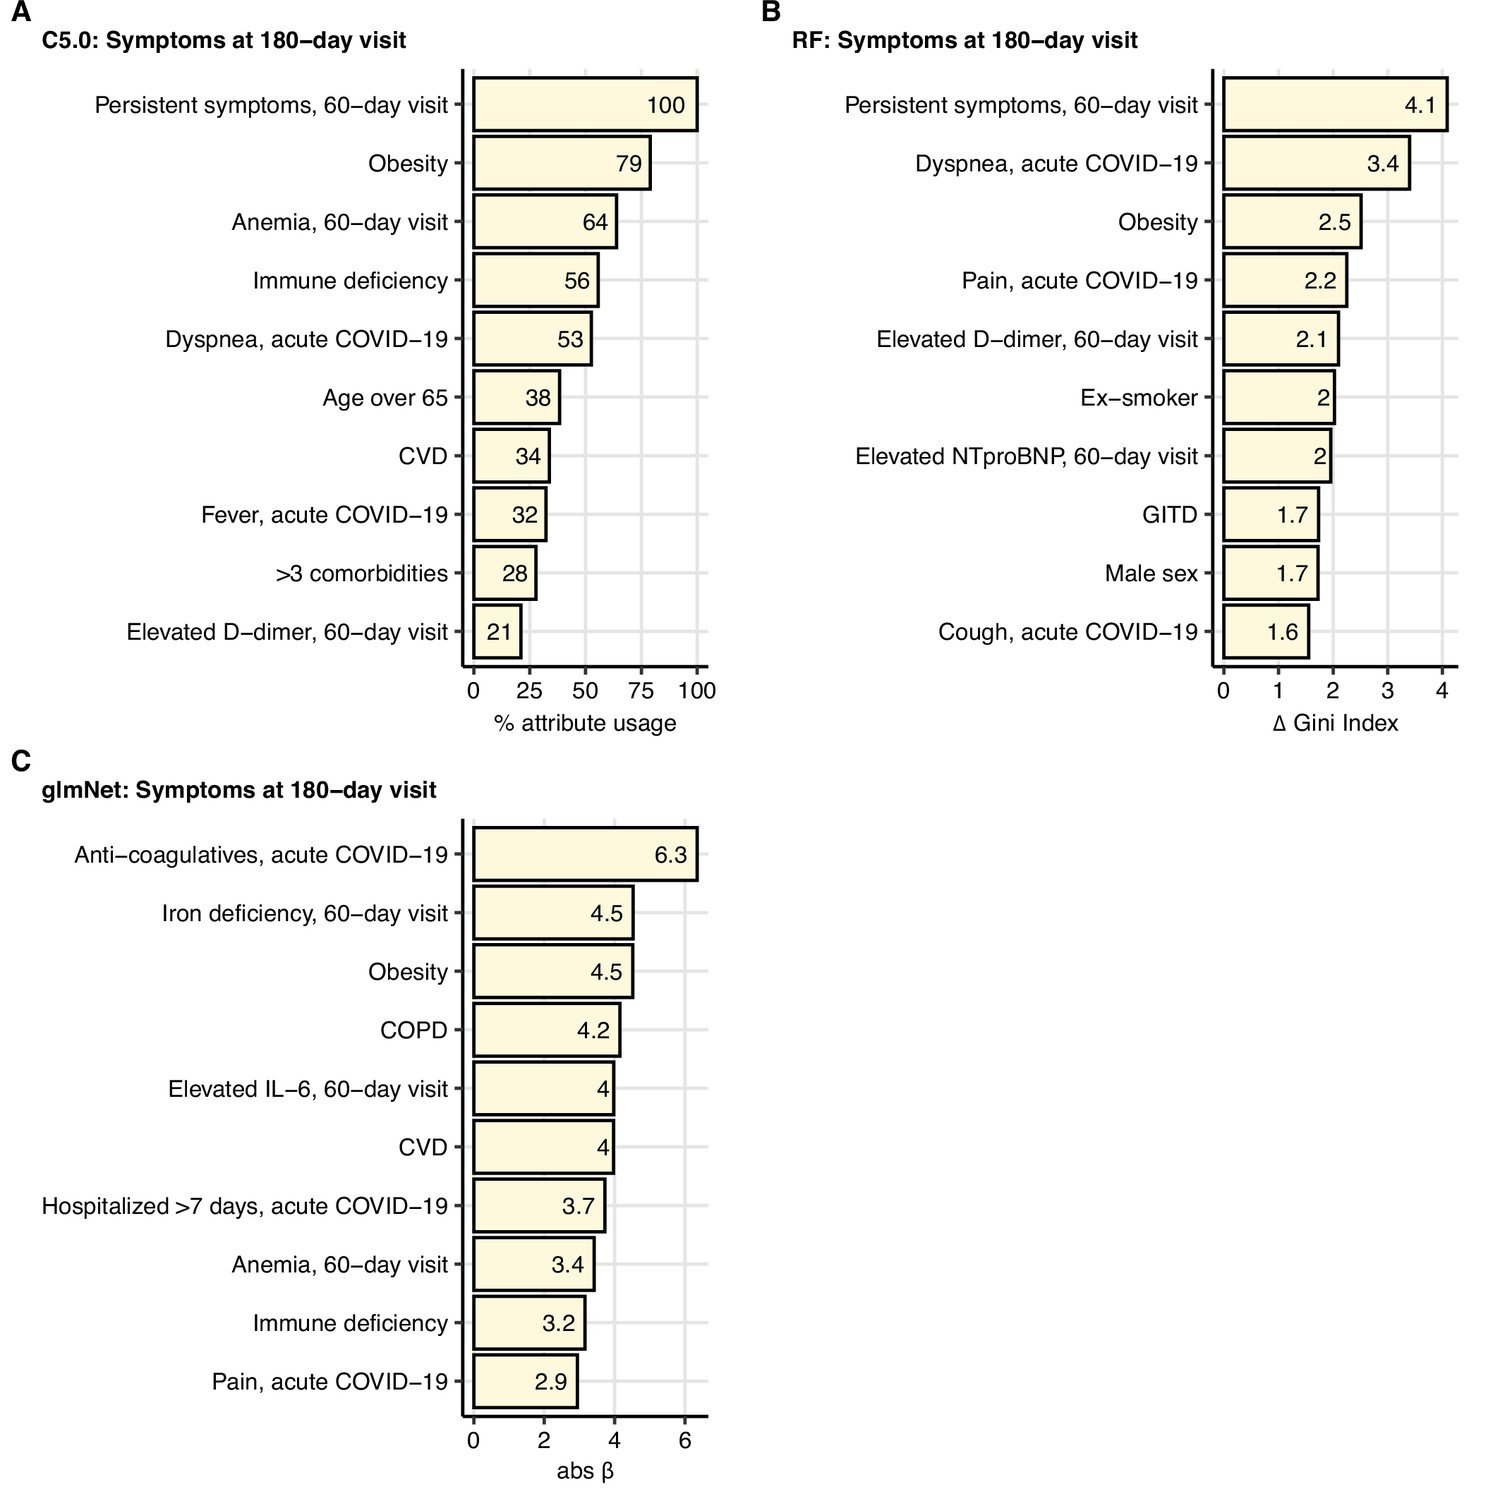
Variable importance statistics for prediction of persistent symptoms at the 180-day follow-up by machine learning classifiers.
C5.0, random forests (RF), and elastic net (glmNet) classifiers were trained as presented in Figure 9 for prediction of persistent symptoms at the 180-day follow-up visit. Variable importance measures (C5.0: % attribute/variable usage in the tree model (A); RF: difference in Gini index (B); glmNet: absolute value of the regression coefficient β (C)) for the 10 most influential explanatory variables are presented. CVD: cardiovascular disease; GITD: gastrointestinal disease; COPD: chronic obstructive lung disease.
Figure 10

Performance of the machine learning ensemble classifier in mild-to-moderate and severe-to-critical COVID-19 convalescents.
The machine learning classifier ensemble (Ens) was developed as presented in Figure 9. Its performance at predicting outcome variables at the 180-day follow-up visit (any computed tomography [CT] lung abnormalities, moderate-to-severe lung CT abnormalities [severity score > 5], functional lung impairment, and persistent symptoms) in the entire cohort, mild-to-moderate (outpatient or hospitalized without oxygen), and severe-to-critical COVID-19 convalescents (oxygen therapy or ICU) in repeated 20-fold cross-validation (five repeats) was assessed by receiver-operating characteristic (ROC) (Appendix 1—table 6). ROC curves and statistics (AUC: area under the curve; Se: sensitivity; Sp: specificity) in the cross-validation are shown. Numbers of complete observations and outcome events are indicated in the plots.
Tables
Table 1
Characteristics of the study population.
| Characteristics (% cohort) | |
|---|---|
| Total participants – no. | 145 |
| Mean age, years | 57.3 (SD = 14.3) |
| Female sex | 42.4% (n = 63) |
| Obesity (body mass index >30 kg/m2) | 19.3% (n = 28) |
| Ex-smoker | 39.3% (n = 57) |
| Active smoker | 2.8% (n = 4) |
| Acute COVID-19 severity (% cohort) | |
| Mild: outpatient | 24.8% (n = 36) |
| Moderate: inpatient without oxygen therapy | 25.5% (n = 37) |
| Severe: inpatient with oxygen therapy | 27.6% (n = 40) |
| Critical: intensive care unit | 22.1% (n = 32) |
| Comorbidities (% cohort) | |
| None | 22.8% (n = 33) |
| Cardiovascular disease | 40% (n = 58) |
| Pulmonary disease | 18.6% (n = 27) |
| Metabolic disease | 43.4% (n = 63) |
| Chronic kidney disease | 6.9% (n = 10) |
| Gastrointestinal tract diseases | 13.8% (n = 20) |
| Malignancy | 11.7% (n = 17) |
Table 2
Hospitalization and medication during acute COVID-19.
| Parameter | Outpatient (n = 36) | Hospitalized (n = 37) | Hospitalized oxygen therapy (n = 40) | Hospitalized intensive care unit (n = 32) |
|---|---|---|---|---|
| Mean hospitalization time, days | 0 (SD = 0) | 6.9 (SD = 3.6) | 11.8 (SD = 6.3) | 34.8 (SD = 15.7) |
| Hospitalized >7 days | 0% (n = 0) | 43.2% (n = 16) | 80% (n = 32) | 100% (n = 32) |
| Anti-infectives | 11.1% (n = 4) | 45.9% (n = 17) | 72.5% (n = 29) | 87.5% (n = 28) |
| Antiplatelet drugs | 2.8% (n = 1) | 10.8% (n = 4) | 22.5% (n = 9) | 25% (n = 8) |
| Anticoagulatives | 2.8% (n = 1) | 2.7% (n = 1) | 5% (n = 2) | 15.6% (n = 5) |
| Corticosteroids*† | 2.8% (n = 1) | 5.4% (n = 2) | 22.5% (n = 9) | 40.6% (n = 13) |
| Immunosuppression‡† | 0% (n = 0) | 2.7% (n = 1) | 5% (n = 2) | 9.4% (n = 3) |
-
*
From the week 4 post diagnosis on, at the discretion of the physician.
-
†
Subsumed under ‘immunosuppression, acute COVID-19’ for data analysis.
-
‡
Immunosuppressive medication prior to COVID-19.
Table 3
Radiological, functional, and clinical study outcomes.
| Outcome | 60-day follow-up | 100-day follow-up | 180-day follow-up |
|---|---|---|---|
| Any lung CT abnormalities (complete: n = 103) | 74.8% (n = 77) | 60.2% (n = 62) | 48.5% (n = 50) |
| Mild lung CT abnormalities (severity score ≤ 5) (complete: n = 103) | 26.2% (n = 27) | 36.9% (n = 38) | 29.1% (n = 30) |
| Moderate-to-severe CT abnormalities (severity score > 5) (complete: n = 103) | 48.5% (n = 50) | 23.3% (n = 24) | 19.4% (n = 20) |
| Functional lung impairment (complete: n = 116) | 39.7% (n = 46) | 37.1% (n = 43) | 33.6% (n = 39) |
| Persistent symptoms (complete: n = 145) | 79.3% (n = 115) | 67.6% (n = 98) | 49% (n = 71) |
-
CT = computed tomography.
Appendix 1—table 1
Study variables.
Variable: variable name in the analysis pipeline; reference time point: study visit, the variable was recorded at; label: variable label in figures and tables.
| Variable | Reference time point | Label | Variable type | Stratification cutoff |
|---|---|---|---|---|
| sex_male_V0 | Acute COVID-19 | Male sex | Explanatory | |
| obesity_rec_V0 | Acute COVID-19 | Obesity | Explanatory | BMI > 30 kg/m2 |
| current_smoker_V0 | Acute COVID-19 | Current smoker | Explanatory | |
| smoking_ex_V0 | Acute COVID-19 | Ex-smoker | Explanatory | |
| CVDis_rec_V0 | Acute COVID-19 | CVD | Explanatory | |
| hypertension_rec_V0 | Acute COVID-19 | Hypertension | Explanatory | |
| PDis_rec_V0 | Acute COVID-19 | PD | Explanatory | |
| COPD_rec_V0 | Acute COVID-19 | COPD | Explanatory | |
| asthma_rec_V0 | Acute COVID-19 | Asthma | Explanatory | |
| endocrine_metabolic_rec_V0 | Acute COVID-19 | Metabolic disorders | Explanatory | |
| hypercholesterolemia_rec_V0 | Acute COVID-19 | Hypercholesterolemia | Explanatory | |
| diabetes_rec_V0 | Acute COVID-19 | Diabetes | Explanatory | |
| CKDis_rec_V0 | Acute COVID-19 | CKD | Explanatory | |
| GITDis_rec_V0 | Acute COVID-19 | GITD | Explanatory | |
| malignancy_rec_V0 | Acute COVID-19 | Malignancy | Explanatory | |
| immune_deficiency_rec_V0 | Acute COVID-19 | Immune deficiency | Explanatory | |
| weight_change_rec_V0 | Acute COVID-19 | Weight loss, acute COVID-19 | Explanatory | ≥1 kg |
| dyspnoe_rec_V0 | Acute COVID-19 | Dyspnea, acute COVID-19 | Explanatory | |
| cough_rec_V0 | Acute COVID-19 | Cough, acute COVID-19 | Explanatory | |
| fever_rec_V0 | Acute COVID-19 | Fever, acute COVID-19 | Explanatory | |
| night_sweat_rec_V0 | Acute COVID-19 | Night sweat, acute COVID-19 | Explanatory | |
| pain_rec_V0 | Acute COVID-19 | Pain, acute COVID-19 | Explanatory | |
| GI_sympt_rec_V0 | Acute COVID-19 | GI symptoms, acute COVID-19 | Explanatory | |
| anosmia_rec_V0 | Acute COVID-19 | Anosmia, acute COVID-19 | Explanatory | |
| ECOG_imp_rec_V0 | Acute COVID-19 | Impaired performance, acute COVID-19 | Explanatory | ECOG ≥ 1 |
| sleep_disorder_rec_V0 | Acute COVID-19 | Sleep disorders, acute COVID-19 | Explanatory | |
| treat_antiinfec_rec_V0 | Acute COVID-19 | Anti-infectives, acute COVID-19 | Explanatory | |
| treat_antiplat_rec_V0 | Acute COVID-19 | Antiplatelet, acute COVID-19 | Explanatory | |
| treat_anticoag_rec_V0 | Acute COVID-19 | Anticoagulatives, acute COVID-19 | Explanatory | |
| treat_immunosuppr_rec_V0 | Acute COVID-19 | Immunosuppression, acute COVID-19 | Explanatory | |
| anemia_rec_V1 | 60-day follow-up | Anemia, 60-day visit | Explanatory | Male: Hb < 14 g/dL; female: Hb <12 g/dL |
| ferr_elv_rec_V1 | 60-day follow-up | Elevated ferritin, 60-day visit | Explanatory | Male: > 300 ng/mL; female: > 150 ng/mL |
| NTelv_rec_V1 | 60-day follow-up | Elevated NTproBNP, 60-day visit | Explanatory | >125 pg/mL |
| Ddimerelv_rec_V1 | 60-day follow-up | Elevated D-dimer, 60-day visit | Explanatory | >500 pg/mL FEU |
| CRP_elv_rec_V1 | 60-day follow-up | Elevated CRP, 60-day visit | Explanatory | >0.5 mg/dL |
| IL6_elv_rec_V1 | 60-day follow-up | Elevated IL-6, 60-day visit | Explanatory | >7 pg/mL |
| iron_deficiency_30_rec_V1 | 60-day follow-up | Iron deficiency, 60-day visit | Explanatory | TF-saturation < 15% |
| age_65_V0 | Acute COVID-19 | Age over 65 | Explanatory | >65 years |
| hosp_7d_V0 | Acute COVID-19 | Hospitalized > 7 days, acute COVID-19 | Explanatory | >7 days |
| comorb_present_V0 | Acute COVID-19 | Any comorbidity | Explanatory | >0 comorbidities |
| comorb_3_V0 | Acute COVID-19 | >3 comorbidities | Explanatory | >3 comorbidities |
| overweight_V0 | Acute COVID-19 | Overweight or obesity | Explanatory | BMI > 25 kg/m2 |
| sympt_6_V0 | Acute COVID-19 | >6 symptoms, acute COVID-19 | Explanatory | >6 symptoms |
| sympt_present_V1 | 60-day follow-up | Persistent symptoms, 60-day visit | Explanatory | >0 symptoms at 180-day visit |
| ab_0_V1 | 60-day follow-up | Anti-S1/S2 IgG Q1, 60-day visit | Explanatory | (0, 312] BAU/mL |
| ab_25_V1 | 60-day follow-up | Anti-S1/S2 IgG Q2, 60-day visit | Explanatory | (312, 644] BAU/mL |
| ab_50_V1 | 60-day follow-up | Anti-S1/S2 IgG Q3, 60-day visit | Explanatory | (644, 975] BAU/mL |
| ab_75_V1 | 60-day follow-up | Anti-S1/S2 IgG Q4, 60-day visit | Explanatory | > 975 BAU/mL |
| pat_group_G1_V0 | Acute COVID-19 | Ambulatory, acute COVID-19 | Explanatory | |
| pat_group_G2_V0 | Acute COVID-19 | Hospitalized, acute COVID-19 | Explanatory | |
| pat_group_G3_V0 | Acute COVID-19 | Oxygen therapy, acute COVID-19 | Explanatory | |
| pat_group_G4_V0 | Acute COVID-19 | ICU, acute COVID-19 | Explanatory | |
| CT_findings_V3 | 180-day follow-up | CT abnormalities at 180-day visit | Outcome | |
| CT_sev_low_V3 | 180-day follow-up | CT severity score 1–5 at 180-day visit | Outcome | |
| CTsevabove5_V3 | 180-day follow-up | CT severity score >5 at 180-day visit | Outcome | |
| sympt_present_V3 | 180-day follow-up | Symptoms at 180-day visit | Outcome | |
| lung_function_impaired_V3 | 180-day follow-up | Lung function impairment at 180-day visit | Outcome |
-
CVD = cardiovascular disease; PD = pulmonary disease; COPD = chronic obstructive pulmonary disease; CKD = chronic kidney disease; GITD = gastrointestinal disease; GI = gastrointestinal; CRP = C-reactive protein; ICU = intensive care unit; CT = computed tomography; BMI = body mass index; BAU = binding antibody unit.
Appendix 1—table 2
Results of univariate risk modeling.
Outcome: outcome variable at the 180-day follow-up visit; covariate: explanatory variable; baseline: reference level of the explanatory variable; OR: odds ratios with 95% confidence intervals; pFDR: significanct p-value corrected for multiple testing with the Benjamini–Hochberg method (FDR: false discovery rate).
| Outcome | Covariate | Baseline | Complete cases | OR | pFDR |
|---|---|---|---|---|---|
| CT abnormalities at 180-day visit | Male sex, n = 63 | No male sex, n = 55 | 118 | 3.79 [1.77–8.44] | p=0.01 |
| CT abnormalities at 180-day visit | Obesity, n = 22 | No obesity, n = 96 | 118 | 1.07 [0.415–2.72] | ns (p=0.9) |
| CT abnormalities at 180-day visit | Current smoker, n = 4 | No current smoker, n = 114 | 118 | 0.412 [0.02–3.33] | ns (p=0.51) |
| CT abnormalities at 180-day visit | Ex-smoker, n = 48 | No ex-smoker, n = 70 | 118 | 1.5 [0.716–3.16] | ns (p=0.36) |
| CT abnormalities at 180-day visit | CVD, n = 45 | No CVD, n = 73 | 118 | 3.36 [1.57–7.43] | p=0.012 |
| CT abnormalities at 180-day visit | Hypertension, n = 34 | No hypertension, n = 84 | 118 | 3.97 [1.73–9.54] | p=0.01 |
| CT abnormalities at 180-day visit | PD, n = 24 | No PD, n = 94 | 118 | 2.06 [0.837–5.25] | ns (p=0.2) |
| CT abnormalities at 180-day visit | COPD, n = 6 | No COPD, n = 112 | 118 | 2.67 [0.499–19.8] | ns (p=0.34) |
| CT abnormalities at 180-day visit | Asthma, n = 9 | No asthma, n = 109 | 118 | 1.02 [0.24–4.04] | ns (p=0.99) |
| CT abnormalities at 180-day visit | Metabolic disorders, n = 50 | No metabolic disorders, n = 68 | 118 | 3.14 [1.48–6.81] | p=0.017 |
| CT abnormalities at 180-day visit | Hypercholesterolemia, n = 22 | No hypercholesterolemia, n = 96 | 118 | 2.67 [1.04–7.27] | ns (p=0.093) |
| CT abnormalities at 180-day visit | Diabetes, n = 18 | No diabetes, n = 100 | 118 | 4.07 [1.41–13.5] | p=0.041 |
| CT abnormalities at 180-day visit | GITD, n = 17 | No GITD, n = 101 | 118 | 3.66 [1.25–12.2] | ns (p=0.061) |
| CT abnormalities at 180-day visit | Malignancy, n = 13 | No malignancy, n = 105 | 118 | 19.5 [3.63–362] | p=0.021 |
| CT abnormalities at 180-day visit | Immune deficiency, n = 5 | No immune deficiency, n = 113 | 118 | 1.96 [0.313–15.3] | ns (p=0.53) |
| CT abnormalities at 180-day visit | Weight loss, acute COVID-19, n = 84 | No weight loss, acute COVID-19, n = 34 | 118 | 4.45 [1.83–12.1] | p=0.011 |
| CT abnormalities at 180-day visit | Dyspnea, acute COVID-19, n = 81 | No dyspnea, acute COVID-19, n = 37 | 118 | 1.45 [0.661–3.27] | ns (p=0.43) |
| CT abnormalities at 180-day visit | Cough, acute COVID-19, n = 83 | No cough, acute COVID-19, n = 35 | 118 | 1.07 [0.484–2.41] | ns (p=0.89) |
| CT abnormalities at 180-day visit | Fever, acute COVID-19, n = 83 | No fever, acute COVID-19, n = 35 | 118 | 2.56 [1.12–6.21] | ns (p=0.072) |
| CT abnormalities at 180-day visit | Night sweat, acute COVID-19, n = 74 | No night sweat, acute COVID-19, n = 44 | 118 | 1.93 [0.902–4.26] | ns (p=0.17) |
| CT abnormalities at 180-day visit | Pain, acute COVID-19, n = 65 | No pain, acute COVID-19, n = 53 | 118 | 0.339 [0.157–0.713] | p=0.021 |
| CT abnormalities at 180-day visit | GI symptoms, acute COVID-19, n = 47 | No GI symptoms, acute COVID-19, n = 71 | 118 | 0.675 [0.316–1.42] | ns (p=0.38) |
| CT abnormalities at 180-day visit | Anosmia, acute COVID-19, n = 53 | No anosmia, acute COVID-19, n = 65 | 118 | 1.09 [0.526–2.28] | ns (p=0.85) |
| CT abnormalities at 180-day visit | Impaired performance, acute COVID-19, n = 106 | No impaired performance, acute COVID-19, n = 12 | 118 | 1.12 [0.335–3.98] | ns (p=0.89) |
| CT abnormalities at 180-day visit | Sleep disorders, acute COVID-19, n = 40 | No sleep disorders, acute COVID-19, n = 77 | 117 | 0.887 [0.407–1.91] | ns (p=0.82) |
| CT abnormalities at 180-day visit | Anti-infectives, acute COVID-19, n = 64 | No anti-infectives, acute COVID-19, n = 54 | 118 | 3.56 [1.67–7.9] | p=0.01 |
| CT abnormalities at 180-day visit | Antiplatelet, acute COVID-19, n = 12 | No antiplatelet, acute COVID-19, n = 106 | 118 | 4.4 [1.23–20.7] | ns (p=0.077) |
| CT abnormalities at 180-day visit | Anticoagulatives, acute COVID-19, n = 4 | No anticoagulatives, acute COVID-19, n = 114 | 118 | 3.98 [0.493–81.8] | ns (p=0.32) |
| CT abnormalities at 180-day visit | Immunosuppression, acute COVID-19, n = 20 | No immunosuppression, acute COVID-19, n = 98 | 118 | 6.89 [2.32–25.5] | p=0.01 |
| CT abnormalities at 180-day visit | Anemia, 60-day visit, n = 10 | No anemia, 60-day visit, n = 108 | 118 | 5.82 [1.38–39.8] | ns (p=0.072) |
| CT abnormalities at 180-day visit | Elevated ferritin, 60-day visit, n = 20 | No elevated ferritin, 60-day visit, n = 98 | 118 | 2.18 [0.825–6.01] | ns (p=0.2) |
| CT abnormalities at 180-day visit | Elevated NTproBNP, 60-day visit, n = 38 | No elevated NTproBNP, 60-day visit, n = 80 | 118 | 2.29 [1.05–5.1] | ns (p=0.084) |
| CT abnormalities at 180-day visit | Elevated D-dimer, 60-day visit, n = 49 | No elevated D-dimer, 60-day visit, n = 69 | 118 | 2.9 [1.37–6.28] | p=0.023 |
| CT abnormalities at 180-day visit | Elevated CRP, 60-day visit, n = 18 | No elevated CRP, 60-day visit, n = 100 | 118 | 5.71 [1.89–21.3] | p=0.019 |
| CT abnormalities at 180-day visit | Elevated IL-6, 60-day visit, n = 11 | No elevated IL-6, 60-day visit, n = 107 | 118 | 15.5 [2.81–289] | p=0.036 |
| CT abnormalities at 180-day visit | Iron deficiency, 60-day visit, n = 6 | No iron deficiency, 60-day visit, n = 112 | 118 | 0.239 [0.0123–1.55] | ns (p=0.29) |
| CT abnormalities at 180-day visit | Age over 65, n = 32 | No age over 65, n = 86 | 118 | 2.81 [1.23–6.66] | p=0.045 |
| CT abnormalities at 180-day visit | Hospitalized >7 days, acute COVID-19, n = 59 | No hospitalized >7 days, acute COVID-19, n = 59 | 118 | 4.93 [2.28–11.1] | p=0.0026 |
| CT abnormalities at 180-day visit | Any comorbidity, n = 90 | No any comorbidity, n = 28 | 118 | 6.86 [2.41–24.8] | p=0.01 |
| CT abnormalities at 180-day visit | >3 comorbidities, n = 37 | No >3 comorbidities, n = 81 | 118 | 6.05 [2.62–14.9] | p=0.0026 |
| CT abnormalities at 180-day visit | Overweight or obesity, n = 72 | No overweight or obesity, n = 46 | 118 | 1.61 [0.762–3.48] | ns (p=0.3) |
| CT abnormalities at 180-day visit | >6 symptoms, acute COVID-19, n = 33 | No >6 symptoms, acute COVID-19, n = 85 | 118 | 0.767 [0.333–1.73] | ns (p=0.59) |
| CT abnormalities at 180-day visit | Persistent symptoms, 60-day visit, n = 93 | No persistent symptoms, 60-day visit, n = 25 | 118 | 1.91 [0.769–5.08] | ns (p=0.26) |
| CT abnormalities at 180-day visit | Anti-S1/S2 IgG Q1, 60-day visit, n = 31 | No anti-S1/S2 IgG Q1, 60-day visit, n = 79 | 110 | 0.0769 [0.0173–0.24] | p=0.0026 |
| CT abnormalities at 180-day visit | Anti-S1/S2 IgG Q2, 60-day visit, n = 30 | No anti-S1/S2 IgG Q2, 60-day visit, n = 80 | 110 | 1.12 [0.481–2.62] | ns (p=0.83) |
| CT abnormalities at 180-day visit | Anti-S1/S2 IgG Q3, 60-day visit, n = 27 | No anti-S1/S2 IgG Q3, 60-day visit, n = 83 | 110 | 1.8 [0.753–4.4] | ns (p=0.28) |
| CT abnormalities at 180-day visit | Anti-S1/S2 IgG Q4, 60-day visit, n = 22 | No anti-S1/S2 IgG Q4, 60-day visit, n = 88 | 110 | 5.95 [2.13–19.5] | p=0.01 |
| CT abnormalities at 180-day visit | Ambulatory, acute COVID-19, n = 33 | No ambulatory, acute COVID-19, n = 85 | 118 | 0.106 [0.0296–0.299] | p=0.0026 |
| CT abnormalities at 180-day visit | Hospitalized, acute COVID-19, n = 33 | No hospitalized, acute COVID-19, n = 85 | 118 | 1.28 [0.569–2.88] | ns (p=0.61) |
| CT abnormalities at 180-day visit | Oxygen therapy, acute COVID-19, n = 33 | No oxygen therapy, acute COVID-19, n = 85 | 118 | 1.52 [0.676–3.43] | ns (p=0.38) |
| CT abnormalities at 180-day visit | ICU, acute COVID-19, n = 19 | No ICU, acute COVID-19, n = 99 | 118 | 6.28 [2.1–23.3] | p=0.012 |
| CT severity score >5 at 180-day visit | Male sex, n = 63 | No male sex, n = 55 | 118 | 5.1 [1.75–18.7] | p=0.01 |
| CT severity score >5 at 180-day visit | Obesity, n = 22 | No obesity, n = 96 | 118 | 0.38 [0.0577–1.46] | ns (p=0.26) |
| CT severity score >5 at 180-day visit | Current smoker, n = 4 | No current smoker, n = 114 | 118 | 1.48 [0.0711–12.2] | ns (p=0.77) |
| CT severity score >5 at 180-day visit | Ex-smoker, n = 48 | No ex-smoker, n = 70 | 118 | 1.59 [0.623–4.09] | ns (p=0.37) |
| CT severity score >5 at 180-day visit | CVD, n = 45 | No CVD, n = 73 | 118 | 4.71 [1.8–13.5] | p=0.0042 |
| CT severity score >5 at 180-day visit | Hypertension, n = 34 | No hypertension, n = 84 | 118 | 3.17 [1.21–8.38] | p=0.029 |
| CT severity score >5 at 180-day visit | PD, n = 24 | No PD, n = 94 | 118 | 2.17 [0.735–6.02] | ns (p=0.18) |
| CT severity score >5 at 180-day visit | COPD, n = 6 | No COPD, n = 112 | 118 | 2.3 [0.304–12.7] | ns (p=0.39) |
| CT severity score >5 at 180-day visit | Asthma, n = 9 | No asthma, n = 109 | 118 | 2.37 [0.468–9.85] | ns (p=0.29) |
| CT severity score >5 at 180-day visit | Metabolic disorders, n = 50 | No metabolic disorders, n = 68 | 118 | 2.92 [1.14–7.95] | p=0.045 |
| CT severity score >5 at 180-day visit | Hypercholesterolemia, n = 22 | No hypercholesterolemia, n = 96 | 118 | 2.52 [0.845–7.12] | ns (p=0.12) |
| CT severity score >5 at 180-day visit | Diabetes, n = 18 | No diabetes, n = 100 | 118 | 2.63 [0.816–7.87] | ns (p=0.12) |
| CT severity score >5 at 180-day visit | CKD, n = 6 | No CKD, n = 112 | 118 | 4.89 [0.851–28.3] | ns (p=0.091) |
| CT severity score >5 at 180-day visit | GITD, n = 17 | No GITD, n = 101 | 118 | 2.9 [0.892–8.83] | ns (p=0.092) |
| CT severity score >5 at 180-day visit | Malignancy, n = 13 | No malignancy, n = 105 | 118 | 0.333 [0.0178–1.84] | ns (p=0.35) |
| CT severity score >5 at 180-day visit | Immune deficiency, n = 5 | No immune deficiency, n = 113 | 118 | 7.42 [1.16–59.3] | ns (p=0.052) |
| CT severity score >5 at 180-day visit | Weight loss, acute COVID-19, n = 84 | No weight loss, acute COVID-19, n = 34 | 118 | 3.02 [0.939–13.5] | ns (p=0.13) |
| CT severity score >5 at 180-day visit | Dyspnea, acute COVID-19, n = 81 | No dyspnea, acute COVID-19, n = 37 | 118 | 1.7 [0.609–5.54] | ns (p=0.38) |
| CT severity score >5 at 180-day visit | Cough, acute COVID-19, n = 83 | No cough, acute COVID-19, n = 35 | 118 | 0.537 [0.206–1.44] | ns (p=0.25) |
| CT severity score >5 at 180-day visit | Fever, acute COVID-19, n = 83 | No fever, acute COVID-19, n = 35 | 118 | 2.15 [0.727–7.9] | ns (p=0.24) |
| CT severity score >5 at 180-day visit | Night sweat, acute COVID-19, n = 74 | No night sweat, acute COVID-19, n = 44 | 118 | 2.33 [0.84–7.55] | ns (p=0.17) |
| CT severity score >5 at 180-day visit | Pain, acute COVID-19, n = 65 | No pain, acute COVID-19, n = 53 | 118 | 0.495 [0.187–1.26] | ns (p=0.18) |
| CT severity score >5 at 180-day visit | GI symptoms, acute COVID-19, n = 47 | No GI symptoms, acute COVID-19, n = 71 | 118 | 0.503 [0.168–1.34] | ns (p=0.23) |
| CT severity score >5 at 180-day visit | Anosmia, acute COVID-19, n = 53 | No anosmia, acute COVID-19, n = 65 | 118 | 1.61 [0.634–4.16] | ns (p=0.36) |
| CT severity score >5 at 180-day visit | Impaired performance, acute COVID-19, n = 106 | No impaired performance, acute COVID-19, n = 12 | 118 | 2.72 [0.486–51] | ns (p=0.39) |
| CT severity score >5 at 180-day visit | Sleep disorders, acute COVID-19, n = 40 | No sleep disorders, acute COVID-19, n = 77 | 117 | 1.13 [0.412–2.91] | ns (p=0.84) |
| CT severity score >5 at 180-day visit | Anti-infectives, acute COVID-19, n = 64 | No anti-infectives, acute COVID-19, n = 54 | 118 | 4.89 [1.68–17.9] | p=0.012 |
| CT severity score >5 at 180-day visit | Antiplatelet, acute COVID-19, n = 12 | No antiplatelet, acute COVID-19, n = 106 | 118 | 3.74 [1.01–13.2] | ns (p=0.06) |
| CT severity score >5 at 180-day visit | Anticoagulatives, acute COVID-19, n = 4 | No anticoagulatives, acute COVID-19, n = 114 | 118 | 4.7 [0.538–41.1] | ns (p=0.17) |
| CT severity score >5 at 180-day visit | Immunosuppression, acute COVID-19, n = 20 | No immunosuppression, acute COVID-19, n = 98 | 118 | 5.35 [1.85–15.6] | p=0.0036 |
| CT severity score >5 at 180-day visit | Anemia, 60-day visit, n = 10 | No anemia, 60-day visit, n = 108 | 118 | 8.62 [2.23–37.1] | p=0.0039 |
| CT severity score >5 at 180-day visit | Elevated ferritin, 60-day visit, n = 20 | No elevated ferritin, 60-day visit, n = 98 | 118 | 2.2 [0.693–6.42] | ns (p=0.2) |
| CT severity score >5 at 180-day visit | Elevated NTproBNP, 60-day visit, n = 38 | No elevated NTproBNP, 60-day visit, n = 80 | 118 | 3.23 [1.25–8.55] | p=0.026 |
| CT severity score >5 at 180-day visit | Elevated D-dimer, 60-day visit, n = 49 | No elevated D-dimer, 60-day visit, n = 69 | 118 | 2.41 [0.945–6.38] | ns (p=0.096) |
| CT severity score >5 at 180-day visit | Elevated CRP, 60-day visit, n = 18 | No elevated CRP, 60-day visit, n = 100 | 118 | 4.91 [1.63–14.7] | p=0.0075 |
| CT severity score >5 at 180-day visit | Elevated IL-6, 60-day visit, n = 11 | No elevated IL-6, 60-day visit, n = 107 | 118 | 32.5 [7.43–230] | p=7.5e-05 |
| CT severity score >5 at 180-day visit | Iron deficiency, 60-day visit, n = 6 | No iron deficiency, 60-day visit, n = 112 | 118 | 0.867 [0.044–5.75] | ns (p=0.92) |
| CT severity score >5 at 180-day visit | Age over 65, n = 32 | No age over 65, n = 86 | 118 | 2.8 [1.05–7.4] | ns (p=0.055) |
| CT severity score >5 at 180-day visit | Hospitalized >7 days, acute COVID-19, n = 59 | No hospitalized >7 days, acute COVID-19, n = 59 | 118 | 4.37 [1.58–14.2] | p=0.012 |
| CT severity score >5 at 180-day visit | Any comorbidity, n = 90 | No any comorbidity, n = 28 | 118 | 8.22 [1.59–151] | ns (p=0.065) |
| CT severity score >5 at 180-day visit | >3 comorbidities, n = 37 | No >3 comorbidities, n = 81 | 118 | 5.55 [2.11–15.5] | p=0.0013 |
| CT severity score >5 at 180-day visit | Overweight or obesity, n = 72 | No overweight or obesity, n = 46 | 118 | 0.72 [0.282–1.87] | ns (p=0.53) |
| CT severity score >5 at 180-day visit | >6 symptoms, acute COVID-19, n = 33 | No >6 symptoms, acute COVID-19, n = 85 | 118 | 1.26 [0.438–3.35] | ns (p=0.69) |
| CT severity score >5 at 180-day visit | Persistent symptoms, 60-day visit, n = 93 | No persistent symptoms, 60-day visit, n = 25 | 118 | 3.15 [0.831–20.7] | ns (p=0.18) |
| CT severity score >5 at 180-day visit | Anti-S1/S2 IgG Q2, 60-day visit, n = 30 | No anti-S1/S2 IgG Q2, 60-day visit, n = 80 | 110 | 1.87 [0.666–5.07] | ns (p=0.26) |
| CT severity score >5 at 180-day visit | Anti-S1/S2 IgG Q3, 60-day visit, n = 27 | No anti-S1/S2 IgG Q3, 60-day visit, n = 83 | 110 | 0.675 [0.18–2.05] | ns (p=0.55) |
| CT severity score >5 at 180-day visit | Anti-S1/S2 IgG Q4, 60-day visit, n = 22 | No anti-S1/S2 IgG Q4, 60-day visit, n = 88 | 110 | 4.38 [1.53–12.6] | p=0.01 |
| CT severity score >5 at 180-day visit | Ambulatory, acute COVID-19, n = 33 | No ambulatory, acute COVID-19, n = 85 | 118 | 0.0952 [0.0052–0.488] | p=0.039 |
| CT severity score >5 at 180-day visit | Hospitalized, acute COVID-19, n = 33 | No hospitalized, acute COVID-19, n = 85 | 118 | 0.714 [0.218–2.01] | ns (p=0.58) |
| CT severity score >5 at 180-day visit | Oxygen therapy, acute COVID-19, n = 33 | No oxygen therapy, acute COVID-19, n = 85 | 118 | 0.958 [0.316–2.61] | ns (p=0.95) |
| CT severity score >5 at 180-day visit | ICU, acute COVID-19, n = 19 | No ICU, acute COVID-19, n = 99 | 118 | 8.06 [2.75–24.5] | p=0.00035 |
| Symptoms at 180-day visit | Male sex, n = 82 | No male sex, n = 63 | 145 | 0.701 [0.361–1.35] | ns (p=0.97) |
| Symptoms at 180-day visit | Obesity, n = 28 | No obesity, n = 117 | 145 | 0.42 [0.169–0.982] | ns (p=0.84) |
| Symptoms at 180-day visit | Current smoker, n = 4 | No current smoker, n = 141 | 145 | 3.22 [0.401–66] | ns (p=0.97) |
| Symptoms at 180-day visit | Ex-smoker, n = 57 | No ex-smoker, n = 88 | 145 | 1.27 [0.654–2.49] | ns (p=0.97) |
| Symptoms at 180-day visit | CVD, n = 58 | No CVD, n = 87 | 145 | 0.851 [0.436–1.66] | ns (p=0.97) |
| Symptoms at 180-day visit | Hypertension, n = 44 | No hypertension, n = 101 | 145 | 0.931 [0.456–1.89] | ns (p=0.97) |
| Symptoms at 180-day visit | PD, n = 27 | No PD, n = 118 | 145 | 1.38 [0.598–3.26] | ns (p=0.97) |
| Symptoms at 180-day visit | COPD, n = 8 | No COPD, n = 137 | 145 | 1.04 [0.238–4.58] | ns (p=0.97) |
| Symptoms at 180-day visit | Asthma, n = 10 | No asthma, n = 135 | 145 | 1.05 [0.279–3.92] | ns (p=0.97) |
| Symptoms at 180-day visit | Metabolic disorders, n = 63 | No metabolic disorders, n = 82 | 145 | 1.02 [0.527–1.96] | ns (p=0.97) |
| Symptoms at 180-day visit | Hypercholesterolemia, n = 27 | No hypercholesterolemia, n = 118 | 145 | 0.55 [0.226–1.28] | ns (p=0.97) |
| Symptoms at 180-day visit | Diabetes, n = 24 | No diabetes, n = 121 | 145 | 1.05 [0.434–2.54] | ns (p=0.97) |
| Symptoms at 180-day visit | CKD, n = 10 | No CKD, n = 135 | 145 | 1.62 [0.442–6.56] | ns (p=0.97) |
| Symptoms at 180-day visit | GITD, n = 20 | No GITD, n = 125 | 145 | 1.68 [0.649–4.55] | ns (p=0.97) |
| Symptoms at 180-day visit | Malignancy, n = 17 | No malignancy, n = 128 | 145 | 0.7 [0.241–1.94] | ns (p=0.97) |
| Symptoms at 180-day visit | Immune deficiency, n = 9 | No immune deficiency, n = 136 | 145 | 0.824 [0.197–3.24] | ns (p=0.97) |
| Symptoms at 180-day visit | Weight loss, acute COVID-19, n = 106 | No weight loss, acute COVID-19, n = 39 | 145 | 1.34 [0.644–2.84] | ns (p=0.97) |
| Symptoms at 180-day visit | Dyspnea, acute COVID-19, n = 98 | No dyspnea, acute COVID-19, n = 47 | 145 | 2.84 [1.39–6.04] | ns (p=0.2) |
| Symptoms at 180-day visit | Cough, acute COVID-19, n = 102 | No cough, acute COVID-19, n = 43 | 145 | 1.97 [0.96–4.17] | ns (p=0.88) |
| Symptoms at 180-day visit | Fever, acute COVID-19, n = 106 | No fever, acute COVID-19, n = 39 | 145 | 1.17 [0.559–2.45] | ns (p=0.97) |
| Symptoms at 180-day visit | Night sweat, acute COVID-19, n = 92 | No night sweat, acute COVID-19, n = 53 | 145 | 1.42 [0.723–2.83] | ns (p=0.97) |
| Symptoms at 180-day visit | Pain, acute COVID-19, n = 78 | No pain, acute COVID-19, n = 67 | 145 | 1.92 [0.993–3.75] | ns (p=0.84) |
| Symptoms at 180-day visit | GI symptoms, acute COVID-19, n = 59 | No GI symptoms, acute COVID-19, n = 86 | 145 | 1.27 [0.656–2.48] | ns (p=0.97) |
| Symptoms at 180-day visit | Anosmia, acute COVID-19, n = 62 | No anosmia, acute COVID-19, n = 83 | 145 | 1.69 [0.874–3.31] | ns (p=0.96) |
| Symptoms at 180-day visit | Impaired performance, acute COVID-19, n = 132 | No impaired performance, acute COVID-19, n = 13 | 145 | 1.13 [0.358–3.69] | ns (p=0.97) |
| Symptoms at 180-day visit | Sleep disorders, acute COVID-19, n = 56 | No sleep disorders, acute COVID-19, n = 88 | 144 | 1.38 [0.708–2.73] | ns (p=0.97) |
| Symptoms at 180-day visit | Anti-infectives, acute COVID-19, n = 78 | No anti-infectives, acute COVID-19, n = 67 | 145 | 0.701 [0.362–1.35] | ns (p=0.97) |
| Symptoms at 180-day visit | Antiplatelet, acute COVID-19, n = 22 | No antiplatelet, acute COVID-19, n = 123 | 145 | 1.05 [0.42–2.63] | ns (p=0.97) |
| Symptoms at 180-day visit | Anticoagulatives, acute COVID-19, n = 9 | No anticoagulatives, acute COVID-19, n = 136 | 145 | 2.18 [0.553–10.7] | ns (p=0.97) |
| Symptoms at 180-day visit | Immunosuppression, acute COVID-19, n = 27 | No immunosuppression, acute COVID-19, n = 118 | 145 | 1.38 [0.598–3.26] | ns (p=0.97) |
| Symptoms at 180-day visit | Anemia, 60-day visit, n = 16 | No anemia, 60-day visit, n = 129 | 145 | 0.591 [0.191–1.69] | ns (p=0.97) |
| Symptoms at 180-day visit | Elevated ferritin, 60-day visit, n = 26 | No elevated ferritin, 60-day visit, n = 118 | 144 | 1.29 [0.551–3.07] | ns (p=0.97) |
| Symptoms at 180-day visit | Elevated NTproBNP, 60-day visit, n = 52 | No elevated NTproBNP, 60-day visit, n = 93 | 145 | 1.96 [0.987–3.94] | ns (p=0.84) |
| Symptoms at 180-day visit | Elevated D-dimer, 60-day visit, n = 60 | No elevated D-dimer, 60-day visit, n = 85 | 145 | 1.7 [0.874–3.33] | ns (p=0.96) |
| Symptoms at 180-day visit | Elevated CRP, 60-day visit, n = 23 | No elevated CRP, 60-day visit, n = 122 | 145 | 1.16 [0.475–2.88] | ns (p=0.97) |
| Symptoms at 180-day visit | Elevated IL-6, 60-day visit, n = 17 | No elevated IL-6, 60-day visit, n = 128 | 145 | 0.529 [0.173–1.48] | ns (p=0.97) |
| Symptoms at 180-day visit | Iron deficiency, 60-day visit, n = 6 | No iron deficiency, 60-day visit, n = 138 | 144 | 2.18 [0.412–16.1] | ns (p=0.97) |
| Symptoms at 180-day visit | Age over 65, n = 43 | No age over 65, n = 102 | 145 | 1.69 [0.827–3.51] | ns (p=0.97) |
| Symptoms at 180-day visit | Hospitalized >7 days, acute COVID-19, n = 80 | No hospitalized >7 days, acute COVID-19, n = 65 | 145 | 1.1 [0.569–2.12] | ns (p=0.97) |
| Symptoms at 180-day visit | Any comorbidity, n = 112 | No any comorbidity, n = 33 | 145 | 1.03 [0.47–2.24] | ns (p=0.97) |
| Symptoms at 180-day visit | >3 comorbidities, n = 47 | No >3 comorbidities, n = 98 | 145 | 1.46 [0.727–2.95] | ns (p=0.97) |
| Symptoms at 180-day visit | Overweight or obesity, n = 86 | No overweight or obesity, n = 59 | 145 | 0.7 [0.358–1.36] | ns (p=0.97) |
| Symptoms at 180-day visit | >6 symptoms, acute COVID-19, n = 42 | No >6 symptoms, acute COVID-19, n = 103 | 145 | 1.82 [0.885–3.82] | ns (p=0.96) |
| Symptoms at 180-day visit | Persistent symptoms, 60-day visit, n = 115 | No persistent symptoms, 60-day visit, n = 30 | 145 | 4.12 [1.71–11.1] | ns (p=0.2) |
| Symptoms at 180-day visit | Anti-S1/S2 IgG Q1, 60-day visit, n = 34 | No anti-S1/S2 IgG Q1, 60-day visit, n = 100 | 134 | 1.04 [0.476–2.28] | ns (p=0.97) |
| Symptoms at 180-day visit | Anti-S1/S2 IgG Q2, 60-day visit, n = 33 | No anti-S1/S2 IgG Q2, 60-day visit, n = 101 | 134 | 1.13 [0.512–2.49] | ns (p=0.97) |
| Symptoms at 180-day visit | Anti-S1/S2 IgG Q3, 60-day visit, n = 34 | No anti-S1/S2 IgG Q3, 60-day visit, n = 100 | 134 | 0.646 [0.289–1.41] | ns (p=0.97) |
| Symptoms at 180-day visit | Anti-S1/S2 IgG Q4, 60-day visit, n = 33 | No anti-S1/S2 IgG Q4, 60-day visit, n = 101 | 134 | 1.32 [0.603–2.95] | ns (p=0.97) |
| Symptoms at 180-day visit | Ambulatory, acute COVID-19, n = 36 | No ambulatory, acute COVID-19, n = 109 | 145 | 0.911 [0.426–1.94] | ns (p=0.97) |
| Symptoms at 180-day visit | Hospitalized, acute COVID-19, n = 37 | No hospitalized, acute COVID-19, n = 108 | 145 | 0.983 [0.463–2.08] | ns (p=0.97) |
| Symptoms at 180-day visit | Oxygen therapy, acute COVID-19, n = 40 | No oxygen therapy, acute COVID-19, n = 105 | 145 | 0.922 [0.442–1.91] | ns (p=0.97) |
| Symptoms at 180-day visit | ICU, acute COVID-19, n = 32 | No ICU, acute COVID-19, n = 113 | 145 | 1.24 [0.564–2.74] | ns (p=0.97) |
| Lung function impairment at 180-day visit | Male sex, n = 71 | No male sex, n = 51 | 122 | 2.12 [0.964–4.85] | ns (p=0.1) |
| Lung function impairment at 180-day visit | Obesity, n = 22 | No obesity, n = 100 | 122 | 1.94 [0.746–5] | ns (p=0.22) |
| Lung function impairment at 180-day visit | Current smoker, n = 3 | No current smoker, n = 119 | 122 | 4.26 [0.397–93.4] | ns (p=0.3) |
| Lung function impairment at 180-day visit | Ex-smoker, n = 45 | No ex-smoker, n = 77 | 122 | 1.95 [0.897–4.26] | ns (p=0.13) |
| Lung function impairment at 180-day visit | CVD, n = 49 | No CVD, n = 73 | 122 | 1.57 [0.727–3.39] | ns (p=0.31) |
| Lung function impairment at 180-day visit | Hypertension, n = 35 | No hypertension, n = 87 | 122 | 1.56 [0.683–3.54] | ns (p=0.34) |
| Lung function impairment at 180-day visit | PD, n = 23 | No PD, n = 99 | 122 | 2.21 [0.869–5.62] | ns (p=0.13) |
| Lung function impairment at 180-day visit | COPD, n = 7 | No COPD, n = 115 | 122 | 2.93 [0.615–15.5] | ns (p=0.23) |
| Lung function impairment at 180-day visit | Asthma, n = 9 | No asthma, n = 113 | 122 | 1.03 [0.208–4.12] | ns (p=0.97) |
| Lung function impairment at 180-day visit | Metabolic disorders, n = 53 | No metabolic disorders, n = 69 | 122 | 1.73 [0.807–3.73] | ns (p=0.22) |
| Lung function impairment at 180-day visit | Hypercholesterolemia, n = 24 | No hypercholesterolemia, n = 98 | 122 | 1.03 [0.383–2.61] | ns (p=0.96) |
| Lung function impairment at 180-day visit | Diabetes, n = 21 | No diabetes, n = 101 | 122 | 2.15 [0.816–5.64] | ns (p=0.16) |
| Lung function impairment at 180-day visit | CKD, n = 8 | No CKD, n = 114 | 122 | 17.2 [2.9–328] | p=0.02 |
| Lung function impairment at 180-day visit | GITD, n = 16 | No GITD, n = 106 | 122 | 3.11 [1.07–9.42] | ns (p=0.061) |
| Lung function impairment at 180-day visit | Malignancy, n = 14 | No malignancy, n = 108 | 122 | 4.47 [1.43–15.6] | p=0.025 |
| Lung function impairment at 180-day visit | Immune deficiency, n = 6 | No immune deficiency, n = 116 | 122 | 2.14 [0.38–12] | ns (p=0.43) |
| Lung function impairment at 180-day visit | Weight loss, acute COVID-19, n = 91 | No weight loss, acute COVID-19, n = 31 | 122 | 1.56 [0.645–4.08] | ns (p=0.41) |
| Lung function impairment at 180-day visit | Dyspnea, acute COVID-19, n = 82 | No dyspnea, acute COVID-19, n = 40 | 122 | 3.17 [1.31–8.58] | p=0.029 |
| Lung function impairment at 180-day visit | Cough, acute COVID-19, n = 88 | No cough, acute COVID-19, n = 34 | 122 | 0.856 [0.375–2.01] | ns (p=0.76) |
| Lung function impairment at 180-day visit | Fever, acute COVID-19, n = 92 | No fever, acute COVID-19, n = 30 | 122 | 1.19 [0.496–3.01] | ns (p=0.76) |
| Lung function impairment at 180-day visit | Night sweat, acute COVID-19, n = 79 | No night sweat, acute COVID-19, n = 43 | 122 | 0.39 [0.176–0.852] | p=0.033 |
| Lung function impairment at 180-day visit | Pain, acute COVID-19, n = 65 | No pain, acute COVID-19, n = 57 | 122 | 0.609 [0.282–1.3] | ns (p=0.26) |
| Lung function impairment at 180-day visit | GI symptoms, acute COVID-19, n = 46 | No GI symptoms, acute COVID-19, n = 76 | 122 | 0.715 [0.316–1.57] | ns (p=0.47) |
| Lung function impairment at 180-day visit | Anosmia, acute COVID-19, n = 51 | No anosmia, acute COVID-19, n = 71 | 122 | 0.895 [0.41–1.92] | ns (p=0.82) |
| Lung function impairment at 180-day visit | Impaired performance, acute COVID-19, n = 111 | No impaired performance, acute COVID-19, n = 11 | 122 | 0.84 [0.238–3.38] | ns (p=0.82) |
| Lung function impairment at 180-day visit | Sleep disorders, acute COVID-19, n = 46 | No sleep disorders, acute COVID-19, n = 75 | 121 | 0.7 [0.309–1.54] | ns (p=0.44) |
| Lung function impairment at 180-day visit | Anti-infectives, acute COVID-19, n = 63 | No anti-infectives, acute COVID-19, n = 59 | 122 | 2.65 [1.22–6] | p=0.03 |
| Lung function impairment at 180-day visit | Antiplatelet, acute COVID-19, n = 17 | No antiplatelet, acute COVID-19, n = 105 | 122 | 4.8 [1.67–15.1] | p=0.011 |
| Lung function impairment at 180-day visit | Anticoagulatives, acute COVID-19, n = 7 | No anticoagulatives, acute COVID-19, n = 115 | 122 | 2.93 [0.615–15.5] | ns (p=0.23) |
| Lung function impairment at 180-day visit | Immunosuppression, acute COVID-19, n = 22 | No immunosuppression, acute COVID-19, n = 100 | 122 | 2.45 [0.95–6.34] | ns (p=0.096) |
| Lung function impairment at 180-day visit | Anemia, 60-day visit, n = 11 | No anemia, 60-day visit, n = 111 | 122 | 4.14 [1.17–16.7] | ns (p=0.053) |
| Lung function impairment at 180-day visit | Elevated ferritin, 60-day visit, n = 21 | No elevated ferritin, 60-day visit, n = 100 | 121 | 1.37 [0.498–3.6] | ns (p=0.58) |
| Lung function impairment at 180-day visit | Elevated NTproBNP, 60-day visit, n = 44 | No elevated NTproBNP, 60-day visit, n = 78 | 122 | 2.42 [1.11–5.33] | p=0.046 |
| Lung function impairment at 180-day visit | Elevated D-dimer, 60-day visit, n = 50 | No elevated D-dimer, 60-day visit, n = 72 | 122 | 3.23 [1.49–7.2] | p=0.0089 |
| Lung function impairment at 180-day visit | Elevated CRP, 60-day visit, n = 17 | No elevated CRP, 60-day visit, n = 105 | 122 | 6.6 [2.24–22.3] | p=0.0029 |
| Lung function impairment at 180-day visit | Elevated IL-6, 60-day visit, n = 9 | No elevated IL-6, 60-day visit, n = 113 | 122 | 20.2 [3.52–383] | p=0.013 |
| Lung function impairment at 180-day visit | Iron deficiency, 60-day visit, n = 6 | No iron deficiency, 60-day visit, n = 115 | 121 | 1.05 [0.142–5.65] | ns (p=0.96) |
| Lung function impairment at 180-day visit | Age over 65, n = 33 | No age over 65, n = 89 | 122 | 2.55 [1.11–5.88] | p=0.046 |
| Lung function impairment at 180-day visit | Hospitalized >7 days, acute COVID-19, n = 66 | No hospitalized >7 days, acute COVID-19, n = 56 | 122 | 3.83 [1.7–9.21] | p=0.0045 |
| Lung function impairment at 180-day visit | Any comorbidity, n = 93 | No any comorbidity, n = 29 | 122 | 3.95 [1.39–14.2] | p=0.032 |
| Lung function impairment at 180-day visit | >3 comorbidities, n = 41 | No >3 comorbidities, n = 81 | 122 | 2.47 [1.12–5.48] | p=0.044 |
| Lung function impairment at 180-day visit | Overweight or obesity, n = 72 | No overweight or obesity, n = 50 | 122 | 1.24 [0.575–2.73] | ns (p=0.64) |
| Lung function impairment at 180-day visit | >6 symptoms, acute COVID-19, n = 34 | No >6 symptoms, acute COVID-19, n = 88 | 122 | 0.538 [0.207–1.29] | ns (p=0.23) |
| Lung function impairment at 180-day visit | Persistent symptoms, 60-day visit, n = 96 | No persistent symptoms, 60-day visit, n = 26 | 122 | 1.83 [0.702–5.39] | ns (p=0.3) |
| Lung function impairment at 180-day visit | Anti-S1/S2 IgG Q1, 60-day visit, n = 28 | No anti-S1/S2 IgG Q1, 60-day visit, n = 84 | 112 | 0.245 [0.0675–0.704] | p=0.03 |
| Lung function impairment at 180-day visit | Anti-S1/S2 IgG Q2, 60-day visit, n = 27 | No anti-S1/S2 IgG Q2, 60-day visit, n = 85 | 112 | 2.23 [0.913–5.45] | ns (p=0.12) |
| Lung function impairment at 180-day visit | Anti-S1/S2 IgG Q3, 60-day visit, n = 28 | No anti-S1/S2 IgG Q3, 60-day visit, n = 84 | 112 | 0.72 [0.27–1.78] | ns (p=0.55) |
| Lung function impairment at 180-day visit | Anti-S1/S2 IgG Q4, 60-day visit, n = 29 | No anti-S1/S2 IgG Q4, 60-day visit, n = 83 | 112 | 1.88 [0.784–4.51] | ns (p=0.21) |
| Lung function impairment at 180-day visit | Ambulatory, acute COVID-19, n = 32 | No ambulatory, acute COVID-19, n = 90 | 122 | 0.214 [0.0597–0.603] | p=0.017 |
| Lung function impairment at 180-day visit | Hospitalized, acute COVID-19, n = 32 | No hospitalized, acute COVID-19, n = 90 | 122 | 1.1 [0.458–2.56] | ns (p=0.85) |
| Lung function impairment at 180-day visit | Oxygen therapy, acute COVID-19, n = 32 | No oxygen therapy, acute COVID-19, n = 90 | 122 | 1.33 [0.561–3.07] | ns (p=0.57) |
| Lung function impairment at 180-day visit | ICU, acute COVID-19, n = 26 | No ICU, acute COVID-19, n = 96 | 122 | 2.56 [1.05–6.27] | ns (p=0.061) |
-
CVD = cardiovascular disease; PD = pulmonary disease; COPD = chronic obstructive pulmonary disease; CKD = chronic kidney disease; GITD = gastrointestinal disease; GI = gastrointestinal; CRP = C-reactive protein; ICU = intensive care unit; CT = computed tomography.
Appendix 1—table 3
Feature cluster assignment scheme.
| Cluster # | Variable |
|---|---|
| 1 | Male sex, CVD, hypertension, metabolic disorders, anti-infectives, acute COVID-19, elevated NTproBNP, 60-day visit, elevated D-dimer, 60-day visit, hospitalized >7 days, acute COVID-19, >3 comorbidities, overweight |
| 2 | Obesity, current smoker, ex-smoker, PD, COPD, asthma, hypercholesterolemia, diabetes, CKD, GITD, malignancy, immune deficiency, GI symptoms, acute COVID-19, anosmia, acute COVID-19, sleep disorders, acute COVID-19, antiplatelet, acute COVID-19, anticoagulatives, acute COVID-19, immunosuppression, acute COVID-19, anemia, 60-day visit, elevated ferritin, 60-day visit, elevated CRP, 60-day visit, elevated IL-6, 60-day visit, iron deficiency, 60-day visit, age over 65, > 6 symptoms, acute COVID-19, anti-S1/S2 IgG Q1, 60-day visit, anti-S1/S2 IgG Q2, 60-day visit, anti-S1/S2 IgG Q3, 60-day visit, anti-S1/S2 IgG Q4, 60-day visit, ambulatory, acute COVID-19, hospitalized, acute COVID-19, oxygen therapy, acute COVID-19, ICU, acute COVID-19, CT severity score 1–5 at 180-day visit, CT severity score >5 at 180-day visit, lung function impairment at 180-day visit |
| 3 | Weight loss, acute COVID-19, dyspnea, acute COVID-19, cough, acute COVID-19, fever, acute COVID-19, night sweat, acute COVID-19, pain, acute COVID-19, impaired performance, acute COVID-19, any comorbidity, persistent symptoms, 60-day visit, symptoms at 180-day visit |
-
CVD = cardiovascular disease; PD = pulmonary disease; COPD = chronic obstructive pulmonary disease; CKD = chronic kidney disease; GITD = gastrointestinal disease; GI = gastrointestinal; CRP = C-reactive protein; ICU = intensive care unit; CT = computed tomography.
Appendix 1—table 4
Development of machine learning models.
Outcome: outcome variable at the 180-day follow-up visit
| Outcome | Classifier type | Caret method | Description | Package | Optimal arguments |
|---|---|---|---|---|---|
| CT abnormalities at 180-day visit | model | C5.0 | C5.0 | C50 | trials = 10, model = tree, winnow = FALSE |
| rf | Random Forest | randomForest | mtry = 27 | ||
| svmRadial | Support Vector Machines with Radial Basis Function Kernel | kernlab | sigma = 0.0105, C = 0.5 | ||
| nnet | Neural Network | nnet | size = 1, decay = 0 | ||
| glmnet | Elastic-Net Regularized Generalized Linear Models | glmnet | alpha = 0.1, lambda = 0.000431 | ||
| ensemble | glmnet | Elastic-Net Regularized Generalized Linear Models | glmnet | alpha = 1, lambda = 0.0523 | |
| CT severity score >5 at 180-day visit | model | C5.0 | C5.0 | C50 | trials = 1, model = rules, winnow = TRUE |
| rf | Random Forest | randomForest | mtry = 52 | ||
| svmRadial | Support Vector Machines with Radial Basis Function Kernel | kernlab | sigma = 0.00979, C = 0.5 | ||
| nnet | Neural Network | nnet | size = 1, decay = 0.1 | ||
| glmnet | Elastic-Net Regularized Generalized Linear Models | glmnet | alpha = 0.1, lambda = 0.0419 | ||
| ensemble | glmnet | Elastic-Net Regularized Generalized Linear Models | glmnet | alpha = 0.1, lambda = 0.00379 | |
| Symptoms at 180-day visit | model | C5.0 | C5.0 | C50 | trials = 1, model = tree, winnow = FALSE |
| rf | Random Forest | randomForest | mtry = 27 | ||
| svmRadial | Support Vector Machines with Radial Basis Function Kernel | kernlab | sigma = 0.0109, C = 1 | ||
| nnet | Neural Network | nnet | size = 3, decay = 0.1 | ||
| glmnet | Elastic-Net Regularized Generalized Linear Models | glmnet | alpha = 0.1, lambda = 0.000247 | ||
| ensemble | glmnet | Elastic-Net Regularized Generalized Linear Models | glmnet | alpha = 0.1, lambda = 0.0167 | |
| Lung function impairment at 180-day visit | model | C5.0 | C5.0 | C50 | trials = 1, model = rules, winnow = FALSE |
| rf | Random Forest | randomForest | mtry = 52 | ||
| svmRadial | Support Vector Machines with Radial Basis Function Kernel | kernlab | sigma = 0.0108, C = 0.5 | ||
| nnet | Neural Network | nnet | size = 1, decay = 0.1 | ||
| glmnet | Elastic-Net Regularized Generalized Linear Models | glmnet | alpha = 0.55, lambda = 0.0341 | ||
| ensemble | glmnet | Elastic-Net Regularized Generalized Linear Models | glmnet | alpha = 0.55, lambda = 0.0387 |
Appendix 1—table 5
Performance of machine learning classifiers.
Outcome: outcome variable at the 180-day follow-up visit; Method: Caret method, Accuracy: model accuracy with 95% confidence intervals, Kappa: model kappa statistic with 95% confidence intervals, AUC: area under the curve.
| Outcome | Total N | Events N | Method | Data set | Accuracy | Kappa | AUC | Sensitivity | Specificity |
|---|---|---|---|---|---|---|---|---|---|
| CT abnormalities at 180-day visit | 109 | 49 | C5.0 | CV | 0.72 [0.36–1] | 0.43 [-0.35–1] | 0.78 | 0.69 | 0.74 |
| CT abnormalities at 180-day visit | 109 | 49 | C5.0 | Training | 1 | 1 | 1 | 1 | 1 |
| CT abnormalities at 180-day visit | 109 | 49 | ensemble | CV | 0.78 [0.63–0.93] | 0.55 [0.26–0.85] | 0.81 | 0.75 | 0.8 |
| CT abnormalities at 180-day visit | 109 | 49 | ensemble | Training | 0.93 | 0.85 | 0.98 | 0.86 | 0.98 |
| CT abnormalities at 180-day visit | 109 | 49 | glmnet | CV | 0.71 [0.3–1] | 0.42 [-0.52–1] | 0.79 | 0.71 | 0.72 |
| CT abnormalities at 180-day visit | 109 | 49 | glmnet | Training | 1 | 1 | 1 | 1 | 1 |
| CT abnormalities at 180-day visit | 109 | 49 | nnet | cCV | 0.67 [0.26–1] | 0.35 [-0.38–1] | 0.69 | 0.71 | 0.64 |
| CT abnormalities at 180-day visit | 109 | 49 | nnet | Training | 0.76 | 0.54 | 0.78 | 1 | 0.57 |
| CT abnormalities at 180-day visit | 109 | 49 | rf | CV | 0.73 [0.4–1] | 0.45 [-0.33–1] | 0.78 | 0.72 | 0.74 |
| CT abnormalities at 180-day visit | 109 | 49 | rf | Training | 1 | 1 | 1 | 1 | 1 |
| CT abnormalities at 180-day visit | 109 | 49 | svmRadial | CV | 0.75 [0.4–1] | 0.51 [-0.25–1] | 0.8 | 0.78 | 0.73 |
| CT abnormalities at 180-day visit | 109 | 49 | svmRadial | Training | 0.85 | 0.7 | 0.93 | 0.84 | 0.87 |
| CT severity score >5 at 180-day visit | 109 | 21 | C5.0 | CV | 0.86 [0.67–1] | 0.37 [-0.2–1] | 0.7 | 0.39 | 0.98 |
| CT severity score >5 at 180-day visit | 109 | 21 | C5.0 | Training | 0.87 | 0.5 | 0.7 | 0.43 | 0.98 |
| CT severity score >5 at 180-day visit | 109 | 21 | ensemble | CV | 0.88 [0.81–0.96] | 0.51 [0.044–0.89] | 0.75 | 0.45 | 0.98 |
| CT severity score >5 at 180-day visit | 109 | 21 | ensemble | Training | 0.89 | 0.57 | 0.65 | 0.48 | 0.99 |
| CT severity score >5 at 180-day visit | 109 | 21 | glmnet | CV | 0.84 [0.6–1] | 0.34 [-0.25–1] | 0.76 | 0.41 | 0.94 |
| CT severity score >5 at 180-day visit | 109 | 21 | glmnet | Training | 0.94 | 0.8 | 0.97 | 0.71 | 1 |
| CT severity score >5 at 180-day visit | 109 | 21 | nnet | CV | 0.79 [0.5–1] | 0.31 [-0.29–1] | 0.72 | 0.47 | 0.87 |
| CT severity score >5 at 180-day visit | 109 | 21 | nnet | Training | 0.99 | 0.97 | 1 | 0.95 | 1 |
| CT severity score >5 at 180-day visit | 109 | 21 | rf | CV | 0.84 [0.6–1] | 0.34 [-0.25–1] | 0.73 | 0.4 | 0.95 |
| CT severity score >5 at 180-day visit | 109 | 21 | rf | Training | 1 | 1 | 1 | 1 | 1 |
| CT severity score >5 at 180-day visit | 109 | 21 | svmRadial | CV | 0.87 [0.63–1] | 0.43 [-0.23–1] | 0.75 | 0.48 | 0.97 |
| CT severity score >5 at 180-day visit | 109 | 21 | svmRadial | Training | 0.92 | 0.68 | 0.99 | 0.57 | 1 |
| Lung function impairment at 180-day visit | 111 | 38 | C5.0 | CV | 0.73 [0.33–1] | 0.39 [-0.5–1] | 0.7 | 0.54 | 0.84 |
| Lung function impairment at 180-day visit | 111 | 38 | C5.0 | Training | 0.86 | 0.7 | 0.85 | 0.79 | 0.9 |
| Lung function impairment at 180-day visit | 111 | 38 | ensemble | CV | 0.75 [0.61–0.86] | 0.39 [0.052–0.67] | 0.72 | 0.48 | 0.89 |
| Lung function impairment at 180-day visit | 111 | 38 | ensemble | Training | 0.89 | 0.75 | 0.98 | 0.79 | 0.95 |
| Lung function impairment at 180-day visit | 111 | 38 | glmnet | CV | 0.74 [0.4–1] | 0.37 [-0.36–1] | 0.66 | 0.51 | 0.86 |
| Lung function impairment at 180-day visit | 111 | 38 | glmnet | Training | 0.83 | 0.59 | 0.89 | 0.61 | 0.95 |
| Lung function impairment at 180-day visit | 111 | 38 | nnet | CV | 0.65 [0.2–1] | 0.2 [-0.5–1] | 0.59 | 0.44 | 0.76 |
| Lung function impairment at 180-day visit | 111 | 38 | nnet | Training | 0.93 | 0.83 | 0.82 | 0.79 | 1 |
| Lung function impairment at 180-day visit | 111 | 38 | rf | CV | 0.73 [0.4–1] | 0.35 [-0.33–1] | 0.72 | 0.49 | 0.85 |
| Lung function impairment at 180-day visit | 111 | 38 | rf | Training | 1 | 1 | 1 | 1 | 1 |
| Lung function impairment at 180-day visit | 111 | 38 | svmRadial | CV | 0.72 [0.36–1] | 0.35 [-0.44–1] | 0.69 | 0.5 | 0.84 |
| Lung function impairment at 180-day visit | 111 | 38 | svmRadial | Training | 0.87 | 0.71 | 0.94 | 0.71 | 0.96 |
| Symptoms at 180-day visit | 133 | 65 | C5.0 | CV | 0.6 [0.22–0.93] | 0.2 [-0.51–0.87] | 0.57 | 0.61 | 0.58 |
| Symptoms at 180-day visit | 133 | 65 | C5.0 | Training | 0.93 | 0.86 | 0.96 | 0.89 | 0.97 |
| Symptoms at 180-day visit | 133 | 65 | ensemble | CV | 0.58 [0.41–0.74] | 0.16 [-0.19–0.49] | 0.6 | 0.52 | 0.63 |
| Symptoms at 180-day visit | 133 | 65 | ensemble | Training | 0.99 | 0.98 | 1 | 0.98 | 1 |
| Symptoms at 180-day visit | 133 | 65 | glmnet | CV | 0.56 [0.17–0.86] | 0.13 [-0.64–0.72] | 0.56 | 0.54 | 0.58 |
| Symptoms at 180-day visit | 133 | 65 | glmnet | Training | 0.85 | 0.7 | 0.92 | 0.82 | 0.88 |
| Symptoms at 180-day visit | 133 | 65 | nnet | CV | 0.59 [0.29–0.86] | 0.17 [-0.52–0.72] | 0.58 | 0.6 | 0.57 |
| Symptoms at 180-day visit | 133 | 65 | nnet | Training | 1 | 1 | 1 | 1 | 1 |
| Symptoms at 180-day visit | 133 | 65 | rf | CV | 0.56 [0.29–0.86] | 0.13 [-0.46–0.71] | 0.59 | 0.56 | 0.56 |
| Symptoms at 180-day visit | 133 | 65 | rf | Training | 1 | 1 | 1 | 1 | 1 |
| Symptoms at 180-day visit | 133 | 65 | svmRadial | CV | 0.54 [0.17–0.83] | 0.089 [-0.67–0.67] | 0.55 | 0.45 | 0.62 |
| Symptoms at 180-day visit | 133 | 65 | svmRadial | Training | 0.86 | 0.73 | 0.94 | 0.85 | 0.88 |
-
AUC = area under the curve; CT = computed tomography; glmnet = elastic-net regularized generalized linear models; nnet = neural networks; svmRadial = support vector machines with radial basis function kernel; rf = random forest; ensemble = model ensemble with elastic-net regularized generalized linear models
Appendix 1—table 6
Performance of machine learning classifiers in the acute COVID-19 severity strata.
Outcome: outcome variable at the 180-day follow-up visit; cohort subset: cohort acute COVID-19 severity strata (mild–moderate: outpatient or hospitalized without oxygen; severe–critical: oxygen therapy or ICU),
| Outcome | Cohort subset | Total N | Events N | Method | Data set | AUC | Sensitivity | Specificity |
|---|---|---|---|---|---|---|---|---|
| CT abnormalities at 180-day visit | Whole cohort | 109 | 49 | C5.0 | Training | 1 | 1 | 1 |
| CT abnormalities at 180-day visit | Mild–moderate COVID-19 | 58 | 18 | C5.0 | Training | 1 | 1 | 1 |
| CT abnormalities at 180-day visit | Severe–critical COVID-19 | 51 | 31 | C5.0 | Training | 1 | 1 | 1 |
| CT abnormalities at 180-day visit | Whole cohort | 109 | 49 | rf | Training | 1 | 1 | 1 |
| CT abnormalities at 180-day visit | Mild–moderate COVID-19 | 58 | 18 | rf | Training | 1 | 1 | 1 |
| CT abnormalities at 180-day visit | Severe–critical COVID-19 | 51 | 31 | rf | Training | 1 | 1 | 1 |
| CT abnormalities at 180-day visit | Whole cohort | 109 | 49 | svmRadial | Training | 0.93 | 0.84 | 0.87 |
| CT abnormalities at 180-day visit | Mild–moderate COVID-19 | 58 | 18 | svmRadial | Training | 0.9 | 0.61 | 0.95 |
| CT abnormalities at 180-day visit | Severe–critical COVID-19 | 51 | 31 | svmRadial | Training | 0.96 | 0.97 | 0.7 |
| CT abnormalities at 180-day visit | Whole cohort | 109 | 49 | nnet | Training | 0.78 | 1 | 0.57 |
| CT abnormalities at 180-day visit | Mild–moderate COVID-19 | 58 | 18 | nnet | Training | 0.92 | 1 | 0.85 |
| CT abnormalities at 180-day visit | Severe–critical COVID-19 | 51 | 31 | nnet | Training | 0.5 | 1 | 0 |
| CT abnormalities at 180-day visit | Whole cohort | 109 | 49 | glmnet | Training | 1 | 1 | 1 |
| CT abnormalities at 180-day visit | Mild–moderate COVID-19 | 58 | 18 | glmnet | Training | 1 | 1 | 1 |
| CT abnormalities at 180-day visit | Severe–critical COVID-19 | 51 | 31 | glmnet | Training | 1 | 1 | 1 |
| CT abnormalities at 180-day visit | Whole cohort | 109 | 49 | ensemble | Training | 0.98 | 0.86 | 0.98 |
| CT abnormalities at 180-day visit | Mild–moderate COVID-19 | 58 | 18 | ensemble | Training | 0.98 | 0.61 | 1 |
| CT abnormalities at 180-day visit | Severe–critical COVID-19 | 51 | 31 | ensemble | Training | 1 | 1 | 0.95 |
| CT severity score >5 at 180-day visit | Whole cohort | 109 | 21 | C5.0 | Training | 0.7 | 0.43 | 0.98 |
| CT severity score >5 at 180-day visit | Mild–moderate COVID-19 | 58 | 6 | C5.0 | Training | 0.57 | 0.17 | 0.98 |
| CT severity score >5 at 180-day visit | Severe–critical COVID-19 | 51 | 15 | C5.0 | Training | 0.75 | 0.53 | 0.97 |
| CT severity score >5 at 180-day visit | Whole cohort | 109 | 21 | rf | Training | 1 | 1 | 1 |
| CT severity score >5 at 180-day visit | Mild–moderate COVID-19 | 58 | 6 | rf | Training | 1 | 1 | 1 |
| CT severity score >5 at 180-day visit | Severe–critical COVID-19 | 51 | 15 | rf | Training | 1 | 1 | 1 |
| CT severity score >5 at 180-day visit | Whole cohort | 109 | 21 | svmRadial | Training | 0.99 | 0.57 | 1 |
| CT severity score >5 at 180-day visit | Mild–moderate COVID-19 | 58 | 6 | svmRadial | Training | 0.98 | 0.17 | 1 |
| CT severity score >5 at 180-day visit | Severe–critical COVID-19 | 51 | 15 | svmRadial | Training | 1 | 0.73 | 1 |
| CT severity score >5 at 180-day visit | Whole cohort | 109 | 21 | nnet | Training | 1 | 0.95 | 1 |
| CT severity score >5 at 180-day visit | Mild–moderate COVID-19 | 58 | 6 | nnet | Training | 1 | 0.83 | 1 |
| CT severity score >5 at 180-day visit | Severe–critical COVID-19 | 51 | 15 | nnet | Training | 1 | 1 | 1 |
| CT severity score >5 at 180-day visit | Whole cohort | 109 | 21 | glmnet | Training | 0.97 | 0.71 | 1 |
| CT severity score >5 at 180-day visit | Mild–moderate COVID-19 | 58 | 6 | glmnet | Training | 0.94 | 0.33 | 1 |
| CT severity score >5 at 180-day visit | Severe–critical COVID-19 | 51 | 15 | glmnet | Training | 1 | 0.87 | 1 |
| CT severity score >5 at 180-day visit | Whole cohort | 109 | 21 | ensemble | Training | 0.65 | 0.48 | 0.99 |
| CT severity score >5 at 180-day visit | Mild–moderate COVID-19 | 58 | 6 | ensemble | Training | 0.38 | 0.17 | 0.98 |
| CT severity score >5 at 180-day visit | Severe–critical COVID-19 | 51 | 15 | ensemble | Training | 0.74 | 0.6 | 1 |
| Symptoms at 180-day visit | Whole cohort | 133 | 65 | C5.0 | Training | 0.96 | 0.89 | 0.97 |
| Symptoms at 180-day visit | Mild–moderate COVID-19 | 64 | 30 | C5.0 | Training | 0.97 | 0.9 | 1 |
| Symptoms at 180-day visit | Severe–critical COVID-19 | 69 | 35 | C5.0 | Training | 0.96 | 0.89 | 0.94 |
| Symptoms at 180-day visit | Whole cohort | 133 | 65 | rf | Training | 1 | 1 | 1 |
| Symptoms at 180-day visit | Mild–moderate COVID-19 | 64 | 30 | rf | Training | 1 | 1 | 1 |
| Symptoms at 180-day visit | Severe–critical COVID-19 | 69 | 35 | rf | Training | 1 | 1 | 1 |
| Symptoms at 180-day visit | Whole cohort | 133 | 65 | svmRadial | Training | 0.94 | 0.85 | 0.88 |
| Symptoms at 180-day visit | Mild–moderate COVID-19 | 64 | 30 | svmRadial | Training | 0.93 | 0.77 | 0.85 |
| Symptoms at 180-day visit | Severe–critical COVID-19 | 69 | 35 | svmRadial | Training | 0.95 | 0.91 | 0.91 |
| Symptoms at 180-day visit | Whole cohort | 133 | 65 | nnet | Training | 1 | 1 | 1 |
| Symptoms at 180-day visit | Mild–moderate COVID-19 | 64 | 30 | nnet | Training | 1 | 1 | 1 |
| Symptoms at 180-day visit | Severe–critical COVID-19 | 69 | 35 | nnet | Training | 1 | 1 | 1 |
| Symptoms at 180-day visit | Whole cohort | 133 | 65 | glmnet | Training | 0.92 | 0.82 | 0.88 |
| Symptoms at 180-day visit | Mild–moderate COVID-19 | 64 | 30 | glmnet | Training | 0.91 | 0.73 | 0.88 |
| Symptoms at 180-day visit | Severe–critical COVID-19 | 69 | 35 | glmnet | Training | 0.92 | 0.89 | 0.88 |
| Symptoms at 180-day visit | Whole cohort | 133 | 65 | ensemble | Training | 1 | 0.98 | 1 |
| Symptoms at 180-day visit | Mild–moderate COVID-19 | 64 | 30 | ensemble | Training | 1 | 0.97 | 1 |
| Symptoms at 180-day visit | Severe–critical COVID-19 | 69 | 35 | ensemble | Training | 1 | 1 | 1 |
| Lung function impairment at 180-day visit | Whole cohort | 111 | 38 | C5.0 | Training | 0.85 | 0.79 | 0.9 |
| Lung function impairment at 180-day visit | Mild–moderate COVID-19 | 55 | 14 | C5.0 | Training | 0.81 | 0.71 | 0.9 |
| Lung function impairment at 180-day visit | Severe–critical COVID-19 | 56 | 24 | C5.0 | Training | 0.87 | 0.83 | 0.91 |
| Lung function impairment at 180-day visit | Whole cohort | 111 | 38 | rf | Training | 1 | 1 | 1 |
| Lung function impairment at 180-day visit | Mild–moderate COVID-19 | 55 | 14 | rf | Training | 1 | 1 | 1 |
| Lung function impairment at 180-day visit | Severe–critical COVID-19 | 56 | 24 | rf | Training | 1 | 1 | 1 |
| Lung function impairment at 180-day visit | Whole cohort | 111 | 38 | svmRadial | Training | 0.94 | 0.71 | 0.96 |
| Lung function impairment at 180-day visit | Mild–moderate COVID-19 | 55 | 14 | svmRadial | Training | 0.88 | 0.5 | 0.98 |
| Lung function impairment at 180-day visit | Severe–critical COVID-19 | 56 | 24 | svmRadial | Training | 0.98 | 0.83 | 0.94 |
| Lung function impairment at 180-day visit | Whole cohort | 111 | 38 | nnet | Training | 0.82 | 0.79 | 1 |
| Lung function impairment at 180-day visit | Mild–moderate COVID-19 | 55 | 14 | nnet | Training | 0.7 | 0.64 | 1 |
| Lung function impairment at 180-day visit | Severe–critical COVID-19 | 56 | 24 | nnet | Training | 0.89 | 0.88 | 1 |
| Lung function impairment at 180-day visit | Whole cohort | 111 | 38 | glmnet | Training | 0.89 | 0.61 | 0.95 |
| Lung function impairment at 180-day visit | Mild–moderate COVID-19 | 55 | 14 | glmnet | Training | 0.84 | 0.29 | 0.95 |
| Lung function impairment at 180-day visit | Severe–critical COVID-19 | 56 | 24 | glmnet | Training | 0.91 | 0.79 | 0.94 |
| Lung function impairment at 180-day visit | Whole cohort | 111 | 38 | ensemble | Training | 0.98 | 0.79 | 0.95 |
| Lung function impairment at 180-day visit | Mild–moderate COVID-19 | 55 | 14 | ensemble | Training | 0.97 | 0.71 | 0.95 |
| Lung function impairment at 180-day visit | Severe–critical COVID-19 | 56 | 24 | ensemble | Training | 0.98 | 0.83 | 0.94 |
| CT abnormalities at 180-day visit | Whole cohort | 109 | 49 | C5.0 | CV | 0.78 | 0.69 | 0.74 |
| CT abnormalities at 180-day visit | Mild–moderate COVID-19 | 58 | 18 | C5.0 | CV | 0.69 | 0.43 | 0.8 |
| CT abnormalities at 180-day visit | Severe–critical COVID-19 | 51 | 31 | C5.0 | CV | 0.78 | 0.85 | 0.62 |
| CT abnormalities at 180-day visit | Whole cohort | 109 | 49 | rf | CV | 0.78 | 0.72 | 0.74 |
| CT abnormalities at 180-day visit | Mild–moderate COVID-19 | 58 | 18 | rf | CV | 0.76 | 0.43 | 0.88 |
| CT abnormalities at 180-day visit | Severe–critical COVID-19 | 51 | 31 | rf | CV | 0.71 | 0.88 | 0.47 |
| CT abnormalities at 180-day visit | Whole cohort | 109 | 49 | svmRadial | CV | 0.8 | 0.78 | 0.73 |
| CT abnormalities at 180-day visit | Mild–moderate COVID-19 | 58 | 18 | svmRadial | CV | 0.75 | 0.56 | 0.9 |
| CT abnormalities at 180-day visit | Severe–critical COVID-19 | 51 | 31 | svmRadial | CV | 0.76 | 0.92 | 0.4 |
| CT abnormalities at 180-day visit | Whole cohort | 109 | 49 | nnet | CV | 0.69 | 0.71 | 0.64 |
| CT abnormalities at 180-day visit | Mild–moderate COVID-19 | 58 | 18 | nnet | CV | 0.67 | 0.59 | 0.77 |
| CT abnormalities at 180-day visit | Severe–critical COVID-19 | 51 | 31 | nnet | CV | 0.62 | 0.78 | 0.39 |
| CT abnormalities at 180-day visit | Whole cohort | 109 | 49 | glmnet | CV | 0.79 | 0.71 | 0.72 |
| CT abnormalities at 180-day visit | Mild–moderate COVID-19 | 58 | 18 | glmnet | CV | 0.78 | 0.66 | 0.78 |
| CT abnormalities at 180-day visit | Severe–critical COVID-19 | 51 | 31 | glmnet | CV | 0.75 | 0.75 | 0.6 |
| CT abnormalities at 180-day visit | Whole cohort | 109 | 49 | ensemble | CV | 0.81 | 0.75 | 0.8 |
| CT abnormalities at 180-day visit | Mild–moderate COVID-19 | 58 | 18 | ensemble | CV | 0.76 | 0.55 | 0.92 |
| CT abnormalities at 180-day visit | Severe–critical COVID-19 | 51 | 31 | ensemble | CV | 0.79 | 0.87 | 0.55 |
| CT severity score >5 at 180-day visit | Whole cohort | 109 | 21 | C5.0 | CV | 0.7 | 0.39 | 0.98 |
| CT severity score >5 at 180-day visit | Mild–moderate COVID-19 | 58 | 6 | C5.0 | CV | 0.55 | 0.13 | 0.98 |
| CT severity score >5 at 180-day visit | Severe–critical COVID-19 | 51 | 15 | C5.0 | CV | 0.76 | 0.49 | 0.97 |
| CT severity score >5 at 180-day visit | Whole cohort | 109 | 21 | rf | CV | 0.73 | 0.4 | 0.95 |
| CT severity score >5 at 180-day visit | Mild–moderate COVID-19 | 58 | 6 | rf | CV | 0.58 | 0.033 | 0.96 |
| CT severity score >5 at 180-day visit | Severe–critical COVID-19 | 51 | 15 | rf | CV | 0.76 | 0.55 | 0.93 |
| CT severity score >5 at 180-day visit | Whole cohort | 109 | 21 | svmRadial | CV | 0.75 | 0.48 | 0.97 |
| CT severity score >5 at 180-day visit | Mild–moderate COVID-19 | 58 | 6 | svmRadial | CV | 0.59 | 0.13 | 0.97 |
| CT severity score >5 at 180-day visit | Severe–critical COVID-19 | 51 | 15 | svmRadial | CV | 0.79 | 0.61 | 0.97 |
| CT severity score >5 at 180-day visit | Whole cohort | 109 | 21 | nnet | CV | 0.72 | 0.47 | 0.87 |
| CT severity score >5 at 180-day visit | Mild–moderate COVID-19 | 58 | 6 | nnet | CV | 0.57 | 0.17 | 0.89 |
| CT severity score >5 at 180-day visit | Severe–critical COVID-19 | 51 | 15 | nnet | CV | 0.76 | 0.59 | 0.84 |
| CT severity score >5 at 180-day visit | Whole cohort | 109 | 21 | glmnet | CV | 0.76 | 0.41 | 0.94 |
| CT severity score >5 at 180-day visit | Mild–moderate COVID-19 | 58 | 6 | glmnet | CV | 0.63 | 0.17 | 0.97 |
| CT severity score >5 at 180-day visit | Severe–critical COVID-19 | 51 | 15 | glmnet | CV | 0.78 | 0.51 | 0.89 |
| CT severity score >5 at 180-day visit | Whole cohort | 109 | 21 | ensemble | CV | 0.75 | 0.45 | 0.98 |
| CT severity score >5 at 180-day visit | Mild–moderate COVID-19 | 58 | 6 | ensemble | CV | 0.64 | 0.17 | 0.98 |
| CT severity score >5 at 180-day visit | Severe–critical COVID-19 | 51 | 15 | ensemble | CV | 0.78 | 0.57 | 0.99 |
| Symptoms at 180-day visit | Whole cohort | 133 | 65 | C5.0 | CV | 0.57 | 0.61 | 0.58 |
| Symptoms at 180-day visit | Mild–moderate COVID-19 | 64 | 30 | C5.0 | CV | 0.58 | 0.62 | 0.56 |
| Symptoms at 180-day visit | Severe–critical COVID-19 | 69 | 35 | C5.0 | CV | 0.55 | 0.6 | 0.6 |
| Symptoms at 180-day visit | Whole cohort | 133 | 65 | rf | CV | 0.59 | 0.56 | 0.56 |
| Symptoms at 180-day visit | Mild–moderate COVID-19 | 64 | 30 | rf | CV | 0.6 | 0.61 | 0.55 |
| Symptoms at 180-day visit | Severe–critical COVID-19 | 69 | 35 | rf | CV | 0.57 | 0.52 | 0.58 |
| Symptoms at 180-day visit | Whole cohort | 133 | 65 | svmRadial | CV | 0.55 | 0.45 | 0.62 |
| Symptoms at 180-day visit | Mild–moderate COVID-19 | 64 | 30 | svmRadial | CV | 0.54 | 0.48 | 0.59 |
| Symptoms at 180-day visit | Severe–critical COVID-19 | 69 | 35 | svmRadial | CV | 0.56 | 0.43 | 0.66 |
| Symptoms at 180-day visit | Whole cohort | 133 | 65 | nnet | CV | 0.58 | 0.6 | 0.57 |
| Symptoms at 180-day visit | Mild–moderate COVID-19 | 64 | 30 | nnet | CV | 0.58 | 0.63 | 0.54 |
| Symptoms at 180-day visit | Severe–critical COVID-19 | 69 | 35 | nnet | CV | 0.58 | 0.58 | 0.6 |
| Symptoms at 180-day visit | Whole cohort | 133 | 65 | glmnet | CV | 0.56 | 0.54 | 0.58 |
| Symptoms at 180-day visit | Mild–moderate COVID-19 | 64 | 30 | glmnet | CV | 0.56 | 0.57 | 0.6 |
| Symptoms at 180-day visit | Severe–critical COVID-19 | 69 | 35 | glmnet | CV | 0.55 | 0.51 | 0.56 |
| Symptoms at 180-day visit | Whole cohort | 133 | 65 | ensemble | CV | 0.6 | 0.52 | 0.63 |
| Symptoms at 180-day visit | Mild–moderate COVID-19 | 64 | 30 | ensemble | CV | 0.61 | 0.57 | 0.63 |
| Symptoms at 180-day visit | Severe–critical COVID-19 | 69 | 35 | ensemble | CV | 0.6 | 0.49 | 0.63 |
| Lung function impairment at 180-day visit | Whole cohort | 111 | 38 | C5.0 | CV | 0.7 | 0.54 | 0.84 |
| Lung function impairment at 180-day visit | Mild–moderate COVID-19 | 55 | 14 | C5.0 | CV | 0.61 | 0.37 | 0.86 |
| Lung function impairment at 180-day visit | Severe–critical COVID-19 | 56 | 24 | C5.0 | CV | 0.75 | 0.63 | 0.81 |
| Lung function impairment at 180-day visit | Whole cohort | 111 | 38 | rf | CV | 0.72 | 0.49 | 0.85 |
| Lung function impairment at 180-day visit | Mild–moderate COVID-19 | 55 | 14 | rf | CV | 0.58 | 0.26 | 0.9 |
| Lung function impairment at 180-day visit | Severe–critical COVID-19 | 56 | 24 | rf | CV | 0.79 | 0.62 | 0.79 |
| Lung function impairment at 180-day visit | Whole cohort | 111 | 38 | svmRadial | CV | 0.69 | 0.5 | 0.84 |
| Lung function impairment at 180-day visit | Mild–moderate COVID-19 | 55 | 14 | svmRadial | CV | 0.56 | 0.29 | 0.88 |
| Lung function impairment at 180-day visit | Severe–critical COVID-19 | 56 | 24 | svmRadial | CV | 0.75 | 0.62 | 0.79 |
| Lung function impairment at 180-day visit | Whole cohort | 111 | 38 | nnet | CV | 0.59 | 0.44 | 0.76 |
| Lung function impairment at 180-day visit | Mild–moderate COVID-19 | 55 | 14 | nnet | CV | 0.47 | 0.29 | 0.83 |
| Lung function impairment at 180-day visit | Severe–critical COVID-19 | 56 | 24 | nnet | CV | 0.62 | 0.52 | 0.67 |
| Lung function impairment at 180-day visit | Whole cohort | 111 | 38 | glmnet | CV | 0.66 | 0.51 | 0.86 |
| Lung function impairment at 180-day visit | Mild–moderate COVID-19 | 55 | 14 | glmnet | CV | 0.55 | 0.21 | 0.88 |
| Lung function impairment at 180-day visit | Severe–critical COVID-19 | 56 | 24 | glmnet | CV | 0.73 | 0.68 | 0.83 |
| Lung function impairment at 180-day visit | Whole cohort | 111 | 38 | ensemble | CV | 0.72 | 0.48 | 0.89 |
| Lung function impairment at 180-day visit | Mild–moderate COVID-19 | 55 | 14 | ensemble | CV | 0.59 | 0.26 | 0.92 |
| Lung function impairment at 180-day visit | Severe–critical COVID-19 | 56 | 24 | ensemble | CV | 0.78 | 0.61 | 0.85 |
-
AUC = area under the curve; CT = computed tomography; ICU = intensive care unit; glmnet = elastic-net regularized generalized linear models; nnet = neural network; svmRadial = support vector machines with radial basis function kernel; rf = random forest; ensemble = model ensemble with elastic-net regularized generalized linear models
Additional files
-
Transparent reporting form
- https://cdn.elifesciences.org/articles/72500/elife-72500-transrepform1-v2.docx
-
Source data 1
Figure plots source data.
- https://cdn.elifesciences.org/articles/72500/elife-72500-data1-v2.xlsx
Download links
A two-part list of links to download the article, or parts of the article, in various formats.
Downloads (link to download the article as PDF)
Open citations (links to open the citations from this article in various online reference manager services)
Cite this article (links to download the citations from this article in formats compatible with various reference manager tools)
Investigating phenotypes of pulmonary COVID-19 recovery: A longitudinal observational prospective multicenter trial
eLife 11:e72500.
https://doi.org/10.7554/eLife.72500


