Stable flow-induced expression of KLK10 inhibits endothelial inflammation and atherosclerosis
- Coulter Department of Biomedical Engineering, Emory University and Georgia Institute of Technology, United States
- Molecular and Systems Pharmacology Program, Emory University, United States
- Department of Biomedical Engineering, Peking University, China
- Celltrion, Republic of Korea
- Department of Chemistry, Imperial College London, United Kingdom
- Emory Integrated Proteomics Core, Emory University, United States
- Biotechnology Core Facility Branch, Centers for Disease Control and Prevention, United States
- Department of Molecular Medicine, Scripps Research Institute, United States
- Department of Pathology and Laboratory Medicine, Mount Sinai Hospital, Canada
- Department of Physiology and Pharmacology, University of Calgary, Canada
- Department of Medicine, Emory University, United States
Figures
Figure 1 with 2 supplements
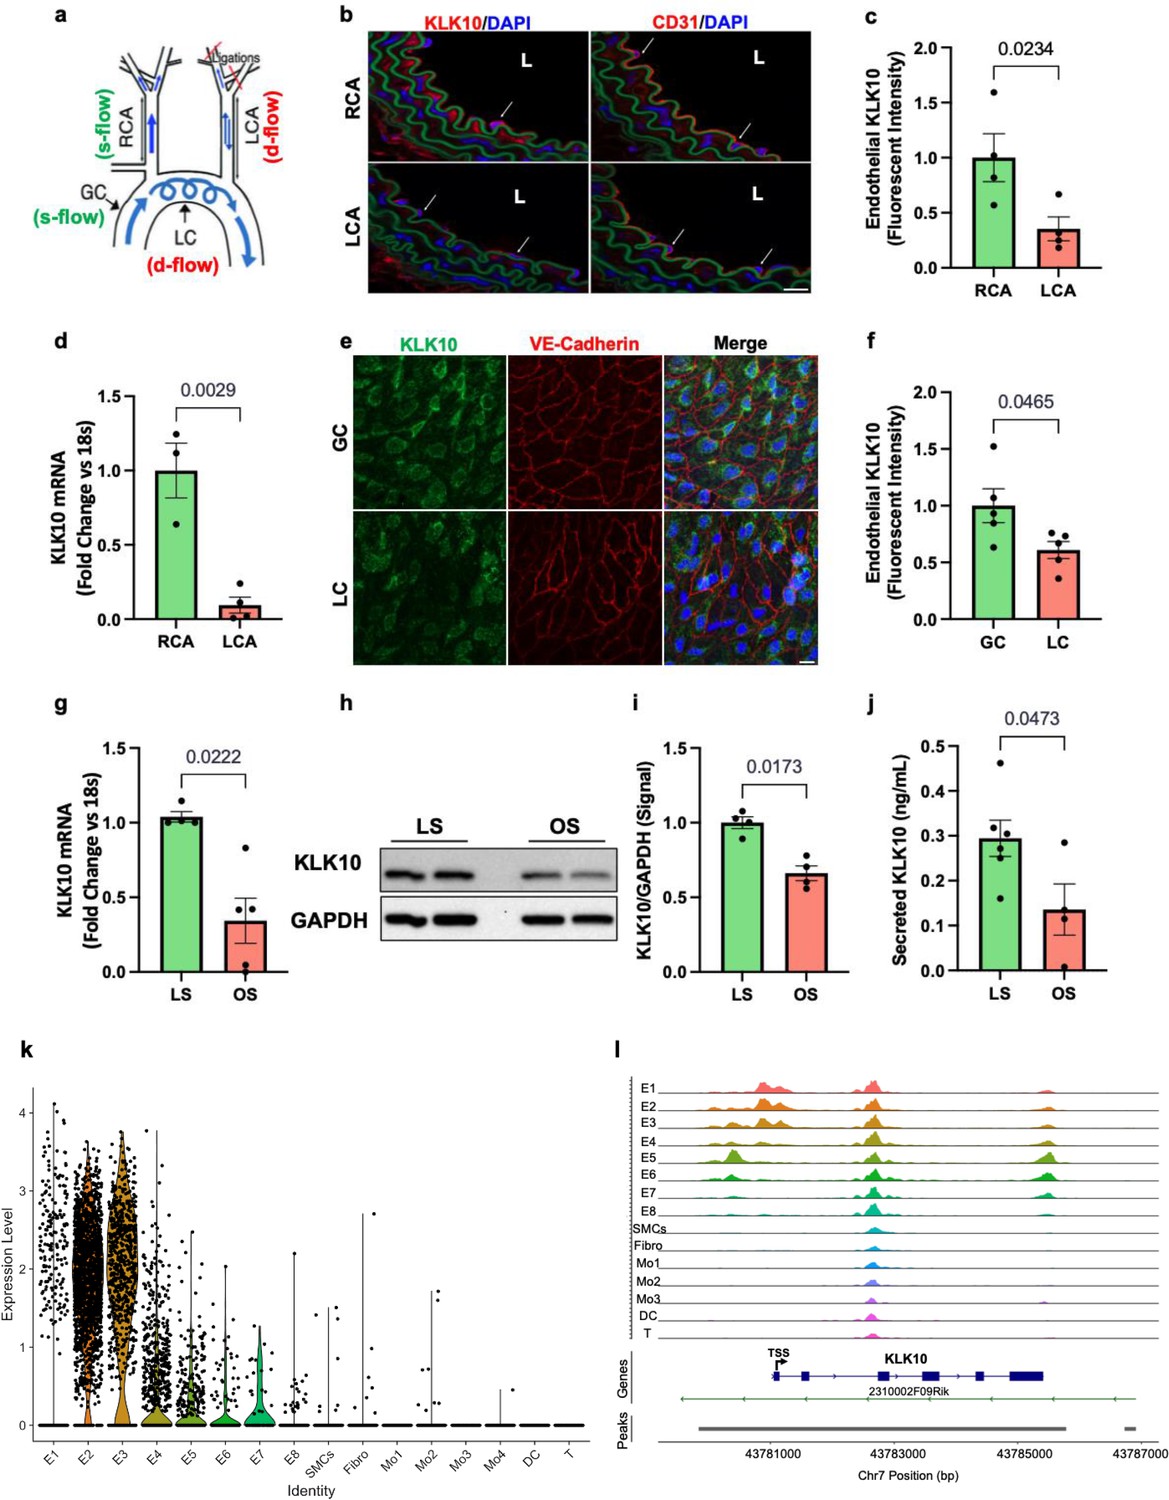
KLK10 expression is suppressed by disturbed flow (d-flow) and elevated by stable flow (s-flow) in endothelial cells (ECs) in vitro and in vivo.
(a) Depiction of the partial carotid ligation (PCL) surgery and flow-sensitive regions in the aortic arch: right carotid artery (RCA; s-flow), left carotid artery (LCA; d-flow), greater curvature (GC: s-flow), and lesser curvature (LC; d-flow). Two days following the PCL of C57BL/6J mice, the RCA and LCA were collected for frozen section imaging (b, c) and (d) endothelial-enriched RNA preparation. (b) Confocal images of immunostaining with anti-KLK10 or anti-CD31 antibodies (red) and counterstained with 4',6-diamidino-2-phenylindole (DAPI, blue) are shown. Scale bar = 20 μm. Arrows indicate endothelial cells and L is the lumen. (c) Quantification of endothelial KLK10 fluorescence intensity expressed as fold-change normalized to the RCA. N = 4. (d) Klk10 mRNA was measured in endothelial-enriched RNA from the carotid arteries by quantitative real-time polymerase chain reaction (qPCR). Data are expressed as fold-change normalized to 18s internal control. N = 3–4. (e) Confocal images of en face coimmunostaining of the LC and GC with anti-KLK10 (green) and anti-VE-Cadherin (red) antibody are shown counterstained with DAPI (blue). Scale bar = 10 μm. (f) Quantification of endothelial KLK10 fluorescence intensity expressed as fold-change normalized to the GC. N = 5. (g–j) Human artery endothelial cells (HAECs) subjected to 24 hr of unidirectional laminar shear (LS; 15 dynes/cm2) or oscillatory shear (OS; ± 5 dynes/cm2) were used to measure expression of KLK10 mRNA by qPCR (g), KLK10 protein in cell lysates by western blot (h, i), and KLK10 protein secreted to the conditioned media by ELISA (j). N = 4–6. All data are represented as mean ± standard error of mean (SEM). Statistical analyses were performed using paired t-test (Figure 1—source data 1). (k) Single-cell RNAseq analysis of Klk10 gene transcripts and (l) single-cell ATACseq analysis of Klk10 chromatin accessibility in eight endothelial cell clusters (E1–E8), smooth muscle cells (SMCs), fibroblasts (Fibro), 4 monocytes/macrophages clusters (Mo1–4), dendritic cells (DCs), and T cells (T) in the mouse carotid arteries following 2 days or 2 weeks of the PCL surgery as we recently reported (Andueza et al., 2020). The published datasets (Andueza et al., 2020) were reanalyzed here for the Klk10 gene. E1–E4 clusters represent ECs exposed to s-flow conditions in the RCA. E5 and E7 clusters represent ECs exposed to acute (2 days) d-flow in the LCA. E6 and E8 clusters represent ECs exposed to chronic (2 weeks) d-flow in the LCA. TSS indicates transcription start site.
-
Figure 1—source data 1
Western blots for KLK10 and GAPDH.
- https://cdn.elifesciences.org/articles/72579/elife-72579-fig1-data1-v2.zip
Figure 1—figure supplement 1
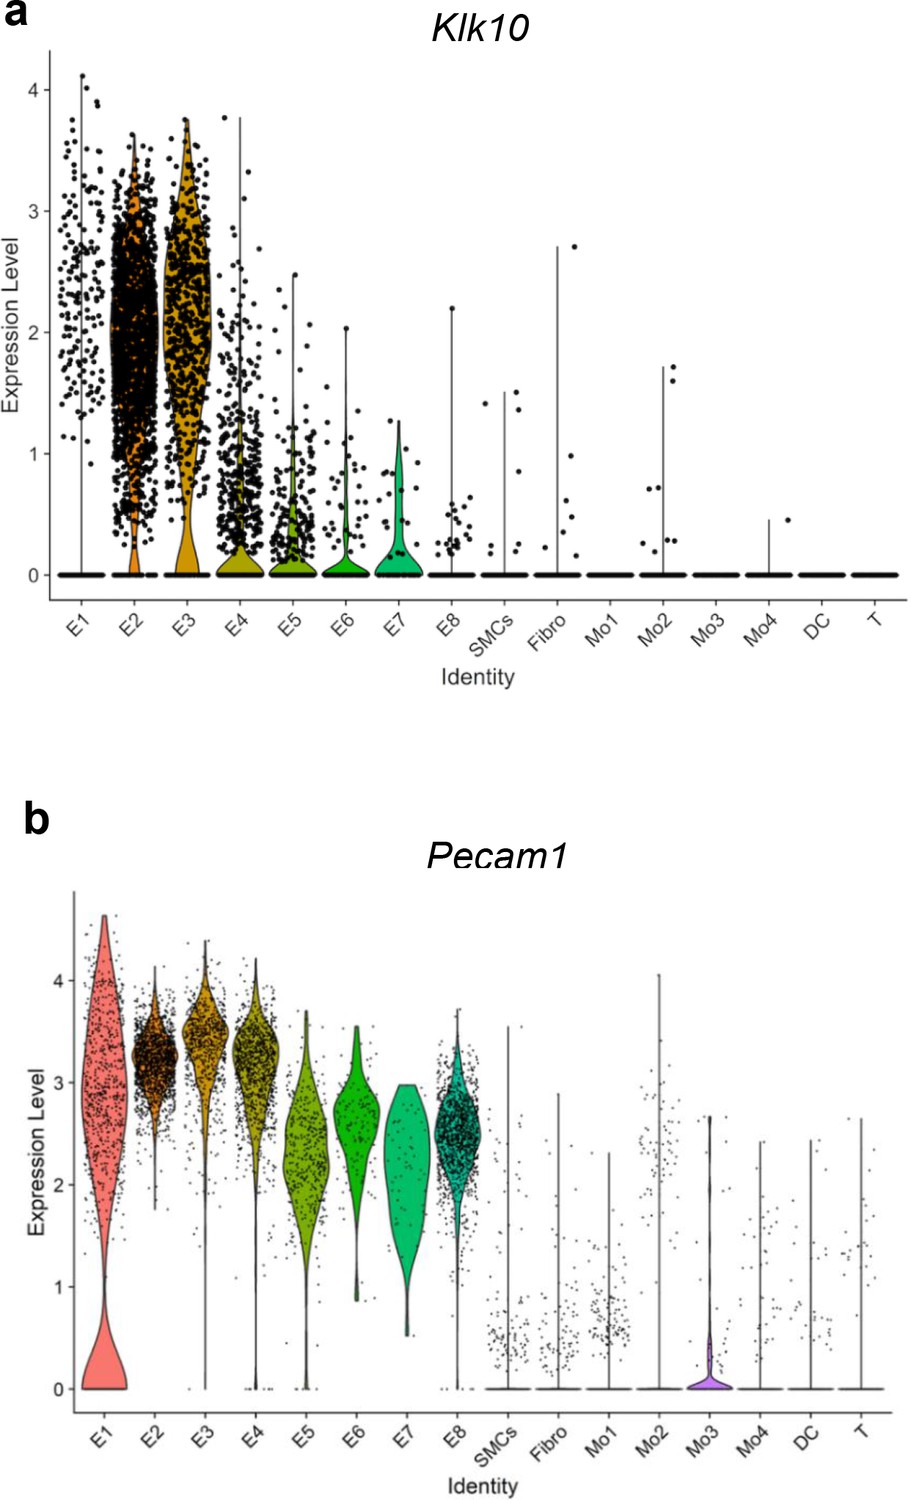
Single-cell RNA sequencing (scRNAseq) analysis of Klk10 and Pecam1 from the partial carotid ligation (PCL) mouse model.
Violin plots show single-cell expression of (a) Klk10 and (b) CD31 (Pecam1) gene transcripts in eight endothelial cell clusters (E1–E8), smooth muscle cells (SMCs), fibroblasts (Fibro), 4 monocytes/macrophages clusters (Mo1–4), dendritic cells (DCs), and T cells (T) in the mouse carotid arteries following 2 days or 2 weeks of the PCL surgery as we recently reported (Andueza et al., 2020). The published scRNAseq data (Andueza et al., 2020) were reanalyzed here for Klk10 and Pecam1 genes. E1–E4 clusters represent ECs exposed to s-flow conditions in the right carotid artery (RCA). E5 and E7 clusters represent ECs exposed to acute (2 days) d-flow in the LCA. E6 and E8 clusters represent ECs exposed to chronic (2 weeks) d-flow in the LCA.
Figure 1—figure supplement 2
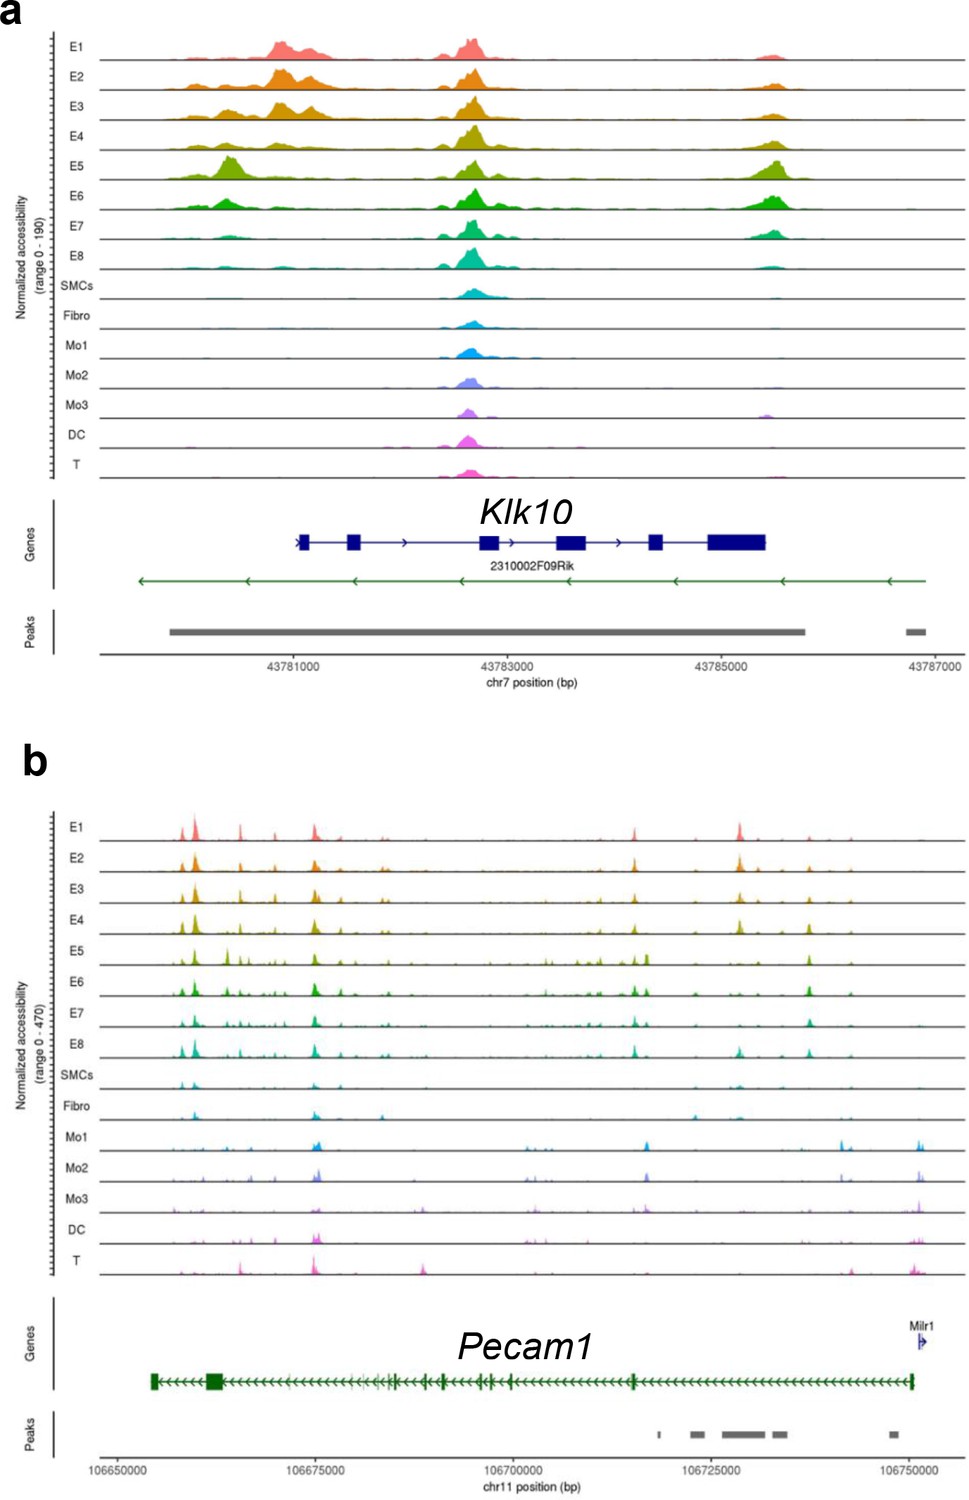
scATAC sequencing (scATACseq) analysis of Klk10 and Pecam1 from the partial carotid ligation (PCL) mouse model.
The plots display single-cell chromatin accessibility status of (a) Klk10 and (b) CD31 (Pecam1) genes in eight endothelial cell clusters (E1–E8), smooth muscle cells (SMCs), fibroblasts (Fibro), 4 monocytes/macrophages clusters (Mo1–4), dendritic cells (DCs), and T cells (T) in the mouse carotid arteries following 2 days or 2 weeks of the PCL surgery as we recently reported (Andueza et al., 2020). The published scATACseq data (Andueza et al., 2020) were reanalyzed here for Klk10 and Pecam1 genes. E1–E4 clusters represent ECs exposed to s-flow conditions in the right carotid artery (RCA). E5 and E7 clusters represent ECs exposed to acute (2 days) d-flow in the LCA. E6 and E8 clusters represent ECs exposed to chronic (2 weeks) d-flow in the LCA.
Figure 2 with 7 supplements
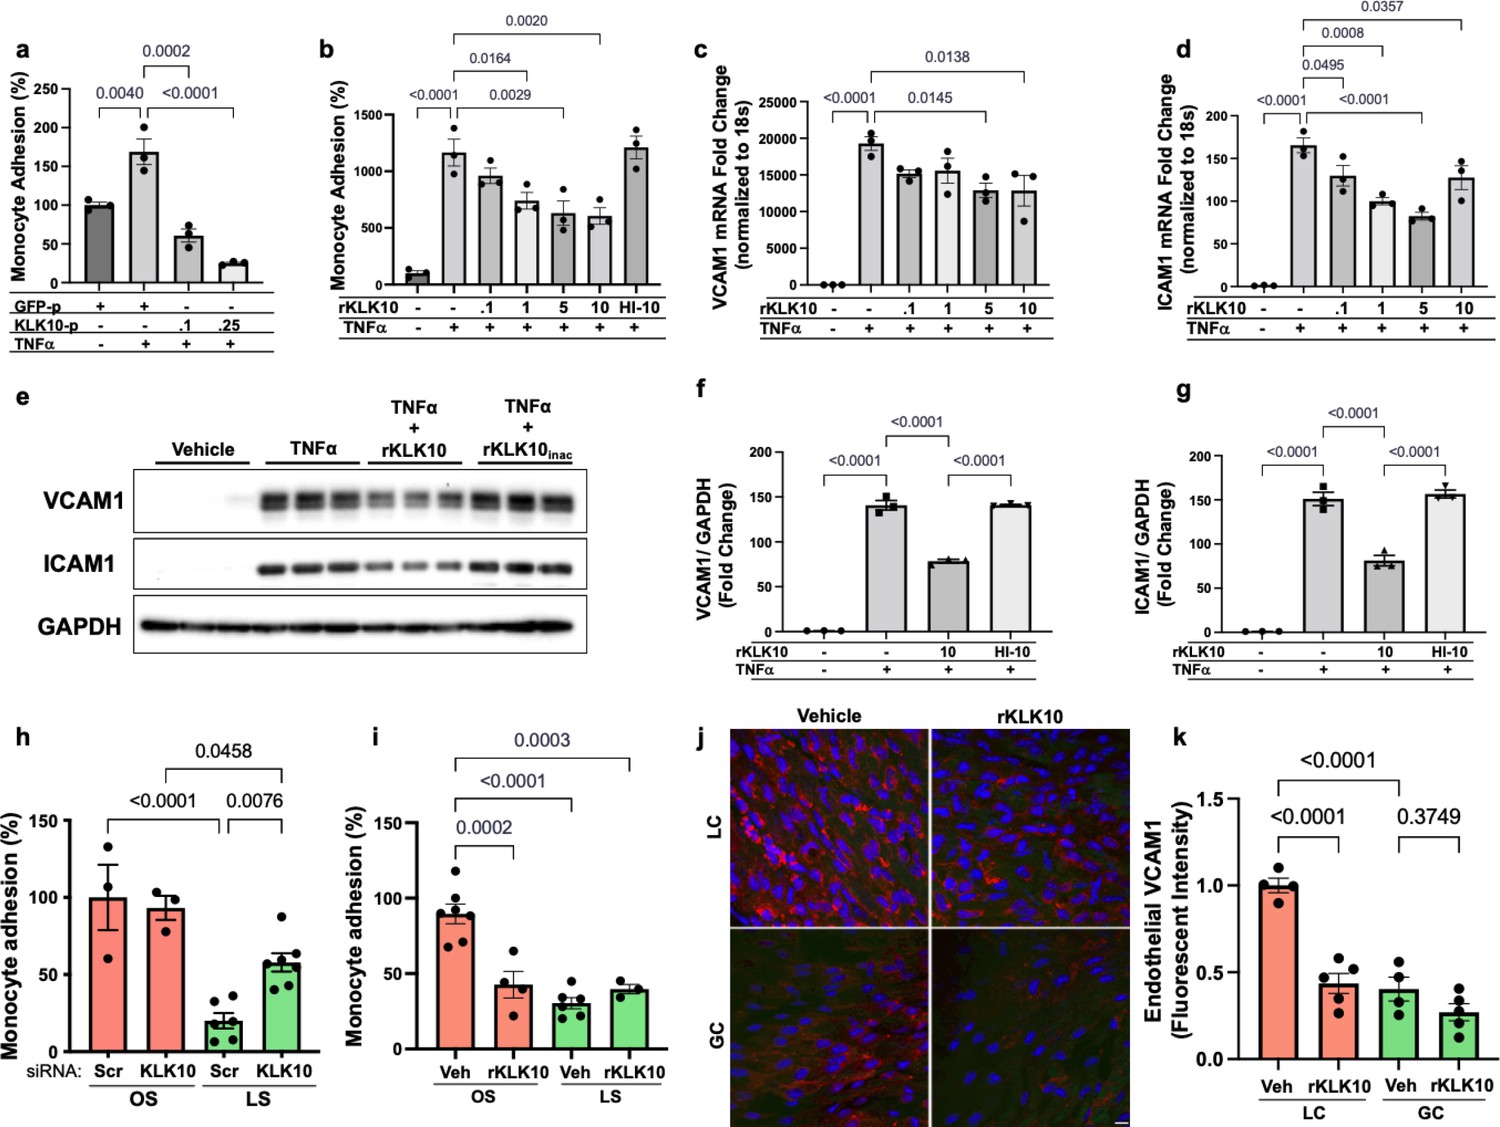
KLK10 inhibits inflammation in endothelial cells in vitro and in vivo.
(a) THP-1 monocyte adhesion assay was carried out in human artery endothelial cells (HAECs) transfected with 0.1 or 0.25 μg of KLK10 plasmid (KLK10-p) or GFP plasmid (GFP-p) for 48 hr followed by TNFɑ treatment (5 ng/ml for 4 hr). Data are represented as percentage of monocyte adhesion normalized to GFP-p control. N = 3. (b) THP-1 monocyte adhesion assay was carried out in HAECs treated with rKLK10 (0.1–10 ng/ml) or heat-inactivated rKLK10 (HI-10) for 24 hr followed by TNFɑ treatment (5 ng/ml for 4 hr). Data are represented as percentage of monocyte adhesion normalized to vehicle control. N = 3. (c–g) HAECs were treated with rKLK10 (0.1–10 ng/ml for 24 hr) followed by TNFɑ treatment (5 ng/ml for 4 hr) and expression of vascular cell adhesion molecule 1 (VCAM1) and intracellular adhesion molecule 1 (ICAM1) were assessed by quantitative real-time polymerase chain reaction (qPCR) (c, d) or western blot (e–g). N = 3. Data are represented as fold-change of the vehicle control and normalized to 18s or GAPDH (Figure 2—source data 1). (h, i) THP-1 monocyte adhesion assay was conducted on HAECs subjected to 24 hr of either laminar shear (LS; 15 dynes/cm2) or oscillatory shear (OS; ±5 dynes/cm2) with either (h) rKLK10 (100 ng/ml) or (i) KLK10 siRNA (50 nM) or a nontargeting siRNA control. Data are represented as percentage of monocyte adhesion normalized to the control OS condition. N = 3–7. (j) C57BL/6J mice were injected with rKLK10 (0.6 mg/kg) or a vehicle control by tail vein once every 2 days for 5 days. The aortic arches were en face immunostained and imaged using confocal microscopy with an anti-VCAM1 antibody (red) and DAPI (blue). (k) Quantification of endothelial VCAM1 fluorescence intensity represented as fold-change normalized to control LC condition. N = 4–5. Scale bar = 10 μm. All data are represented as mean ± standard error of mean (SEM). Statistical analyses were performed using one-way analysis of variance (ANOVA) with Bonferroni correction for multiple comparisons.
-
Figure 2—source data 1
Western blots for VCAM1, ICAM1, and GAPDH.
- https://cdn.elifesciences.org/articles/72579/elife-72579-fig2-data1-v2.zip
Figure 2—figure supplement 1
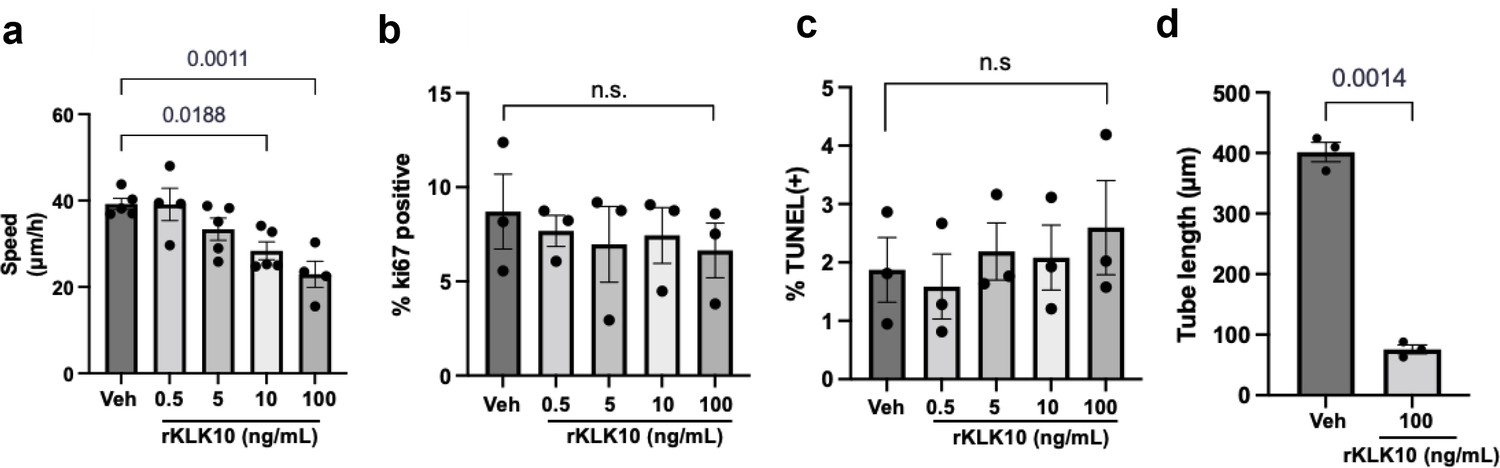
KLK10 inhibits endothelial migration and tube formation, but not apoptosis or proliferation.
Human umbilical vein endothelial cells (HUVECs) were treated with rKLK10 from 0.5 to 100 ng/ml and (a) the scratch assay was performed to measure the rate at which endothelial cells migrated across the scratch; (b) apoptosis was assessed by TUNEL staining; (c) proliferation was assayed by Ki67 imunnostaining. (d) HUEVCs were grown on Matrigel and treated with rKLK10 at 100 ng/ml or vehicle and tube length was measured in ImageJ. N = 3–5. One-way analysis of variance (ANOVA) with Bonferroni correction for multiple comparisons where appropriate (a–c) or paired two-tailed t-test (d). Mean ± standard error of mean (SEM).
Figure 2—figure supplement 2

KLK10 reduces inflammation in endothelial cell.
(a) Human aortic endothelial cells (HAECs) were transfected with KLK10 plasmid ranging from 0.1 to 1 or 1 μg/ml GFP plasmid for 24 hr and the THP-1 monocyte adhesion assay was performed. N = 3. (b) HAECs were treated with 0.5–100 ng/ml rKLK10 and monocyte adhesion assay was performed. N = 4–6. (c) HAECs were treated with 100 ng/ml rKLK10 for 24 hr and quantitative real-time polymerase chain reaction (qPCR) was performed to assess mRNA expression of VCAM1, ICAM1, and MCP1. N = 3–5. One-way analysis of variance (ANOVA) with Bonferroni correction for multiple comparisons (a, b) or two-way ANOVA with Bonferroni correction for multiple comparisons. (c) Mean ± standard error of mean (SEM).
Figure 2—figure supplement 3
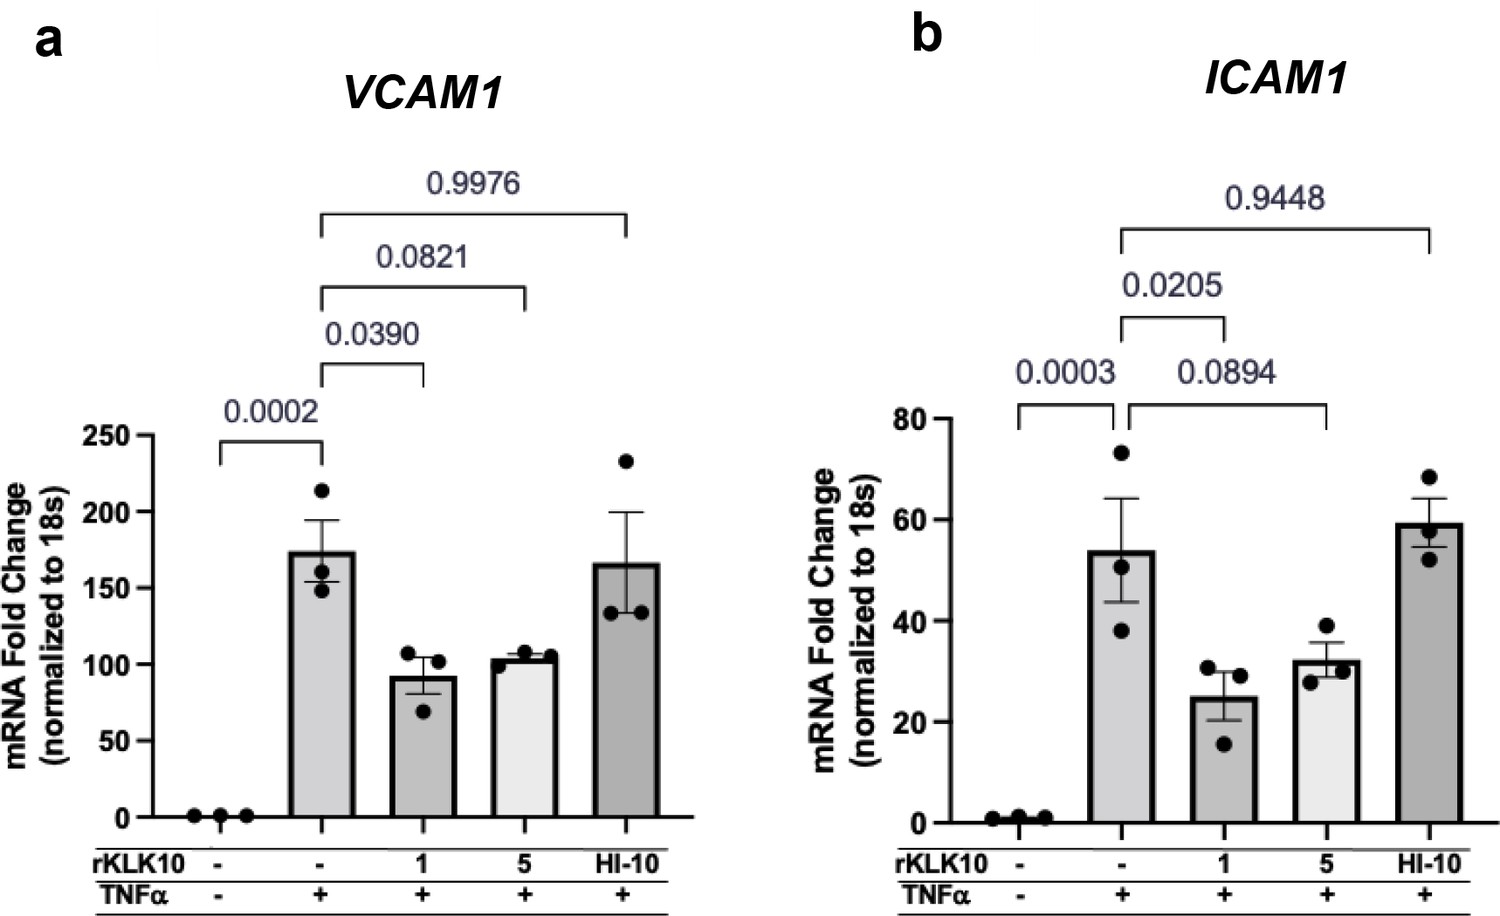
Heat inactivation of rKLK10 prevents its anti-inflammatory effects on VCAM1 and ICAM1 mRNA expression.
(a, b) Human aortic endothelial cells (HAECs) were treated with TNFα (5 ng/ml) for 4 hr followed by 1, 10, or 10 ng/ml heat-inactivated (HI) rKLK10 overnight and mRNA expression of (a) Vcam1 and (b) Icam1 mRNA was measured by quantitative real-time polymerase chain reaction (qPCR). n = 3. One-way analysis of variance (ANOVA) with Bonferroni correction for multiple comparisons. Mean ± standard error of mean (SEM).
Figure 2—figure supplement 4
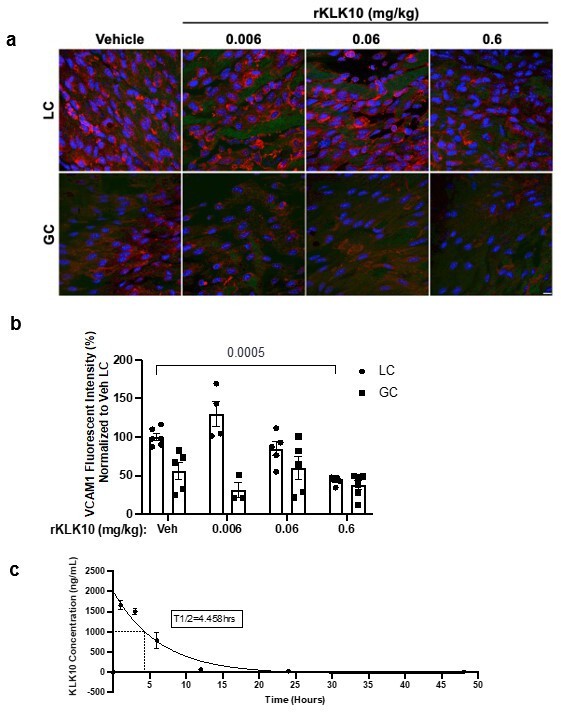
rKLK10 inhibits vascular cell adhesion molecule 1 (VCAM1) expression in the d-flow region of the mouse aortic arch in a dose-dependent manner.
(a) Mice (male, C57BL/6J) were administered 0.006–0.6 mg/kg rKLK10 or vehicle by tail-vein injection and inflammation was assessed by en face immunostaining of VCAM1 at the lesser curvature (LC) and the greater curvature (GC) of the aortic arch. Red = VCAM1, blue = DAPI, green = Elastin. Scale bar = 10 µm. (b) Quantification of VCAM1 staining in A normalized to the LC. Shown are mean ± standard error of mean (SEM), N = 3–6. Two-way analysis of variance (ANOVA) with Bonferroni correction for multiple comparisons. Part of results in (a) and (b) are shown in Figure 2j. (c) C57BL/6J mice (8-week-old males, n = 12) were injected with human rKLK10 (0.6 mg/kg) via tail-vein injection in three groups (n = 4 mice per group) to collect blood via cheek vein at three different time points per group: (1) before injection (Time 0), 1, and 12 hr, (2) 0, 3, and 24 hr, and (3) 0, 6, and 48 hr after the injection. rKLK10 levels in the plasma were determined by human KLK10 ELISA and data were shown as one phase decay plot. t1/2 of rKLK10 was 4.458 hr. Mean ± SEM is shown.
Figure 2—figure supplement 5
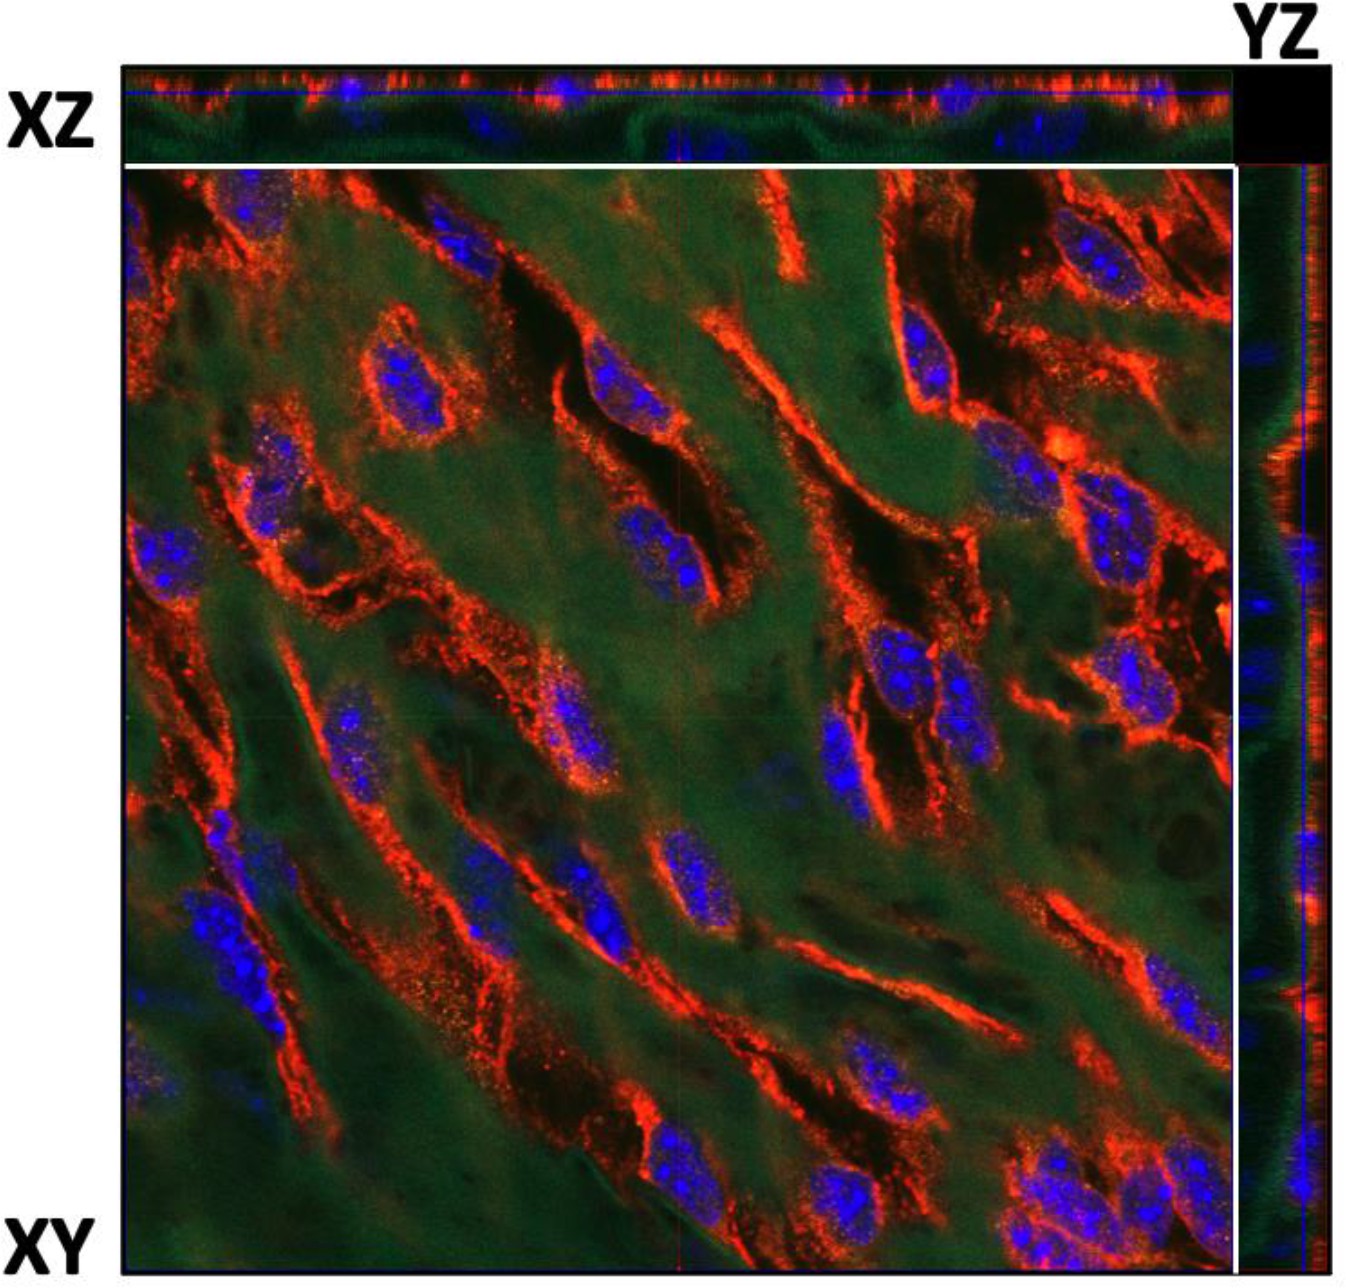
Orthogonal projection of vascular cell adhesion molecule 1 (VCAM1) en face immunostaining and quantification.
En face immunostaining for VCAM1 (shown in Figure 2j) was imaged by confocal microscopy. Shown is a Z-section image demonstrating VCAM1 expression (red) at the endothelial layer above the internal elastic lamina (green). Blue is DAPI. XYZ refers to an optical plane in the confocal image.
Figure 2—figure supplement 6
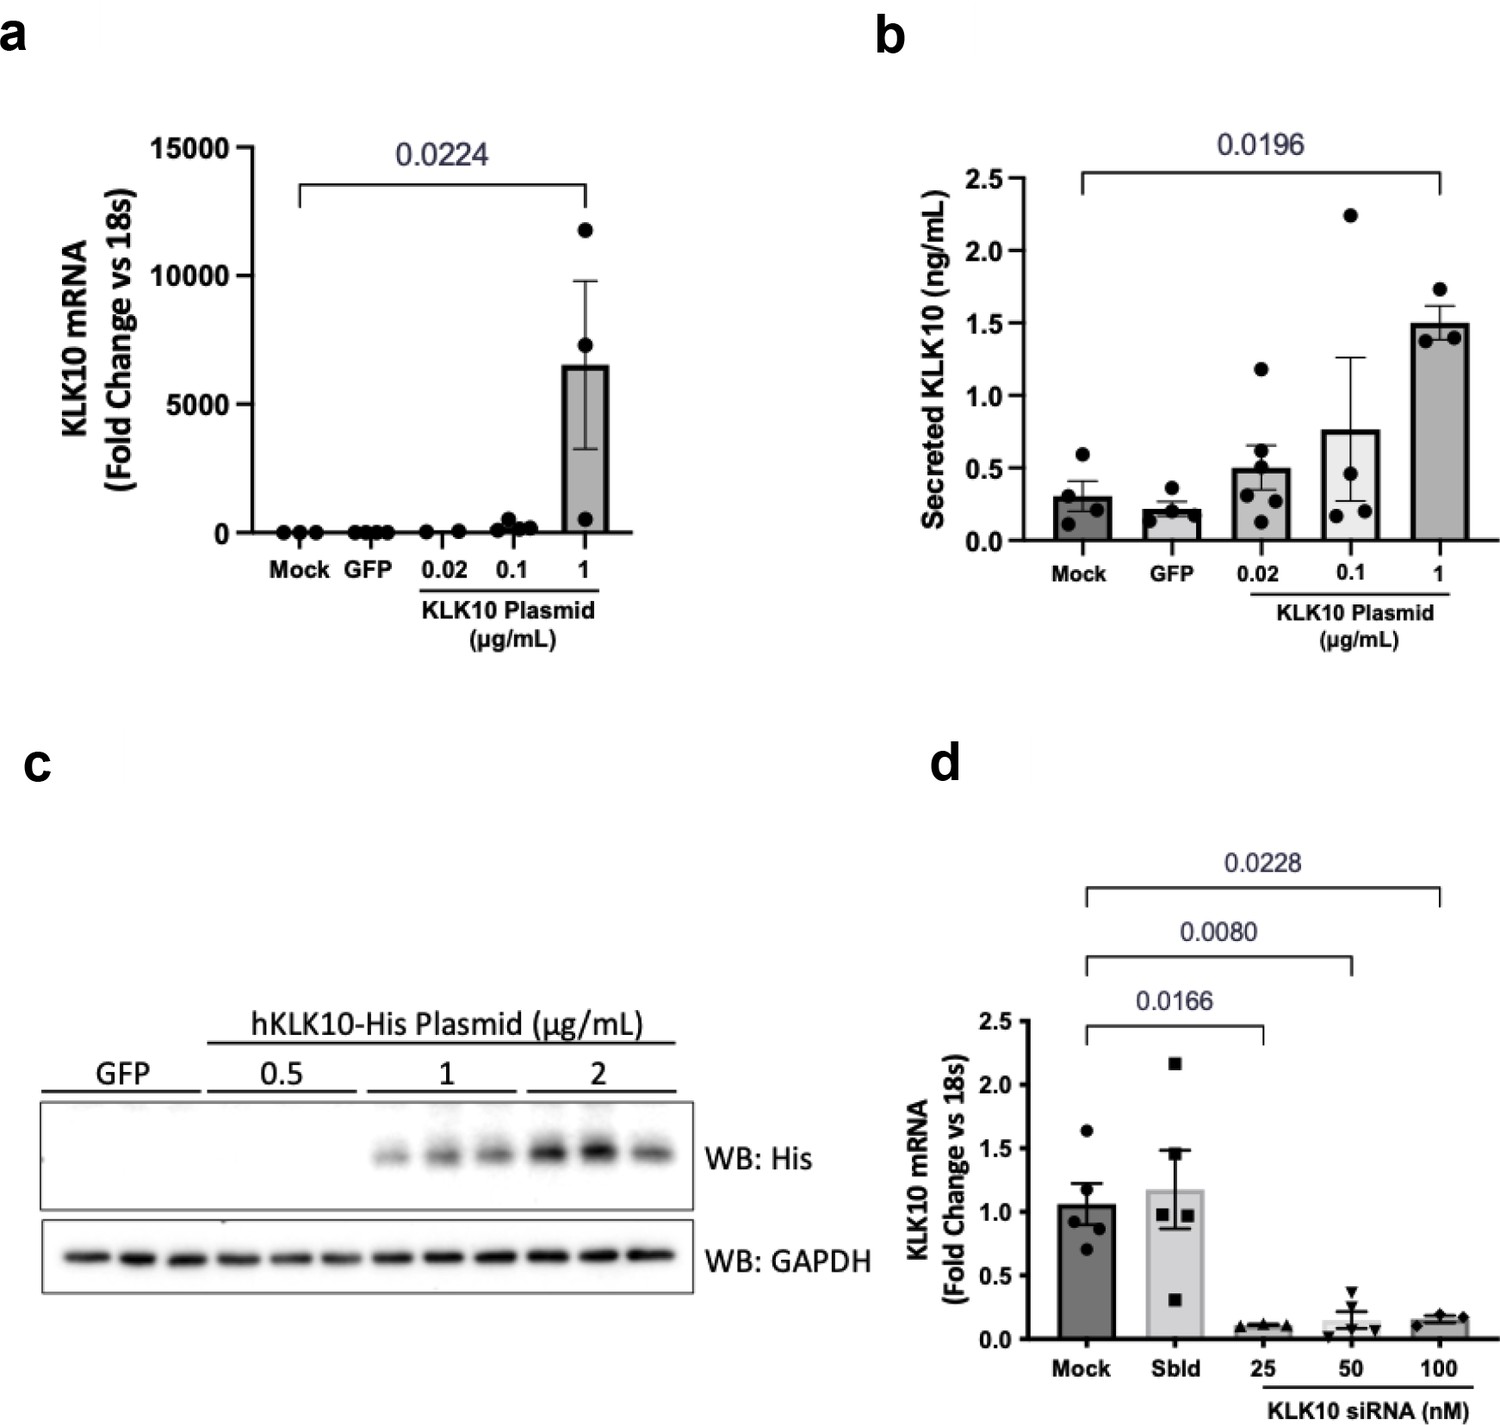
KLK10 plasmid and KLK10 siRNA overexpress and knockdown KLK10, respectively.
(a) Human aortic endothelial cells (HAECs) were transfected with 0.02–1 μg/ml KLK10 plasmid or 1 μg/ml GFP plasmid and KLK10 mRNA expression was measured by quantitative real-time polymerase chain reaction (qPCR). N = 3–4. (b) HAECs were transfected with 0.02–1 μg/ml KLK10 plasmid or 1 μg/ml GFP plasmid and KLK10 secretion into the media was measured by ELISA. N = 3–5. (c) HAECs were transfected with 0.5–2 μg/ml KLK10 plasmid or 2 μg/ml GFP and KLK10 protein expression was measured by western blot, using GAPDH as an internal control. N = 3 (Figure 2—figure supplement 6—source data 1). (d) HAECs were transfected with 25–100 nM KLK10 siRNA or 100 nM scrambled siRNA and KLK10 mRNA expression was measured by qPCR. N = 3–5. Mean ± standard error of mean (SEM). One-way ANOVA with Bonferroni correction for multiple comparisons where appropriate.
-
Figure 2—figure supplement 6—source data 1
Western blots for HIS and GAPDH.
- https://cdn.elifesciences.org/articles/72579/elife-72579-fig2-figsupp6-data1-v2.zip
Figure 2—figure supplement 7
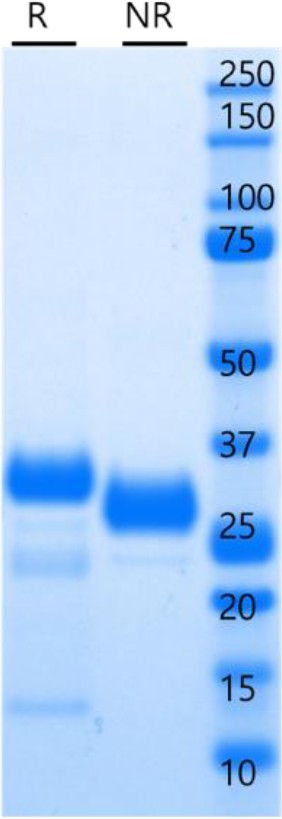
Human rKLK10 purification from CHO cells.
Human rKLK10 with His-tag overexpressed in CHO cells was purified by affinity chromotagraphy. Purified rKLK10 (5 µg) was resolved by sodium dodecyl sulfate–polyacrylamide gel electrophoresis (SDS–PAGE) under reducing (R) or nonreducing (NR) conditions and stained with Coomassie blue (Figure 2—figure supplement 7—source data 1).
-
Figure 2—figure supplement 7—source data 1
rKLK10 coomassie blue gel.
- https://cdn.elifesciences.org/articles/72579/elife-72579-fig2-figsupp7-data1-v2.zip
Figure 3
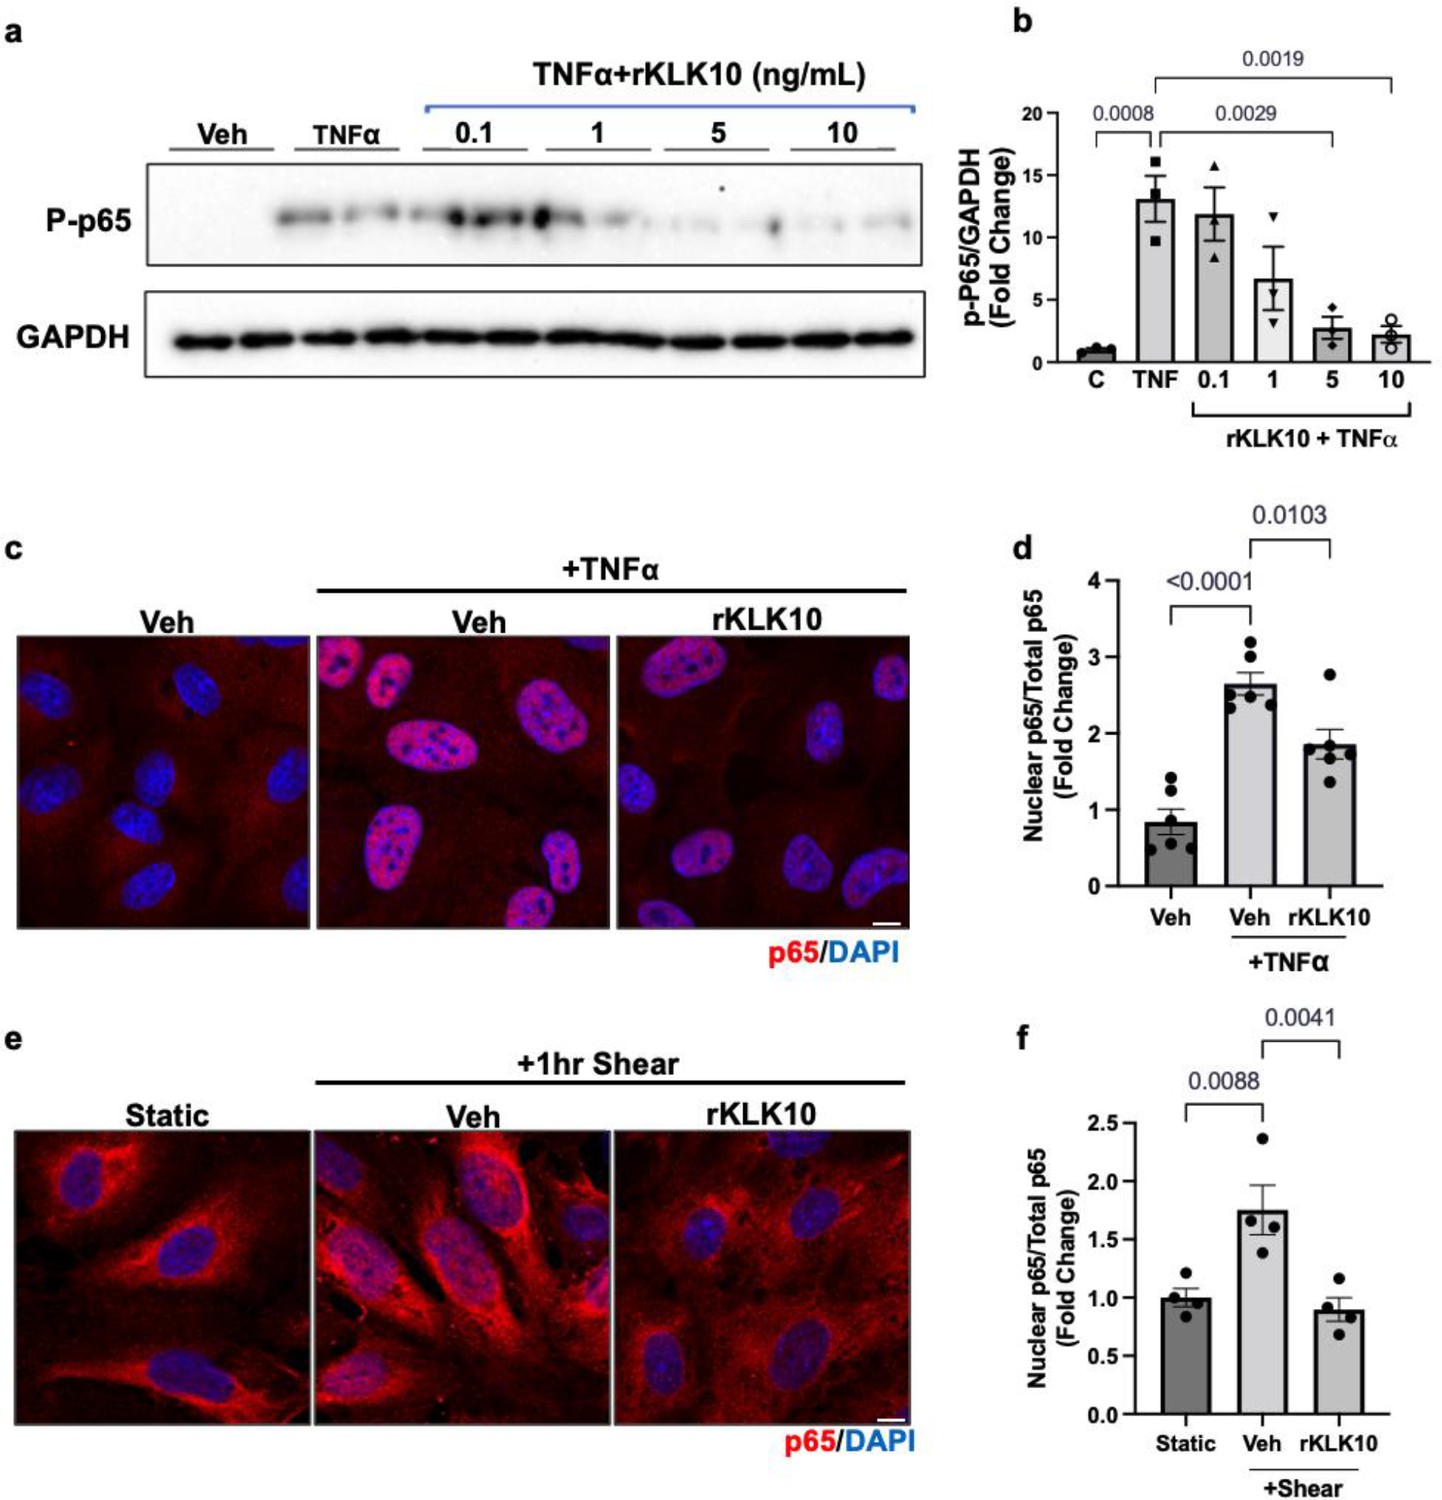
KLK10 inhibits NFκB p65 phosphorylation and nuclear translocation.
(a, b) Human aortic endothelial cells (HAECs) were treated with rKLK10 (10 ng/ml) or vehicle for 16 hr followed by TNFα (5 ng/ml for 4 hr). Cell lysates were then collected and analyzed for phosphorylated p65 (p-p65) by sodium dodecyl sulfate–polyacrylamide gel electrophoresis (SDS–PAGE). Data are expressed as p-p65 fold-change normalized to GAPDH and vehicle control. N = 3 (Figure 3—source data 1). (c, d) HAECs were treated with rKLK10 (10 ng/ml) or vehicle for 16 hr followed by TNFα (5 ng/ml for 4 hr). Cells were then fixed and immunostained for p65 using anti-p65 antibody. Data are expressed as nuclear p65/total p65, normalized to the vehicle control. N = 6. (e, f) HAECs were treated with rKLK10 (10 ng/ml) or vehicle for 16 hr and exposed to shear for 1 hr. Cells were then fixed and immunostained for p65 using anti-p65 antibody. Data are expressed as nuclear p65/total p65, normalized to the static control. N = 4. All data are represented as mean ± standard error of mean (SEM). Statistical analyses were performed using one-way analysis of variance (ANOVA) with Bonferroni correction.
-
Figure 3—source data 1
Western blots for p-p65 NFkB and GAPDH.
- https://cdn.elifesciences.org/articles/72579/elife-72579-fig3-data1-v2.zip
Figure 4
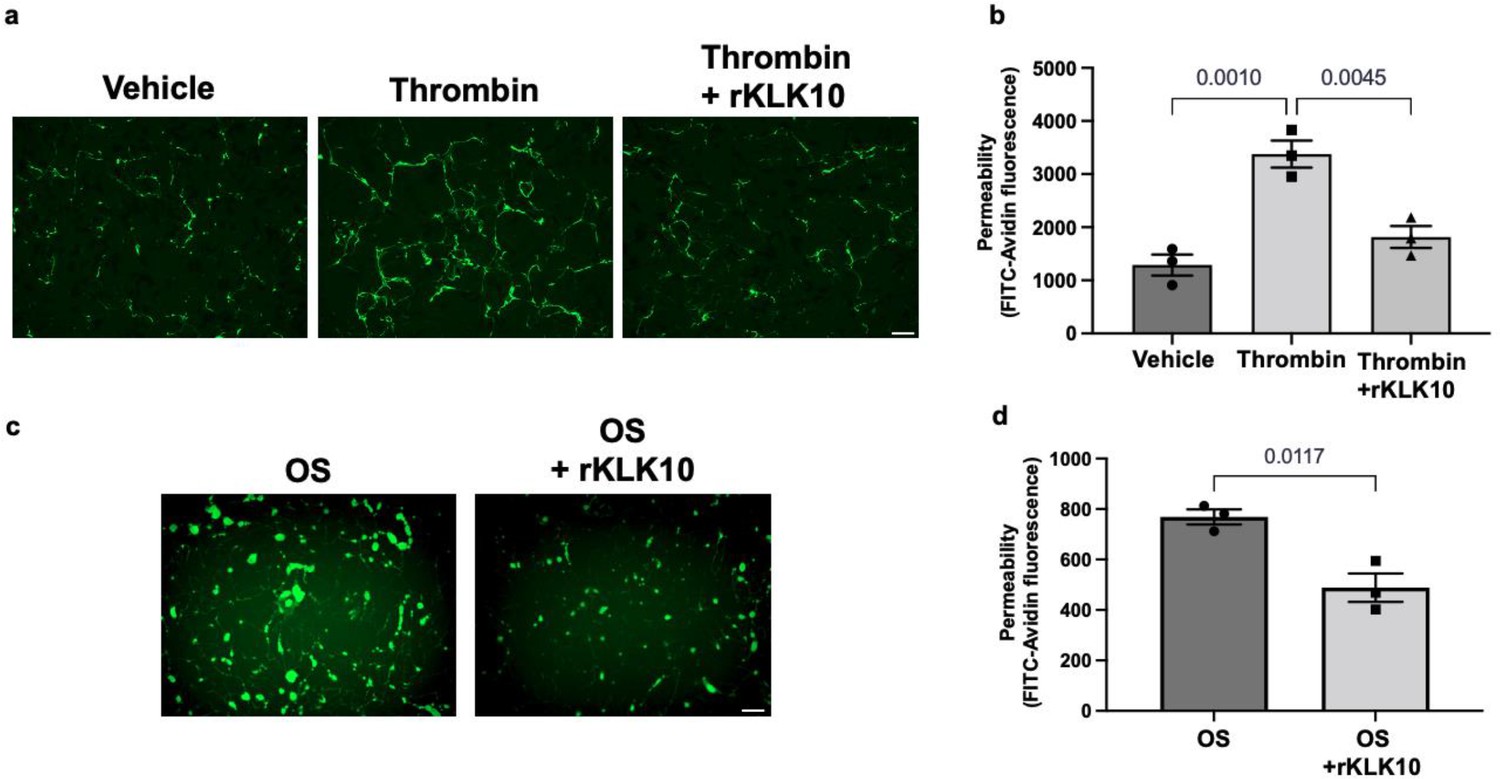
KLK10 protects endothelial permeability against thrombin and oscillatory shear (OS).
Human aortic endothelial cells (HAECs) were grown to confluency on biotinylated gelatin and were treated with (a, b) rKLK10 (10 ng/ml) or vehicle for 16 hr followed by thrombin (5 U/ml for 30 min), or (c, d) exposed to OS (±5 dynes/cm2) with rKLK10 (10 ng/ml) or vehicle for 24 hr. Endothelial permeability was then measured by the binding of FITC-avidin to the biotinylated gelatin. (b, d) Quantification of endothelial permeability measured as FITC-avidin fluorescence intensity. N = 3 each. Scale bar = 50 μm. All data are represented as mean ± standard error of mean (SEM). Statistical analyses were performed using one-way analysis of variance (ANOVA) with Bonferroni correction (b) or paired t-test (d).
Figure 5
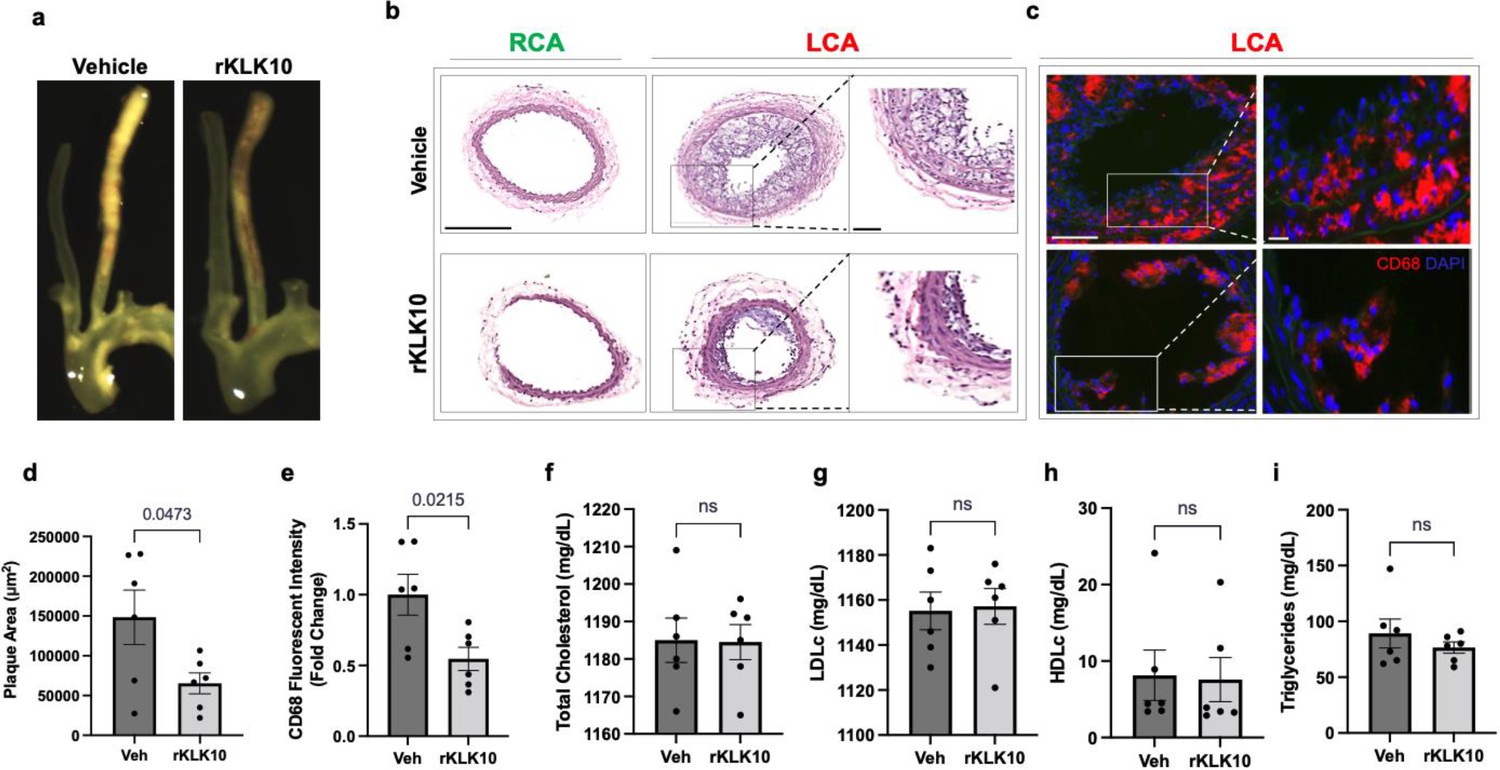
Treatment with rKLK10 inhibits atherosclerosis development in Apoe−/− mice.
(a) Apoe−/− were subjected to partial carotid ligation and high-fat diet feeding. The mice received either rKLK10 (0.6 mg/kg) or vehicle injection every 3 days for the duration of 3 weeks. Left carotid artery (LCA) showed plaque development, which was reduced by rKLK10 as shown by dissection microscopy. Frozen sections from the LCA and right carotid artery (RCA) were stained with (b) H&E and (c) for CD68 in LCA. DAPI (blue). Scale bar low mag = 250 μm, high mag = 50 μm. (d) Plaque area was quantified from H&E staining and is represented as μm2. (e) CD68 fluorescence intensity was quantified and is represented as the CD68 fold-change normalized to the control. Plasma lipid analysis of (f) total cholesterol, (g) low-density lipoprotein (LDL cholesterol), (h) high-density lipoprotein (HDL) cholesterol, or (i) triglycerides showed no effect of rKLK10 compared to control. All data are represented as mean ± standard error of mean (SEM). Statistical analyses were performed using paired t-test. N = 6. ns = not significant.
Figure 6 with 1 supplement
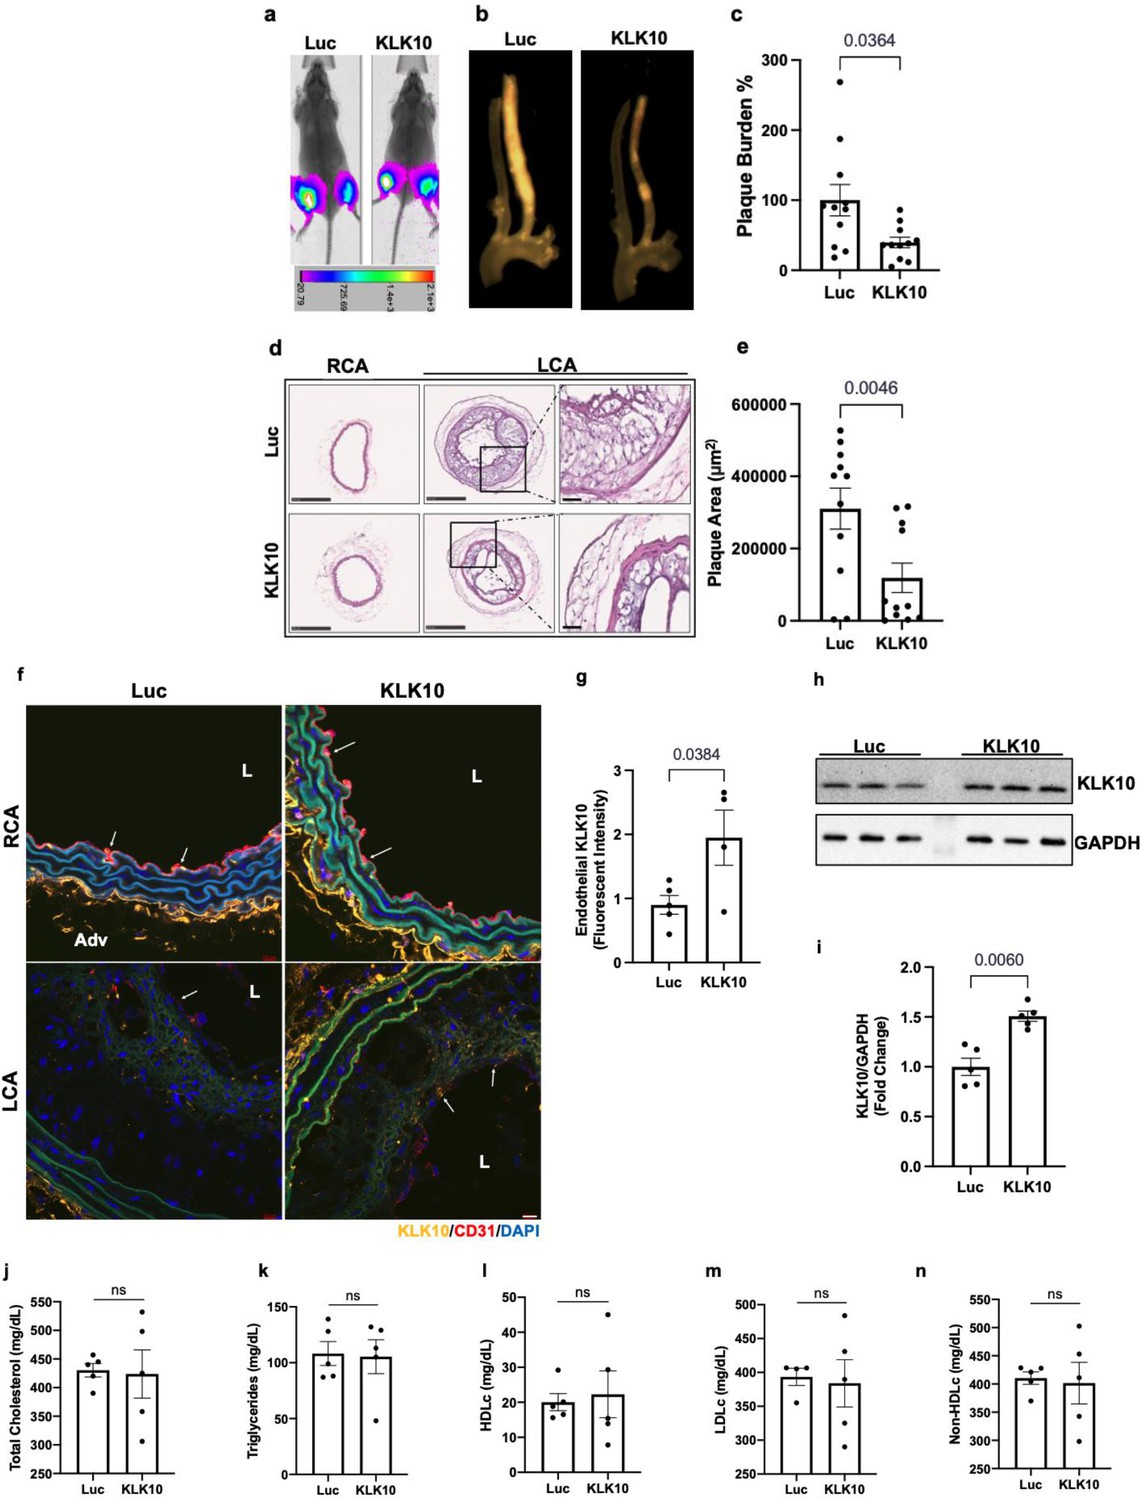
Ultrasound-mediated overexpression of Klk10 plasmid inhibits atherosclerosis development.
(a) Bioluminescent imaging of Apoe−/− partial carotid ligation (PCL) mice on a high-fat diet injected with luciferase control plasmid or Klk10-luciferase plasmid, measured in photons/second. (b) Gross plaque images of excised carotid arteries and (c) quantification of plaque burden normalized to the percentage of the luciferase control. (d) H&E staining of sections from the left carotid artery (LCA) and right carotid artery (RCA) of mice injected with luciferase control plasmid or Klk10-luciferase plasmid. Scale bar low mag = 250 μm, high mag = 50 μm. (e) Quantification of plaque area measured in μm2. All data are represented as mean ± standard error of mean (SEM). Statistical analyses were performed using paired t-test. N = 11. (f) Sections from the RCA and LCA were coimmunostained with anti-KLK10 (orange) and anti-CD31 (red) antibodies. Blue is DAPI. Arrows indicate the ECs. L is the lumen and Adv is the adventitia. Scale bar = 10 μm. (g) Quantification of endothelial KLK10 fluorescent intensity represented as fold-change normalized to luciferase control. (h) Western blot analysis of KLK10 expression in lung tissue from mice injected with control luciferase plasmid or Klk10 plasmid (Figure 6—source data 1). (i) Quantification of KLK10 expression normalized to GAPDH and luciferase control. Plasma lipid analysis of (j) total cholesterol, (k) triglycerides, (l) high-density lipoprotein (HDL) cholesterol, (m) low-density lipoprotein (LDL) cholesterol, or (n) non-HDL cholesterol. All data are represented as mean ± SEM. Statistical analyses were performed using paired t-test. N = 5. ns = not significant.
-
Figure 6—source data 1
Western blots for KLK10 and GAPDH.
- https://cdn.elifesciences.org/articles/72579/elife-72579-fig6-data1-v2.zip
Figure 6—figure supplement 1
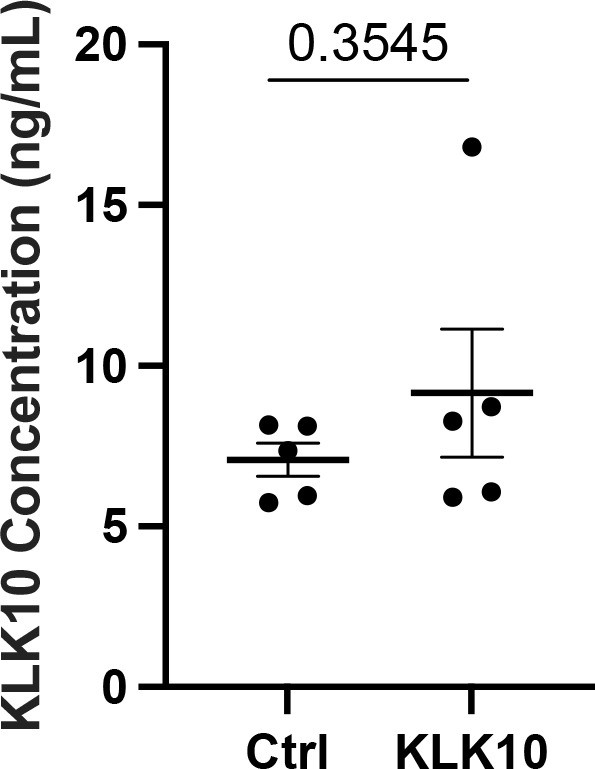
KLK10 level in the mouse plasma.
KLK10 expression was measured in the plasma from mice overexpressing luciferase (Ctrl) or mouse Klk10 plasmid with ultrasound treatment in the hind-limb as described in Figure 6. Plasma KLK10 level was determined using mouse KLK10 ELISA (BG-MUS11429). Paired two-tailed t-test was used. Shown are mean ± standard error of mean (SEM), n = 5.
Figure 7
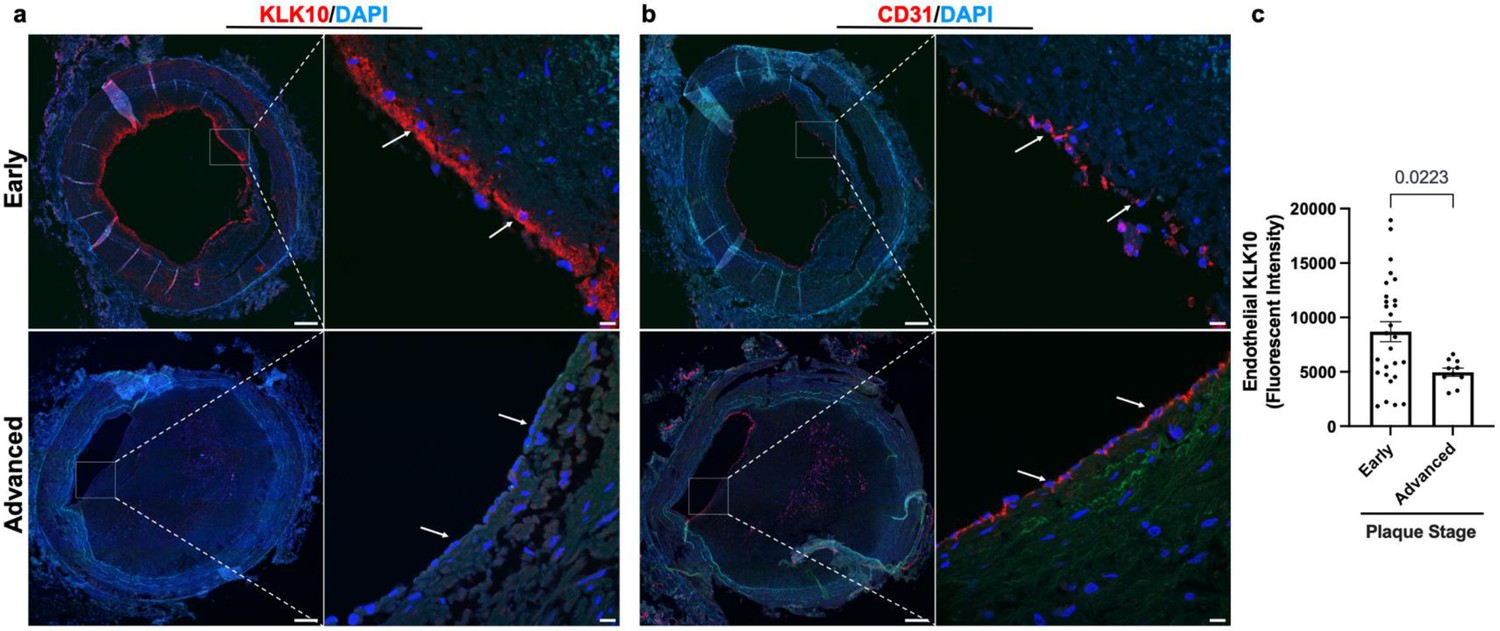
KLK10 expression is decreased in human coronary arteries with advanced atherosclerotic plaques.
(a) Human coronary artery sections with varying degrees of atherosclerotic lesions were stained with anti-KLK10 antibody (red) and DAPI (blue). Scale bar low mag = 500 μm, scale bar; high mag = 50 μm. Arrows indicate endothelial cells. (b) Consecutive arterial sections from the same patients were stained with anti-CD31 antibody (red) and DAPI (blue). (c) Quantification of endothelial KLK10 fluorescence intensity in lower stage plaques (AHA grades 1–3) and advanced stage plaques (AHA grades 4–6). Data are from 40 different patients. Statistical analyses were performed using unpaired t-test. Mean ± standard error of mean (SEM) (Table 1).
Figure 8 with 2 supplements
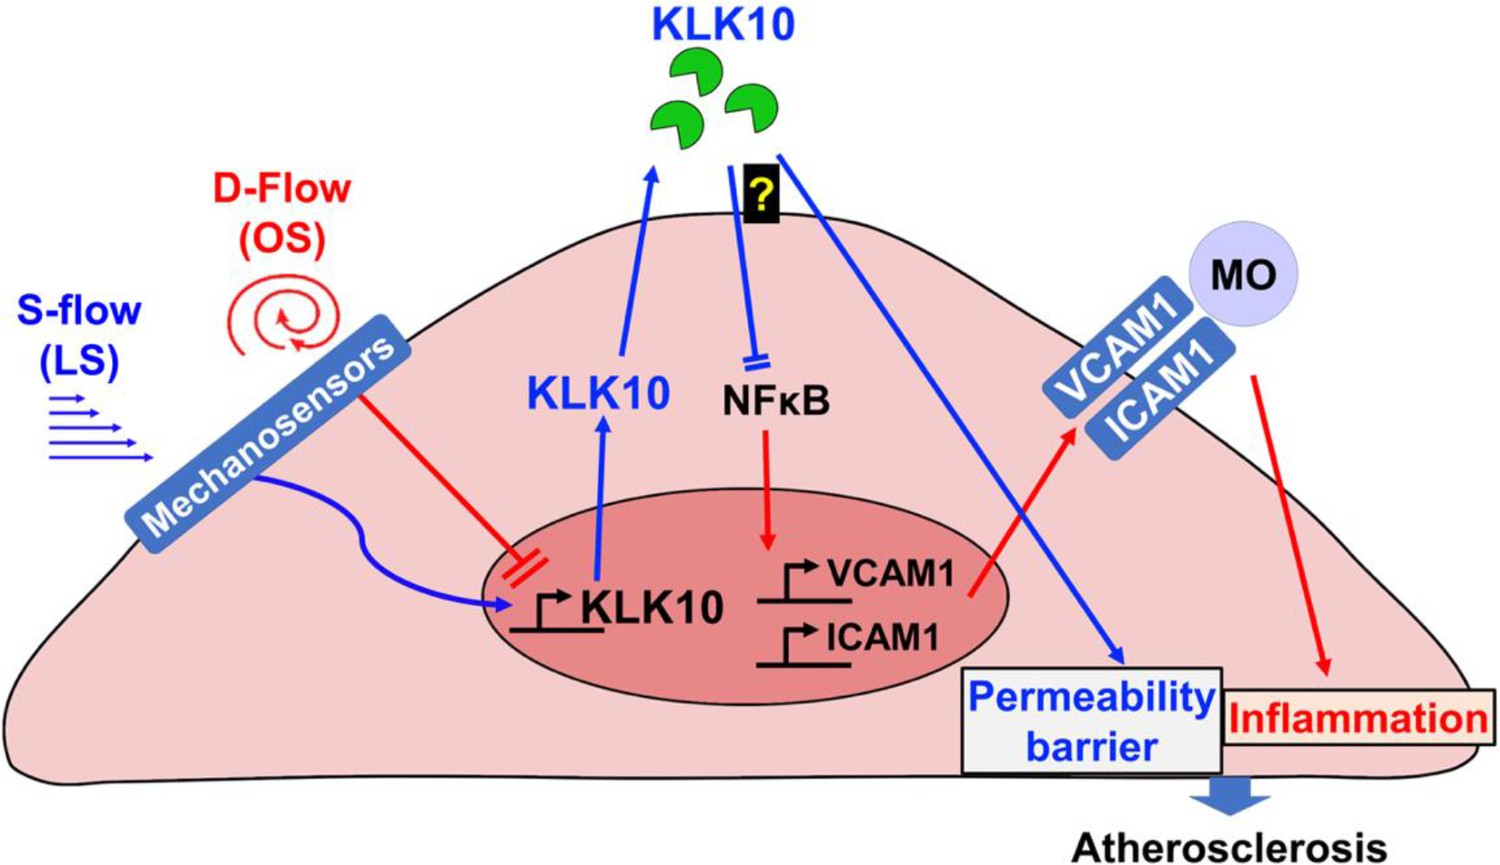
Flow-sensitive KLK10 inhibits endothelial inflammation and protects permeability barrier, ultimately reducing atherosclerosis.
KL10 is upregulated by s-flow and downregulated by d-flow at the genomic and protein levels. Under s-flow conditions when KLK10 is expression is high, KLK10 inhibits NFκB and expression of vascular cell adhesion molecule 1 (VCAM1) and intracellular adhesion molecule 1 (ICAM1), thereby preventing monocyte adhesion. Additionally, KLK10 produced by s-flow protects the endothelial permeability barrier. Together, the anti-inflammatory and barrier-protective effects of KLK10 lead to an overall protection against atherosclerosis.
Figure 8—figure supplement 1
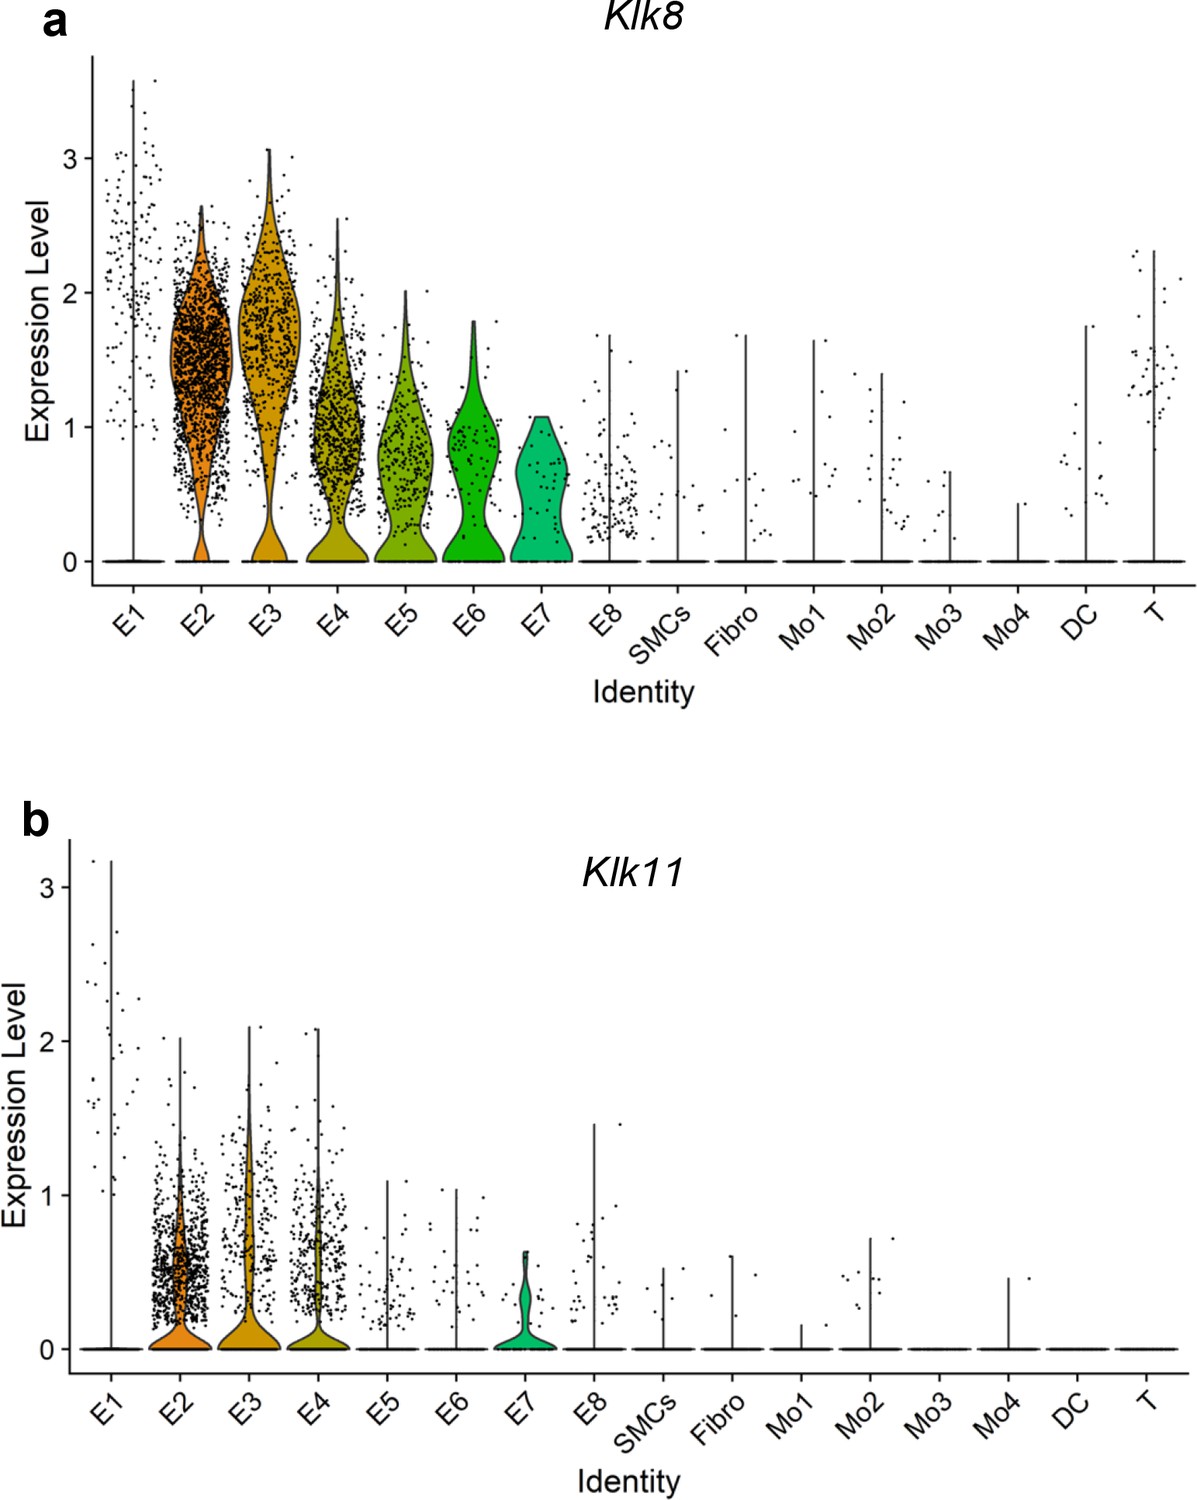
Single-cell RNA sequencing (scRNAseq) analysis of Klk8 and Klk11 from the partial carotid ligation (PCL) mouse model.
Violin plots representing single-cell expression of (a) Klk8 and (b) Klk11 gene transcripts in eight endothelial cell clusters (E1–E8), smooth muscle cells (SMCs), fibroblasts (Fibro), 4 monocytes/macrophages clusters (Mo1–4), dendritic cells (DCs), and T cells (T) in the mouse carotid arteries following 2 days or 2 weeks of the PCL surgery as we recently reported (Andueza et al., 2020). The published scRNAseq data (Andueza et al., 2020) were reanalyzed here for Klk8 and Klk11 genes. E1–E4 clusters represent ECs exposed to s-flow conditions in the right carotid artery (RCA). E5 and E7 clusters represent ECs exposed to acute (2 days) d-flow in the left carotid artery (LCA). E6 and E8 clusters represent ECs exposed to chronic (2 weeks) d-flow in the LCA.
Figure 8—figure supplement 2
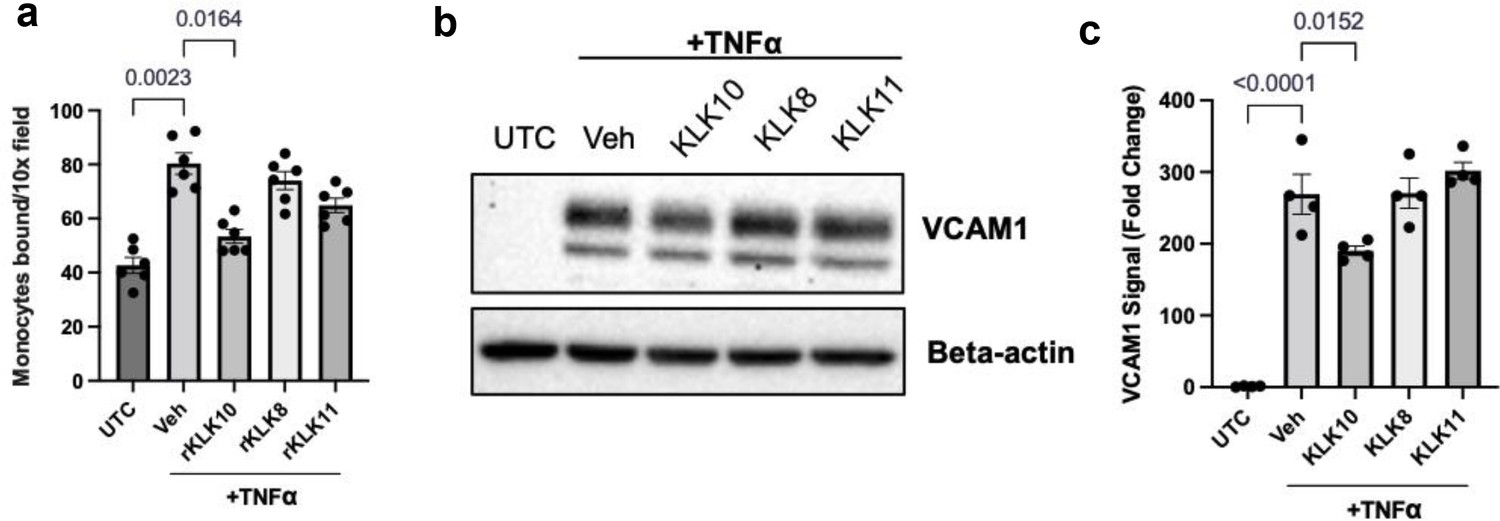
rKLK10, but not rKLK8 or rKLK11, inhibits monocyte adhesion and vascular cell adhesion molecule 1 (VCAM1) expression in human aortic endothelial cells (HAECs) exposed to TNFα.
HAECs were treated with rKLK8, 10, or 11 (10 ng/ml each) or vehicle (UTC) for 16 hr, followed by TNFα (5 ng/ml) or vehicle for 4 hr. Then, (a) THP-1 monocyte adhesion assay and (b) western blot analysis for VCAM1 expression were performed (Figure 8—figure supplement 2—source data 1). (c) is the quantification of (b) using beta-actin as an internal control using the NIH ImageJ. One-way analysis of variance (ANOVA) was used for statistical analysis. Shown are mean ± standard error of the mean (SEM), n = 4–6.
-
Figure 8—figure supplement 2—source data 1
Western blots for VCAM1 and beta-actin.
- https://cdn.elifesciences.org/articles/72579/elife-72579-fig8-figsupp2-data1-v2.zip
Tables
Table 1
Patient characteristics.
| Age (mean ± SEM) | Stroke | Hypertension | Diabetes | Smoking | |
|---|---|---|---|---|---|
| Total (n = 40) | 52.25 ± 13.35 | 15 | 26 | 8 | 17 |
| Sex | |||||
| Male (n = 27) | 53.21 ± 11.15 | 10 | 16 | 5 | 12 |
| Female (n = 13) | 51.93 ± 16.22 | 5 | 10 | 3 | 5 |
| Race | |||||
| White (n = 21) | 54.95 ± 13.14 | 8 | 12 | 3 | 9 |
| Black (n = 17) | 49.72 ± 14.17 | 7 | 14 | 5 | 7 |
| Hispanic (n = 2) | 44 ± 5.66 | 0 | 0 | 0 | 1 |
-
SEM, standard error of mean.
Key resources table
| Reagent type (species) or resource | Designation | Source or reference | Identifiers | Additional information |
|---|---|---|---|---|
| Gene (human) | KLK10 | Gene ID: 5655 | Kallikrein-related peptidase 10 | |
| Gene (mouse) | Klk10 | Gene ID: 69,540 | Kallikrein-related peptidase 10 | |
| Strain, strain background (mouse) | C57BL/6J | The Jackson Laboratory | 000664 | Male, 6–10 weeks of age |
| Genetic reagent (mouse) | Apoe−/− (B6.129P2-Apoetm1Unc/J) | The Jackson Laboratory | 002052 | C57BL/6J Mice homozygous for the Apoetm1Unc mutation. Male, 6–10 weeks of age |
| Peptide, recombinant protein | Recombinant human KLK10 | RayBiotech | 230-00040-10 | Human produced in E. coli |
| Peptide, recombinant protein | Recombinant human KLK10-6xHis | This paper | Gene ID: 5655 | Ala34-Asn276 with C-terminal His tagHuman produced in CHO cells |
| Peptide, recombinant protein | Human TNFα | Thermo Fisher | PHC3011 | Human produced in E. coli |
| Recombinant DNA reagent | pcDNA3.4_hKLK10-6X His Plasmid | This paper | Gene ID: 5655 | Human KLK10 Met1- Asn276 with C-terminal His tag |
| Recombinant DNA reagent | pCMV-Igκ-Klk10-T2A-Luc Plasmid | This paper | Gene ID: 69,540 | Mouse Klk10 Met1-Lys278 with secretion tag and cleavable Luc reporter |
| Recombinant DNA reagent | PCMV-Luciferase Plasmid | Addgene | #45,968 | |
| Recombinant DNA reagent | PmaxGFPPlasmid | Lonza | #D-00059 | |
| Recombinant DNA reagent | Human KLK10 siRNA | Dharmacon | J-005907-08 | |
| Recombinant DNA reagent | Human Scrambled siRNA | Dharmacon | D-001810-10-05 | |
| Cell line | Primary Human Aortic Endothelial Cells | Cell Applications | 304-05a | 25–40-Year-old males. Multiple lots. Cell identity confirmed through diacetylated LDL and FACs. Company tested cells free of mycoplasma, bacteria, yeast, and fungi |
| Cell line | Primary Human Umbilical Vein Endothelial Cells | Lonza | CC-2519 | Pooled female donors. Multiple lots. Cell identity confirmed through diacetylated LDL and FACs. Company tested cells free of mycoplasma, bacteria, yeast, and fungi |
| Cell line | THP1 Human Monocytes | ATCC | Cat TIB-202 | STR Profiling and mycoplasma testing done by ATCC |
| Biological sample (human) | Human Coronary Arteries | Lifelink Georgia | Deidentified human hearts not suitable for cardiac transplantation donated to LifeLink of Georgia | |
| Antibody | KLK10 (Rabbit Polyclonal) | Bioss | Bioss Cat# bs-2531R, RRID:AB_10882440 | IF (1:100), WB (1:1000) |
| Antibody | CD31 (Rabbit Polyclonal) | Abcam | Abcam Cat# ab28364, RRID:AB_726362 | IF (1:100) |
| Antibody | VCAM1 (Rabbit Monoclonal) | Abcam | Abcam Cat# ab134047, RRID:AB_2721053 | IF (1:100)WB (1:1000) |
| Antibody | VE-Cadherin (Mouse monoclonal) | Santacruz | Santa Cruz Biotechnology Cat# sc-9989, RRID:AB_2077957 | IF (1:100) |
| Antibody | NFKB P65 (Rabbit Monoclonal) | Cell Signaling | Cell Signaling Technology Cat# 8242, RRID:AB_10859369 | IF (1:100) |
| Antibody | phospho-NFκB p65 S356 (Rabbit Monoclonal) | Cell Signaling | Cell Signaling Technology Cat# 3033, RRID:AB_331284 | WB (1:1000) |
| Antibody | Alexa Fluor Secondaries | Thermo Fisher | IF (1:500) | |
| Antibody | Ki67 (Rabbit Polyclonal) | Abcam | Abcam Cat# ab15580, RRID:AB_443209 | IF (1:100) |
| Commercial assay or kit | H&E Staining Kit | American Mastertech | KTHNEPT | |
| Commercial assay or kit | Human KLK10 ELISA | MyBioSource | Cat. #: MBS009286 | |
| Commercial assay or kit | Mouse Klk10 ELISA | NovateinBio | BG-MUS11429 | |
| Commercial assay or kit | TUNEL Staining Kit | Roche | 12156792910 | |
| Chemical compound | 2′,7′-bis(carboxyethyl)-5 (6)-carboxyfluorescein-AM | Thermo Fisher | B1150 | 1 mg/ml |
| Primers | Human KLK10 | For: GAGTGTGAGGTCTTCTACCCTGRev:ATGCCTTGGAGGGTCTCGTCAC | ||
| Primers | Mouse Klk10 | For:CGC TAC TGA TGG TGC AAC TCTRev:ATA GTC ACG CTC GCA CTG G | ||
| Primers | Human/Mouse 18s | For:AGGAATTGACGGAAGGGCACCARev:GTGCAGCCCCGGACATCTAAG | ||
| Primers | Human VCAM1 | For:GATTCTGTGCCCACAGTAAGGCRev:TGGTCACAGAGCCACCTTCTTG | ||
| Primers | Human ICAM1 | For:AGCGGCTGACGTGTGCAGTAATRev:TCTGAGACCTCTGGCTTCGTCA | ||
| Software, algorithm | Zen Blue | Zeiss | Confocal Microscopy | |
| Software, algorithm | ImageJ | NIH | Image Analysis | |
| Other | DAPI Mounting media | Vector Biolabs | H-1200-10 | Methods – immunostaining of mouse artery sections an en face preparation of the aortic arch |
| Other | Oligofectamine | Thermo Fisher | 12252011 | Methods – overexpression or knockdown experiments in vitro |
| Other | Lipofectamine | Thermo Fisher | L3000008 | Methods – overexpression or knockdown experiments in vitro |
Table 2
Quantitative real-time polymerase chain reaction (qPCR) primers.
| Primer (custom) | Sequence |
|---|---|
| h_KLK10 For | GAGTGTGAGGTCTTCTACCCTG |
| h_KLK10 Rev | ATGCCTTGGAGGGTCTCGTCAC |
| m_Klk10 For | CGC TAC TGA TGG TGC AAC TCT |
| m_Klk10 Rev | ATA GTC ACG CTC GCA CTG G |
| H/M 18S For | AGGAATTGACGGAAGGGCACCA |
| H/M 18S Rev | GTGCAGCCCCGGACATCTAAG |
| h_VCAM1 For | GATTCTGTGCCCACAGTAAGGC |
| h_VCAM1 Rev | TGGTCACAGAGCCACCTTCTTG |
| h_ICAM1 For | AGCGGCTGACGTGTGCAGTAAT |
| h_ICAM1 Rev | TCTGAGACCTCTGGCTTCGTCA |
Download links
A two-part list of links to download the article, or parts of the article, in various formats.
Downloads (link to download the article as PDF)
Open citations (links to open the citations from this article in various online reference manager services)
Cite this article (links to download the citations from this article in formats compatible with various reference manager tools)
Stable flow-induced expression of KLK10 inhibits endothelial inflammation and atherosclerosis
eLife 11:e72579.
https://doi.org/10.7554/eLife.72579


