Disruption of the TCA cycle reveals an ATF4-dependent integration of redox and amino acid metabolism
- MRC Cancer Unit, University of Cambridge, Hutchison MRC Research Centre, Cambridge Biomedical Campus, United Kingdom
- MRC Mitochondrial Biology Unit, University of Cambridge, Cambridge Biomedical Campus, United Kingdom
- Department of Medicine, University of Cambridge, Cambridge Biomedical Campus, United Kingdom
- Edinburgh Cancer Research UK Centre, Institute of Genetics and Cancer, United Kingdom
Figures
Figure 1 with 1 supplement
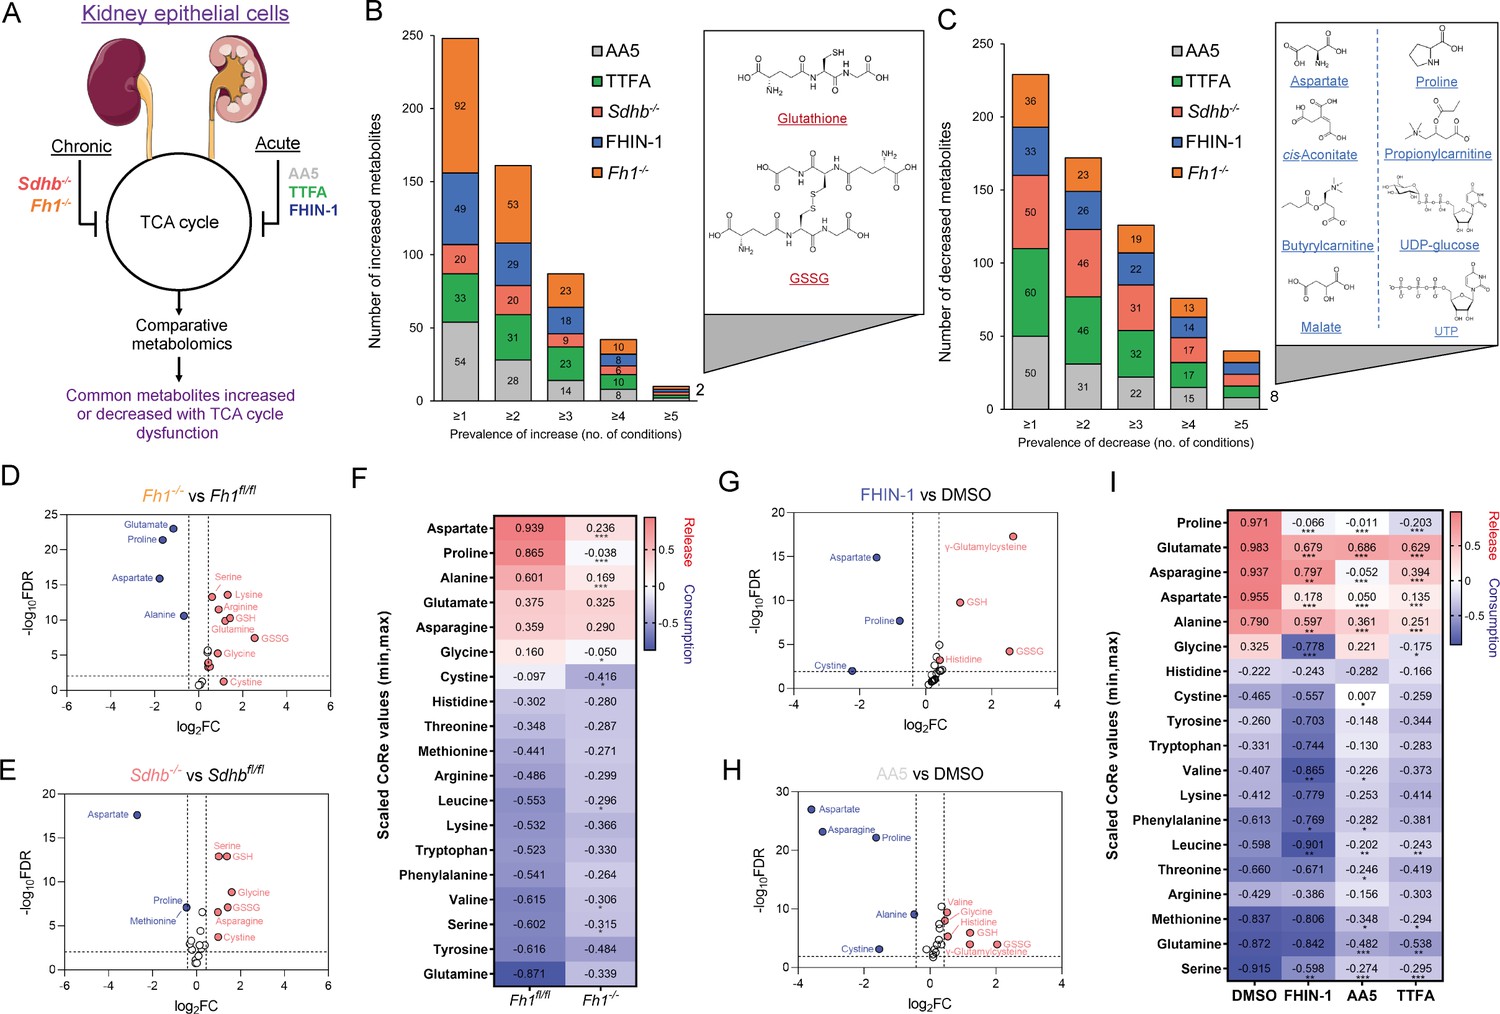
TCA cycle inhibition promotes cytosolic glutathione synthesis while impairing de novo proline and aspartate synthesis.
(A) Schematic diagram of comparative metabolomic approach to assess the metabolic response of kidney epithelial cells to TCAi. (B) Significantly increased metabolites (Cut-off = 25% change in abundance, false discovery rate (FDR) = 5%) with genetic or pharmacological TCAi. (C) Significantly decreased metabolites. (B–C) (24 hr timepoint). (D) Volcano plot of glutathione-related metabolites and amino acids in Fh1-/- versus Fh1fl/fl cells. (E) Volcano plot of glutathione-related metabolites and amino acids in Sdhb-/- versus Sdhbfl/fl cells. (F) Heatmap of mean scaled consumption-release (CoRe) intensity value of amino acids in Fh1-/- versus Fh1fl/fl cells. (B–F) (n = 5–10 independent biological replicates). (G) Volcano plot of glutathione-related metabolites and amino acids in FHIN-1 (20 μM)-treated Fh1fl/fl versus DMSO-vehicle control Fh1fl/fl cells. (H) Volcano plot of glutathione-related metabolites and amino acids in AA5 (1 μM)-treated Fh1fl/fl versus DMSO-treated Fh1fl/fl cells. (G–H) (24 hr timepoint) (n = 10–15 independent biological replicates). (I) Heatmap of mean scaled CoRe intensity value of amino acids in FHIN-1, AA5 and TTFA (500 μM) versus DMSO-treated Fh1fl/fl cells (24 hr timepoint) (n = 5 independent biological replicates). (D–I) p Value determined by multiple unpaired t-tests, corrected with two-stage step-up method of Benjamini, Krieger, and Yekutieli - FDR = 5%. p < 0.05*; p < 0.01**; p < 0.001***.
Figure 1—figure supplement 1
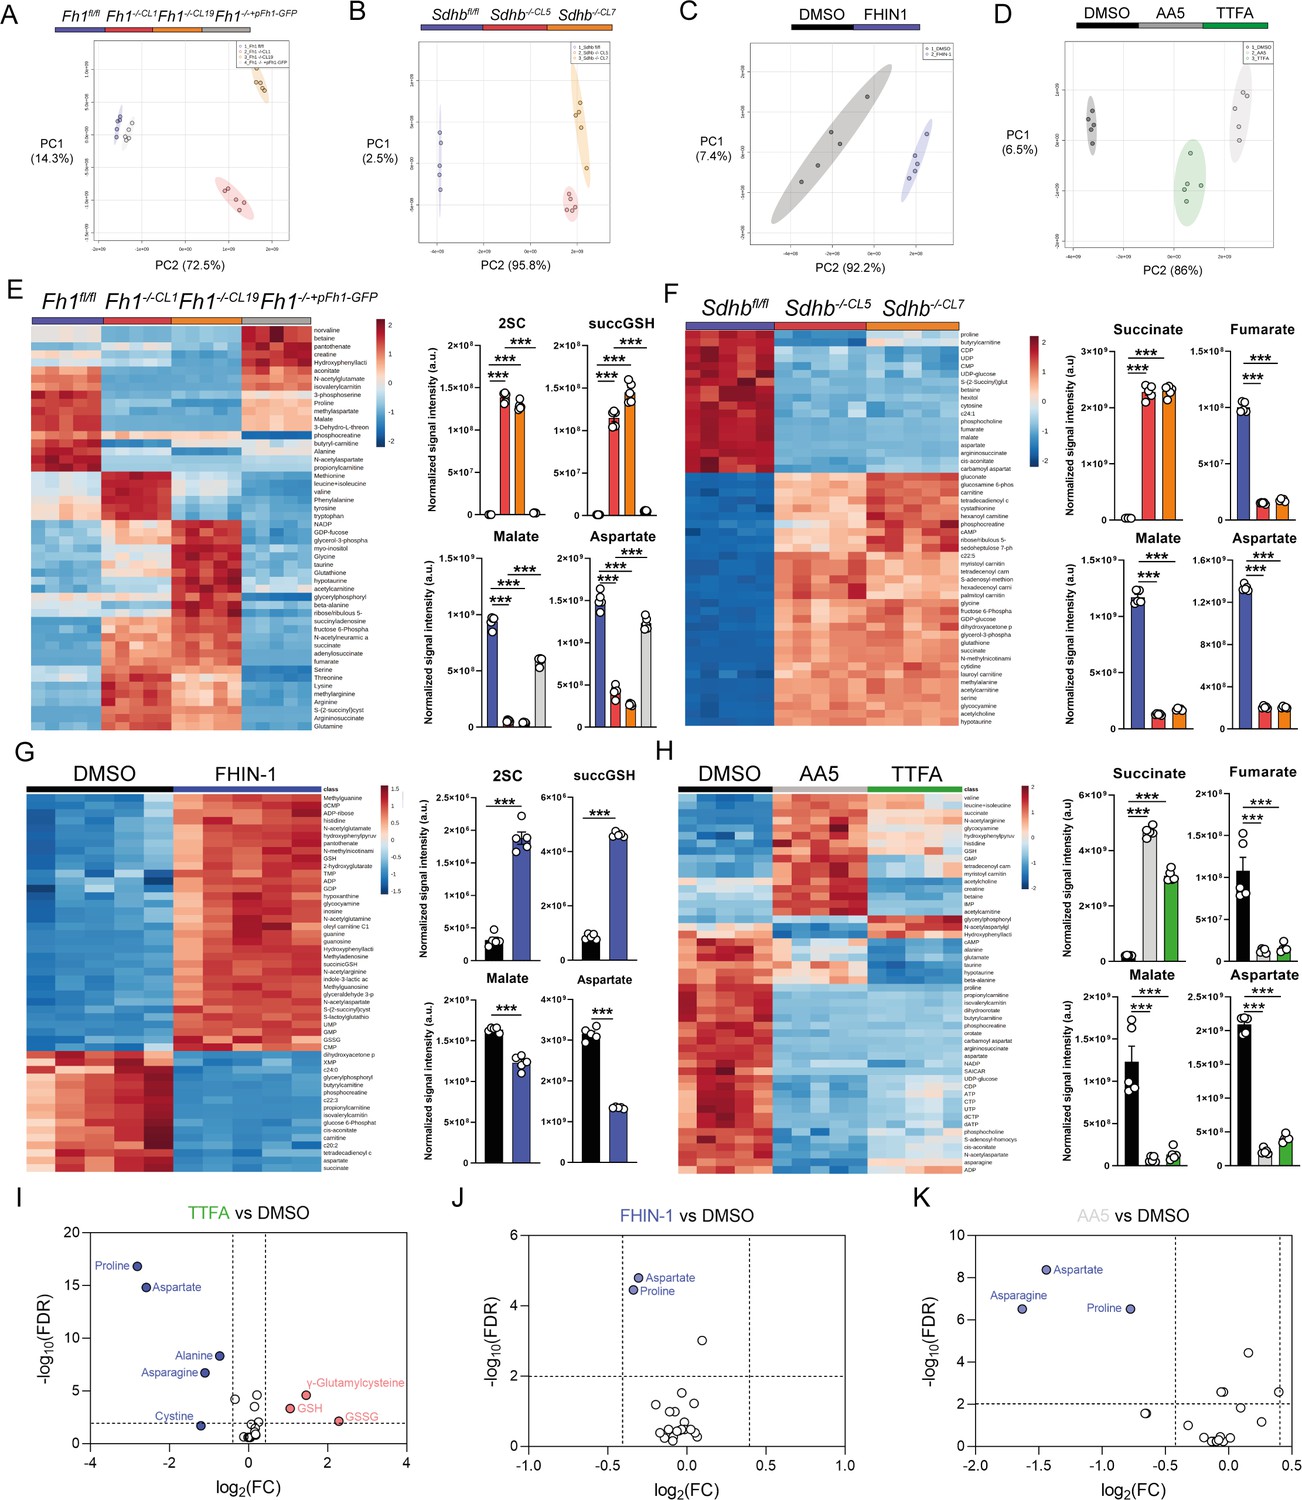
Metabolomic analysis of acute and chronic TCA cycle inhibition.
(A) PCA plot of metabolomics data of Fh1fl/fl, Fh1-/-CL1, Fh1-/-CL19 and Fh1-/-CL1+pFh1 cells (n = 5 independent biological replicates). (B) PCA plot of metabolomics data of Sdhbfl/fl, Sdhb-/-CL5 and Sdhb-/-CL7 cells (n = 5 independent biological replicates). (C) PCA plot of DMSO- and FHIN-1 (20 μM)-treated Fh1fl/fl cells (24 h timepoint) (n = 5 independent biological replicates). (D) PCA plot of DMSO-, AA5 (1 μM)- and TTFA (500 μM)-treated Fh1fl/fl cells (24 h timepoint) (n = 5 independent biological replicates). (E) Heatmap of top 50 significant metabolite changes in Fh1fl/fl, Fh1-/-CL1, Fh1-/-CL19 and Fh1-/-CL1+pFh1 cells (n = 5 independent biological replicates) and relative change in Fh1-deficient metabolic markers (S)–2-succinocysteine (2SC), succinicGSH, malate and aspartate (n = 5 independent biological replicates). (F) Heatmap of top 50 significant metabolite changes in Sdhbfl/fl, Sdhb-/-CL5, and Sdhb-/-CL7 cells (n = 5 independent biological replicates) and relative change in Sdh-deficient metabolic markers succinate, fumarate, malate, and aspartate (n = 5 independent biological replicates). (G) Heatmap of top 50 significant metabolite changes in DMSO- and FHIN-1 (20 μM)-treated Fh1fl/fl cells (24 hr timepoint) (n = 5 independent biological replicates) and relative change in Fh1-deficient metabolic markers 2SC, succinicGSH, malate and aspartate (n = 5 independent biological replicates). (H) Heatmap of top 50 significant metabolite changes in DMSO-, AA5 (1 μM)- and TTFA (500 μM)-treated Fh1fl/fl cells (24 hr timepoint) (n = 5 independent biological replicates) and relative change in Sdh-deficient metabolic markers succinate, fumarate, malate, and aspartate (n = 5 independent biological replicates). (E–H) Data are mean ± SEM. p value determined by ordinary one-way ANOVA, corrected for multiple comparisons using Tukey statistical hypothesis testing. p < 0.05*; p < 0.01**; p < 0.001***. (I) Volcano plot of log2 fold change in glutathione-related metabolites and amino acids in TTFA (500 μM)-treated Fh1fl/fl versus DMSO-vehicle control Fh1fl/fl cells (24 hr timepoint) (n = 10 independent biological replicates). (J) Volcano plot of log2 fold change in glutathione-related metabolites and amino acids in FHIN-1 (20 μM)-treated Fh1fl/fl versus DMSO-vehicle control Fh1fl/fl cells (1 hr timepoint) (n = 5 independent biological replicates). (K) Volcano plot of log2 fold change glutathione-related metabolites and amino acids in AA5 (1 μM)-treated Fh1fl/fl versus DMSO-treated Fh1fl/fl cells (1 hr timepoint) (n = 5 independent biological replicates). p value determined by multiple unpaired t-tests, corrected with two-stage step-up method of Benjamini, Krieger, and Yekutieli - FDR = 5%.
Figure 2 with 1 supplement
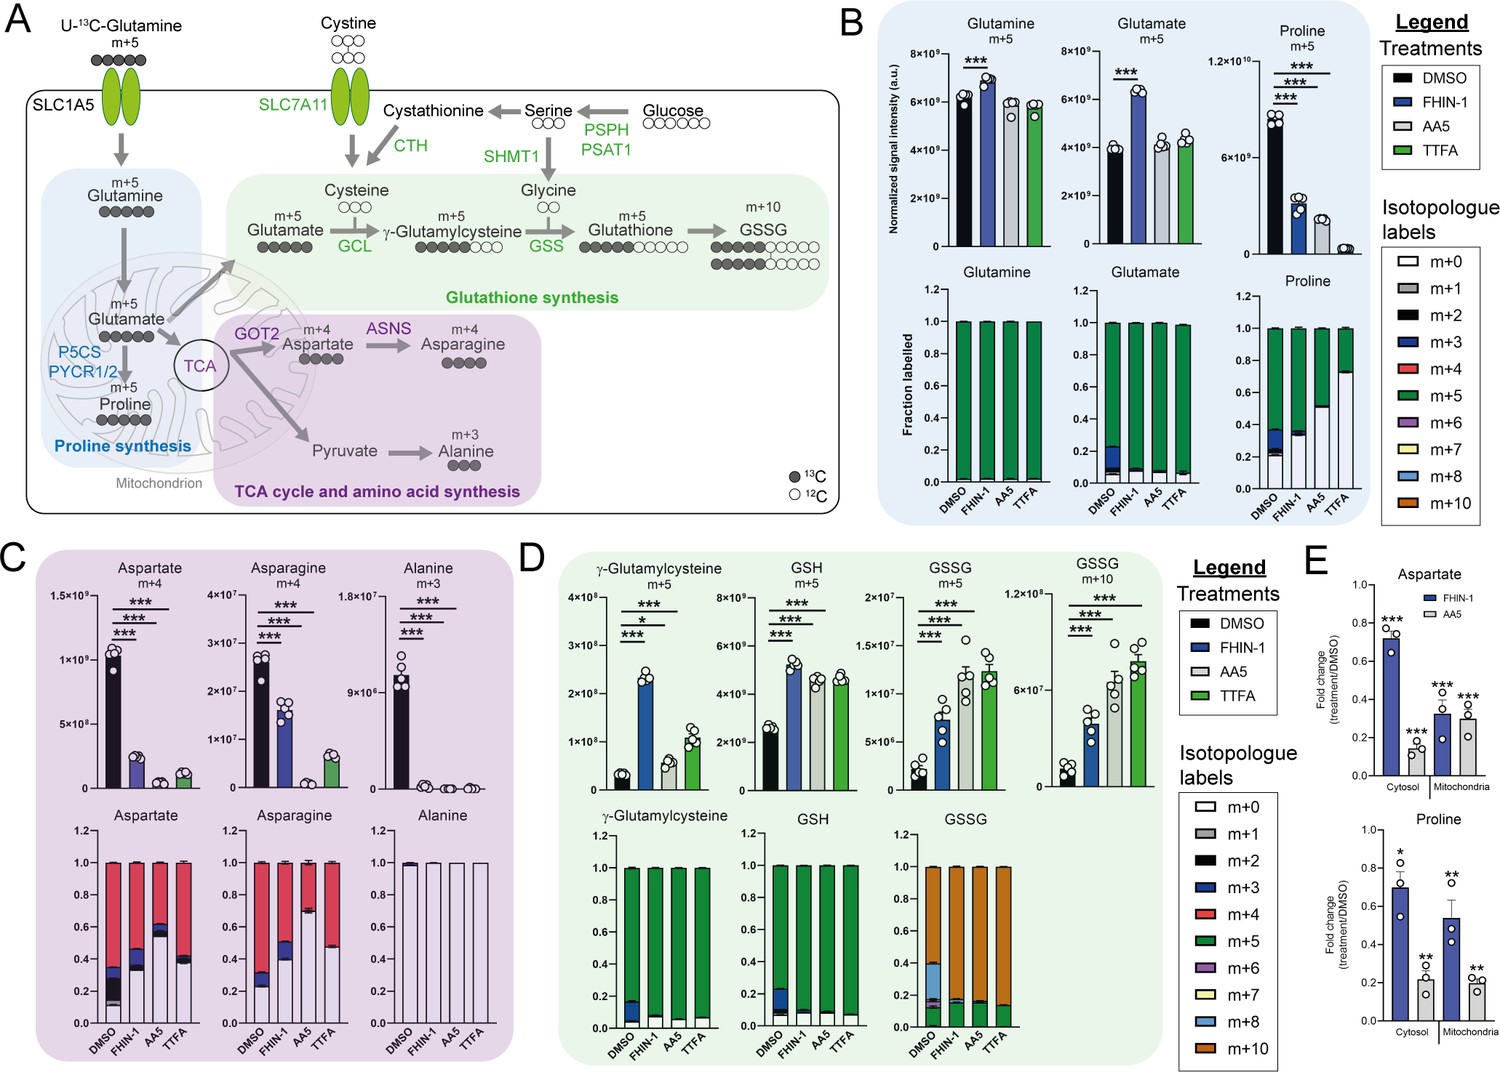
TCA cycle inhibition impairs glutamine-derived proline and aspartate synthesis but promotes cytosolic GSH synthesis.
(A) Schematic diagram highlighting U-13C-glutamine tracing into distinct metabolic modules. (B) U-13C-glutamine tracing into proline (m + 5 labeling intensity and total isotopologue fraction distribution). (C) U-13C-glutamine tracing into aspartate, asparagine and alanine (m + 4 and m + 3 labeling intensity and total isotopologue fraction distribution). (D) U-13C-glutamine tracing into glutathione synthesis pathway (m + 5 and m + 10 labeling intensity and total isotopologue fraction distribution) (B–D) show DMSO, FHIN-1 (20 μM)-, AA5 (1 μM)- and TTFA (500 μM)-treated Fh1fl/fl cells (24 h timepoint) (n = 5 independent biological replicates). Data are mean ± standard error of mean (SEM). p Value determined by ordinary one-way ANOVA, corrected for multiple comparisons using Tukey statistical hypothesis testing. (E) Proline and aspartate level fold change in mitochondrial and cytosol fractions in FHIN-1 and AA5-treated versus DMSO-treated Fh1fl/fl cells (24 h timepoint) (n = 3 independent biological replicates). Data are mean ± standard error of mean (SEM). p Values determined by unpaired two-tailed t-test. p < 0.05*; p < 0.01**; p < 0.001***.
Figure 2—figure supplement 1
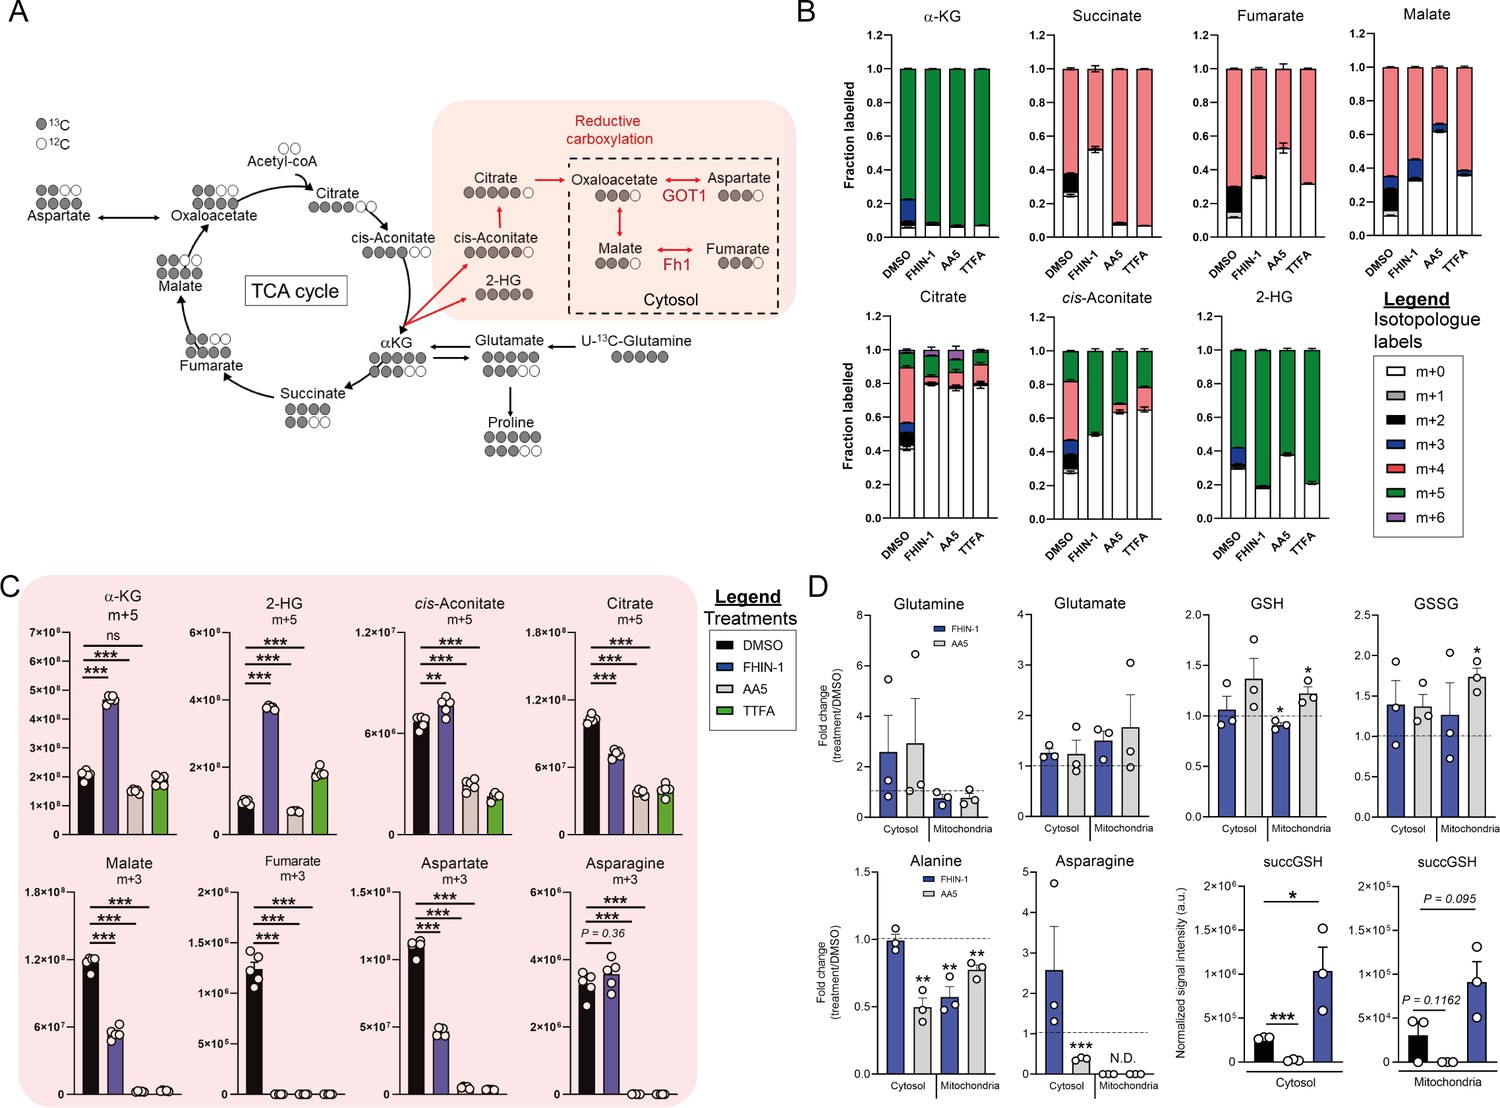
Glutamine fate tracing and compartment-specific metabolomics upon acute TCA cycle inhibition.
(A) Schematic diagram highlighting U-13C-glutamine tracing into the TCA cycle and reductive carboxylation. (B) U-13C-glutamine tracing into α-KG, succinate, fumarate, malate, citrate, cis-aconitate and 2-HG (total isotopologue fraction distribution) in DMSO, FHIN-1 (20 μM), AA5 (1 μM), and TTFA (500 μM)-treated Fh1fl/fl cells (24 hr timepoint) (n = 5 independent biological replicates). (C) U-13C-glutamine tracing into α-KG, succinate, fumarate, malate, citrate, cis-aconitate, and 2-HG (m + 5 and m + 3 labeling intensity) in DMSO, FHIN-1 (20 μM), AA5 (1 μM) and TTFA (500 μM)-treated Fh1fl/fl cells (24 hr timepoint) (n = 5 independent biological replicates). Data are mean ± SEM. p Value determined by ordinary one-way ANOVA, corrected for multiple comparisons using Tukey statistical hypothesis testing. p < 0.05*; p < 0.01**; p < 0.001***. (D) Glutamine, glutamate, GSH, GSSG, alanine, asparagine level fold changes and succGSH relative intensity in mitochondrial and cytosol fractions in FHIN-1 (20 μM)- and AA5(1 μM)-treated versus DMSO-treated Fh1fl/fl cells (24 hr timepoint) (n = 3 independent biological replicates). Data are mean ± SEM. p values determined by unpaired two-tailed t-test. p < 0.05*; p < 0.01**; p < 0.001***.
Figure 3 with 1 supplement
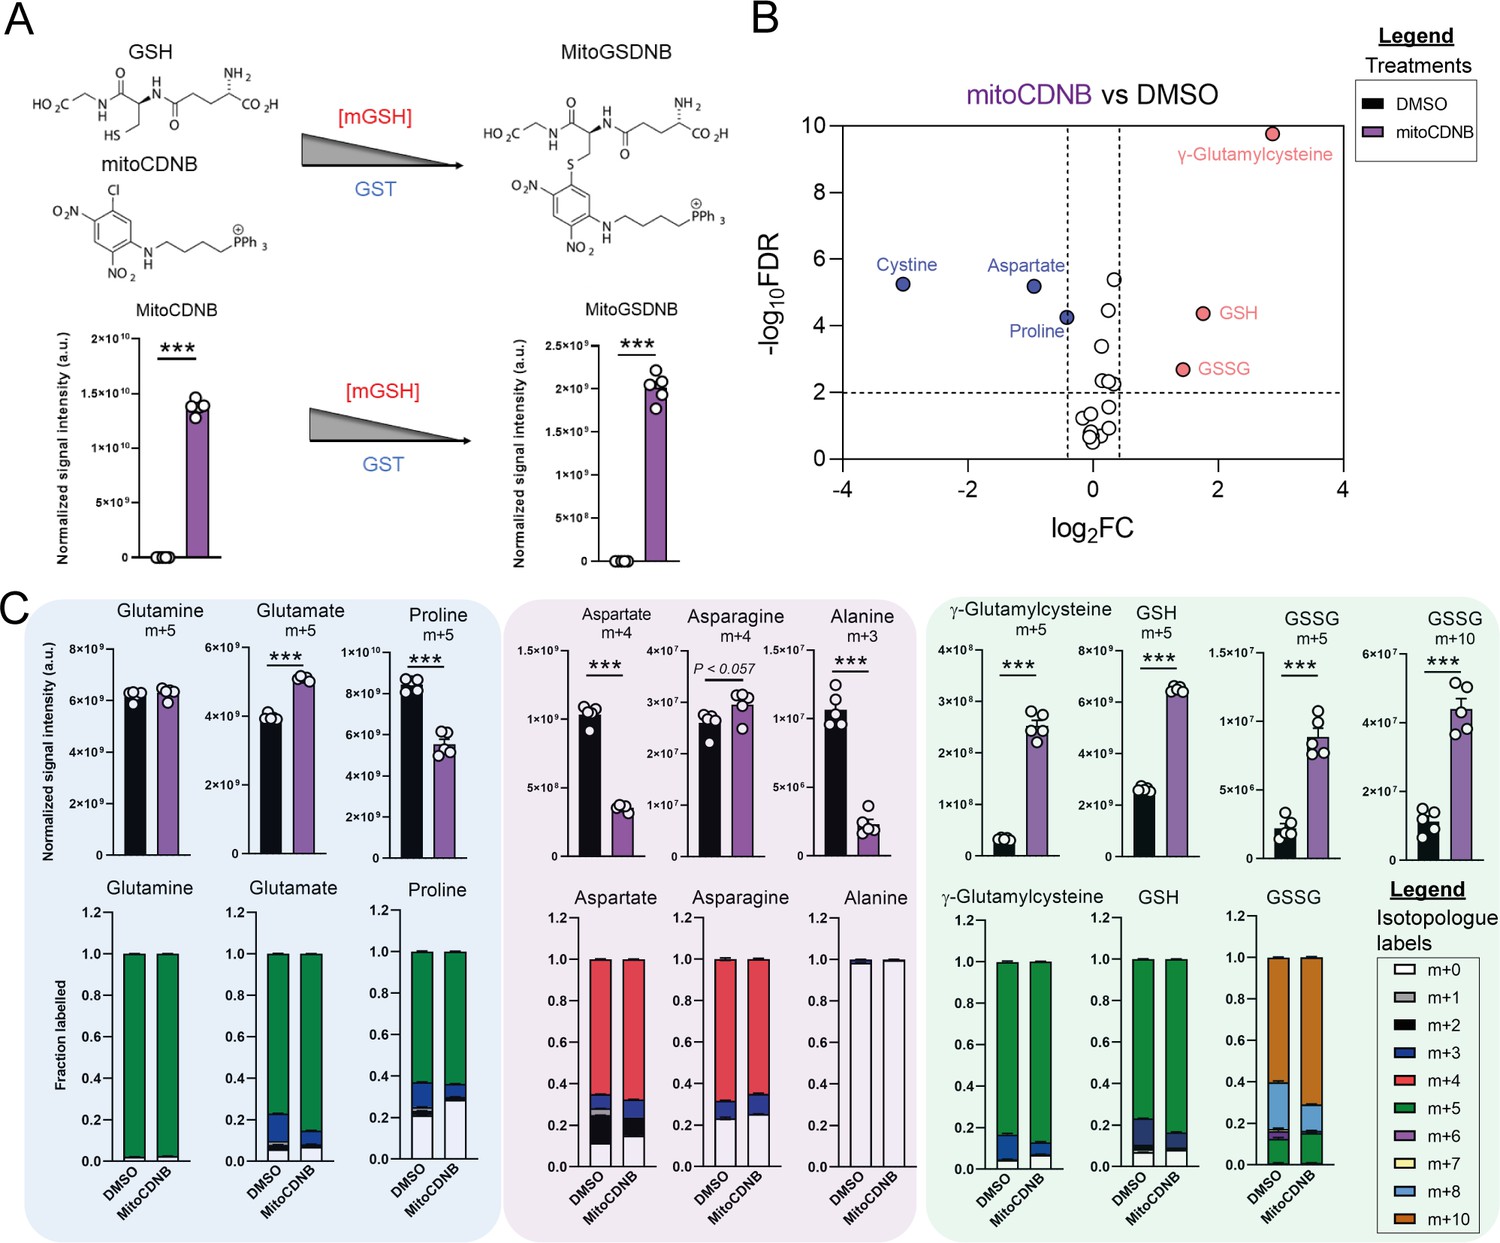
Disrupted mitochondrial thiol redox homeostasis phenocopies TCA cycle inhibition.
(A) Schematic diagram highlighting mito 1-Chloro-2,4-dinitrobenzene (mitoCDNB) reaction with glutathione and the formation of mito 1-S-glutathionyl-2,4-dinitrobenzene (MitoGSDNB) and intensity levels in DMSO-treated and mitoCDNB (10 μM)-treated Fh1fl/fl cells. (B) Volcano plot of glutathione-related metabolites and amino acids in mitoCDNB-treated Fh1fl/fl versus DMSO-treated Fh1fl/fl cells. p Value determined by multiple unpaired t-tests, corrected with two-stage step-up method of Benjamini, Krieger and Yekutieli - FDR = 5%. (C) U-13C-glutamine tracing (m + 10, m + 5, m + 4 and m + 3 labeling intensity and total isotopologue fraction distribution) in DMSO and mitoCDNB-treated Fh1fl/fl cells. (A–C) (24 hr timepoint) (n = 5–10 independent biological replicates). (A and C) Data are mean ± SEM. p Value determined by unpaired two tailed t-test or ordinary one-way ANOVA corrected for multiple comparisons using Tukey statistical hypothesis testing. p < 0.05*; p < 0.01**; p < 0.001***.
Figure 3—figure supplement 1

Glutamine fate tracing upon mitochondrial GSH depletion.
(A) Interleaved box and whiskers plot of fold change in GSH and GSSG with FHIN-1 (20 μM)-, AA5 (1 μM)- and TTFA (500 μM)-treated Fh1fl/fl cells versus DMSO-treated Fh1fl/fl cells (24 hr timepoint) (n = 5 independent biological replicates). p values determined by unpaired two-tailed t-test. p < 0.05*; p < 0.01**; p < 0.001***. (B) U-13C-glutamine tracing into α-KG, succinate, fumarate, malate, citrate, cis-aconitate, and 2-HG (total isotopologue fraction distribution) in DMSO and mitoCDNB (10 μM)-treated Fh1fl/fl cells (24 hr timepoint) (n = 5 independent biological replicates). (C) U-13C-glutamine tracing into α-KG, succinate, fumarate, malate, citrate, cis-aconitate, and 2-HG (m + 5 and m + 3 labeling intensity) in DMSO and mitoCDNB (10 μM)-treated Fh1fl/fl cells (24 hr timepoint) (n = 5 independent biological replicates). (D) ATP/ADP, lactate/pyruvate and NADH/NAD+ ratio in DMSO and mitoCDNB (10 μM)-treated Fh1fl/fl cells (24 hr timepoint) (n = 5 independent biological replicates). Data are mean ± SEM. p Values determined by unpaired two-tailed t-test. p < 0.05*; p < 0.01**; p < 0.001***.
Figure 4 with 1 supplement

Impaired mitochondrial respiration underlies defect in de novo proline synthesis.
(A) Scaled intensity values of glutathione-related metabolites in BSO (500 μM)-treated and DMSO-treated Fh1fl/fl cells (24 hr timepoint). (B) Volcano plot of amino acids in BSO-treated versus DMSO-treated Fh1fl/fl cells (24 hr timepoint). (C) Interleaved box and whiskers plot of amino acids with FHIN-1-treated or FHIN-1 and BSO co-treatment of Fh1fl/fl cells (24 hr timepoint). (D) Interleaved box and whiskers plot of amino acids with AA5-treated or AA5 and BSO co-treatment of Fh1fl/fl cells. (E) NADH/NAD+, NADPH/NADP+ and ATP/ADP ratio in DMSO, FHIN-1- and AA5-treated Fh1fl/fl cells ± BSO or ethylGSH co-treatment. (F) OCR assessed by Seahorse analyser in DMSO, FHIN-1-, AA5-, and TTFA-treated Fh1fl/fl cells (A–F) (n = 5 independent biological replicates). (E–F) Data are mean ± SEM. p Value determined by ordinary one-way ANOVA, corrected for multiple comparisons using Tukey statistical hypothesis testing. p < 0.05*; p < 0.01**; p < 0.001***. (G) NADH/NAD+, NADPH/NADP+, and ATP/ADP ratio in DMSO and Oligomycin (10 μM)-treated Fh1fl/fl cells (1 hr timepoint). Data are mean ± SEM. p Values determined by unpaired two-tailed t-test. p < 0.05*; p < 0.01**; p < 0.001***. (H) Volcano plot of glutathione-related metabolites and amino acids in Oligomycin-treated versus DMSO-treated Fh1fl/fl cells (1 h timepoint) (G–H) (n = 5 independent biological replicates). (I) Volcano plot of glutathione-related metabolites and amino acids in Antimycin A (2 μM)-treated versus DMSO-treated Fh1fl/fl cells (24 hr timepoint) (n = 5 independent biological replicates). (A-D; H–I) p Value determined by multiple unpaired t-tests, corrected with two-stage step-up method of Benjamini, Krieger, and Yekutieli - FDR = 5%.
Figure 4—figure supplement 1
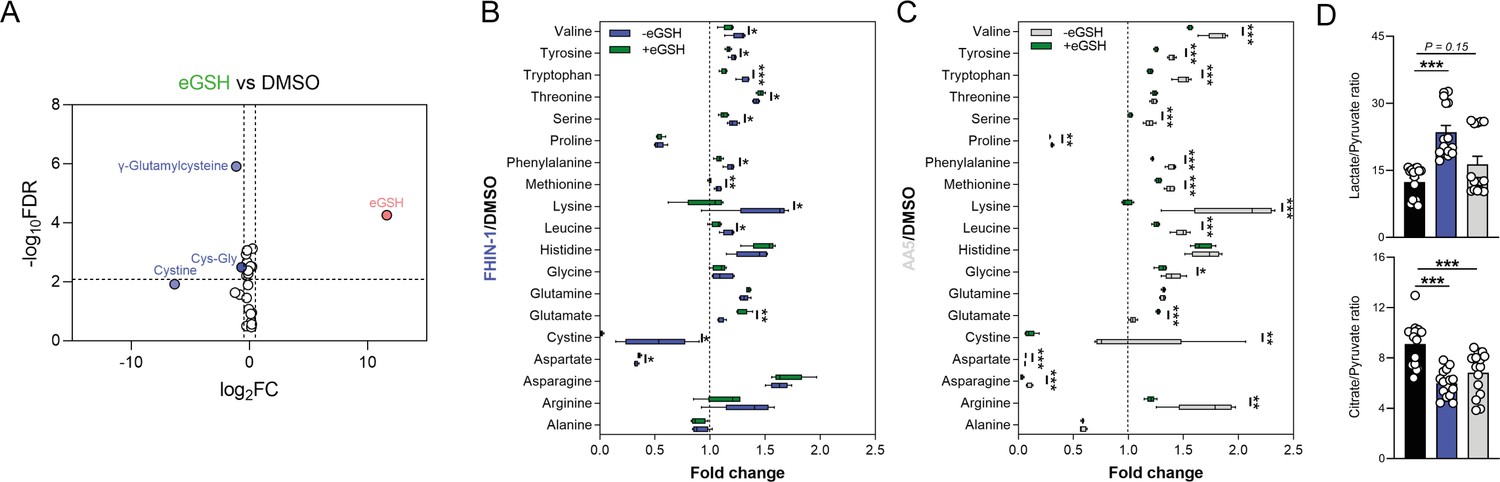
eGSH supplementation upon acute TCA cycle inhibition.
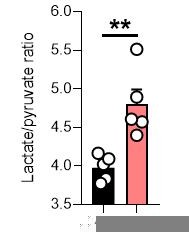
(A) Volcano plot of log2 fold change in glutathione-related metabolites and amino acids in eGSH (1 mM)-treated versus DMSO-treated Fh1fl/fl cells (24 hr timepoint) (n = 5 independent biological replicates). (B) Interleaved box and whiskers plot of fold change in amino acids with FHIN-1 (20 μM)-treated or FHIN-1 (20 μM) and eGSH (1 mM) co-treatment of Fh1fl/fl cells (24 hr timepoint) (n = 5 independent biological replicates). (C) Interleaved box and whiskers plot of fold change in amino acids with AA5 (1 μM)-treated or AA5 (1 μM) and eGSH (1 mM) co-treatment of Fh1fl/fl cells (24 hr timepoint) (n = 5 independent biological replicates). (A–C) p Value determined by multiple unpaired t-tests, corrected with two-stage step-up method of Benjamini, Krieger, and Yekutieli - FDR = 5%. p < 0.05*; p < 0.01**; p < 0.001***. (D) Lactate/pyruvate and citrate/pyruvate ratio in DMSO-, FHIN-1 (20 μM)- and AA5 (1 μM)-treated Fh1fl/fl cells (24 hr timepoint) (n = 15 independent biological replicates). Data are mean ± SEM. p Values determined by unpaired two-tailed t-test. p < 0.05*; p < 0.01**; p < 0.001***.
Figure 5 with 1 supplement
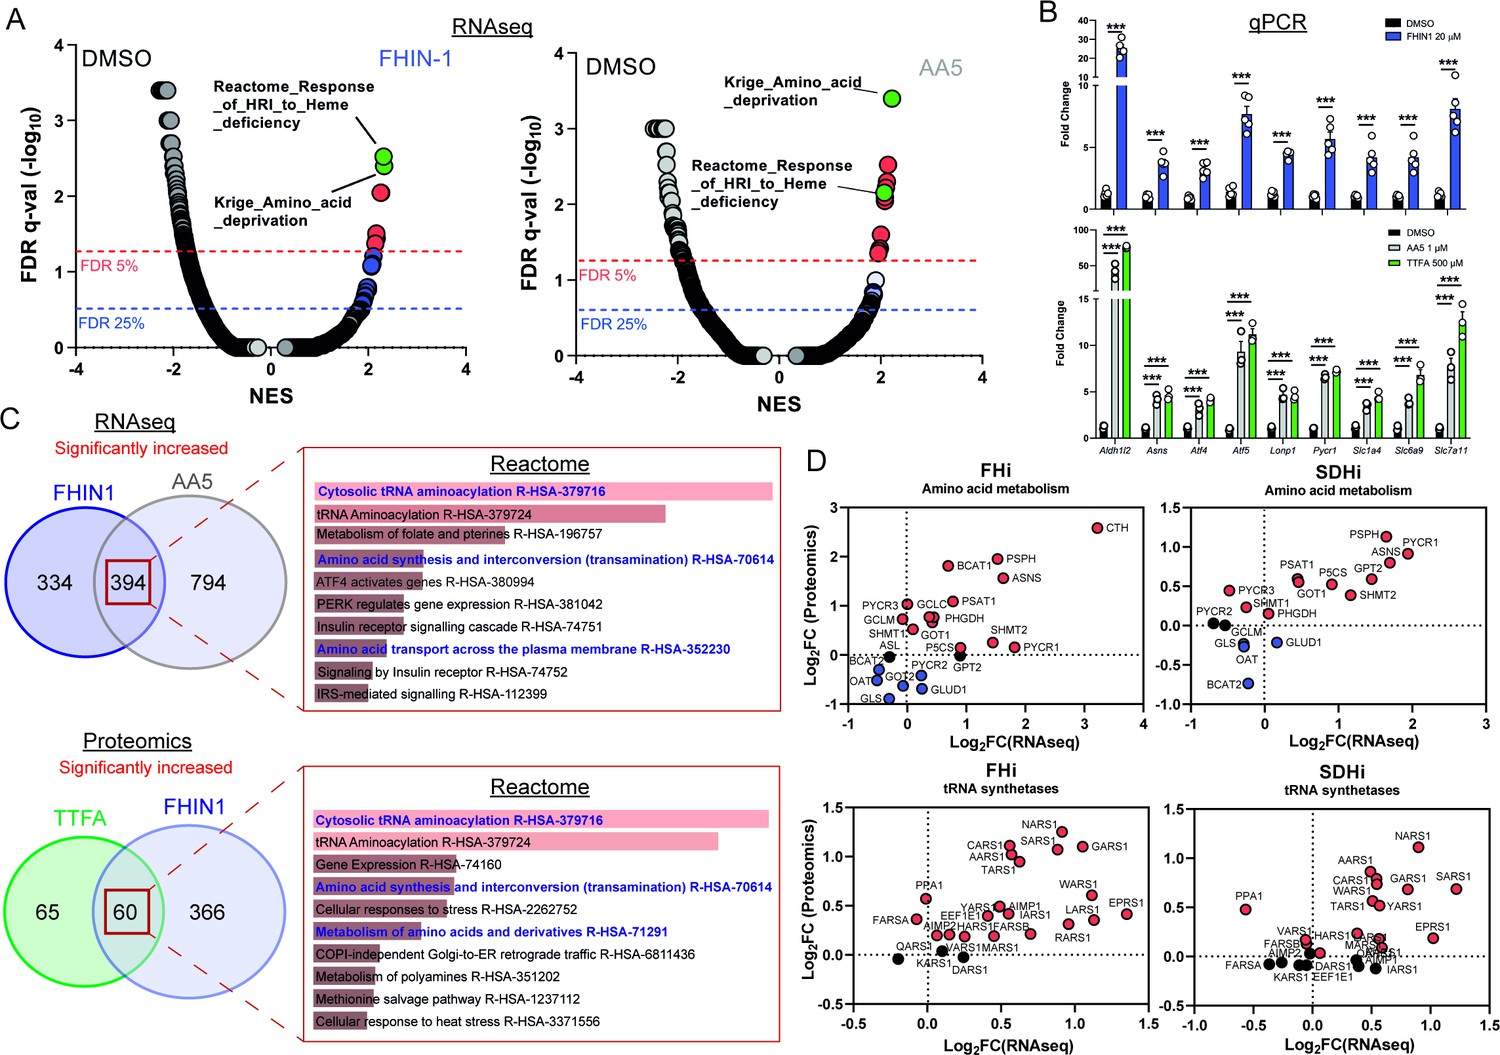
TCA cycle inhibition mimics an amino acid deprivation response and promotes compensatory reprogramming.
(A) GSEA of RNAseq data from FHIN-1- and AA5-treated versus DMSO-treated Fh1fl/fl cells. (B) Quantitative PCR results from FHIN-1-, AA5-, TTFA-, and DMSO-treated Fh1fl/fl cells (24 hr timepoint) (n = 3–5 independent biological replicates). Data are mean ± SEM. p Value determined by unpaired two-tailed t-test or ordinary one-way ANOVA, corrected for multiple comparisons using Tukey statistical hypothesis testing. p < 0.05*; p < 0.01**; p < 0.001***. (C) ORA of overlapping transcripts significantly increased in FHIN-1 and AA5-treated Fh1fl/fl cells and between overlapping proteins significantly increased in FHIN-1 and TTFA-treated Fh1fl/fl cells (24 h timepoint) (n = 3–5 independent biological replicates). Reactome pathways ranked by p value. (D) Comparison of amino acid metabolism and tRNA synthetase transcript and protein levels.
Figure 5—figure supplement 1
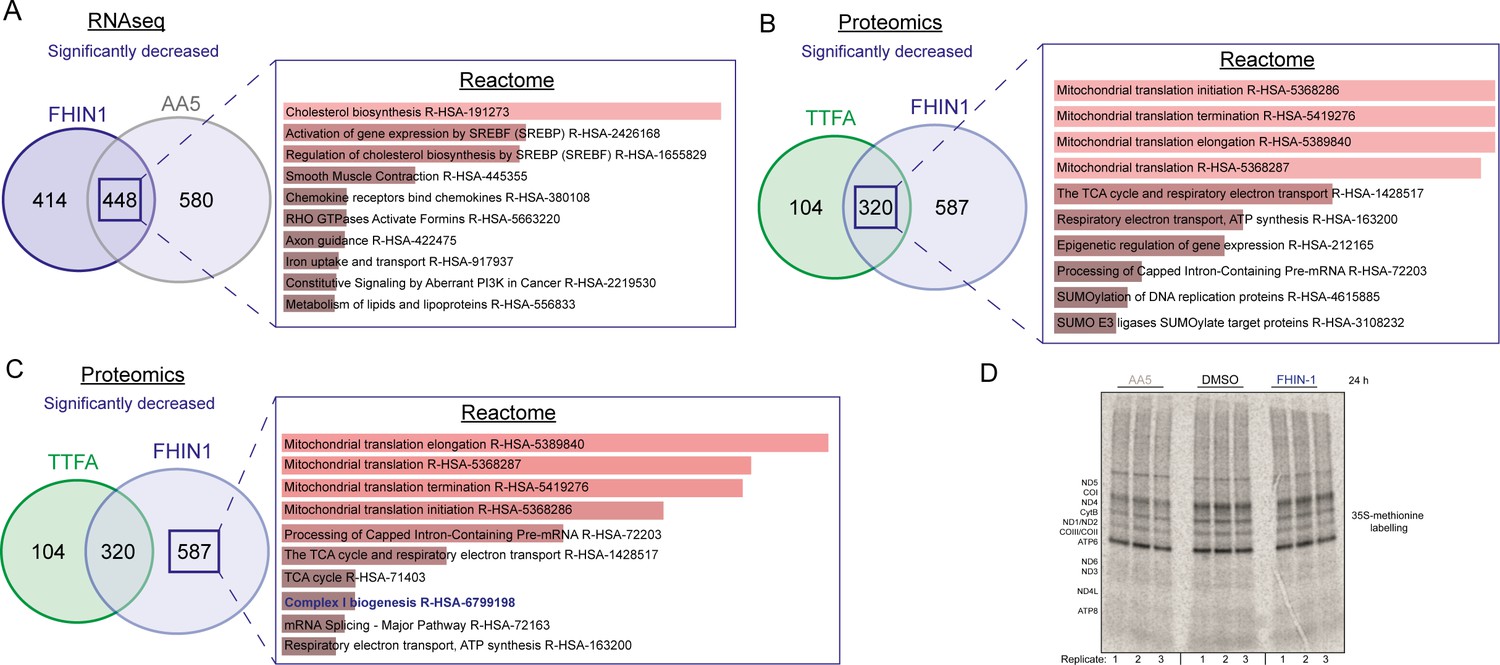
Over representation analysis of significantly decreased targets upon acute TCA cycle inhibition.
(A) ORA of overlapping transcripts significantly decreased in FHIN-1 (20 μM)- and AA5 (1 μM)-treated Fh1fl/fl cells (24 h timepoint) (24 h timepoint) (n = 3 independent biological replicates). (B) ORA of overlapping proteins significantly decreased in FHIN-1 and TTFA-treated Fh1fl/fl cells (24 h timepoint) (n = 5 independent biological replicates). (C) ORA of proteins significantly decreased uniquely in FHIN-1-treated Fh1fl/fl cells (24 h timepoint) (n = 5 independent biological replicates).(A–C) Reactome pathways ranked by combined score (p value and Z score). (D) 35S-methionine labeling of mitochondrial translation in DMSO-, FHIN-1 (20 μM)-, and AA5 (1 μM)-treated Fh1fl/fl cells (24 hr timepoint) (n = 3 independent biological replicates).
Figure 6 with 1 supplement
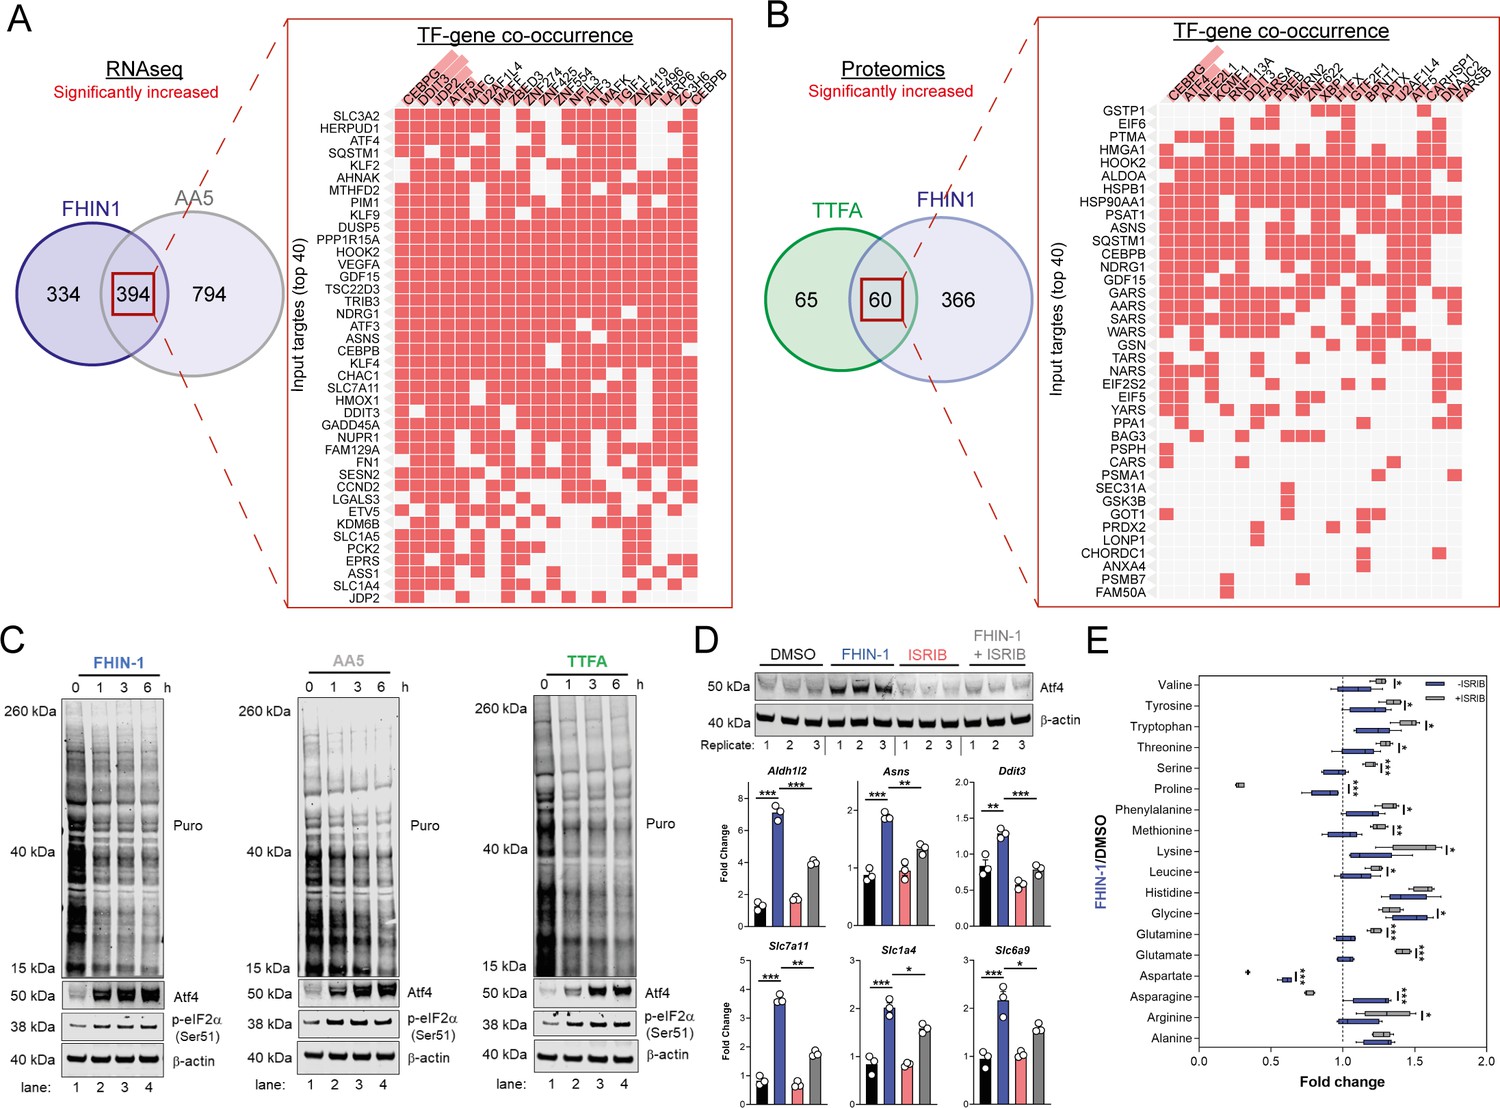
TCA inhibition activates the integrated stress response to counter amino acid and redox stress.
(A) Clustergram showing Transcription-factor (TF)-gene co-occurrence ORA of overlapping transcripts significantly increased in FHIN-1 and AA5-treated Fh1fl/fl cells. (B) Clustergram showing TF-gene co-occurrence ORA of overlapping transcripts significantly increased in FHIN-1 and TTFA-treated Fh1fl/fl cells. (A–B) (24 hr timepoint) (n = 3–5 independent biological replicates). TFs are ranked by combined score (p value and Z score). (C) Western blot analysis of puromycin incorporation, Atf4, phopho-eIF2α and β-actin as loading control in FHIN-1, AA5 and TTFA timecourse treatment of Fh1fl/fl cells (representative image of three independent biological replicates). (D) Western blot analysis of Atf4 and β-actin as loading control (6 hr timepoint) and qPCR analysis of Atf4-target genes (24 hr timepoint) (n = 3 independent biological replicates) in DMSO-, ISRIB (500 nM)-, FHIN-1 (10 μM), and FHIN-1+ ISRIB treated Fh1fl/fl cells. Data are mean ± SEM. p value determined by ordinary one-way ANOVA, corrected for multiple comparisons using Tukey statistical hypothesis testing. (E) Interleaved box and whiskers plot of amino acids with FHIN-1-treated or FHIN-1- and ISRIB- co-treated Fh1fl/fl cells (24 hr timepoint) (n = 5 independent biological replicates). p Value determined by multiple unpaired t-tests, corrected with two-stage step-up method of Benjamini, Krieger, and Yekutieli - FDR = 5%. p < 0.05*; p < 0.01**; p < 0.001***.
Figure 6—figure supplement 1
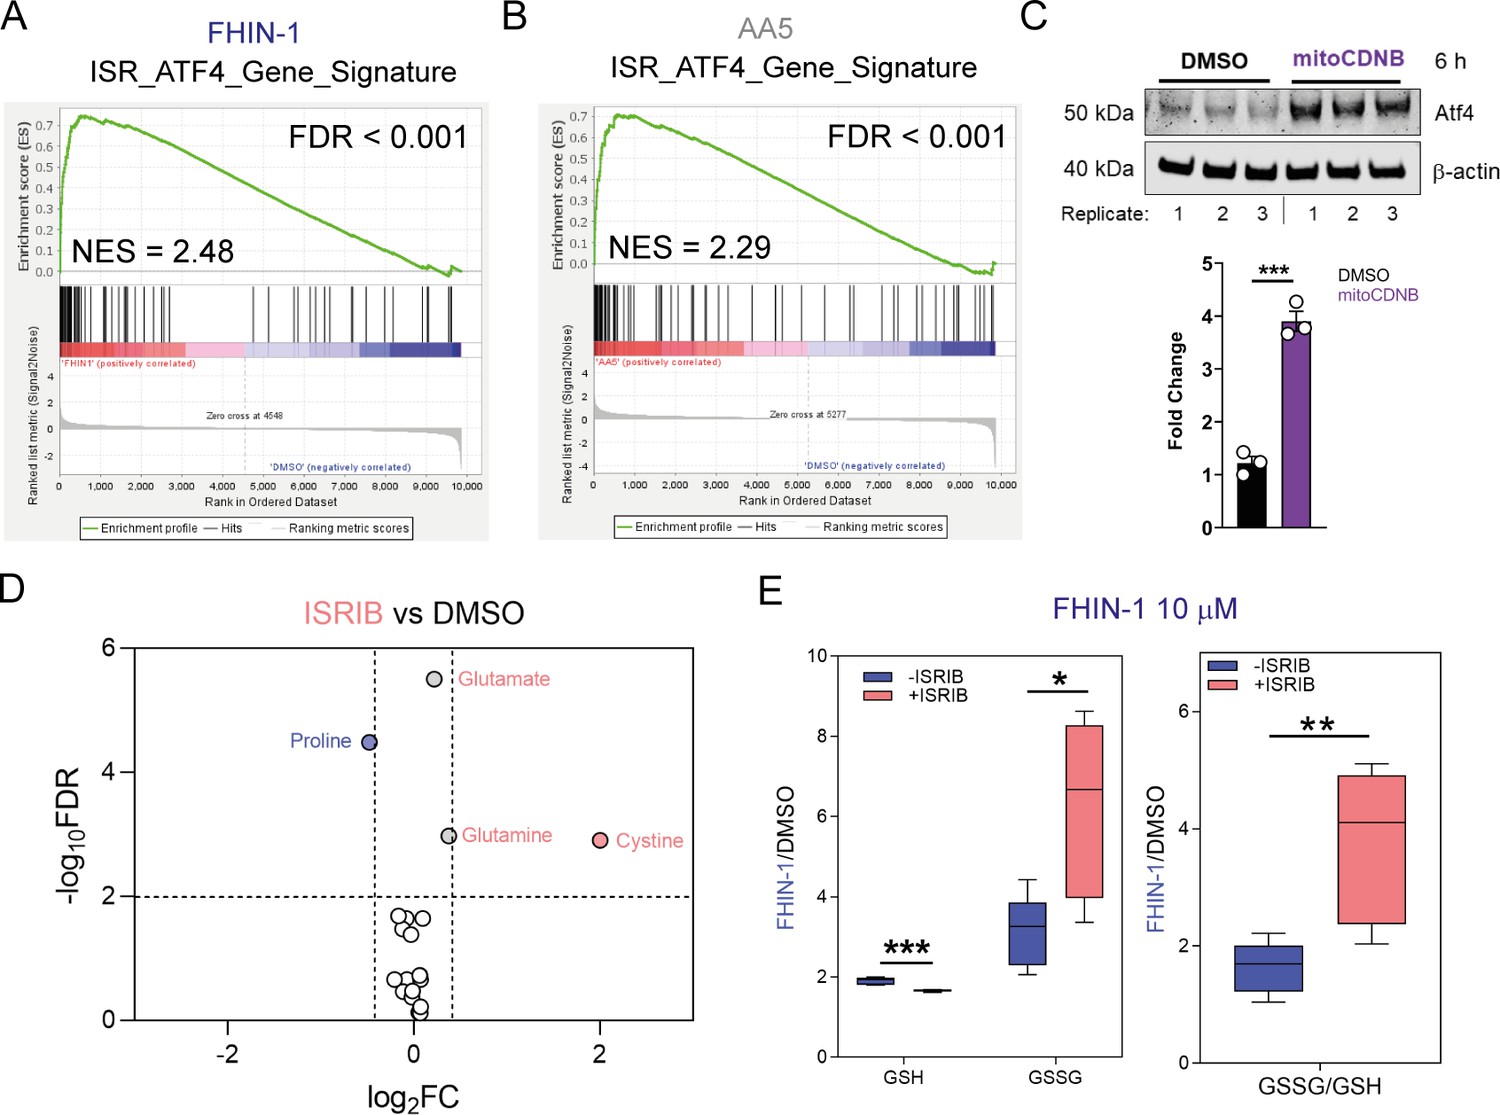
Atf4 activation upon acute TCA cycle inhibition and mitochondrial GSH depletion.
(A) GSEA of Atf4 gene signature queried with molecular signature database (MsigDB) hallmarks geneset on RNA sequencing data from FHIN-1 (20 μM)- versus DMSO-treated Fh1fl/fl cells (24 hr timepoint) (n = 3 independent biological replicates). (B) GSEA of Atf4 gene signature queried with MsigDB hallmarks geneset on RNA sequencing data from AA5 (1 μM)- versus DMSO-treated Fh1fl/fl cells (24 hr timepoint) (n = 3 independent biological replicates). (C) Western blot analysis and quantification of Atf4 and β-actin as loading control in DMSO and mitoCDNB (10 μM)-treated Fh1fl/fl cells (6 hr timepoint) (n = 3 independent biological replicates). Data are mean ± SEM. p Values determined by unpaired two-tailed t-test. p < 0.05*; p < 0.01**; p < 0.001***. (D) Volcano plot of log2 fold change in glutathione-related metabolites and amino acids in ISRIB (500 nM)-treated versus DMSO-treated Fh1fl/fl cells (24 hr timepoint) (n = 5 independent biological replicates). (E) Interleaved box and whiskers plot of fold change in GSH and GSSG in FHIN-1 (10 μM)-treated or FHIN-1 and ISRIB co-treated Fh1fl/fl cells and the ratio of the fold change (24 hr timepoint) (n = 5 independent biological replicates). p Values determined by unpaired two-tailed t-test. p < 0.05*; p < 0.01**; p < 0.001***.
Figure 7 with 1 supplement
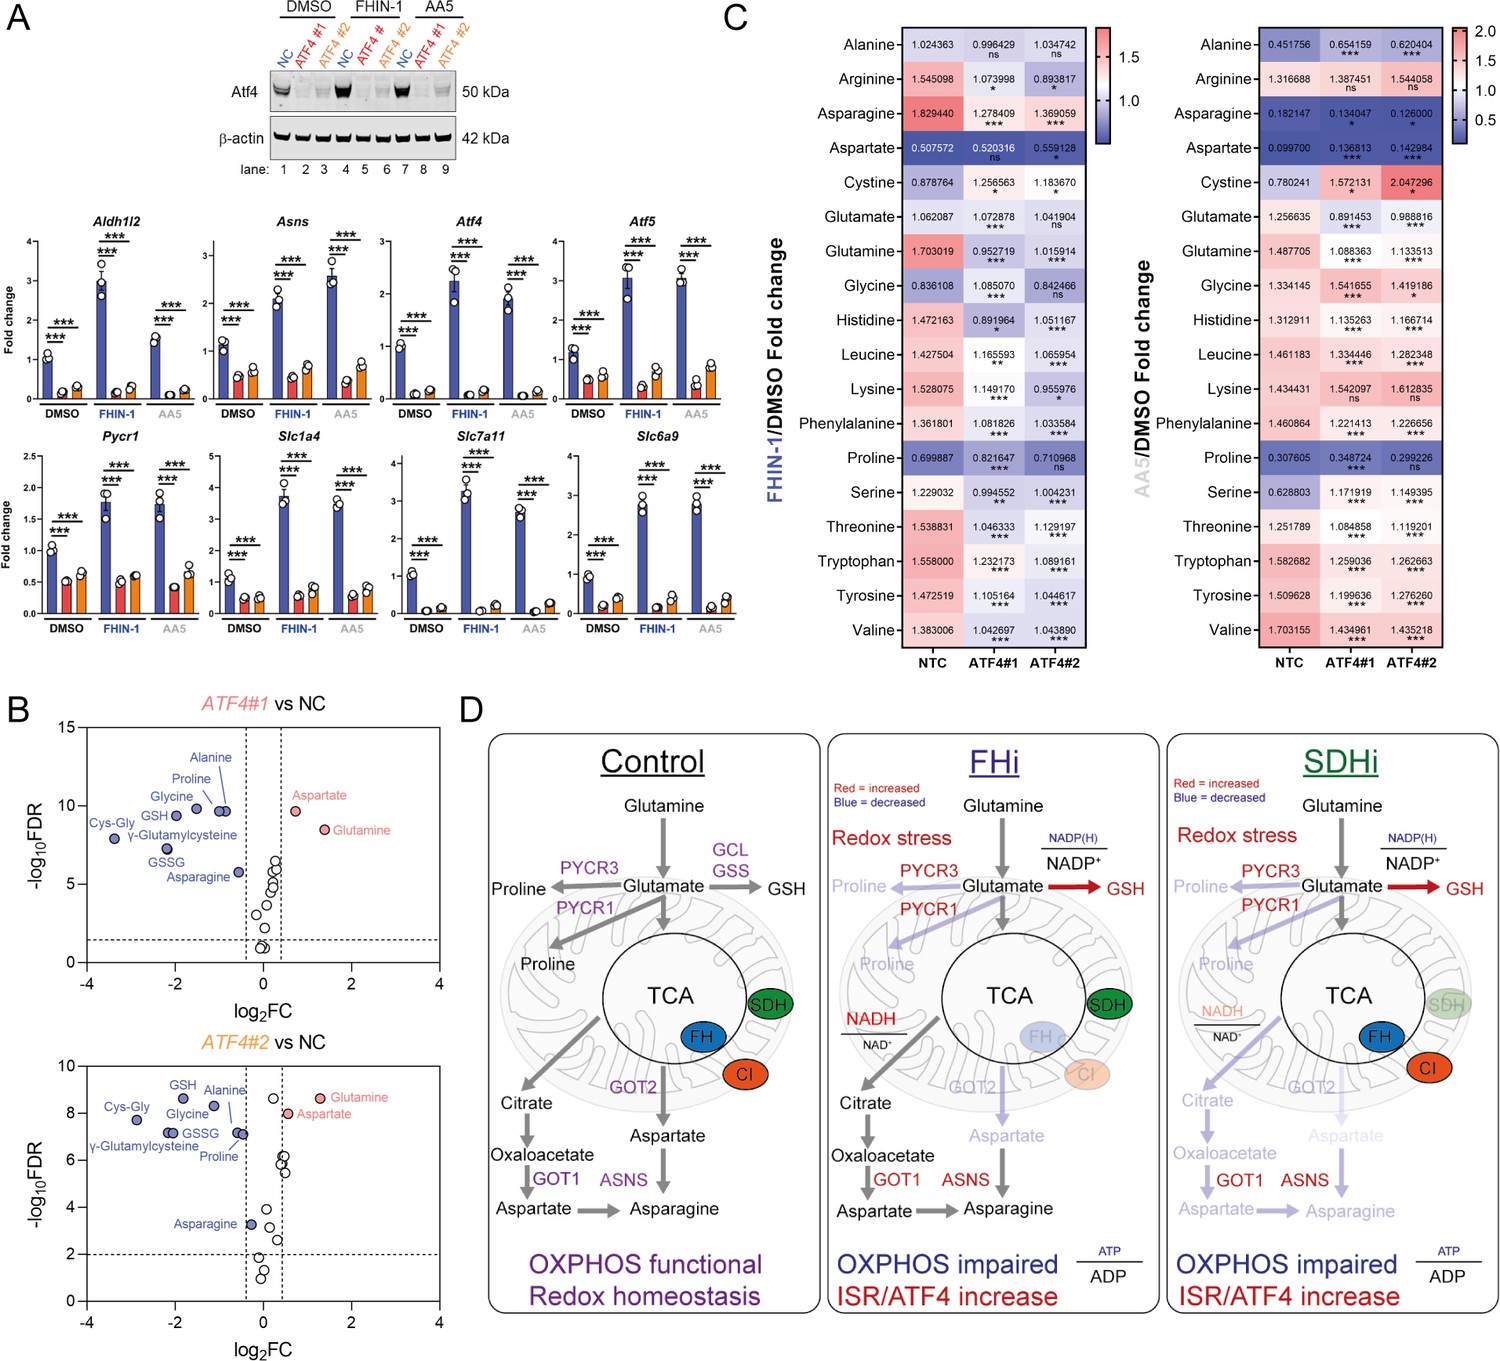
Atf4 regulates amino acid and GSH metabolism.
(A) Western blot analysis of Atf4 and β-actin as loading control (24 hr timepoint) (representative image of 3 independent biological replicates) and qPCR analysis of Atf4-target genes (24 hr timepoint) (n = 3 independent biological replicates) in DMSO-, FHIN-1- and AA5-treated Fh1fl/fl cells with or without siRNA-mediated silencing of Atf4. Data are mean ± SEM. p value determined by ordinary one-way ANOVA, corrected for multiple comparisons using Tukey statistical hypothesis testing. p < 0.05*; p < 0.01**; p < 0.001***. (B) Volcano plot of glutathione-related metabolites and amino acids in Atf4-silenced Fh1fl/fl cells versus non-targeting control (NC)- Fh1fl/fl cells (48 hr timepoint). (C) Heatmap of amino acid levels in FHIN-1- and AA5- versus DMSO-treated Fh1fl/fl cells with or without siRNA-mediated silencing of Atf4 (24 hr timepoint). (B–C) (n = 5 independent biological replicates). (D) Schematic diagram highlighting key findings of the comparative analysis between acute FHi versus SDHi.
Figure 7—figure supplement 1

Changes in glutathione metabolism intermediates upon Atf4 silencing and acute TCA cycle inhibition.
(A) Interleaved box and whiskers plot of fold change in glutathione-related metabolites in DMSO- versus FHIN-1 (20 μM)-treated Fh1fl/fl cells with or without siRNA-mediated silencing of Atf4 (24 hr timepoint) (n = 5 independent biological replicates). (B) Interleaved box and whiskers plot of fold change in glutathione-related metabolites in DMSO- versus AA5 (1 μM)-treated Fh1fl/fl cells with or without siRNA-mediated silencing of Atf4 (24 hr timepoint) (n = 5 independent biological replicates). (A–B) p value determined by multiple unpaired t-tests, corrected with two-stage step-up method of Benjamini, Krieger and Yekutieli - FDR = 5%. p < 0.05*; p < 0.01**; p < 0.001***.
Author response image 1
Tables
Key resources table
| Reagent type (species) or resource | Designation | Source or reference | Identifiers | Additional information |
| Cell line (Mus musculus) | Fh1fl/fl | Frezza et al., 2011 | Fh1fl/fl | Kidney epithelial cell line |
| Cell line (Mus musculus) | Fh1-/-CL1 | Frezza et al., 2011 | Fh1-/-CL1 | Kidney epithelial cell line |
| Cell line (Mus musculus) | Fh1-/-CL19 | Frezza et al., 2011 | Fh1-/-CL19 | Kidney epithelial cell line |
| Cell line (Mus musculus) | Sdhbfl/fl | Cardaci et al., 2015 | Sdhbfl/fl | Kidney epithelial cell line |
| Cell line (Mus musculus) | Sdhb-/-CL5 | Cardaci et al., 2015 | Sdhb-/-CL5 | Kidney epithelial cell line |
| Cell line (Mus musculus) | Sdhb-/-CL7 | Cardaci et al., 2015 | Sdhb-/-CL7 | Kidney epithelial cell line |
| Chemical compound, drug | Dimethyl sulfoxide (DMSO) | Sigma Aldrich | D8418 | |
| Chemical compound, drug | Fumarate hydratase inhibitor 1 (FHIN-1) | MedChemExpress | Cat. No.: HY-100004 | |
| Chemical compound, drug | Atpenin A5 (AA5) | Abcam | CAS Number: 119509-24-9 | |
| Chemical compound, drug | Thenoyltrifluoroacetone (TTFA) | Sigma Aldrich | T27006 | |
| Chemical compound, drug | L-Buthionine-sulfoximine (BSO) | Sigma Aldrich | B2515 | |
| Chemical compound, drug | ethylGSH (eGSH) | Sigma Aldrich | G1404 | |
| Chemical compound, drug | Oligomycin A | Sigma Aldrich | 75,351 | |
| Chemical compound, drug | Puromycin dihydrochloride | Sigma Aldrich | P9620 | |
| Chemical compound, drug | Antimycin A | Sigma Aldrich | A8674 | |
| Chemical compound, drug | Carbonyl cyanide-p-trifluoromethoxyphenylhydrazone (FCCP) | Sigma Aldrich | C2920 | |
| Chemical compound, drug | Rotenone | Sigma Aldrich | R8875 | |
| Chemical compound, drug | Integrated stress response inhibitor (ISRIB) | Sigma Aldrich | SML0843 | |
| Chemical compound, drug | Glucose | Sigma Aldrich | G8270 | |
| Chemical compound, drug | Glutamine | Sigma Aldrich | G7513 | |
| Chemical compound, drug | Pyruvate | Sigma Aldrich | P2256 | |
| Chemical compound, drug | U-13C-Glutamine | Cambridge Isotopes | CLM-1822-H-PK | |
| Chemical compound, drug | 35S-methionine | PerkinElmer | NEG009L005MC | |
| Chemical compound, drug | mitoCDNB | Booty et al., 2019 | SML2573* | *Available on Sigma |
| Antibody | puromycin antibody clone 12D10 “(mouse monoclonal)” | Sigma Aldrich | MABE343 | “(1:10,000)” |
| Antibody | anti-Atf4 (D4B8) “(rabbit monoclonal)” | Cell Signalling Technology | Rabbit mAb #11,815 | “(1:800)” |
| Antibody | anti-p-eIF2α (Ser51) (D9G8) “(rabbit monoclonal)” | Cell Signalling Technology | XP Rabbit mAb #3,398 | “(1:1000)” |
| Antibody | anti-β-Actin (13E5) “(rabbit monoclonal)” | Cell Signalling Technology | Rabbit mAb #4,970 | “(1:1000)” |
| Chemical compound, drug | U-13C-Glutamine | Cambridge Isotopes | CLM-1822-H-PK | |
| Chemical compound, drug | 35S-methionine | PerkinElmer | NEG009L005MC | |
| Transfected construct (Mus musculus) | Silencer select Non-targeting control (NTC) siRNA | Thermo Scientific | Catalog # 4390843 | |
| Transfected construct (Mus musculus) | Silencer select Atf4 siRNA #1 | Thermo Scientific | Catalog # 4390771 Assay ID s62691 | |
| Transfected construct (Mus musculus) | Silencer selectAtf4 siRNA #2 | Thermo Scientific | Catalog # 4390771 Assay ID s62690 | |
| Transfected construct (Mus musculus) | Lipofectamine RNAiMAX | Thermo Scientific | Catalog # 13778075 |
Additional files
Download links
A two-part list of links to download the article, or parts of the article, in various formats.
Downloads (link to download the article as PDF)
Open citations (links to open the citations from this article in various online reference manager services)
Cite this article (links to download the citations from this article in formats compatible with various reference manager tools)
Disruption of the TCA cycle reveals an ATF4-dependent integration of redox and amino acid metabolism
eLife 10:e72593.
https://doi.org/10.7554/eLife.72593


