PRC1 sustains the integrity of neural fate in the absence of PRC2 function
- Neuroscience Institute, Department of Neuroscience and Physiology, NYU School of Medicine, United States
- Department of Biology, New York University, United States
- Applied Bioinformatics Laboratories, Office of Science and Research, NYU School of Medcine, United States
Figures
Figure 1 with 2 supplements
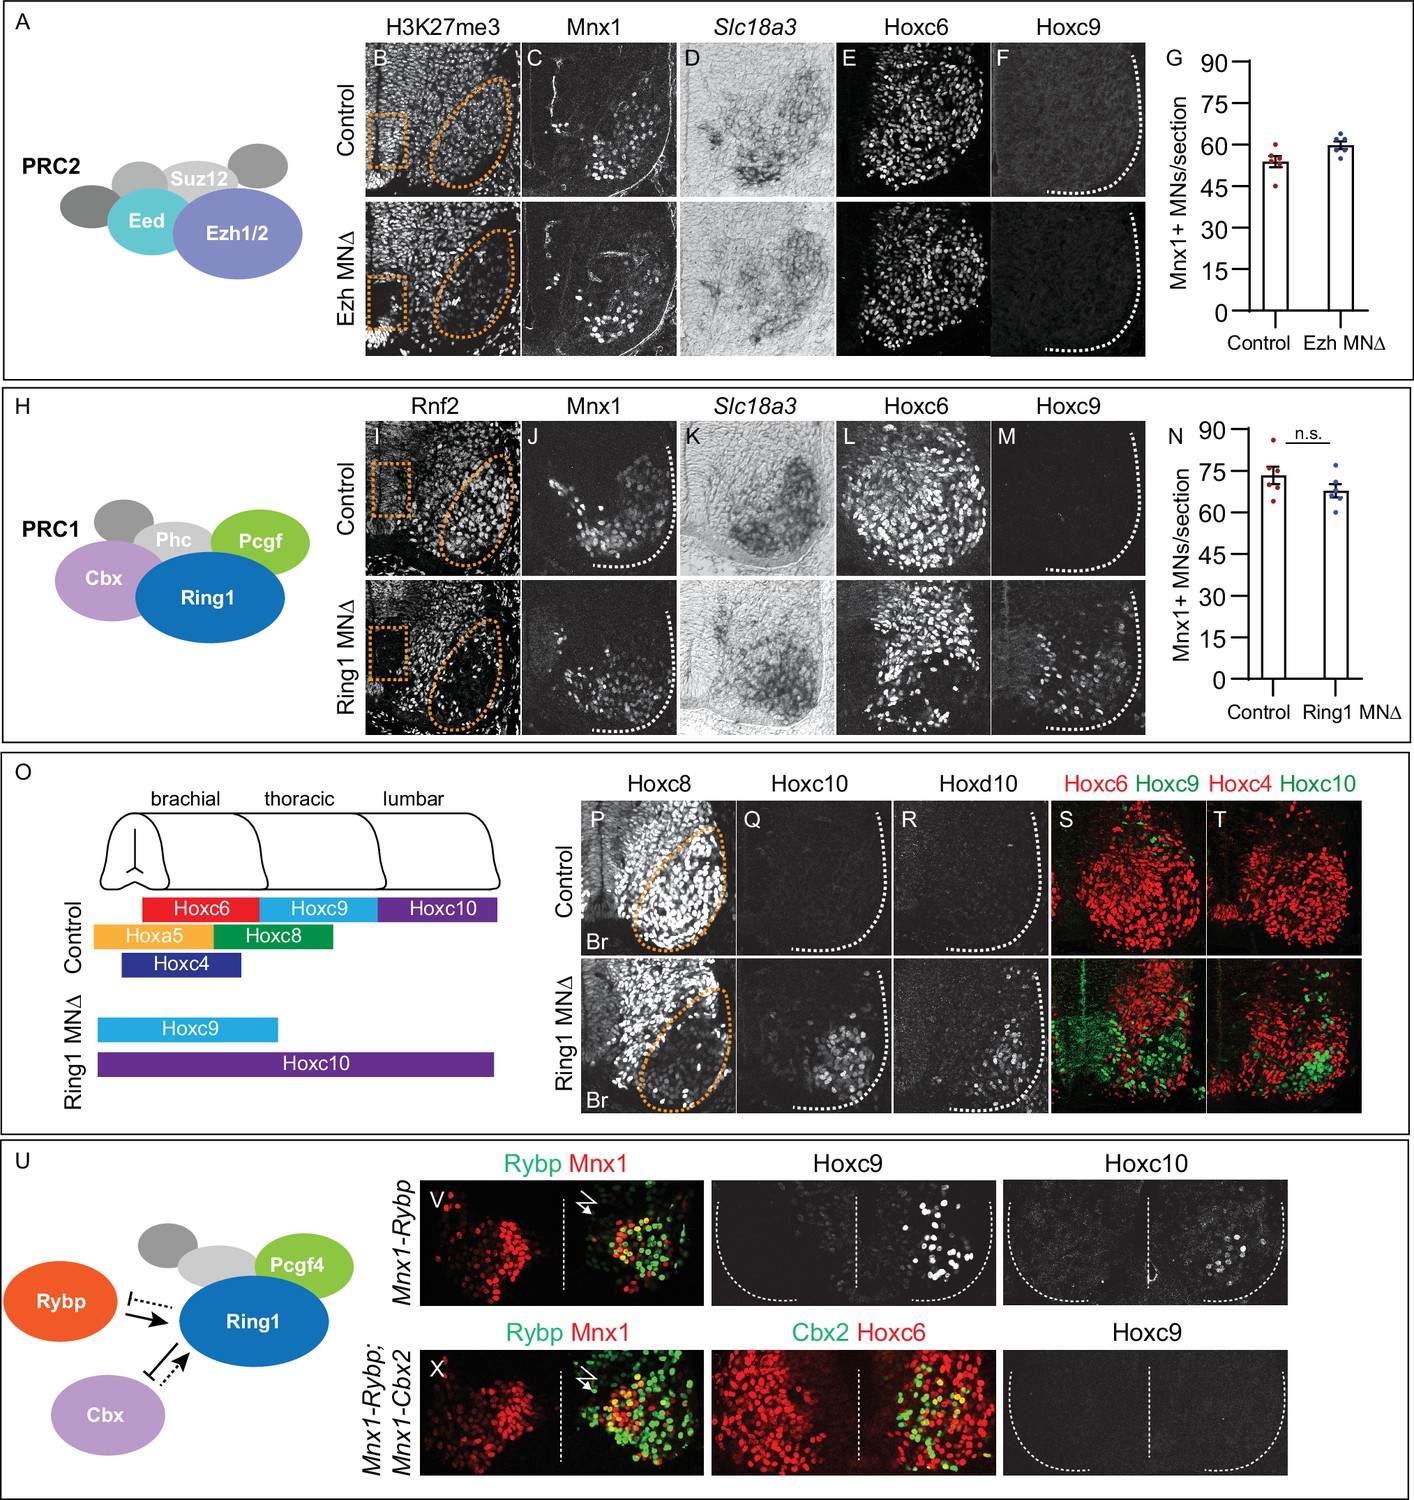
Roles of PRC1 and PRC2 in determining of Hox expression in spinal MNs.
(A) Core components of PRC2. (B) Brachial spinal sections showing H3K27me3 is depleted from progenitors (boxed region) and post-mitotic MNs (oval) in E11.5 EzhMNΔ (Ezh1flox/flox::Ezh2flox/flox, Olig2Cre) embryos. (C–D) MNs express Mnx1 and Slc18a3 (Vacht) in EzhMNΔ mice. (E–F) Brachial Hoxc6 expression is normal in EzhMNΔ mice, and no ectopic Hoxc9 is detected. (G) Quantification of MNs: 54±2 Mnx1+ MNs per section in brachial controls, versus 60±1 in EzhMNΔ mice, n = 6 sections, p = 0.0342, unpaired t-test. (H) Core components of PRC1. (I) Rnf2 (Ring1B) is selectively removed from progenitors (boxed region) and post-mitotic MNs (oval) in E12.5 Ring1MNΔ (Ring1-/-::Rnf2flox/flox, Olig2Cre) mice. (J–K) Ring1MNΔ mice express Mnx1 and Slc18a3. (L–M) Hoxc6 is lost from brachial MNs and Hoxc9 is ectopically expressed in Ring1MNΔ mice. (N) Quantification of MNs: 73±3 Mnx1+ MNs in controls, versus 68±2 in Ring1MNΔ mice, n = 6 sections, p = 0.1879, unpaired t-test. (O) Summary of changes in MN Hox expression of Ring1MNΔ mice. (P–R) Loss of Hoxc8 and ectopic Hoxc10 and Hoxd10 expression in brachial MNs of Ring1MNΔ mice. (S–T) Co-labeling of Hoxc6/Hoxc9 and Hoxc4/Hoxc10 in Ring1MNΔ mice, showing ectopically expressed caudal Hox proteins and loss of rostral Hox expression in brachial segments. (U) Schematic of Cbx and Rybp interactions in PRC1. (V) Misexpression of Rybp in postmitotic MNs under Mnx1 in chick leads to ectopic Hoxc9 and Hoxc10 expression in brachial MNs. Bolt symbol indicates electroporated side of spinal cord. (X) Co-expression of Rybp and Cbx under Mnx1 fails to induce Hoxc9 in brachial MNs. Panels B-F show brachial sections from E11.5 embryos; I-M, P-T brachial sections from E12.5 embryos; V,X brachial sections of HH st25 chick.
-
Figure 1—source data 1
Counts of Mnx1-positive MNs in Ezh and Ring1 mutants.
- https://cdn.elifesciences.org/articles/72769/elife-72769-fig1-data1-v2.xlsx
Figure 1—figure supplement 1
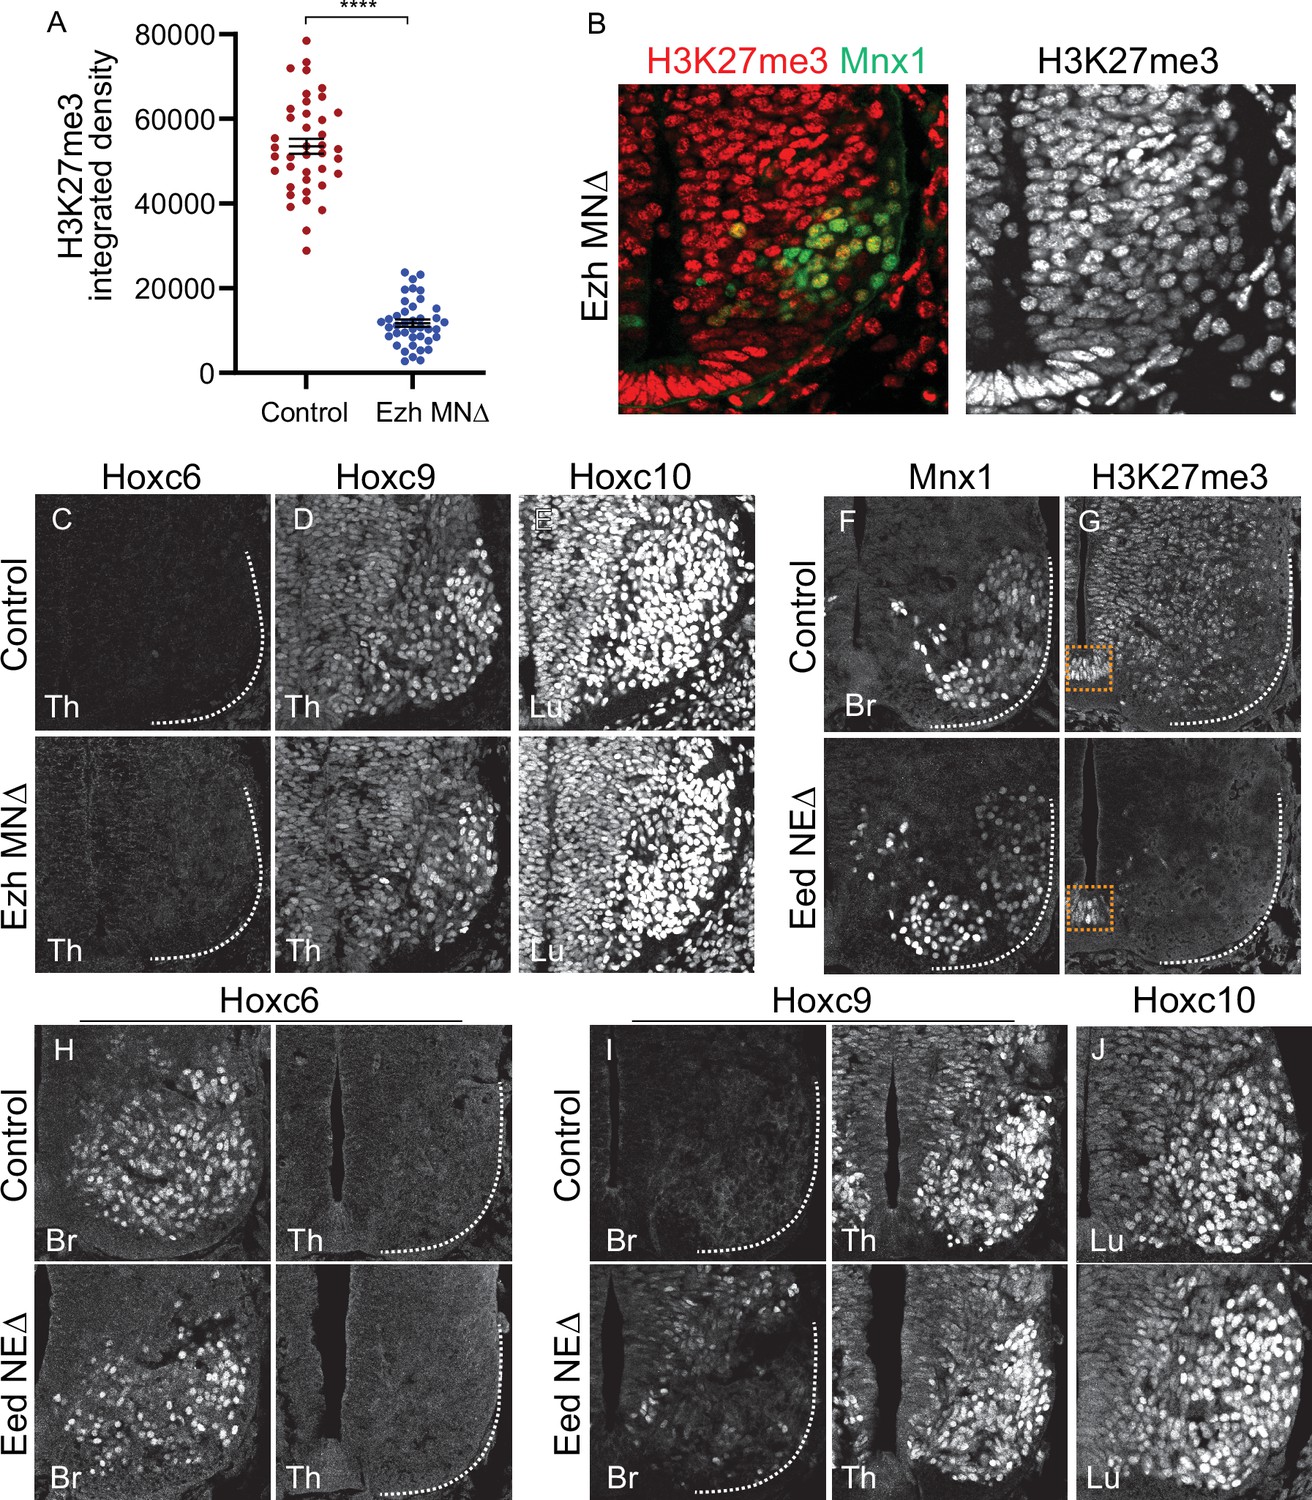
Effects of PRC2 mutations on MN differentiation.
(A) Quantification of H3K27me3 signal intensity in E11.5 control (Cre-) and EzhMNΔ embryos. Data points show nuclear signal intensities of individual MNs from two mutant and two control embryos (20 MNs each embryo). ****p < 0.0001, unpaired t-test (B) H3K27me3 staining in E10.5 EzhMNΔ embryos. H3K27me3 is detectable at reduced levels at e10.5. (C–D) Expression of Hoxc9 in thoracic segments and Hoxc10 in lumbar segments is normal in E11.5 EzhMNΔ mice and no ectopic thoracic Hoxc6 expression is detected. (F,G) In EedNEΔ mice (Eedflox/flox::Sox1Cre) H3K27me3 is depleted throughout the spinal cord at E12.5, while Mnx1 expression is unaffected. Some H3K27me3 is detected in the floor plate of EedNEΔ mice (boxed region). (H–J) Brachial Hoxc6, thoracic Hoxc9, and lumbar Hoxc10 are detected normally in EedNEΔ mice.
-
Figure 1—figure supplement 1—source data 1
Quantification of H3K27me3 intensity in MNs of Ezh mutants.
- https://cdn.elifesciences.org/articles/72769/elife-72769-fig1-figsupp1-data1-v2.xlsx
Figure 1—figure supplement 2
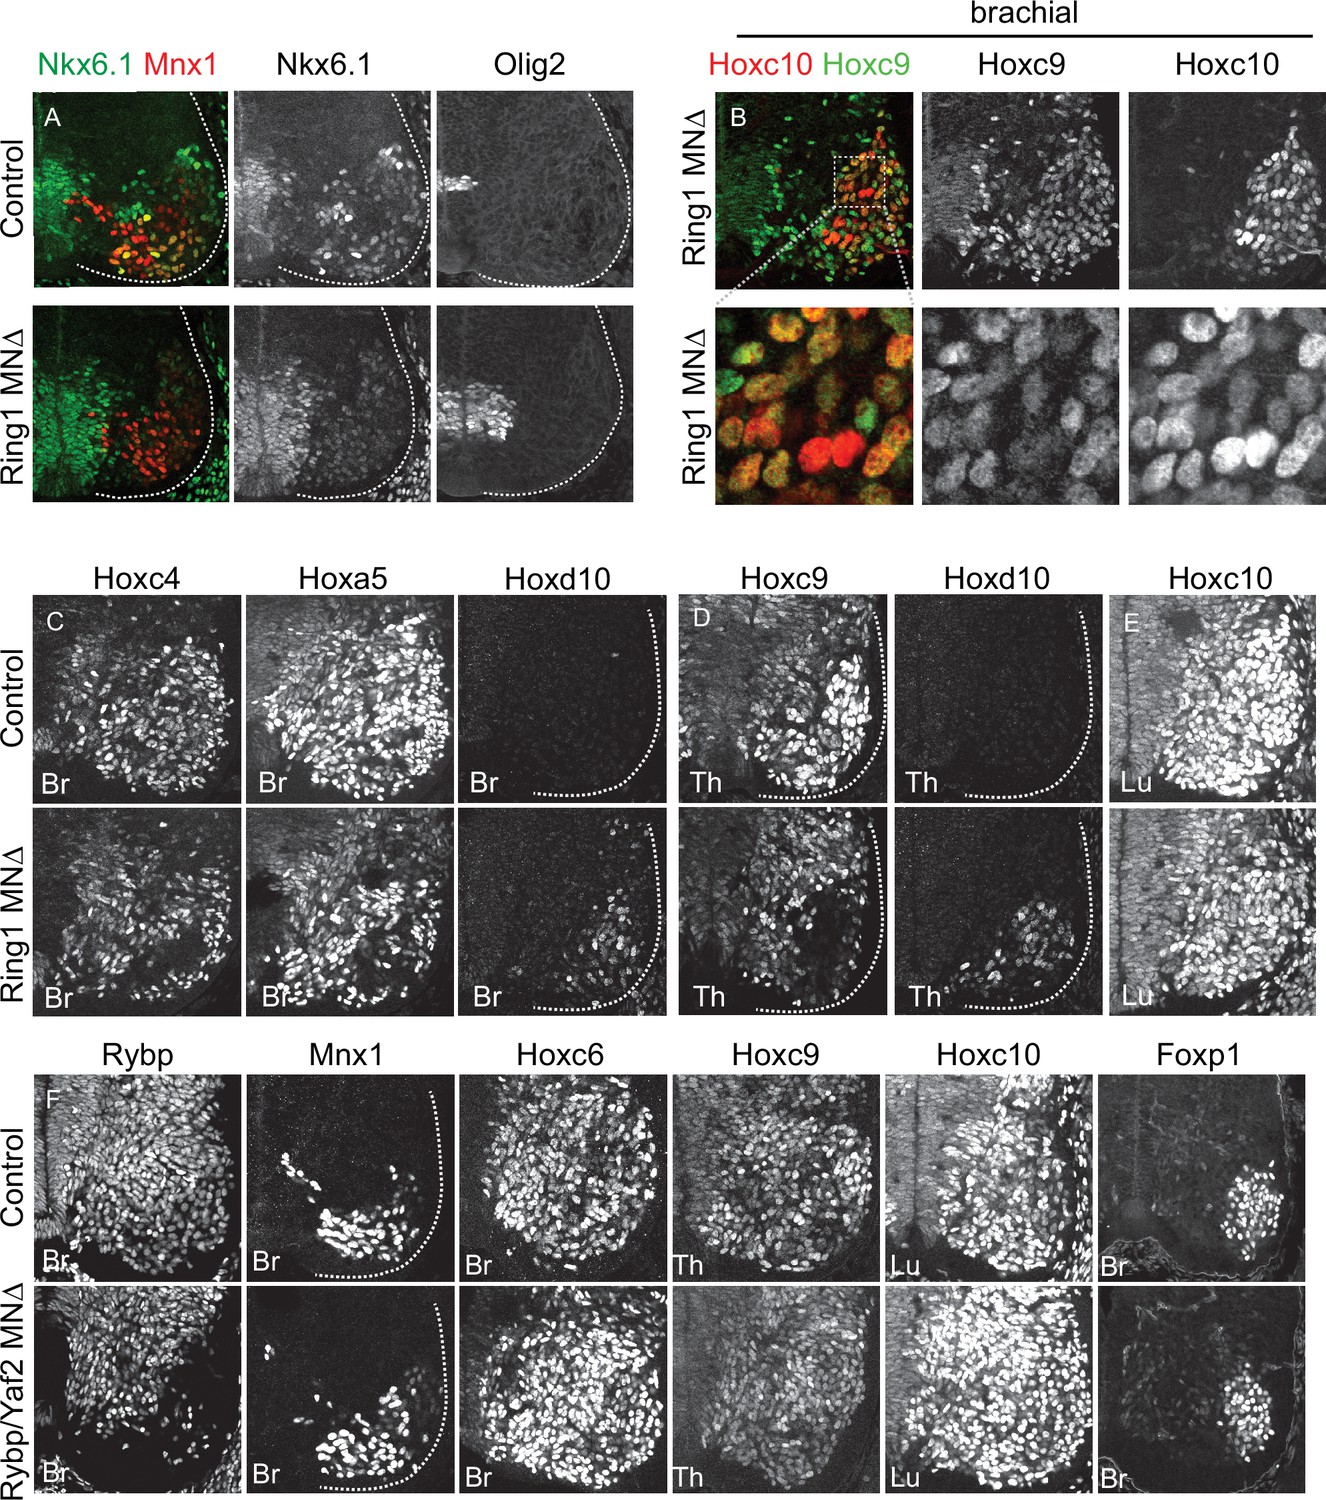
Effects of canonical and variant PRC1 mutations on MN differentiation.
(A) Expression of Nkx6.1 and Olig2 proteins in brachial (Br) E12.5 MNs of control and Ring1MNΔ mice. Postmitotic expression of Nkx6.1 in LMC motor pools is lost in Ring1 mutants. There is a slight expansion in the domains of Nkx6.1 and Olig2 expression within the progenitor domain but neither are detected in the more mature laterally positioned MNs. (B) Co-expression of Hoxc9 and Hoxc10 in brachial segments of Ring1MNΔ mice. Bottom panels show magnified view of boxed region. Hoxc9 and Hoxc10 are not normally expressed in mid-brachial level MNs (data not shown). (C) Brachial Hoxc4 and Hoxa5 are lost from MNs in Ring1MNΔ mice, and Hoxd10 is ectopically expressed. (D) Hoxc9 expression is reduced in thoracic (Th) segments of Ring1MNΔ mice, and Hoxd10 is ectopically expressed. (E) Expression of Hoxc10 is retained at lumbar (Lu) levels of Ring1MNΔ mice. (F) Analysis of E12.5 Rybp/Yaf2MNΔ mice (Rybpflox/flox::Yaf2-/-::Olig2Cre). Rybp expression is selectively depleted from MNs. Mnx1, indicated Hox proteins, and Foxp1 are expressed normally in each segment.
Figure 2 with 1 supplement
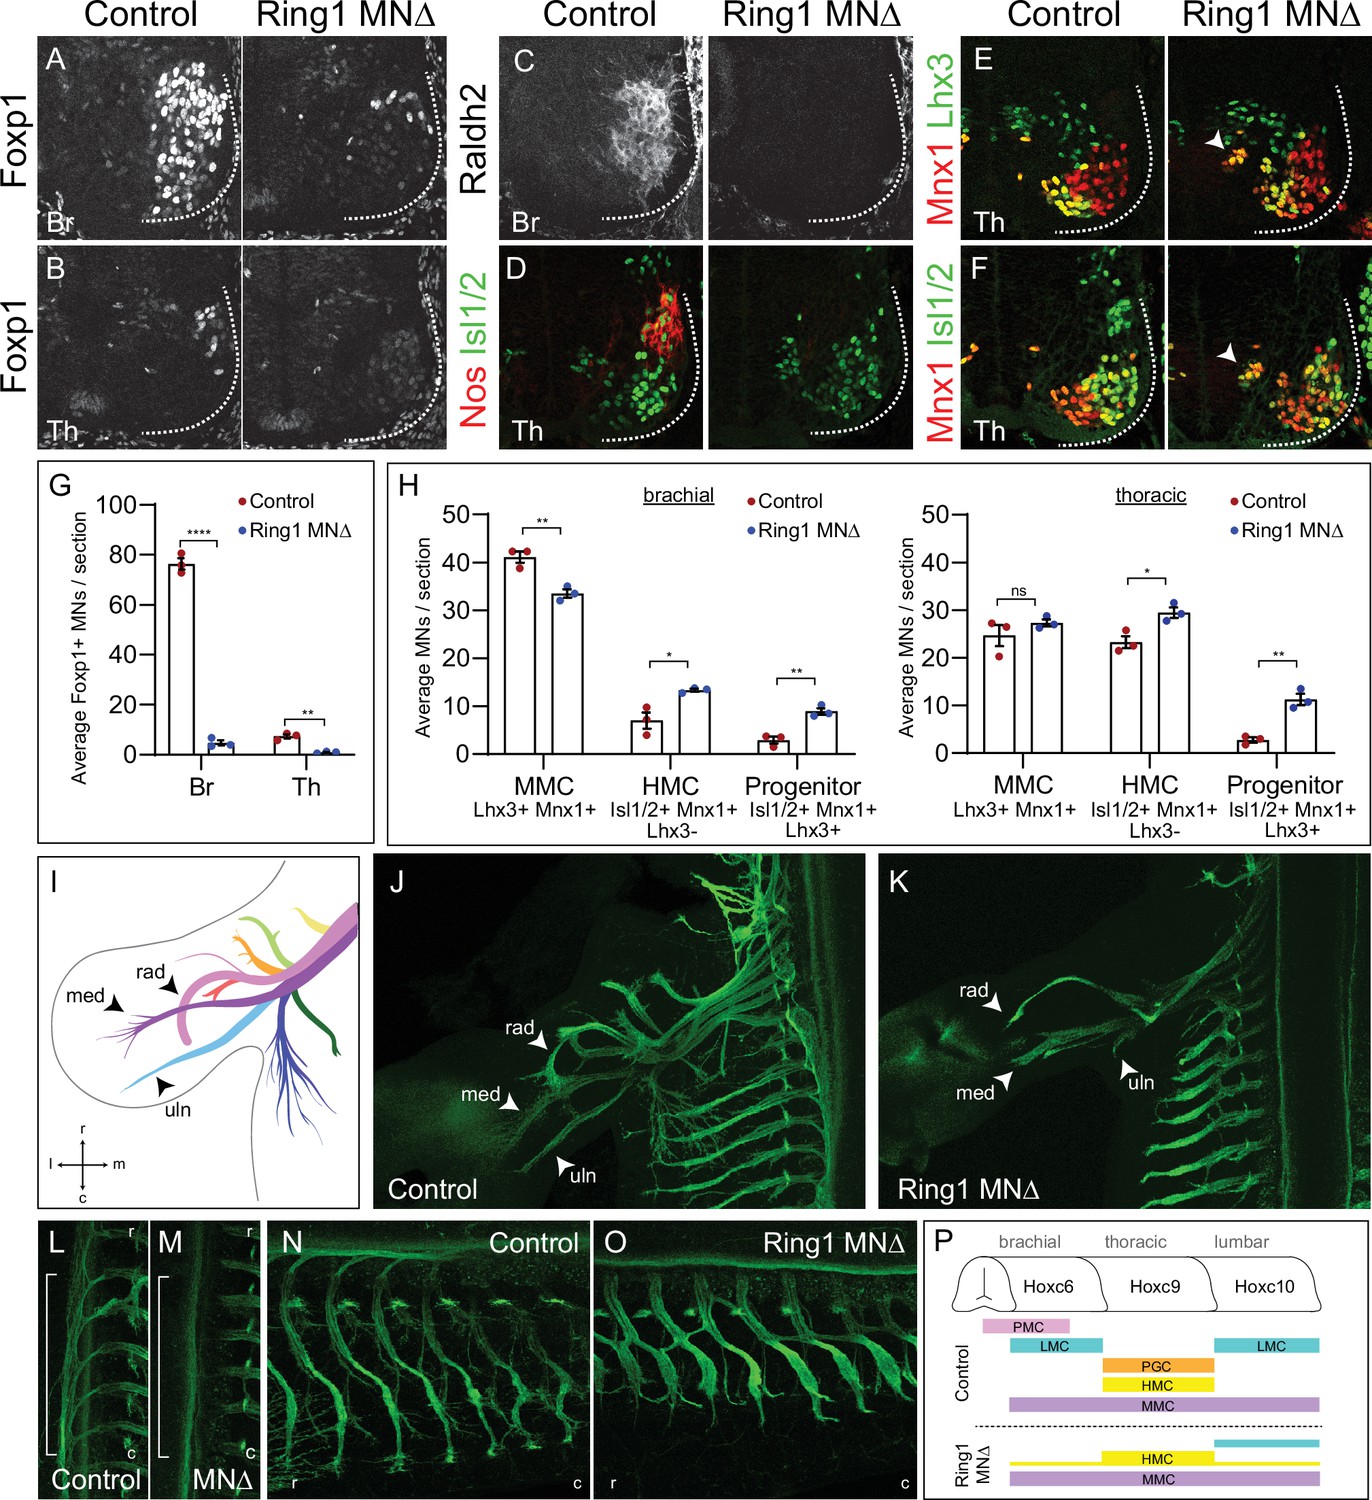
Ring1 is essential for the specification of Hox-dependent MN subtypes.
(A–B) Foxp1 expression is reduced in brachial (Br) and thoracic (Th) segments of Ring1MNΔ mice at E12.5. (C–D) Expression of the brachial LMC marker Raldh2 and thoracic PGC marker Nos were lost in Ring1MNΔ mice. (E–F) Staining of Mnx1+, Lhx3+ (MMC) and Mnx1, Isl1/2+ (HMC) neurons. In Ring1MNΔ mice, we also observed a population of medial neurons that coexpressed Isl1/2, Mnx1, and Lhx3 (indicated by arrow heads). (G) Quantification of Foxp1 reduction in Br and Th segments. (H) Quantification of MMC (Mnx1+, Lhx3+), HMC (Isl1/2+, Mnx1+, Lhx3-) and medial ‘progenitors’ (Isl1/2+, Mnx1+, Lhx3+) MNs arrow heads in E,F. Panels G-H show average from n = 3 mice, four sections each animal. Data shown in graphs shown as mean ± SEM. *p < 0.05, **p < 0.01, ****p < 0.0001, unpaired t-test. (I) Schematic of nine primary nerves in E12.5 mouse forelimb (Adapted from Figure 1A Catela et al., 2016) med = median, rad = radial, uln = ulnar nerves. Rostral (r), caudal (c), medial (m), and lateral (l) orientation shown. (J–K) Forelimb motor axons of an E12.5 control and Ring1MNΔ mouse labeled by Mnx1-GFP. (L–M) Innervation of sympathetic chain ganglia (from PGC neurons) in control and Ring1MNΔ mice. Bracket shows region of PGC projections along rostrocaudal axis. (N–O) Innervation of dorsal and ventral axial muscles by MMC and HMC respectively. In Ring1MNΔ mice, HMC motor projections are shorter and thicker. (P) Summary of MN columnar organization of control and Ring1MNΔ mice.
-
Figure 2—source data 1
Quantification of MN subtypes in Ring1 mutants.
- https://cdn.elifesciences.org/articles/72769/elife-72769-fig2-data1-v2.xlsx
Figure 2—figure supplement 1
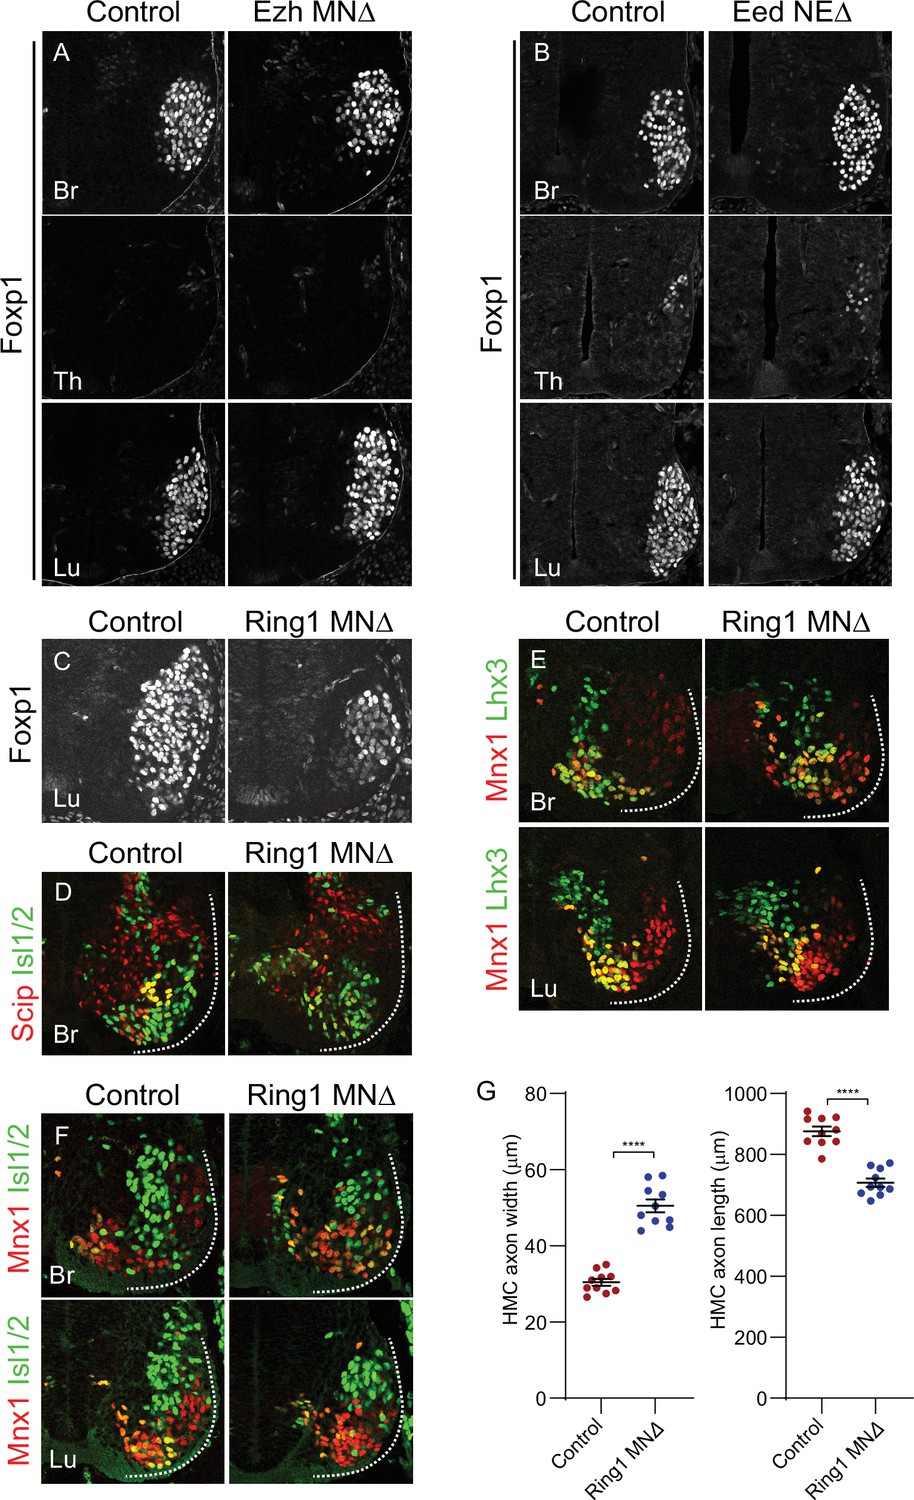
Analyses of MN subtypes in PRC mutant mice.
(A,B) Foxp1 expression is unaffected at brachial, thoracic, and lumbar levels in EzhMNΔ and EedNEΔ mice. (C) Reduced Foxp1 expression in lumbar segments of Ring1MNΔ mice. (D) Reduced expression of phrenic motor column (PMC) markers (Scip+, Isl1/2+) in rostral brachial segments of Ring1MNΔ mice. (E) Expression of MMC neuron (Mnx1+, Lhx3+) markers in brachial and lumbar segments of Ring1MNΔ mice. (F) Expression of HMC markers (Mnx1+, Isl1/2+, Lhx3-) in brachial and lumbar segments of Ring1MNΔ mice. (G) Quantification of HMC axon width and length in E12.5 control and Ring1MNΔ mice labeled by Mnx1-GFP. In Ring1MNΔ mice HMC axons are wider and shorter. Data in G are from N = 10 HMC nerves measured in two control and two mutant E12.5 embryos. ****p < 0.0001, unpaired t-test.
-
Figure 2—figure supplement 1—source data 1
Quantification of MN subtypes in Ring1 mutants.
- https://cdn.elifesciences.org/articles/72769/elife-72769-fig2-figsupp1-data1-v2.xlsx
Figure 3 with 1 supplement
Ring1 is required to restrict transcription factor expression in spinal MNs.
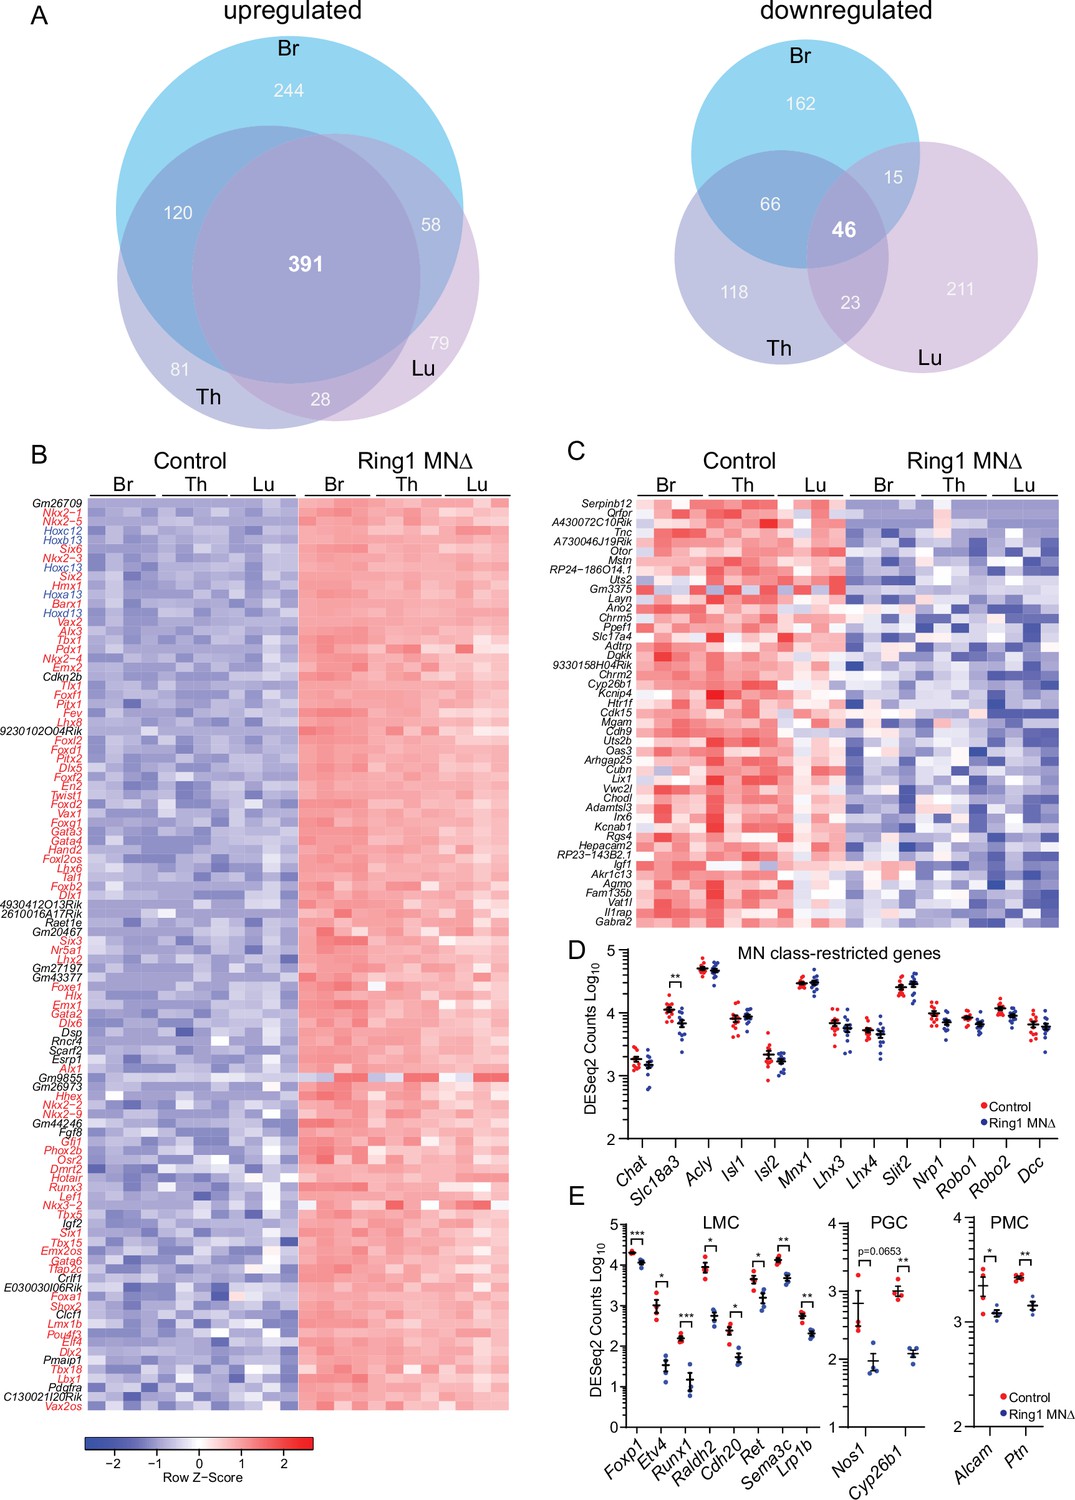
(A) Venn diagrams showing the number of upregulated (left) and downregulated (right) genes in bracial (Br), thoracic (Th), and lumbar (Lu) MNs upon loss of Ring1 from MNs by RNAseq (log2-FC > 2, FDR < 0.1). (B) Heat map of top 100 upregulated genes (by log2-FC) in Ring1MNΔ mice and control MNs. Genes shown in blue are Hox genes and other transcription factor are shown in red. (C) Heat map of 45 genes downregulated in Ring1MNΔ mice in comparison to control MNs. (D) Plots of DESeq2 counts of genes associated with MN class identity. Each data point shows DESeq2 counts for each sample, and segment-specific counts are plotted together. Expression of Slc18a3 (Vacht) is reduced (padj. = 0.026477) in Ring1MNΔ mice. (E) DESeq2 counts of genes associated with specific MN subtype identities were reduced in Ring1MNΔ mice. Counts for LMC and PMC markers are from Br segments, PGC from Th segments. Black bars shown in graphs indicate mean ± SEM. *p < 0.05, **p < 0.01, ***p < 0.001, ****p < 0.0001, unpaired t-test.
Figure 3—figure supplement 1
RNAseq analyses of Ring1 mutant mice.
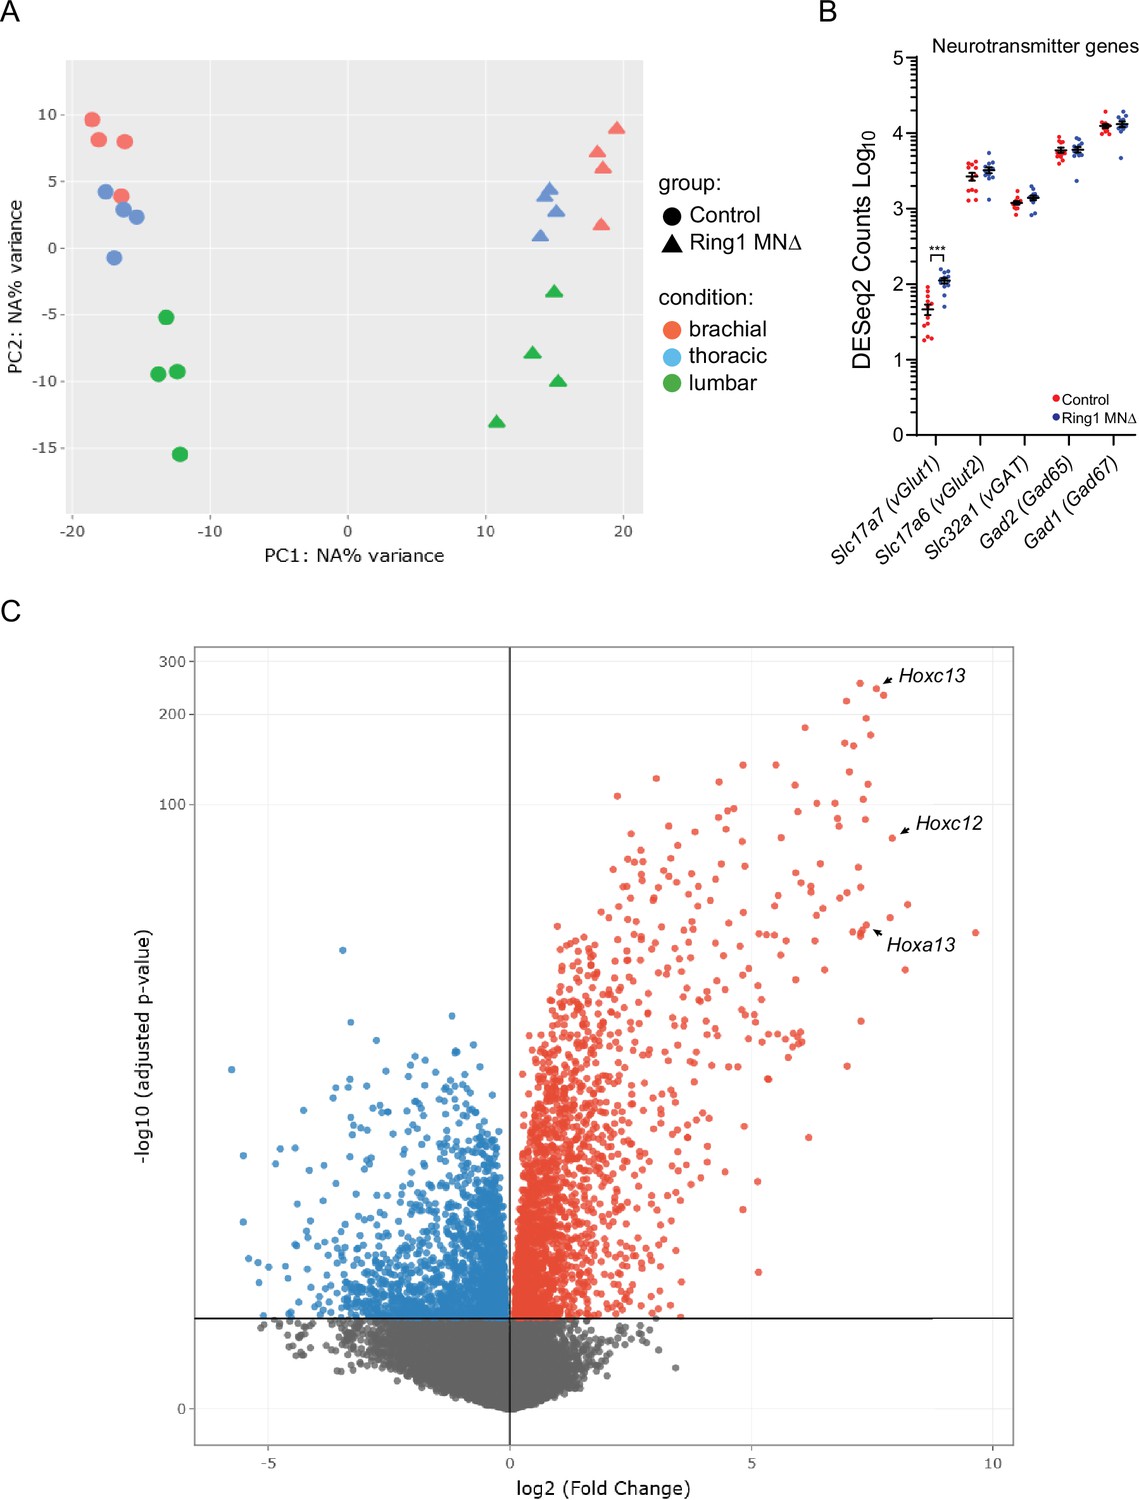
(A) PCA plot of RNAseq samples. (B) Plot of neurotransmitter encoding genes in control and Ring1MNΔ mice. Commonly used gene names are shown in parenthesis. Expression of Slc17a7 is increased in Ring1MNΔ mice, although the absolute DESeq2 counts were still relatively low (46.3±7.2 in controls versus 111.1±9 in Ring1MNΔ mice, p = 0.000012). Elevated expression of Gad1 in controls and mutants may be due to presence of spinal interneurons in sorted samples. (C) Volcano plot of upregulated (red) and downregulated (blue) genes. Three caudal Hox genes are indicated.
Figure 4 with 1 supplement
Analyses of misregulated genes in Ring1 mutants.
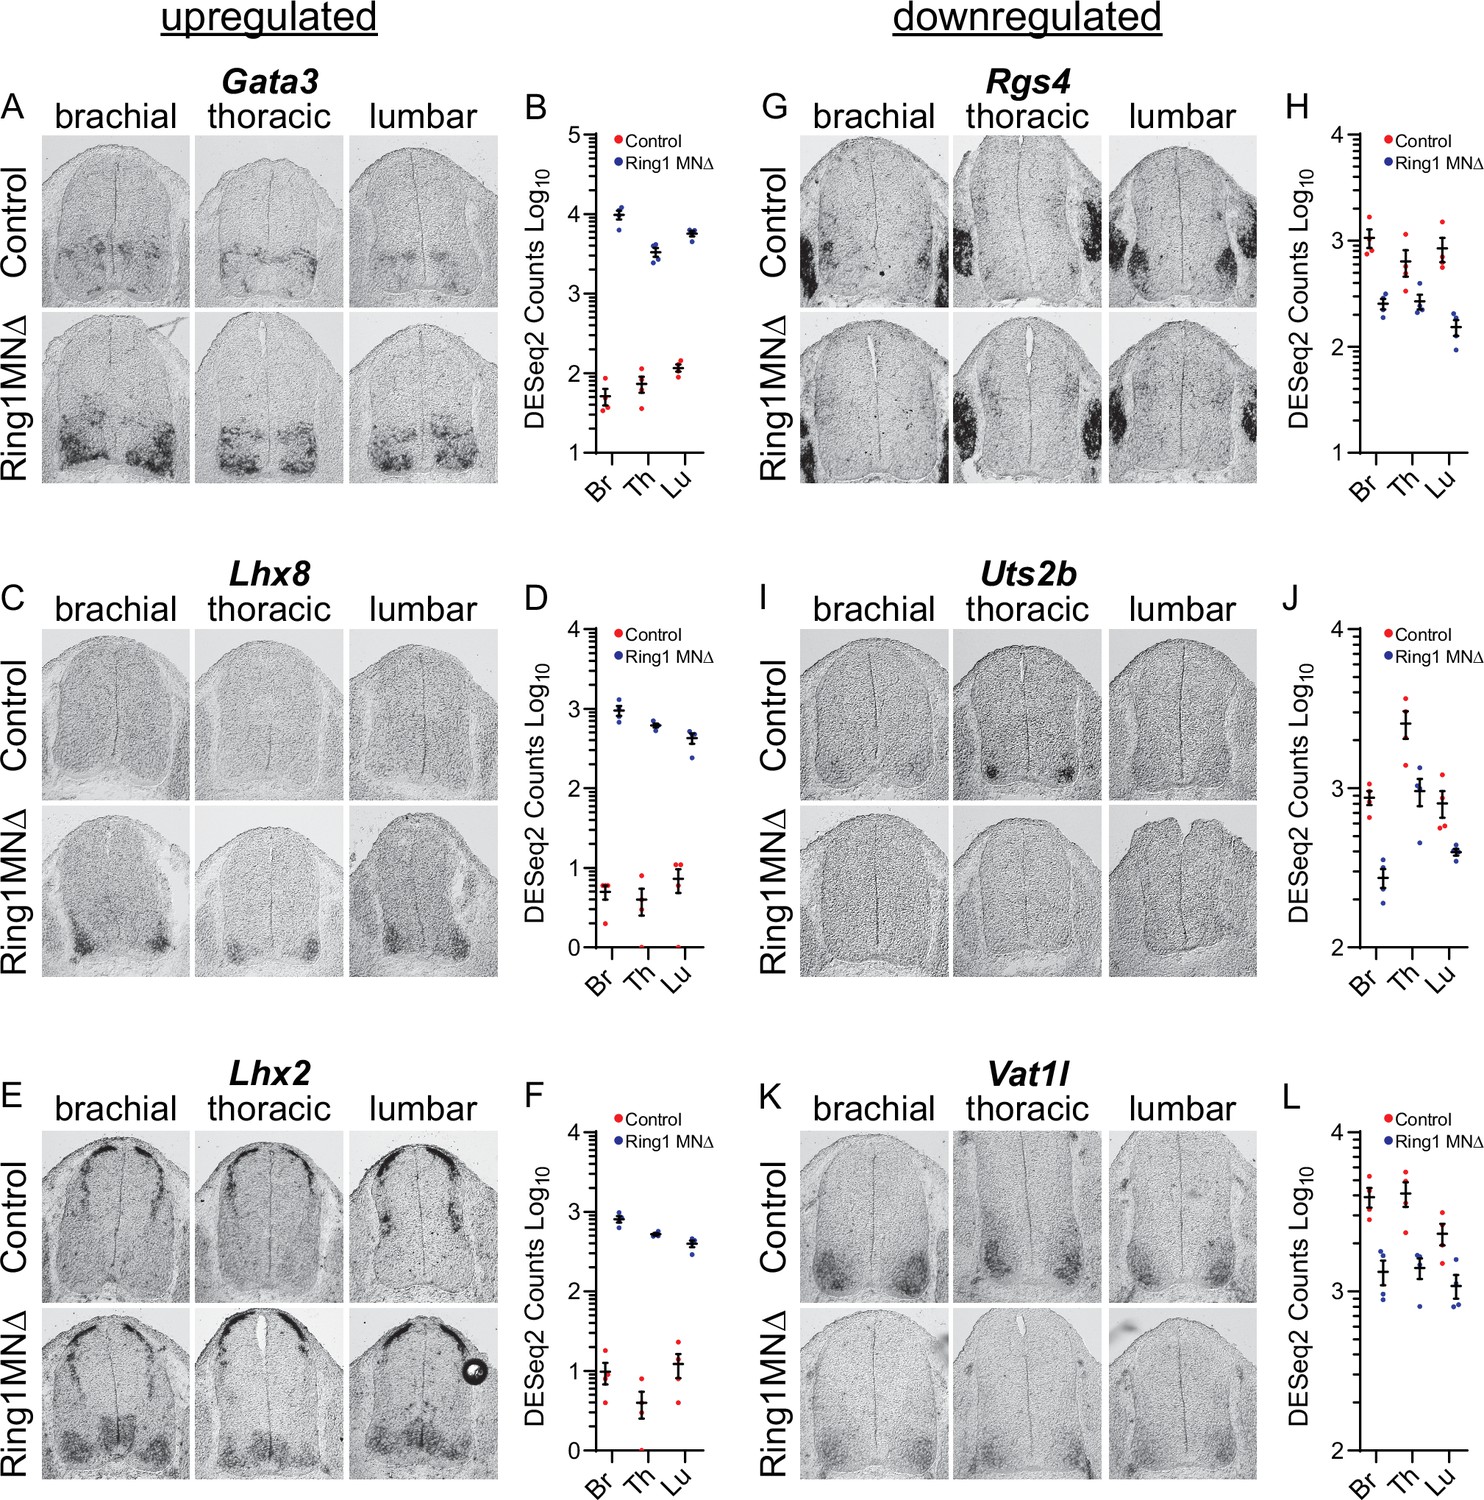
(A,C,E) In situ mRNA hybridization of selected upregulated genes from Ring1MNΔ RNAseq. Images show sections of brachial, thoracic, and lumbar segments from E12.5 control and Ring1MNΔ mice. (B,D,F) Graphs of DESeq2 counts for upregulated gene in each segment. Data points show DESeq2 counts from MNs of individual animals from indicated segments. (G, I, K) Analyses of downregulated genes by in situ hybridization. Rgs4 and Uts2b displayed elevated expression in specific segmental levels in controls, suggesting that a subset of the commonly downregulated genes are also Hox-dependent. Rgs4 expression is normally elevated in LMC neurons (panel G), while Uts2b is elevated in thoracic segments of controls (panel I) (H,J,L) Graphs of DESeq2 counts for each downregulated gene in each segment.
Figure 4—figure supplement 1
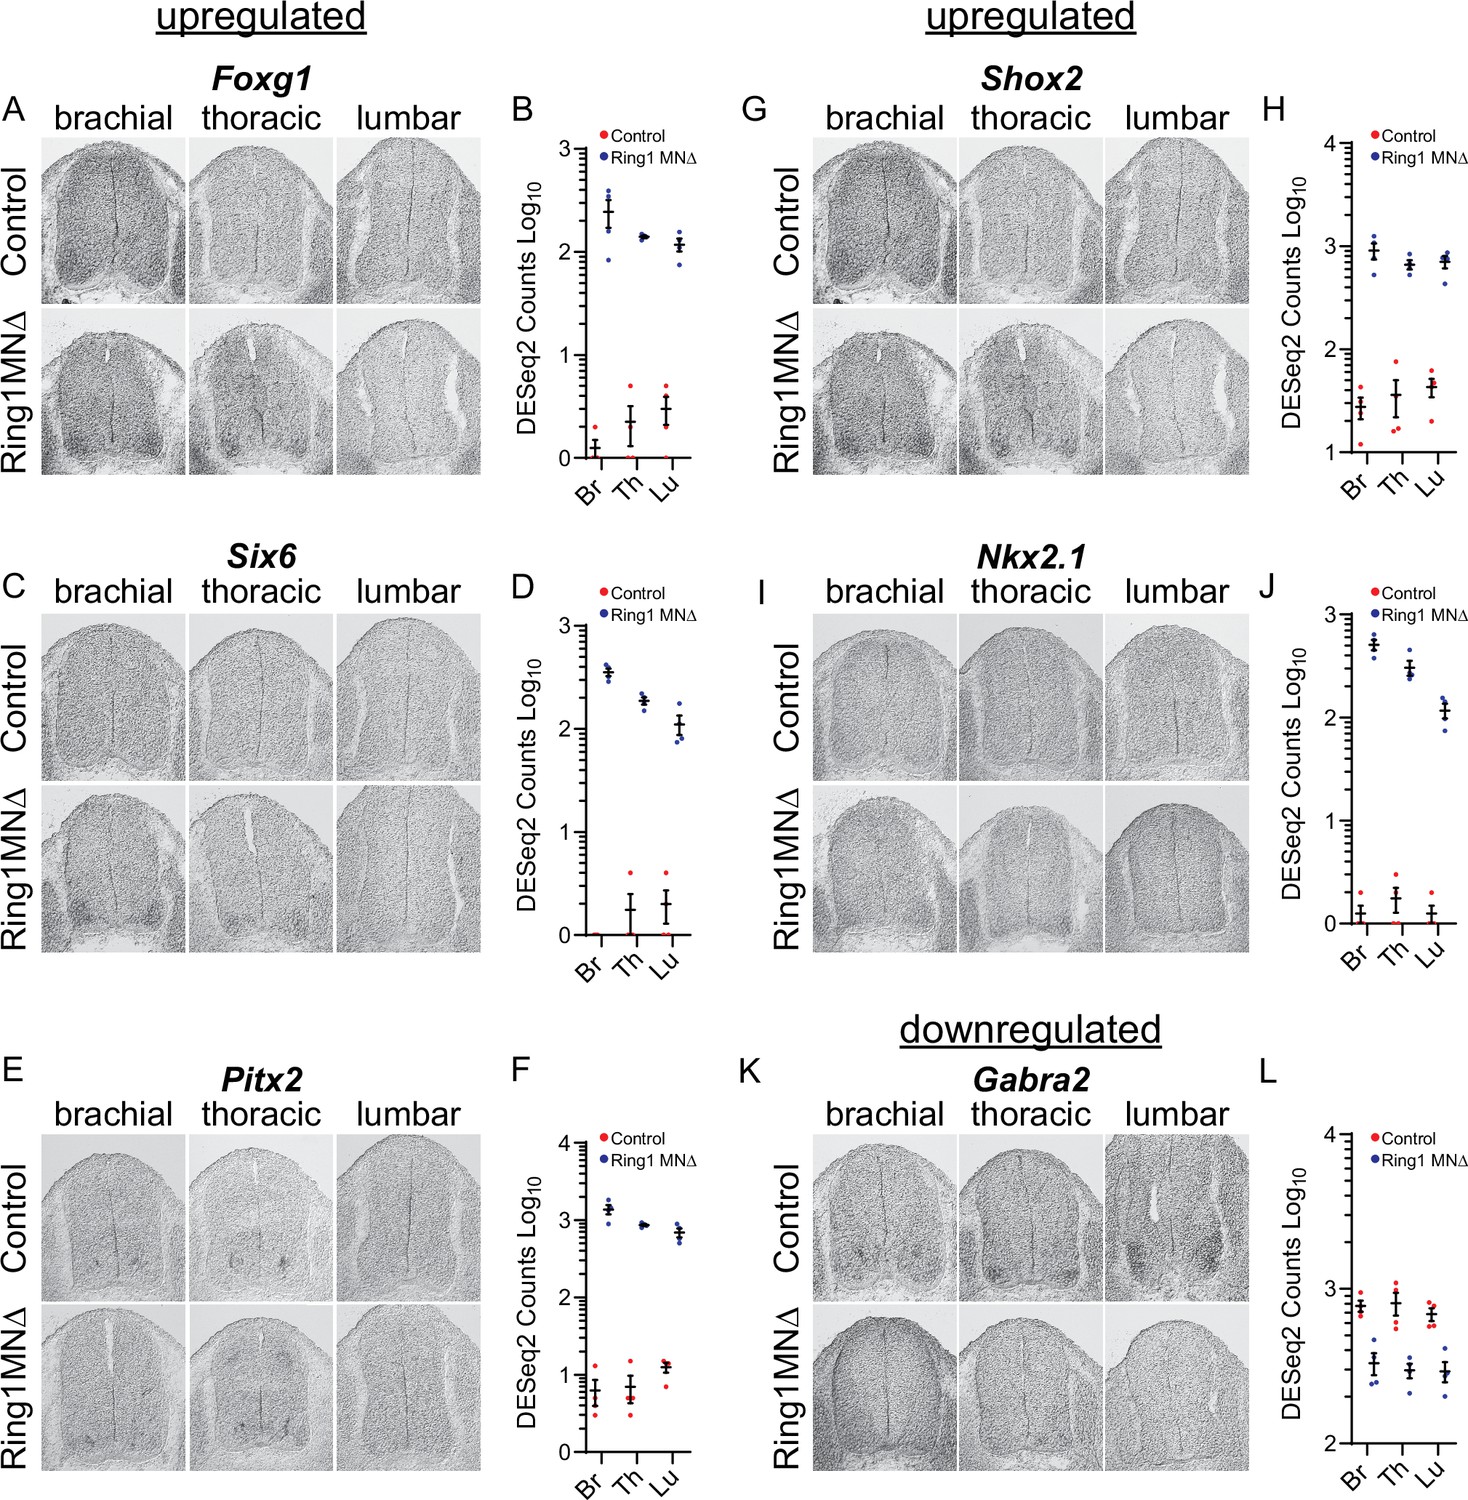
Validation of misregulated genes from Ring1MNΔ RNAseq.
(A,C,E,G,I) In situ hybridization of selected upregulated genes from the Ring1MNΔ RNAseq. Images show sections at brachial, thoracic, and lumbar levels from E12.5 control and Ring1MNΔ mice. (B,D,F,H,J) Graphs of DESeq2 counts for each upregulated gene in each segments. (K) Analysis of the downregulated gene Gabra2 by in situ hybridization. (L) Graph of DESeq2 counts for Gabra2 in each segment.
Figure 5 with 2 supplements
Derepression of caudal Hox genes in Ring1 mutants.
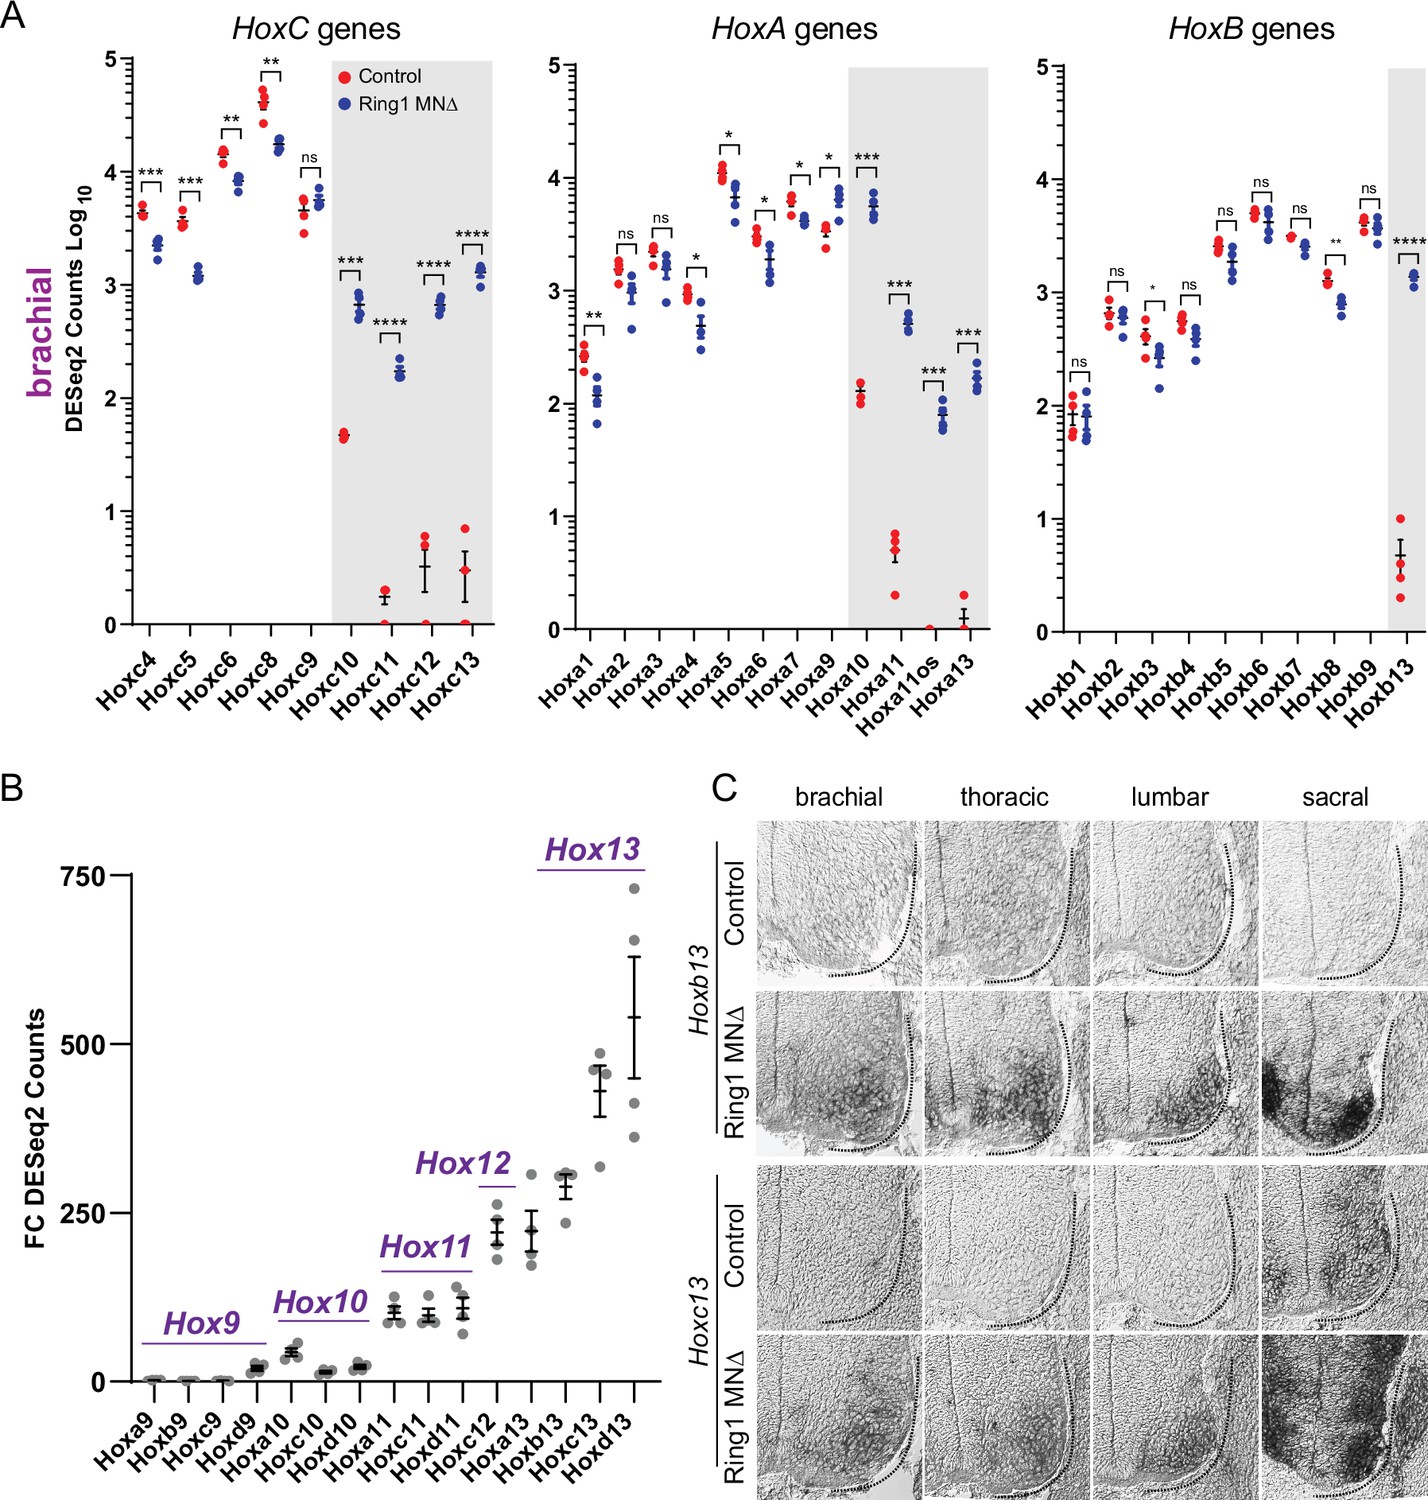
(A) DESeq2 counts of HoxC, HoxA, and HoxB cluster genes in brachial segments in control and Ring1MNΔ mice showing derepression of caudal Hox genes. Gray shaded regions highlight Hox genes that are derepressed in Ring1MNΔ mice. Hoxc9 does not show significant derepression, likely because it is normally expressed by caudal brachial MNs. Black bars shown in graphs indicate mean ± SEM. *p < 0.05, **p < 0.01, ***p < 0.001, ****p < 0.0001, unpaired t-test. (B) Comparison of Hox9-Hox13 paralog gene derepression in brachial segments. Graph shows absolute fold changes of DESeq2 counts, showing a marked increase for caudal Hox13 paralogs in Ring1MNΔ mice. Each data point shows individual counts for Ring1 mutants/average of controls. (C) In situ of Hoxb13 and Hoxc13 mRNA transcripts in E12.5 embryos. Hoxb13 is normally not detectable in spinal cord, but is derepressed in MNs in Ring1MNΔ mice. Hoxc13 transcripts are normally restricted to sacral segments but derepressed in rostral segments in Ring1MNΔ mice.
Figure 5—figure supplement 1
Derepression of caudal Hox genes in Ring1MNΔ mice.
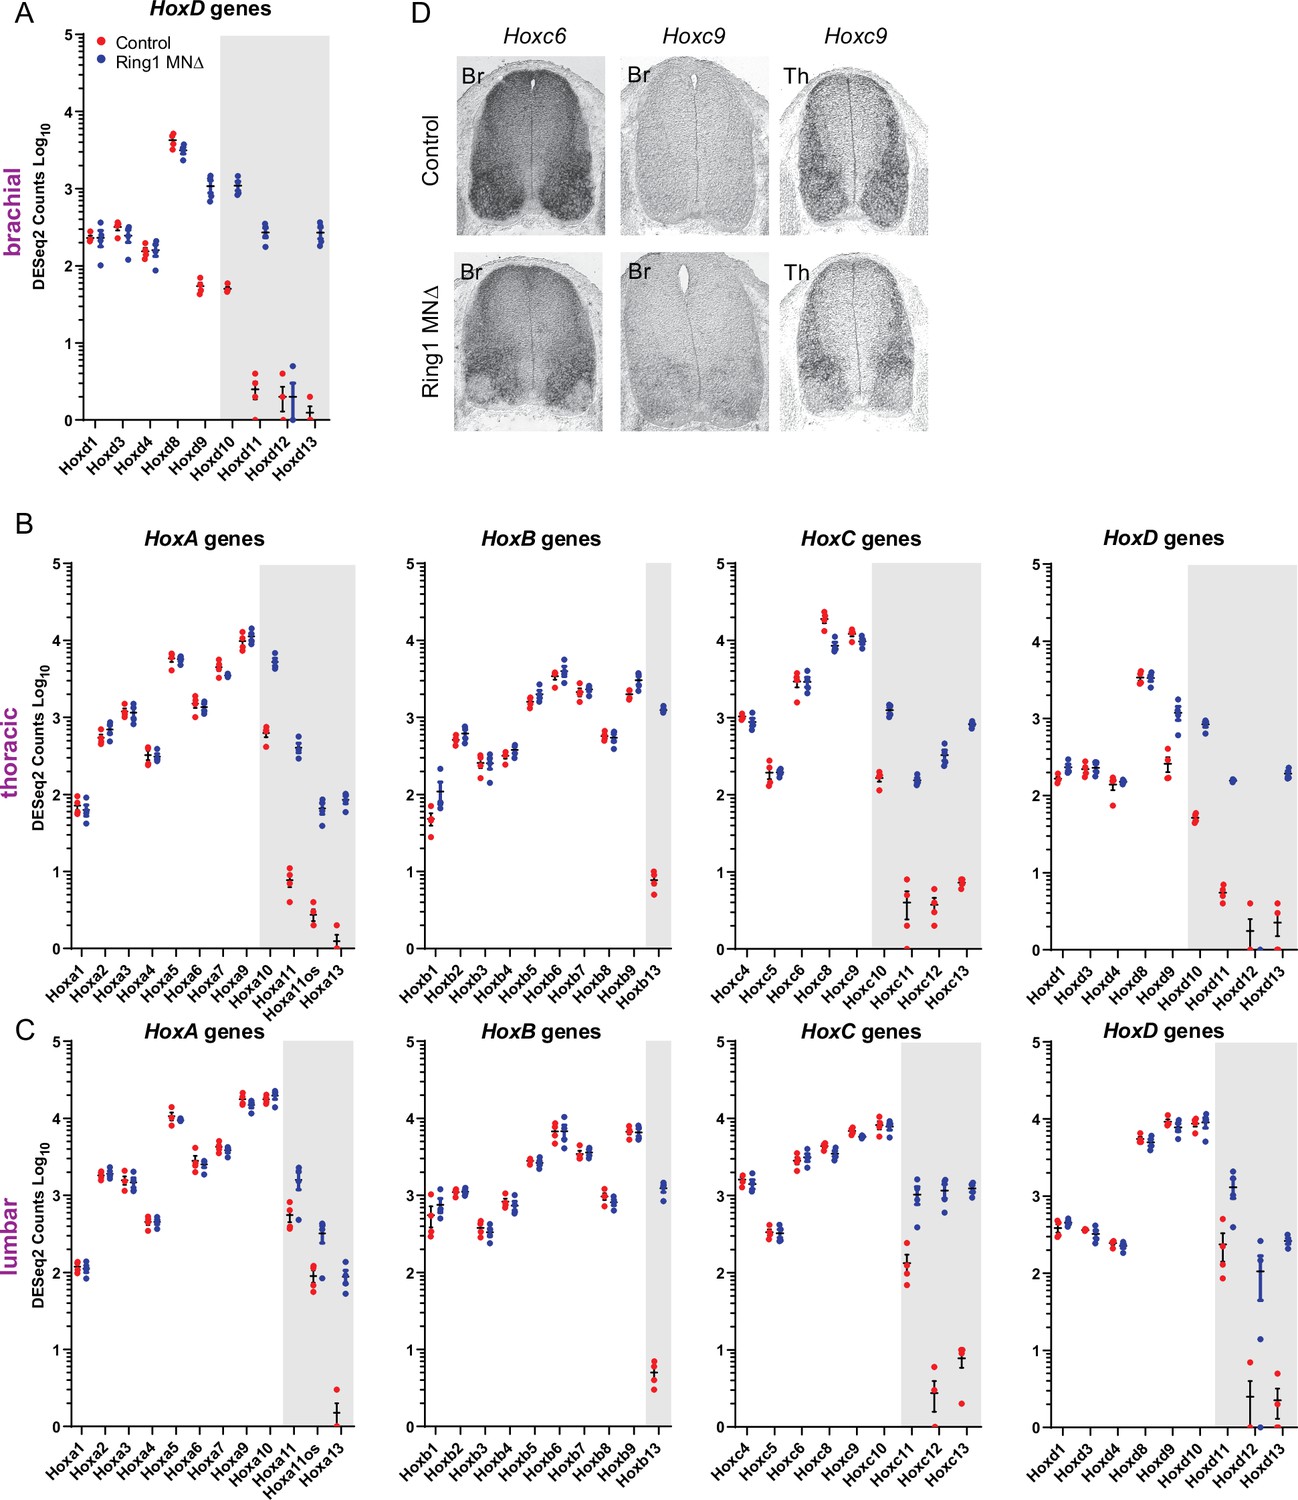
(A–C) DESeq2 counts of HoxA, HoxB, HoxC, and HoxD gene clusters in brachial (A), thoracic (B), and lumbar (C) segments. Gray-shaded regions highlight Hox genes that are derepressed in MNs of Ring1MNΔ mice. In lumbar segments, expression of Hox10 paralogs (Hoxa10, Hoxb10, Hoxc10, Hoxd10) is not reduced in Ring1 mutants, although Hox13 paralogs are derepressed. (D) In situ hybridization of Hoxc6 and Hoxc9 in Ring1MNΔ mice at brachial (Br) and thoracic (Th) levels at E12.5. In brachial segments, expression of Hoxc6 is diminished in MNs, and Hoxc9 is expressed, similar to the analyses of Hox protein expression. In thoracic segments, Hoxc9 expression is reduced in MNs.
Figure 5—figure supplement 2
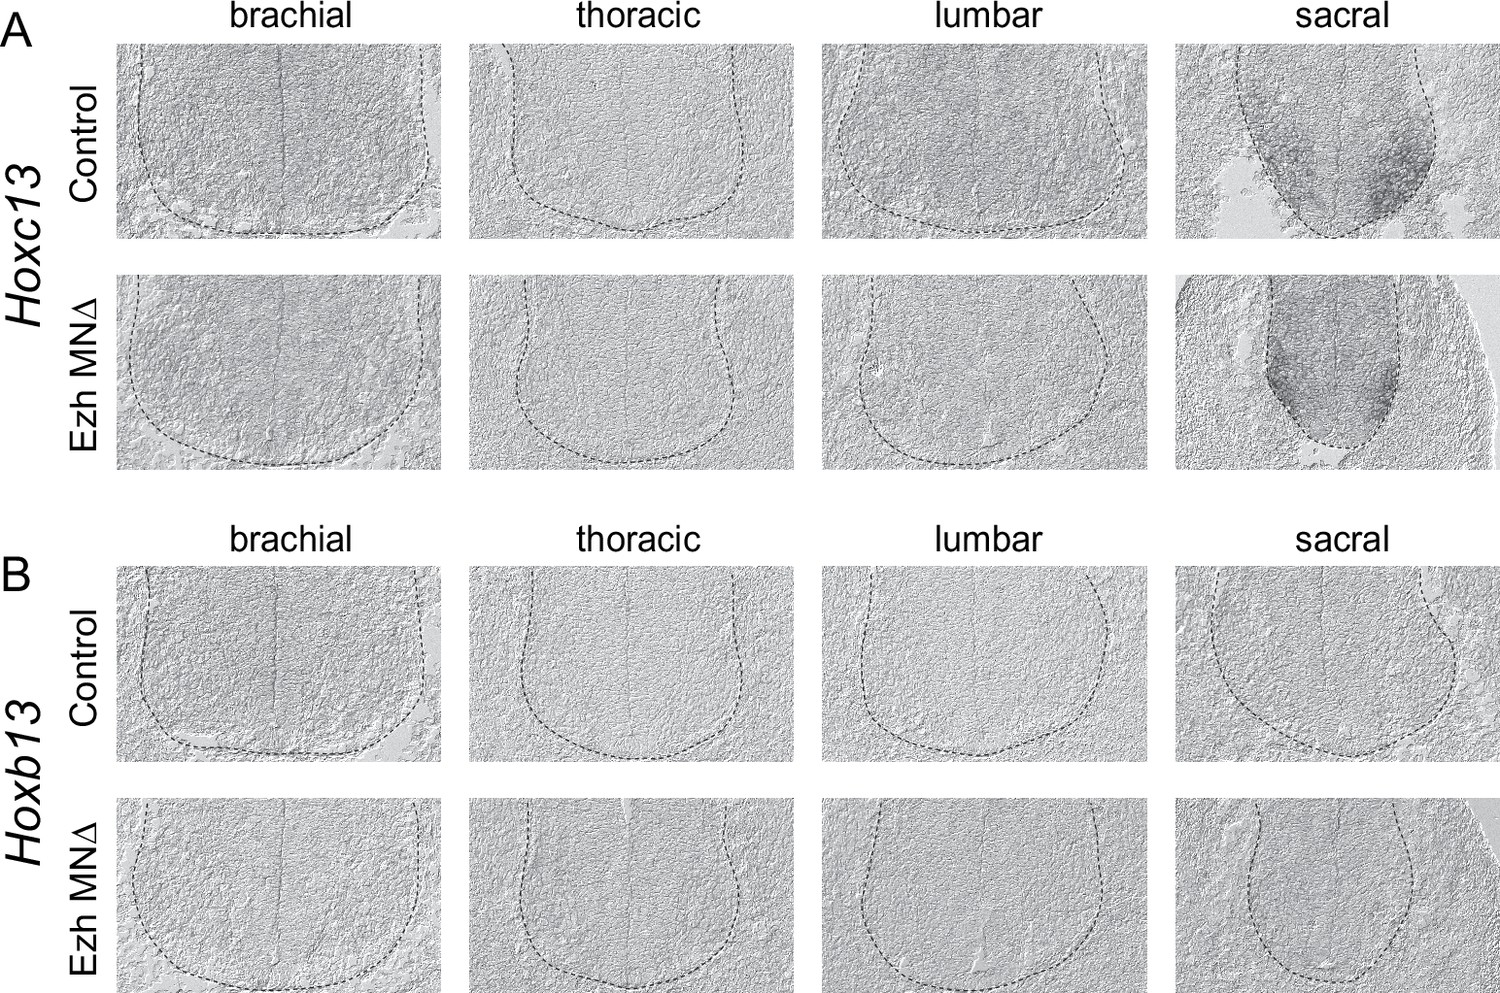
Expression of Hoxc13 and Hoxb13 in control and Ezh mutant mice.
(A,B) In situ of Hoxc13 and Hoxb13 mRNA transcripts in E12.5 EzhMNΔ embryos. (A) Hoxc13 transcripts are normally restricted to sacral segments and are not induced in rostral segments of EzhMNΔ embryos. (B) Hoxb13 transcripts are normally not detectable in the spinal cord are not ectopically expressed in EzhMNΔ embryos.
Figure 6 with 1 supplement
Ring1 is essential for maintaining chromatin topology at cell fate determining genes.
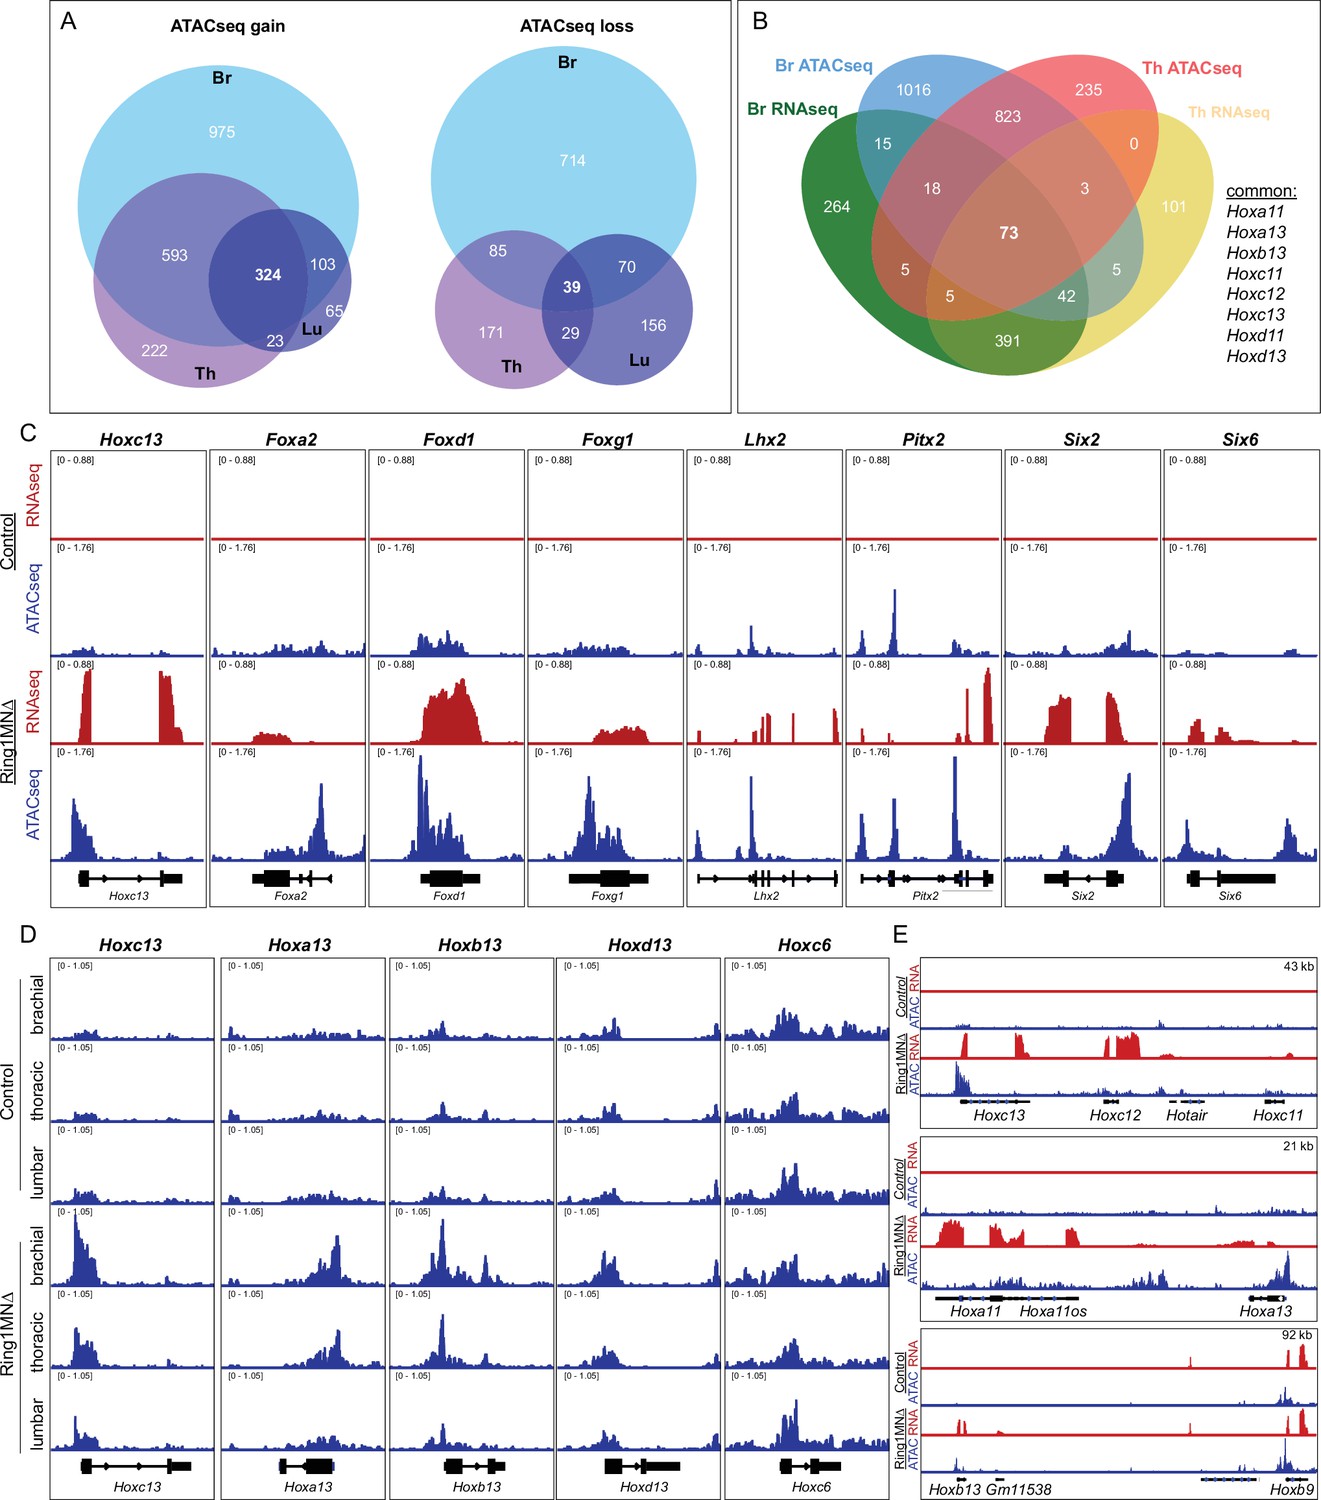
(A) Proportional Venn diagram showing the number of genes that gain (left) or lose (right) chromatin accessibility in brachial, thoracic and lumbar segments in Ring1MNΔ mice. (B) Venn diagram of upregulated genes from RNAseq and genes that gained accessibility in ATACseq of brachial and thoracic segments. (C) IGV browser views of selected genes that are upregulated and gained chromatin accessibility in controls and Ring1MNΔ mice in brachial segments. (D) IGV browser views of ATACseq tracks in controls and Ring1MNΔ mice in brachial, thoracic, and lumbar segments. Hox13 paralogs gain chromatin accessibility in each segment, while reduced brachial Hoxc6 expression is not associated with a loss of chromatin accessibility. (E) Comparison of IGV browser views of RNAseq and ATACseq tracks of caudal HoxC, HoxA, and HoxB genes in brachial segments.
Figure 6—figure supplement 1
Integrative analysis of RNAseq and ATACseq of MNs in Ring1MNΔ mice.
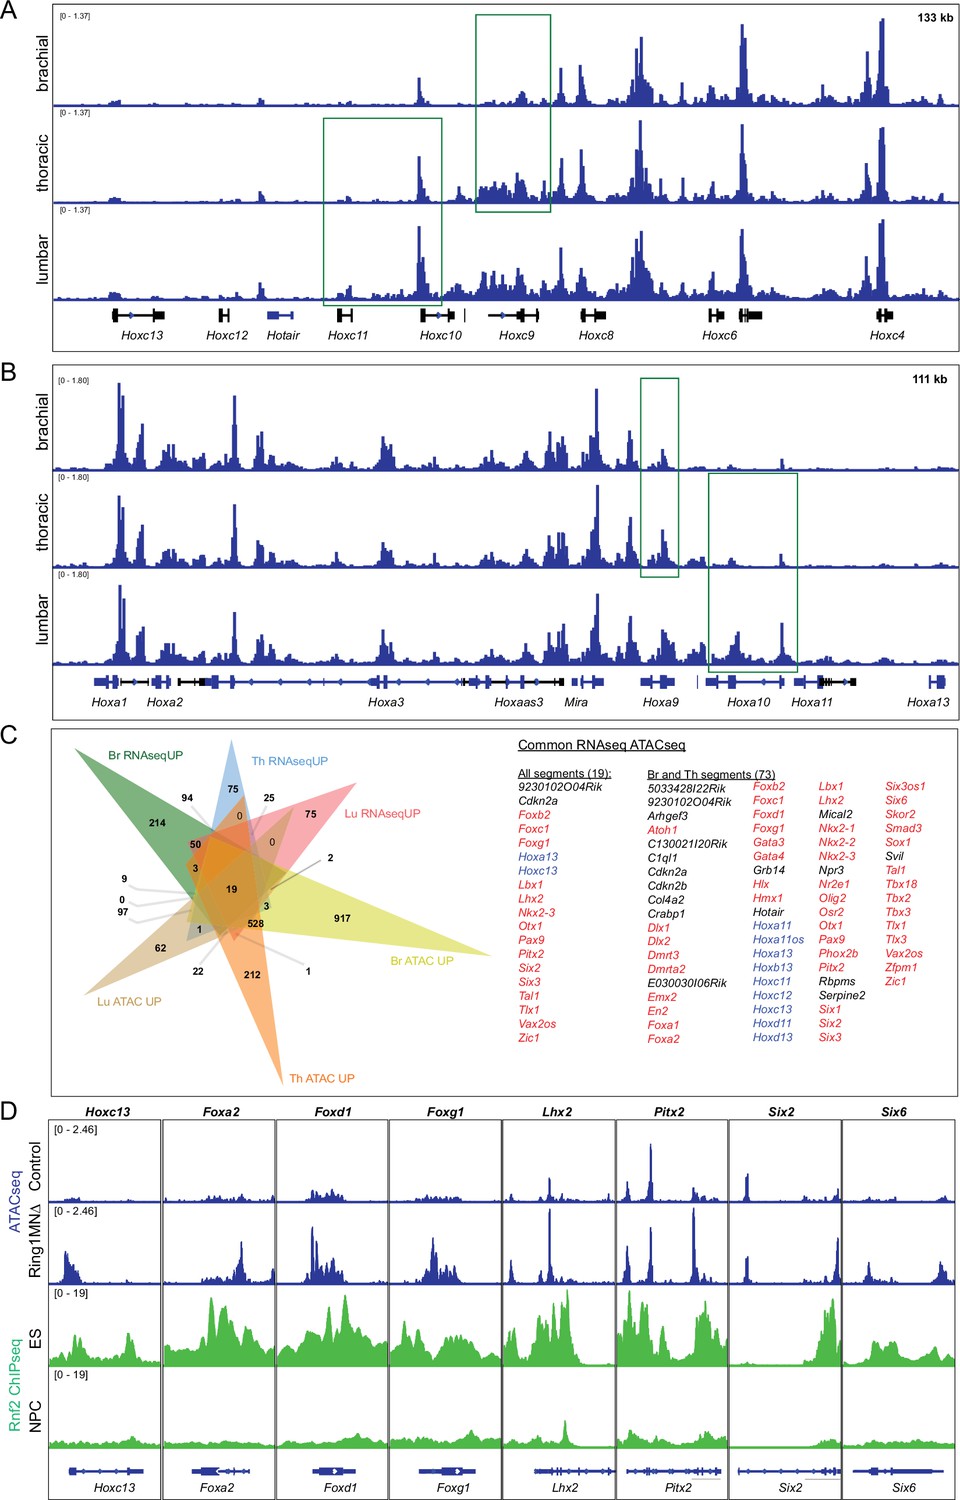
(A,B) IGV browser views of ATACseq tracks of the HoxC cluster (A) and HoxA cluster (B) in control mice. The peaks highlighted with green box indicate regions that gain accessibility in more caudal segments. (C) Venn diagram of upregulated genes (RNAseqUP) and genes that gain chromatin accessibility (ATACseqUP) in all segments. Genes that are upregulated and gained accessibility for all segments (19 genes) or Br and Th segments (73 genes) are listed on the right. Hox genes are highlighted in blue, other transcription factors in red. (D) IGV browser views comparing ATACseq tracks from brachial segments (control and Ring1MNΔ mice) with Rnf2 (Ring1B) ChIPseq tracks from ES and neural progenitor cells (NPC). Regions that gain accessibility in Ring1 mutants correspond to regions bound by Rnf2 in ES cells.
Figure 7 with 1 supplement
Hoxa13 and Hoxb13 repress multiple Hox4-Hox10 paralogs.
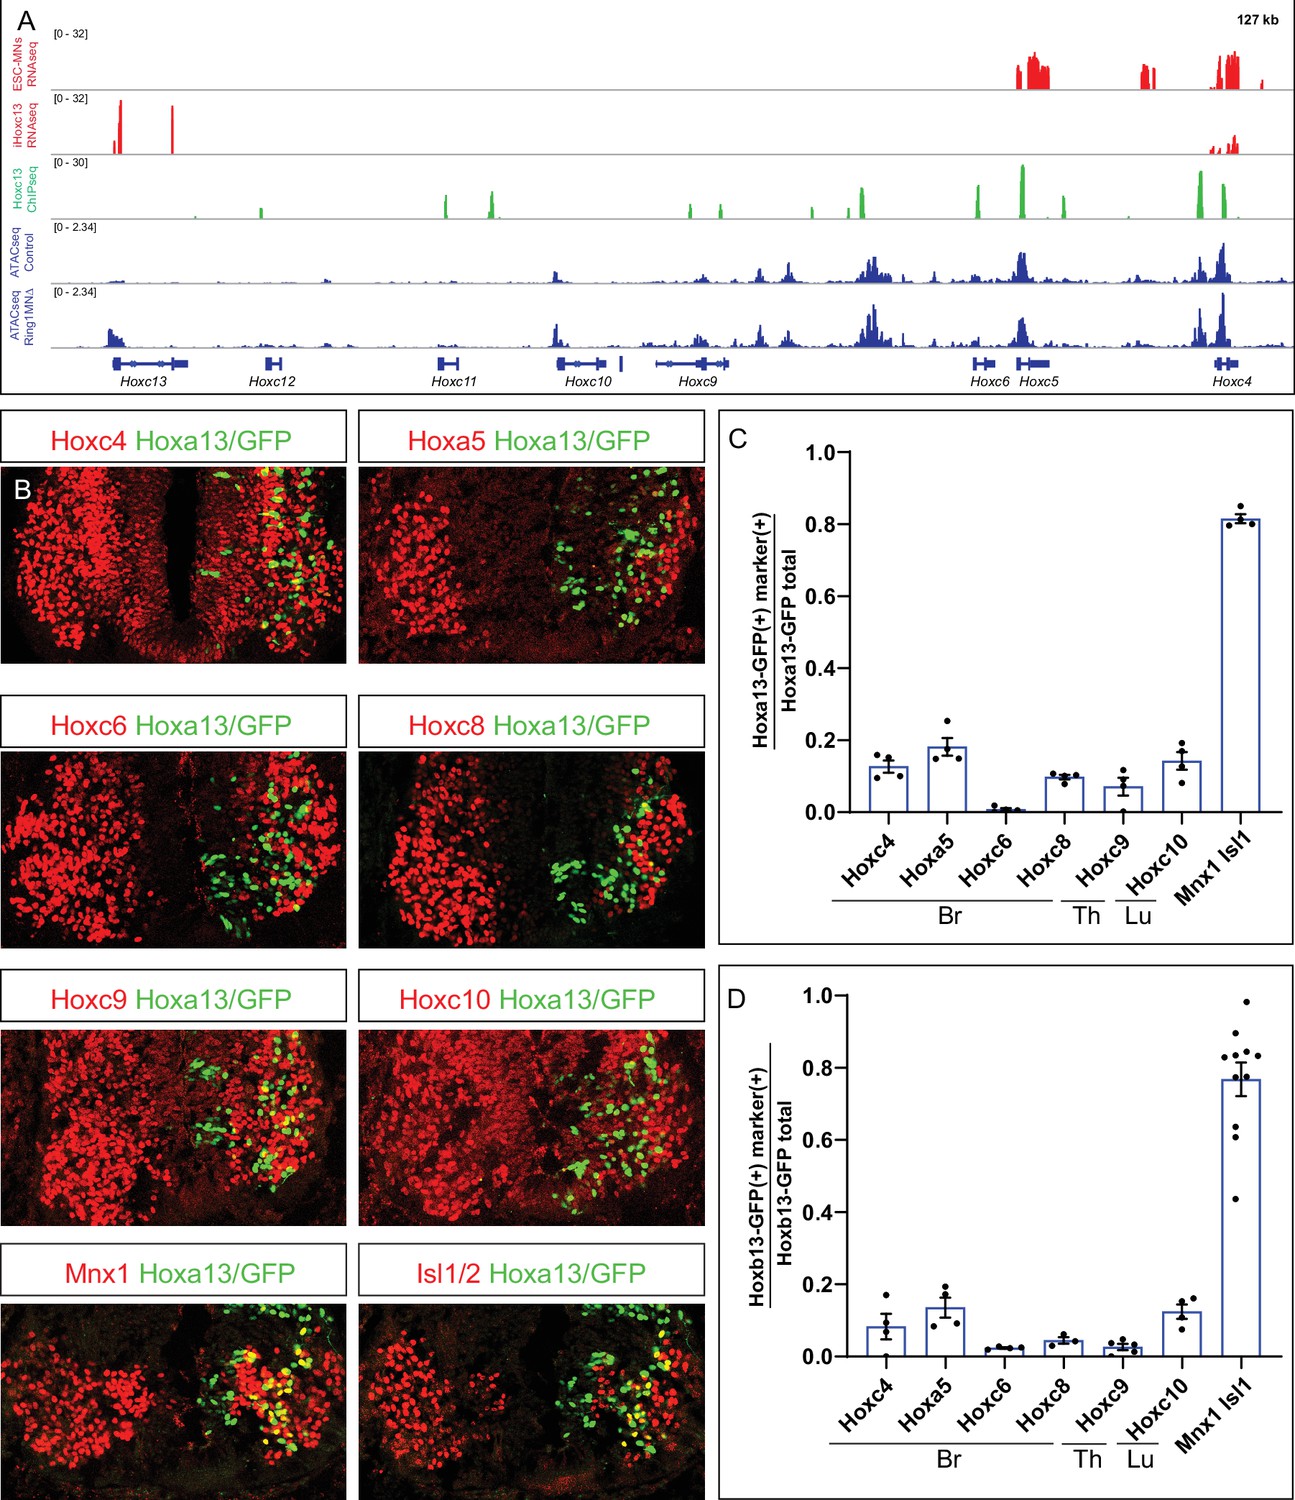
(A) Effects of Hoxc13 induction in ESC-MNs. Top panels show IGV browser views (log scale) of RNAseq (red) and ChIPseq tracks (green) at the HoxC cluster. Induced Hoxc13 binds near multiple HoxC genes and represses expression of Hoxc4 and Hoxc5. Bottom panels show ATACseq in brachial control and Ring1 mutant MNs at the HoxC cluster (blue). (B) Misexpression of Hoxa13-ires-nucGFP represses more rostral Hox genes. Hoxc4, Hoxa5, Hoxc6, and Hoxc8 were analyzed in brachial segments, Hoxc9 in thoracic segments, and Hoxc10 in lumbar segments. Mnx1 and Isl1 images are from brachial segments. (C,D) Quantification of percentage of electroporated cells which retained the expression of indicated Hox protein and MN markers upon Hoxa13 or Hoxb13 misexpression. Data in graphs show percentages of GFP+ neurons that express the markers indicated on x-axis. Data are from at least four embryos, four sections each embryo, and show mean ± SEM. Quantified electroporated cells were selected from the ventrolateral spinal cord, where MNs reside. Mnx1 and Isl1/2 quantification shows percentage of GFP+ neurons that express either marker, and taken from Br segments in panel C, and Br and Th segments in D.
-
Figure 7—source data 1
Quantification of Hoxa13- and Hoxb13-electroporated embryos.
- https://cdn.elifesciences.org/articles/72769/elife-72769-fig7-data1-v2.xlsx
Figure 7—figure supplement 1
Comparison of Hoxc13 binding and accessibility in control and Ring1MNΔ MNs.
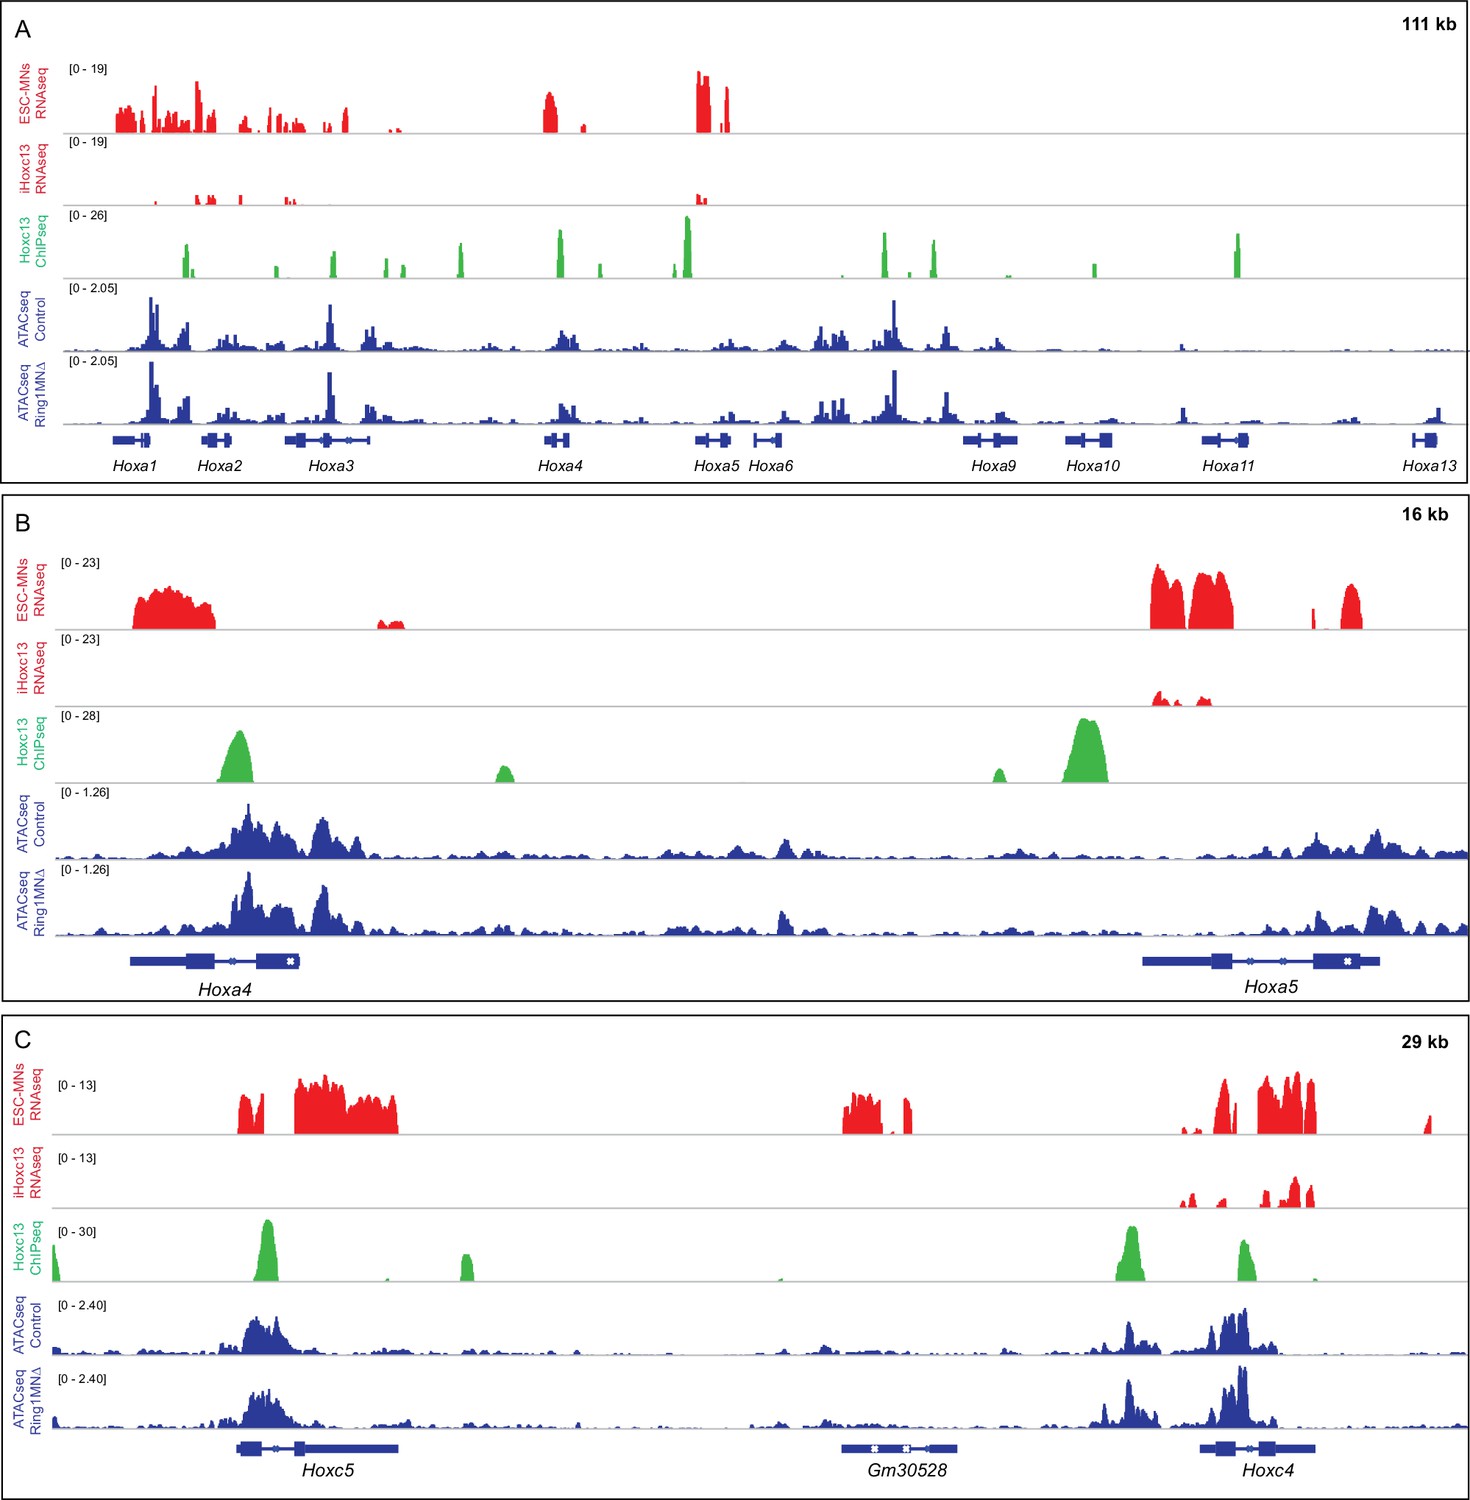
(A) Effects of Hoxc13 expression in ESC-MNs at the HoxA locus. Top panels show IGV browser views (log scale) of RNAseq (red) and ChIPseq tracks (green). Induced Hoxc13 represses expression of Hoxa1-Hoxa5 genes and binds near multiple HoxA genes. Bottom panels show ATACseq in brachial control and Ring1 mutant MNs at the HoxA cluster (blue). (B,C) Magnified views of Hoxc13 binding, RNA expression, and ATACseq results at Hox4-Hox5 genes in the HoxA and HoxC clusters.
Tables
Key resources table
| Reagent type (species) or resource | Designation | Source or reference | Identifiers | Additional information |
|---|---|---|---|---|
| Genetic reagent (M. musculus) | Ezh1flox/flox | PMID:23122289 | MGI:1097695 | |
| Genetic reagent (M. musculus) | Ezh2flox/flox | PMID:12496962 | MGI:107,940 | |
| Genetic reagent (M. musculus) | Olig2Cre | PMID:18046410 | MGI: 3774124 | |
| Genetic reagent (M. musculus) | Ring1-/-::Rnf2flox/flox | PMID:18039844, 11060235 | MGI:1101770, MGI:1101759 | |
| Genetic reagent (M. musculus) | Yaf2-/-::Rybpflox/flox | PMID:27705745 | MGI:1914307MGI:1929059 | |
| Genetic reagent (M. musculus) | Mnx1-GFP | PMID:10482234 | ||
| Biological sample (chicken eggs) | SPF Eggs | Charles River | 10100332 | |
| Antibody | Anti-Hoxc4 (Rabbit polyclonal) | PMID:16269338 | (1:16,000) | |
| Antibody | Anti-Hoxa5 (Rabbit polyclonal) | PMID:16269338 | (1:16,000) | |
| Antibody | Anti-Hoxc6 (Guinea pig polyclonal) | PMID:11754833 | RRID: AB_2665443 | (1:16,000) |
| Antibody | Anti-Hoxc6 (Rabbit polyclonal) | Aviva Systems Biology | Cat# ARP38484; RRID: AB_10866814 | (1:32,000) |
| Antibody | Anti-Hoxc8 (Mouse monoclonal) | Covance | RRID: AB_2028778 | (1:4000) |
| Antibody | Anti-Foxp1 (Rabbit polyclonal) | PMID:18662545 | RRID: AB_2631297 | (1:32,000) |
| Antibody | Anti-Isl1/2 (Guinea pig polyclonal) | Jessell lab | (1:10,000) | |
| Antibody | Anti-Rnf2 (Goat polyclonal) | Abcam | Cat# ab3832, RRID: AB_304100 | (1:2000) |
| Antibody | Anti-Rnf2 (Rabbit polyclonal) | Abcam | Cat# ab101273, RRID: AB_10711495 | (1:5000) |
| Antibody | Anti-Rybp (Rabbit monoclonal) | Abcam | Cat# ab185971 | (1:2000) |
| Antibody | Anti-Cbx2 (Rabbit polyclonal) | Bethyl | Cat# A302-524A, RRID:AB_1998943 | (1:5000) |
| Antibody | Anti-H3K27me3 (Rabbit polyclonal) | Cell Signaling | Cat# 9733, RRID: AB_2616029 | (1:2000) |
| Antibody | Anti-Hoxc9 (Guinea pig polyclonal) | PMID:20826310 | RRID:AB_2636809 | (1:64,000) |
| Antibody | Anti-Hoxc10 (Rabbit polyclonal) | PMID:31141687 | (1:64,000) | |
| Antibody | Anti-Hoxd10 (Guinea pig polyclonal) | Abcam | Cat# ab172865 | (1:16,000) |
| Antibody | Anti-Nos (Rabbit polyclonal) | Immunostar | Cat# 24431, RRID:AB_572255 | (1:10,000) |
| Antibody | Anti-Raldh2 (Guinea pig polyclonal) | PMID:18662545 | RRID: AB_2631299 | (1:32,000) |
| Antibody | Anti-Scip (Rabbit polyclonal) | PMID:28190640 | RRID:AB_2631304 | (1:8000) |
| Antibody | Anti-Lhx3 (Rabbit polyclonal) | Jessell lab | (1:16,000) | |
| Antibody | Anti-Mnx1 (Mouse monoclonal) | DSHB | Cat# MNR2, RRID: AB_2314625 | (1:100) |
| Antibody | Anti-GFP (Rabbit polyclonal) | Invitrogen | Cat# A-6455, RRID: AB_221570 | (1:5000) |
| Antibody | Anti-DIG AP | Sigma-Aldrich | Cat# 11093274910, RRID: AB_2734716 | (1:5000) |
| Recombinant DNA reagent | pGEM-Mnx1-Rybp(plasmid) | This paper | See Materials and methods, and Figure 1U legend | |
| Recombinant DNA reagent | pGEM-Mnx1-Cbx2(plasmid) | This paper | See Materials and methods, and Figure 1U legend | |
| Recombinant DNA reagent | pCAGGS-mouseHoxa13-IRES2-nucEGFP(plasmid) | This paper | See Materials and methods, and Figure 7B legend | |
| Recombinant DNA reagent | pCAGGS-mouseHoxb13-IRES2-nucEGFP(plasmid) | This paper | See Materials and methods, and Figure 7B and D legend | |
| Commercial assay or kit | DIG RNA Labeling Kit | Sigma-Aldrich | Cat# 11175025910 | |
| Commercial assay or kit | One Taq One-Step RT-PCR | NEB | Cat# E5315S | |
| Commercial assay or kit | SMARTer Stranded RNA-Seq Kit | Takara | Cat# 634,837 | |
| Commercial assay or kit | Nextera XT DNA Library Preparation Kit | Illumina | Cat# FC-121–1,030 | |
| Commercial assay or kit | Papain Dissociation System | Worthington | PDS | |
| Commercial assay or kit | Arcturus Picopure RNA Isolation Kit | Applied Biosystems | KIT0204 | |
| Commercial assay or kit | NEBNext High-Fidelity 2 X PCR Master Mix | NEB | M0541S | |
| Commercial assay or kit | Qiagen MinElute | Qiagen | 28,204 | |
| Chemical compound, drug | Glycergel | Agilent | Cat# C0563 | |
| Chemical compound, drug | AMPure XP | Beckman Coulter Life Sciences | A63881 | |
| Chemical compound, drug | Turbo DNase | Invitrogen | AM2238 | |
| Chemical compound, drug | SYBR Green I Nucleic Acid Gel Stain | Invitrogen | S7563 | |
| Software, algorithm | Integrative Genomics Viewer | RRID: SCR_011793 | https://software.broadinstitute.org/software/igv/ | |
| Software, algorithm | Picard | RRID: SCR_006525 | ||
| Software, algorithm | BEDTools | RRID:SCR_006646 | https://github.com/arq5x/bedtools2, Quinlan, 2021 | |
| Software, algorithm | GraphPad Prism | GraphPad Software | RRID: SCR_002798 | https://www.graphpad.com/ |
| Software, algorithm | MACS | RRID: SCR_013291 | https://github.com/macs3-project/MACS, Liu, 2021 |
Additional files
-
Supplementary file 1
DeSeq2 counts of RNA isolated from purified MNs of control and Ring1 mutant embryos.
- https://cdn.elifesciences.org/articles/72769/elife-72769-supp1-v2.xlsx
-
Supplementary file 2
ATACseq counts from purified MNs of control and Ring1 mutant embryos.
- https://cdn.elifesciences.org/articles/72769/elife-72769-supp2-v2.xlsx
-
Transparent reporting form
- https://cdn.elifesciences.org/articles/72769/elife-72769-transrepform1-v2.docx
Download links
A two-part list of links to download the article, or parts of the article, in various formats.
Downloads (link to download the article as PDF)
Open citations (links to open the citations from this article in various online reference manager services)
Cite this article (links to download the citations from this article in formats compatible with various reference manager tools)
PRC1 sustains the integrity of neural fate in the absence of PRC2 function
eLife 11:e72769.
https://doi.org/10.7554/eLife.72769


