Intracellular glycosyl hydrolase PslG shapes bacterial cell fate, signaling, and the biofilm development of Pseudomonas aeruginosa
- Frontiers Science Center for Synthetic Biology and Key Laboratory of Systems Bioengineering (Ministry of Education), School of Chemical Engineering and Technology, Tianjin University, China
- State Key Laboratory of Microbial Resources, Institute of Microbiology, Chinese Academy of Sciences, China
- University of Chinese Academy of Sciences, China
Figures
Figure 1 with 1 supplement
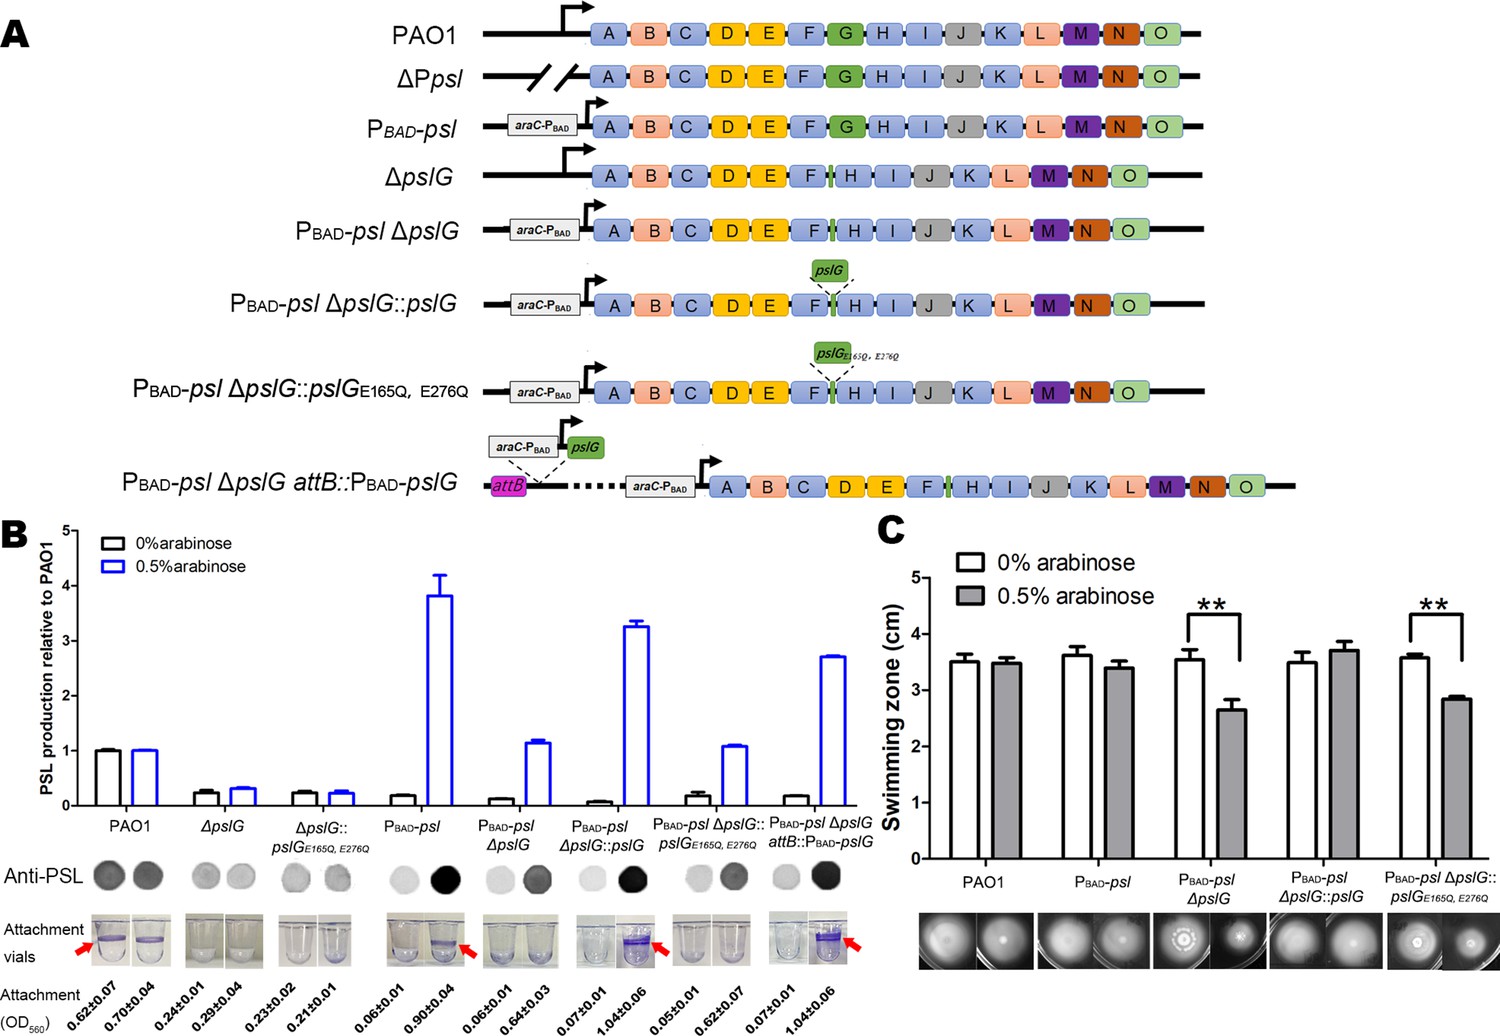
Inducing PSL production in ΔpslG background cannot recover its defects on bacterial initial attachment and yet affects swimming motility.
(A): A schematic of the psl operon in PAO1 and its corresponding mutants used in this study. Genes pslA-O are shown in boxes (not to scale). Angled lines represent the extent of deleted sequence, and black arrows indicate transcriptional start sites (not to scale). (B): The Psl production of tested strains inducing with 0% or 0.5% arabinose. The amount of Psl was determined by immune-dot blotting and normalized to the level of PAO1. A representative of dot blotting as well as corresponding microtiter dish wells and their crystal violet (CV) reading (OD560) posted CV staining in attachment assay were shown under each corresponding column. Arrows indicate the ring at air-liquid interface. (C): The swimming motility of tested strains inducing with 0% or 0.5% arabinose. The corresponding image of swimming zone was shown under each column. Statistical significances were measured using student’s t-test (**, p < 0. 01).
-
Figure 1—source data 1
Figure 1B, C source data.
- https://cdn.elifesciences.org/articles/72778/elife-72778-fig1-data1-v3.xlsx
Figure 1—figure supplement 1
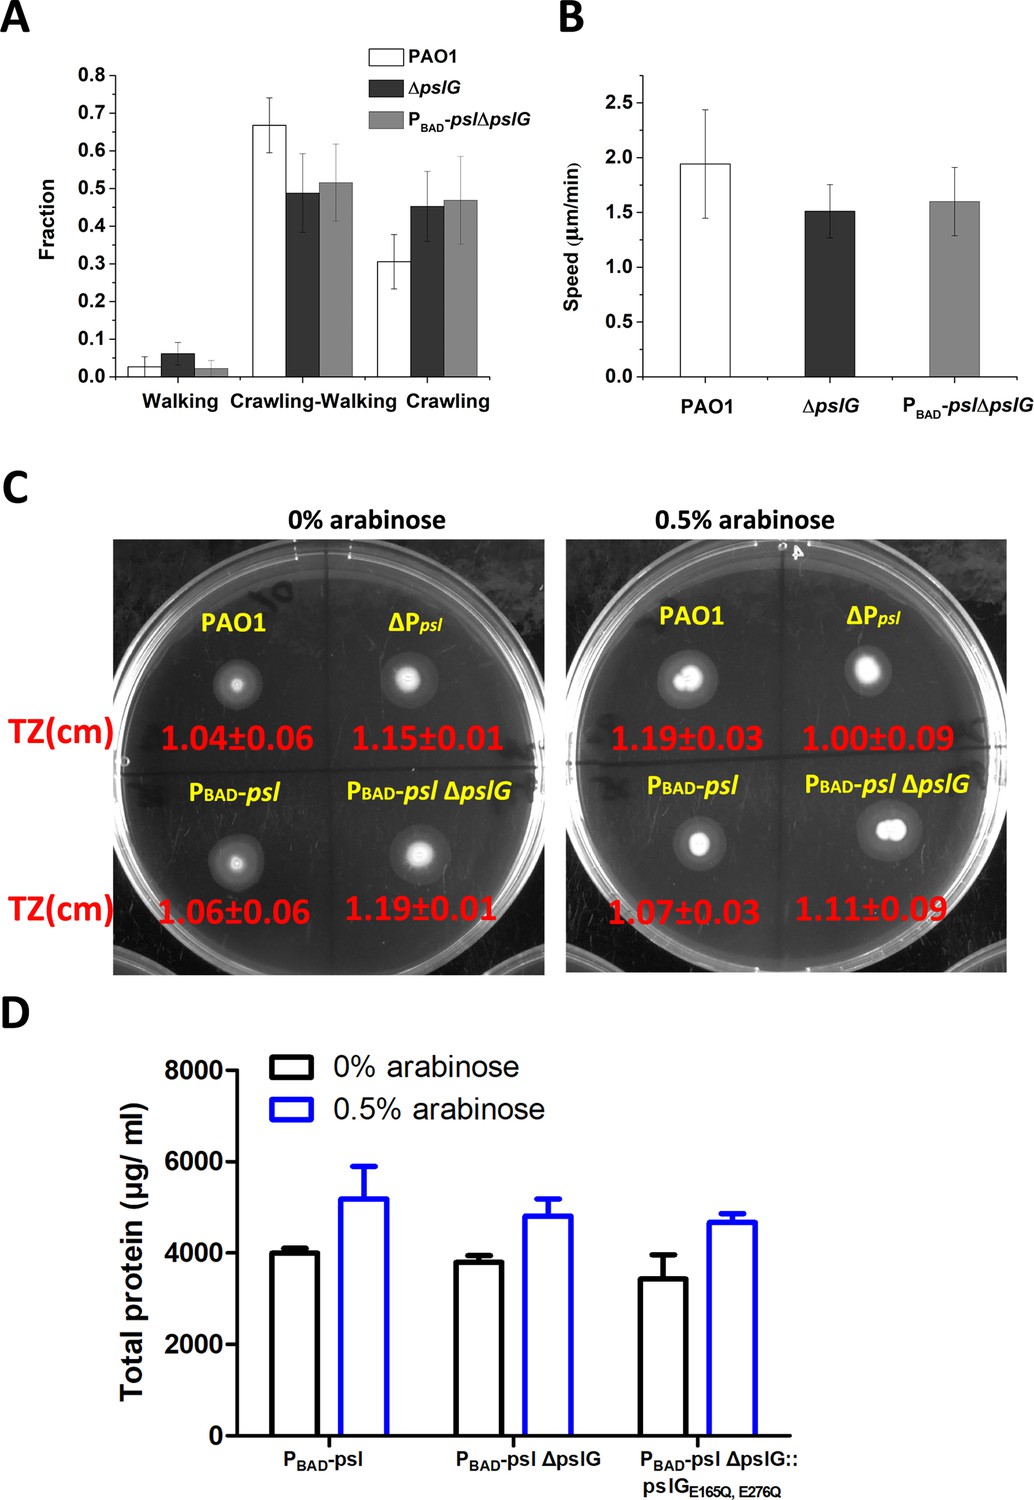
The influence of ΔpslG on T4P-driven twitching motility.
(A): Fractions of cells that crawl only, walk only and both crawl and walk for PAO1, ΔpslG and PBAD-pslΔpslG, obtained by tracking bacterial walking and crawling on the glass surfaces of flow-cell systems. (B): Speed of cell twitching for PAO1, ΔpslG and PBAD-pslΔpslG. The number of analyzed cells is n = 496 for PAO1, n = 256 for ΔpslG and n = 576 for PBAD-pslΔpslG. (C): The effect of ΔpslG on the size of twitching zone (TZ). (D):Comparison of total protein of PBAD-psl, PBAD-pslΔpslG, and ΔpslG::pslGE165Q,E276Q strains post 24 hr growth with or without arabinose.
Figure 2
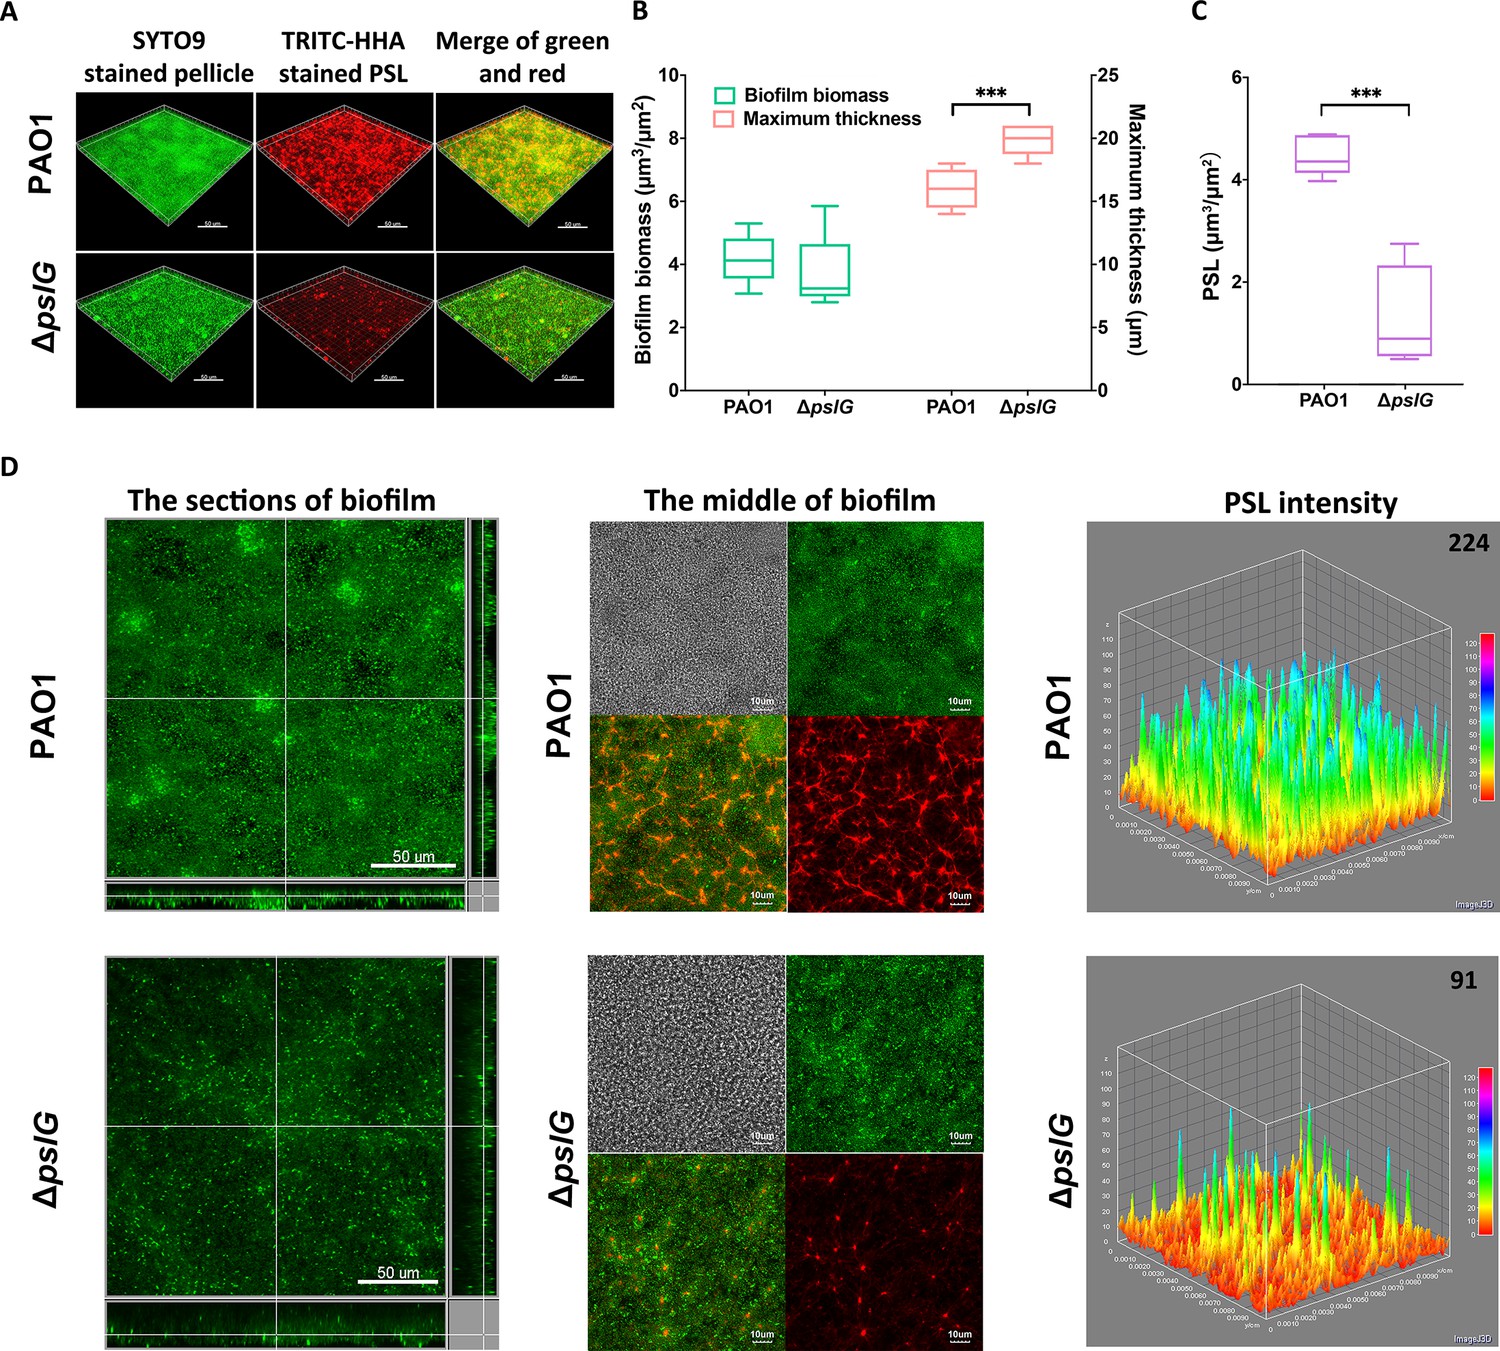
Comparison of pellicles formed by PAO1 and ΔpslG mutant.
(A): Three-dimensional images of 24 hr air-liquid interface biofilms (pellicles) formed by PAO1 and ΔpslG. (B): Biofilm biomass and maximum thickness of PAO1 or ΔpslG strain. (C): PSL in pellicles of PAO1 and ΔpslG. (D): Typical section images of pellicles formed by PAO1 and ΔpslG. Left panel, section images showed the top-down view (square) and side view (rectangle) of corresponding pellicles. Middle panel, section images at the middle of corresponding pellicles. The distribution of bacteria (green), the fibre-like PSL matrix (red) and corresponding DIC images (grey) were shown. Right panel, PSL fluorescence intensity in corresponding biofilm images shown in the middle panel (the average intensity of PSL in per μm3 biofilm is shown in the upper right corner). Green, SYTO9 stained bacteria, Red, TRITC-HHA stained PSL. Statistical significances were measured using student’s t-test (***, p < 0.001 when compared to PAO1). Scale bar: 50 μm for A and the left panel in (D); 10 μm for the middle panel in D.
-
Figure 2—source data 1
Figure 2B, C source data.
- https://cdn.elifesciences.org/articles/72778/elife-72778-fig2-data1-v3.xlsx
Figure 3 with 3 supplements
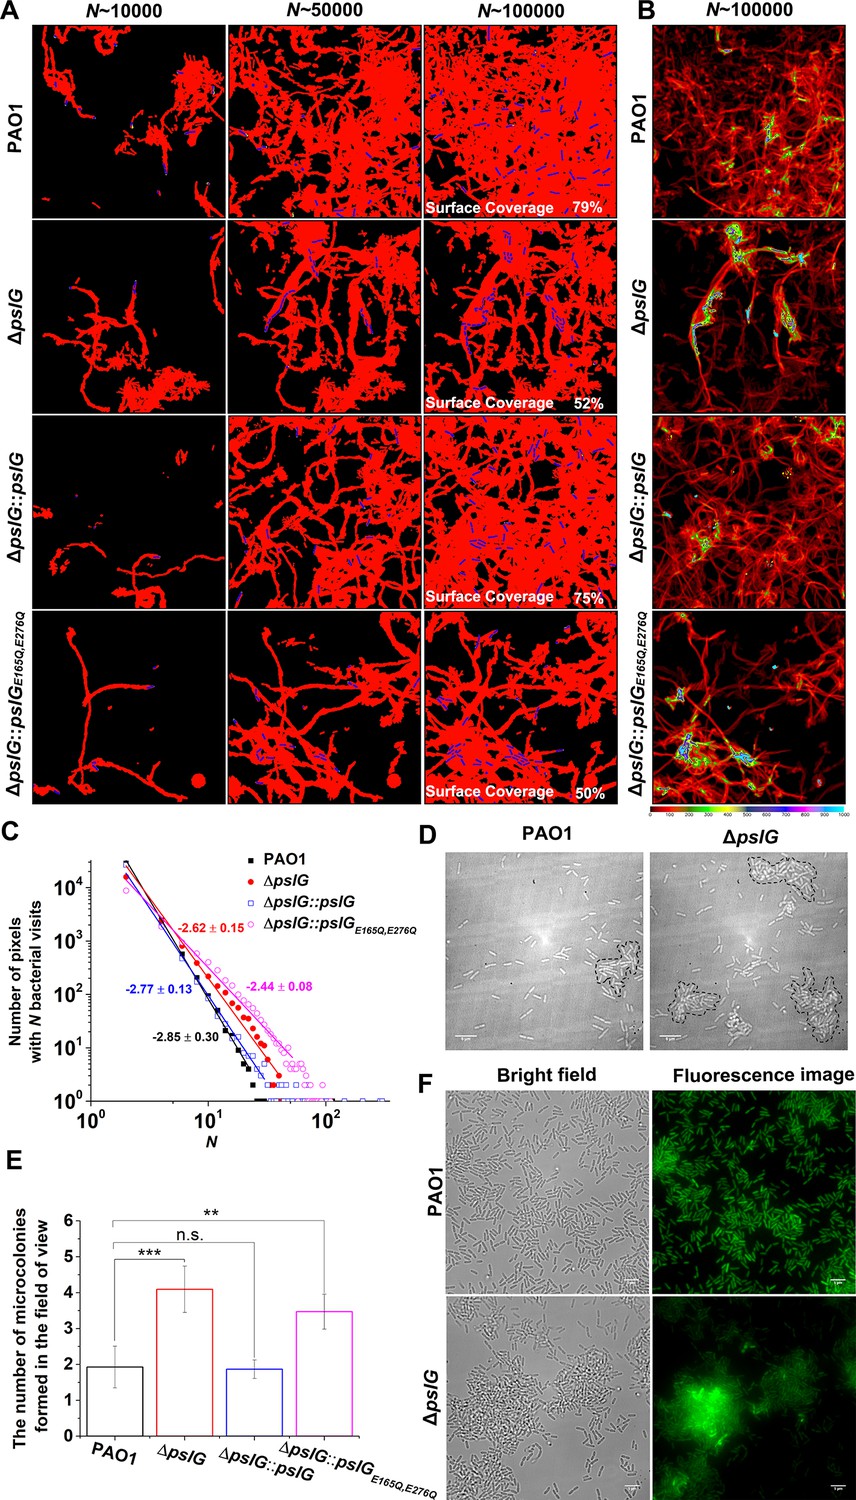
Effects of pslG on the formation of microcolonies in flow-cell systems.
(A): Surface coverage maps at a total of 10,000, 50,000, and 100,000 bacterial visits for PAO1, ΔpslG, ΔpslG::pslG, and ΔpslG::pslGE165Q,E276Q cells. Red color indicates the surface area that has been visited or contaminated, while black color indicates a ‘fresh’ surface area. Bacteria in the current frame are shown in blue. The surface coverage in the figure is the result of an experiment. (B): The intensity map of bacterial visits at N ~ 100,000. The color scale of black to cyan represents bacterial visits of 0–1,000. (C): The graph displays one measurement result for the visit frequency distributions of PAO1, ΔpslG, ΔpslG::pslG and ΔpslG::pslGE165Q,E276Q at N ~ 100,000. The slope in the figure is the fitting result of an experiment. (D): Examples of microcolonies (enclosed by dash lines) formed by PAO1 and ΔpslG cells, respectively, cultured in a flow cell for about 8 hr. (E): The number of microcolonies in the field of view formed by PAO1, ΔpslG, ΔpslG::pslG and ΔpslG::pslGE165Q,E276Q at 10 hr after inoculation in a flow cell. The number (N) of frames analyzed are 14, 43, 52, and 51 for PAO1, ΔpslG, ΔpslG::pslG, and ΔpslG::pslGE165Q,E276Q, respectively. Error bars represent standard deviations of the means. Statistical significances were measured using one-way ANOVE. n.s., not significant; *p < 0.05; **p < 0.001; ***p < 0.0001. F. Snapshots taken at 10 hr after inoculation in a flow cell, showing the microcolonies formed by ΔpslG and PAO1. Bacteria were tagged by GFP. Fluorescence images and corresponding bright-field images were shown. Scale bar, 5 μm.
-
Figure 3—source data 1
Figure 3C source data.
- https://cdn.elifesciences.org/articles/72778/elife-72778-fig3-data1-v3.xlsx
-
Figure 3—source data 2
Figure 3E source data.
- https://cdn.elifesciences.org/articles/72778/elife-72778-fig3-data2-v3.xlsx
Figure 3—figure supplement 1
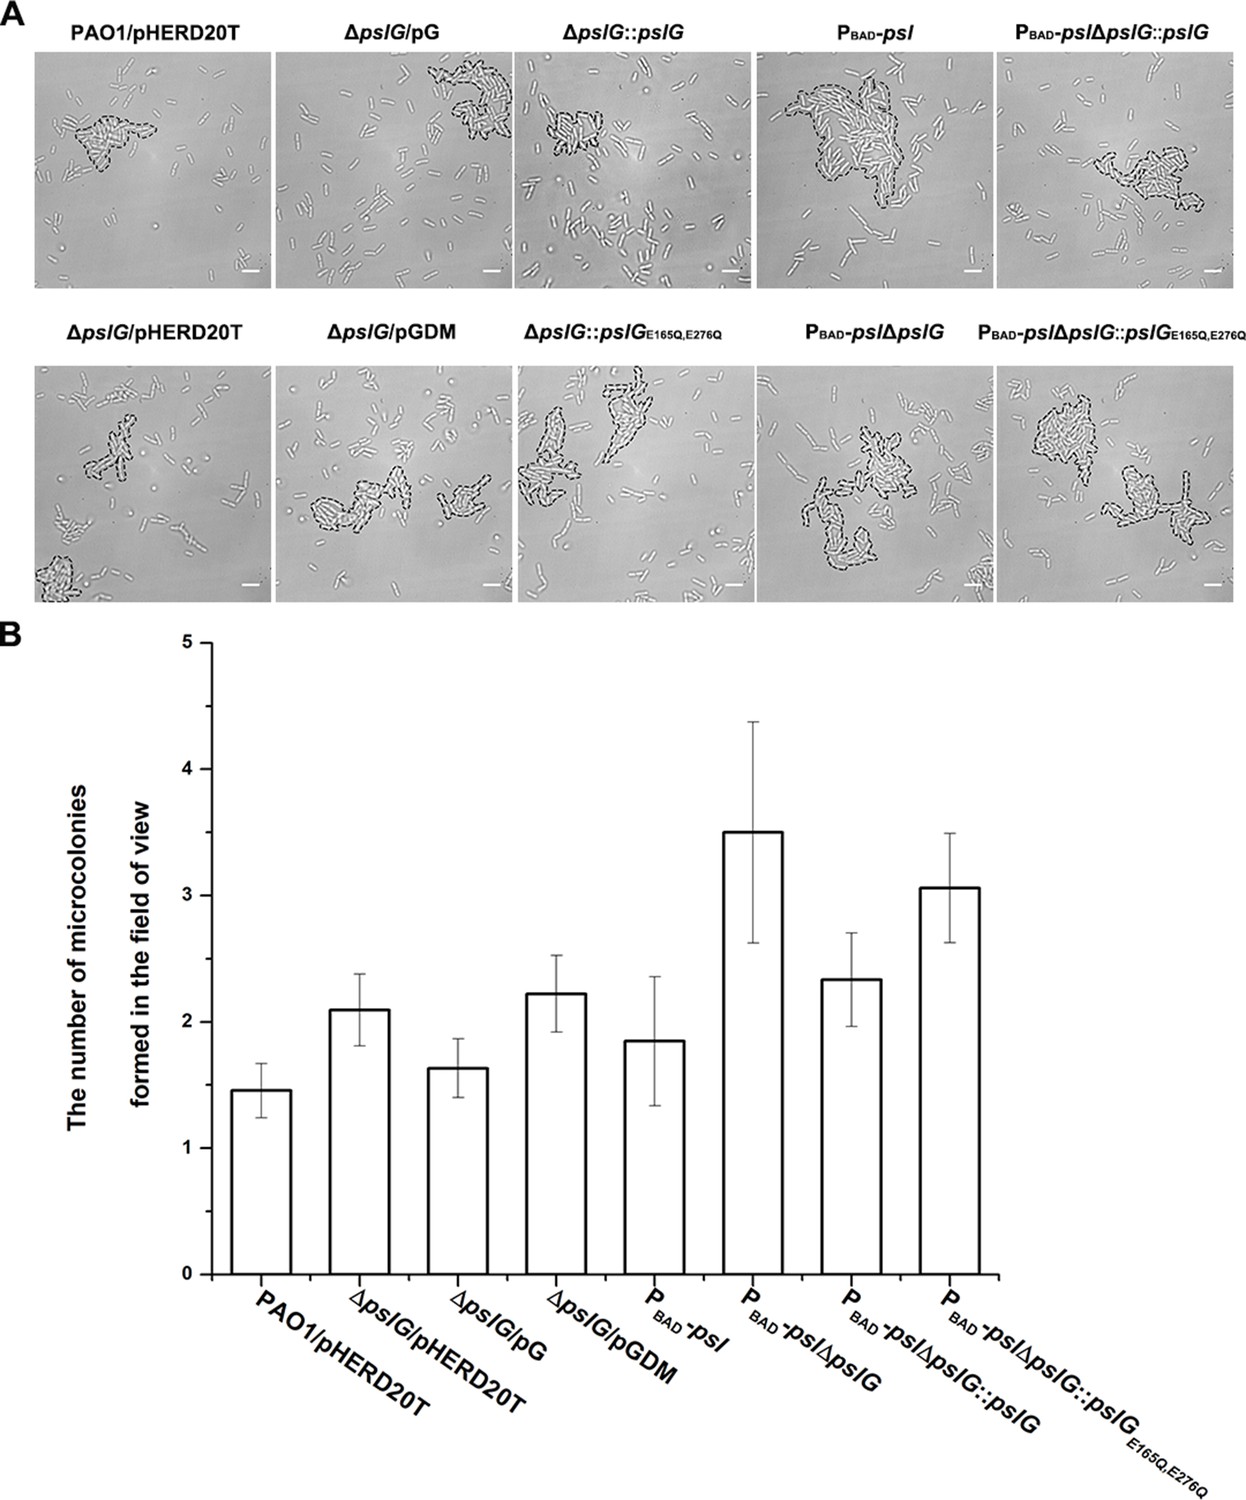
The microcolonies formed in flow-cell systems by tested strains.
(A): Examples of microcolonies (enclosed by dash lines) formed by PAO1/pHERD20T, and ΔpslG/pHERD20T, ΔpslG/pG and ΔpslG/pGDM; PBAD-psl and PBAD-pslΔpslG, PBAD-pslΔpslG::pslG and PBAD-pslΔpslG::pslGE165Q, E276Q cultured in a flow cell for about 8 hr. (B): The number of microcolonies in the field of view formed by PAO1/pHERD20T, and ΔpslG/pHERD20T, ΔpslG/pG and ΔpslG/pGDM, PBAD-psl and PBAD-pslΔpslG, PBAD-pslΔpslG::pslG and PBAD-pslΔpslG::pslG E165Q, E276Q at 10 hr after inoculation in a flow cell. Scale bar, 5 μm.
Figure 3—figure supplement 2
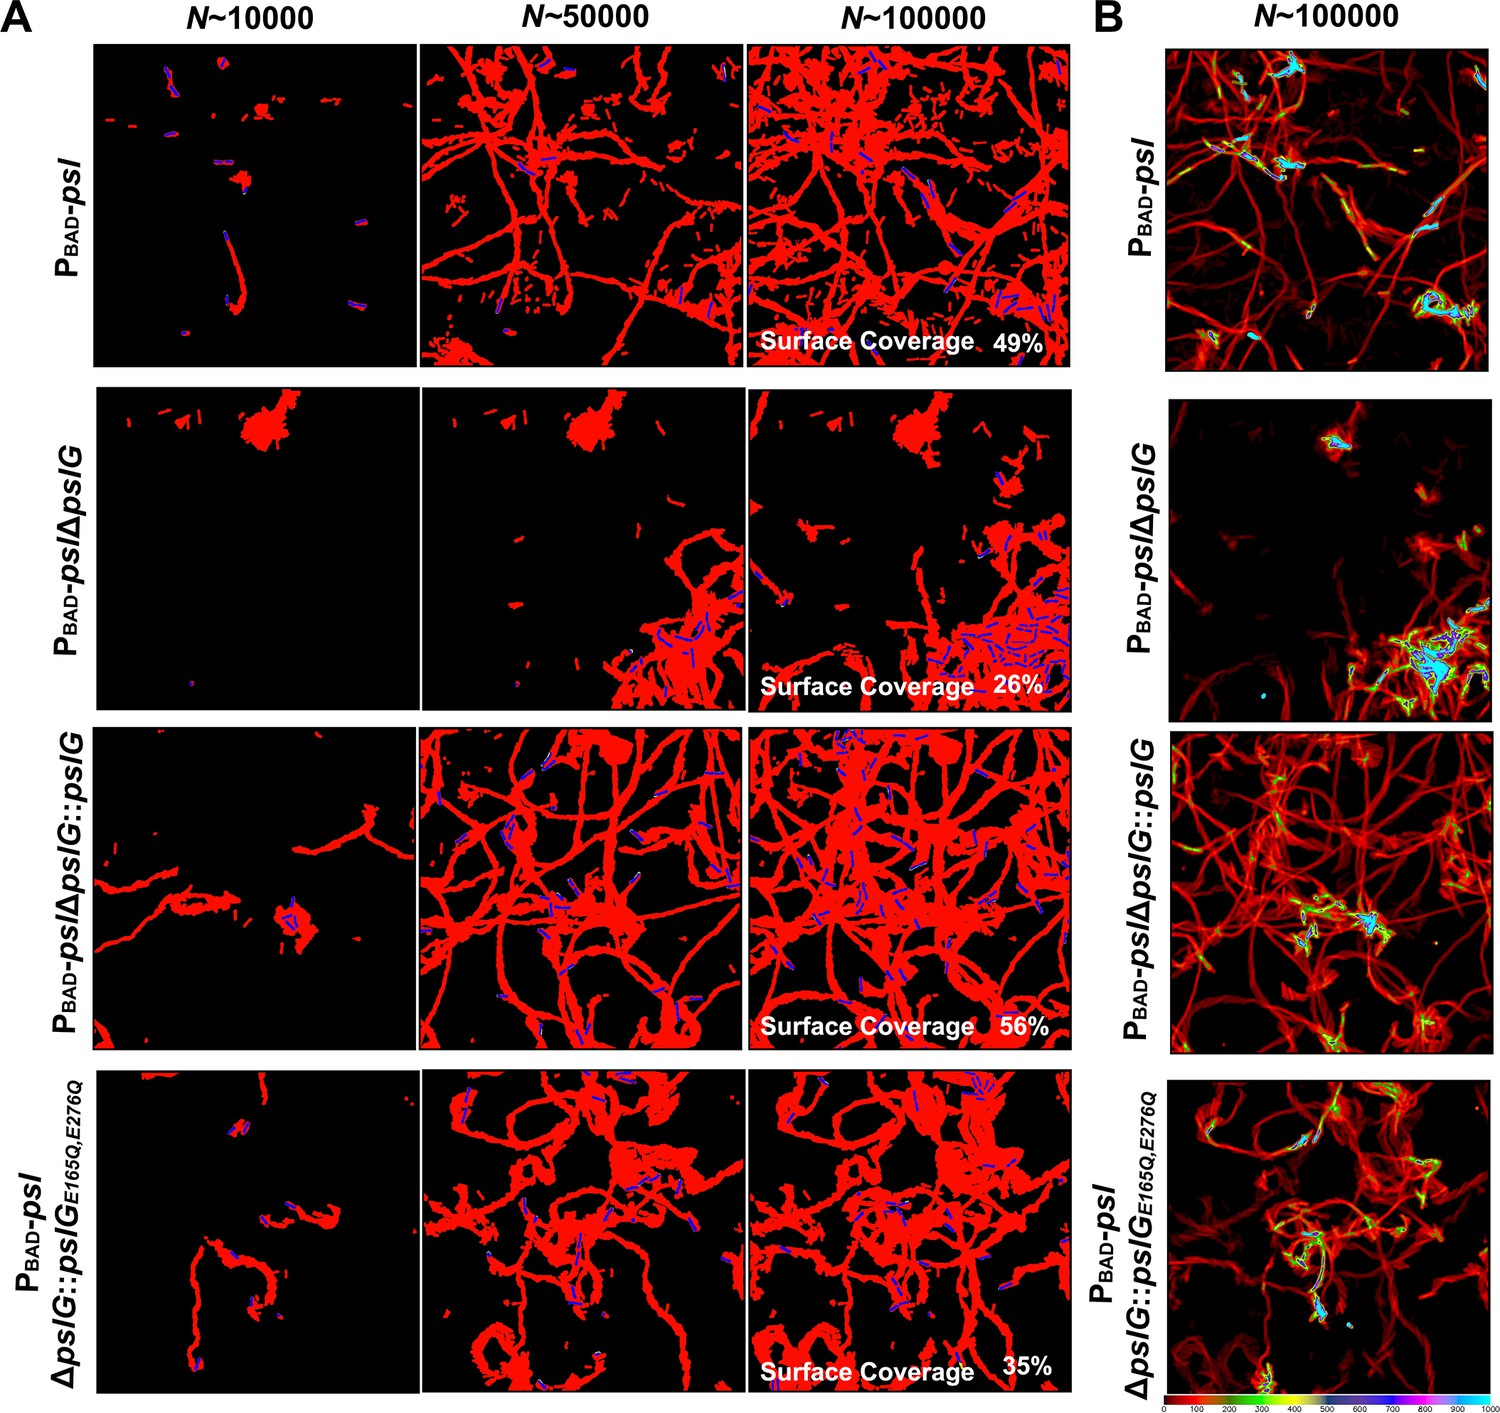
Effects of pslG deletion in PBAD-psl background on the formation of microcolonies in flow-cell systems.
(A): Surface coverage maps at a total of 10,000, 50,000, and 100,000 bacterial visits for PBAD-psl, PBAD-pslΔpslG, PBAD-pslΔpslG::pslG, and PBAD-pslΔpslG::pslGE165Q,E276Q cells. Red color indicates the surface area that has been visited or contaminated, while black color indicates a ‘fresh’ surface area. Bacteria in the current frame are shown in blue. The surface coverage in the figure is the result of an experiment. (B): The intensity map of bacterial visits at N ~ 100,000. The color scale of black to cyan represents bacterial visits of 0–1000.
Figure 3—figure supplement 3
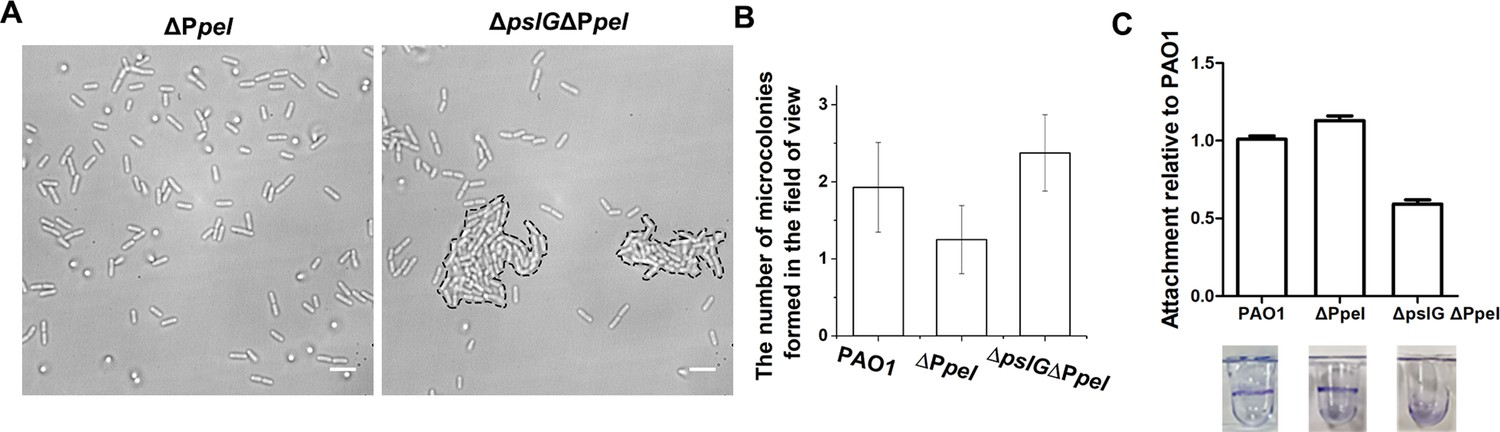
The microcolony formation and initial attachment of ΔPpel, and ΔpslGΔPpel strains.
(A): A representative image of microcolonies (enclosed by dash lines) formed by ΔpslGΔPpel in a flow cell for 8 hr, but there is no microcolony formed by ΔPpel cultured at the same condition. (B): The number of microcolonies in the field of view formed by PAO1, ΔPpel, and ΔpslGΔPpel at 10 hr after inoculation in a flow cell. (C): The initial attachment of PAO1, ΔPpel, and ΔpslGΔPpel. A representative image of corresponding wells was shown under each column.
Figure 4 with 1 supplement
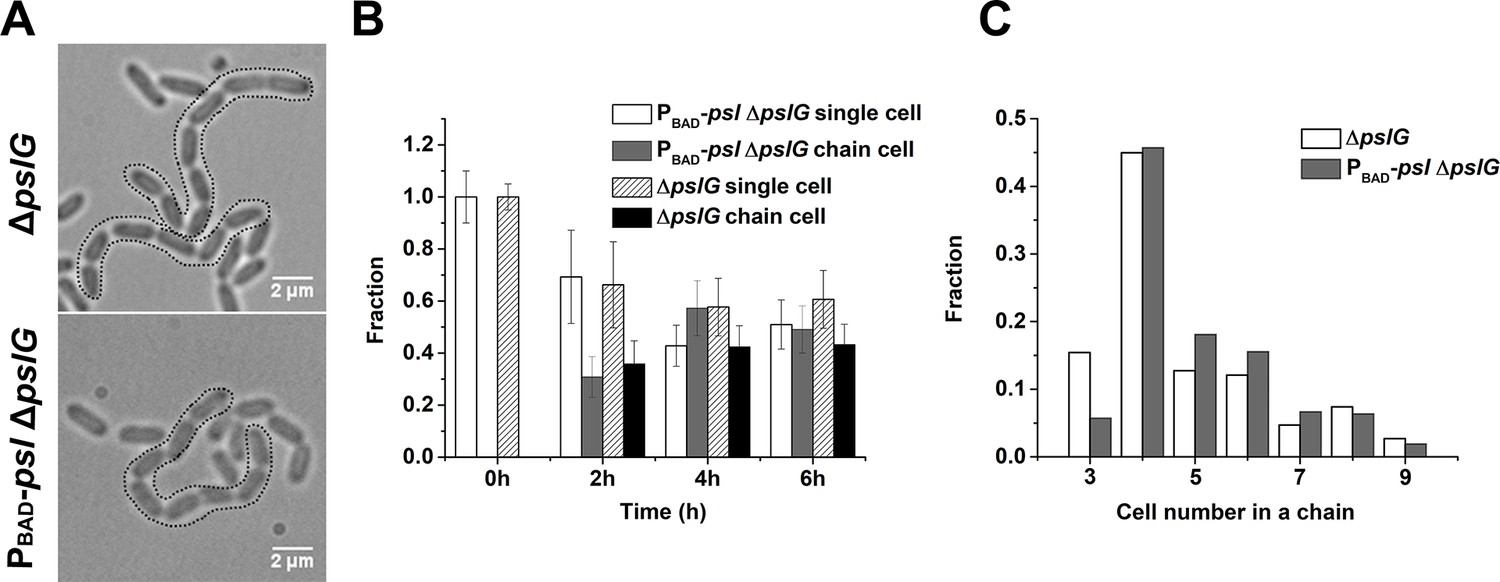
Characterization of long bacterial chains of ΔpslG strains.
(A): Examples of long bacterial chains (indicated by black dotted outlines) formed by ΔpslG and PBAD-pslΔpslG cells. (B): The faction of single isolated bacterial cell and cell in chains at different time points after inoculation in a flow cell. The number of analyzed picture in each strain is n = 88 (about 3200 cells) for PBAD-pslΔpslG and n = 87 (about 3500 cells) for ΔpslG. (C): The number distribution of cells consisted in a chain. The number of analyzed cells is n = 301 for PBAD-pslΔpslG and n = 322 for ΔpslG. Scale bar, 2 μm.
-
Figure 4—source data 1
Figure 4B source data.
- https://cdn.elifesciences.org/articles/72778/elife-72778-fig4-data1-v3.xlsx
-
Figure 4—source data 2
Figure 4C source data.
- https://cdn.elifesciences.org/articles/72778/elife-72778-fig4-data2-v3.xlsx
Figure 4—figure supplement 1
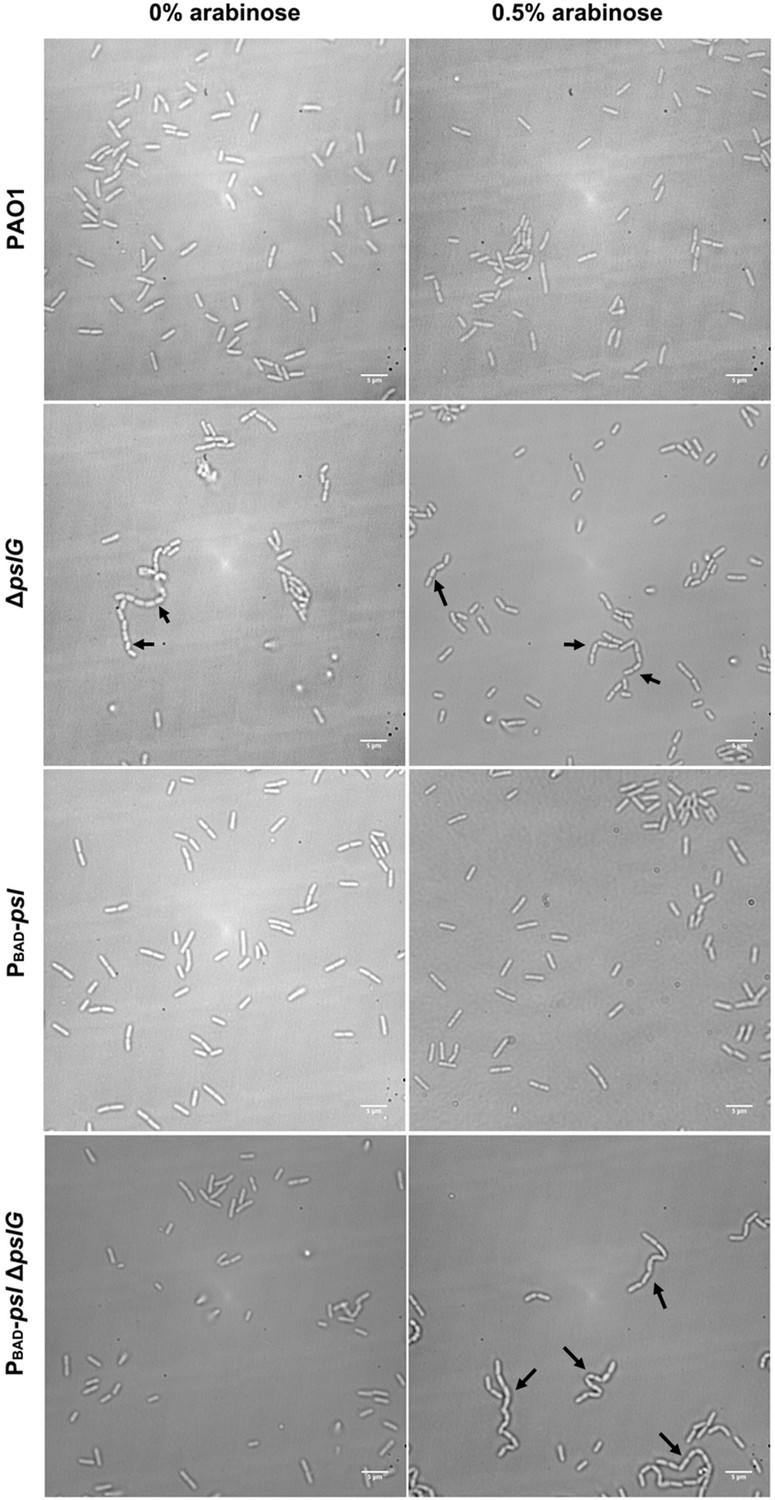
Examples of PAO1, ΔpslG, PBAD-psl and PBAD-pslΔpslG cells grown under 0% arabinose and 0.5% arabinose.
Under both conditions, long bacterial chains are observed in ΔpslG, but not in PAO1 and PBAD-psl; while in PBAD-pslΔpslG, long chains of cells are observed under 0.5% arabinose but not under 0% arabinose. Black arrows indicate the chains of bacterial, Scale bar, 5 μm.
Figure 5 with 3 supplements
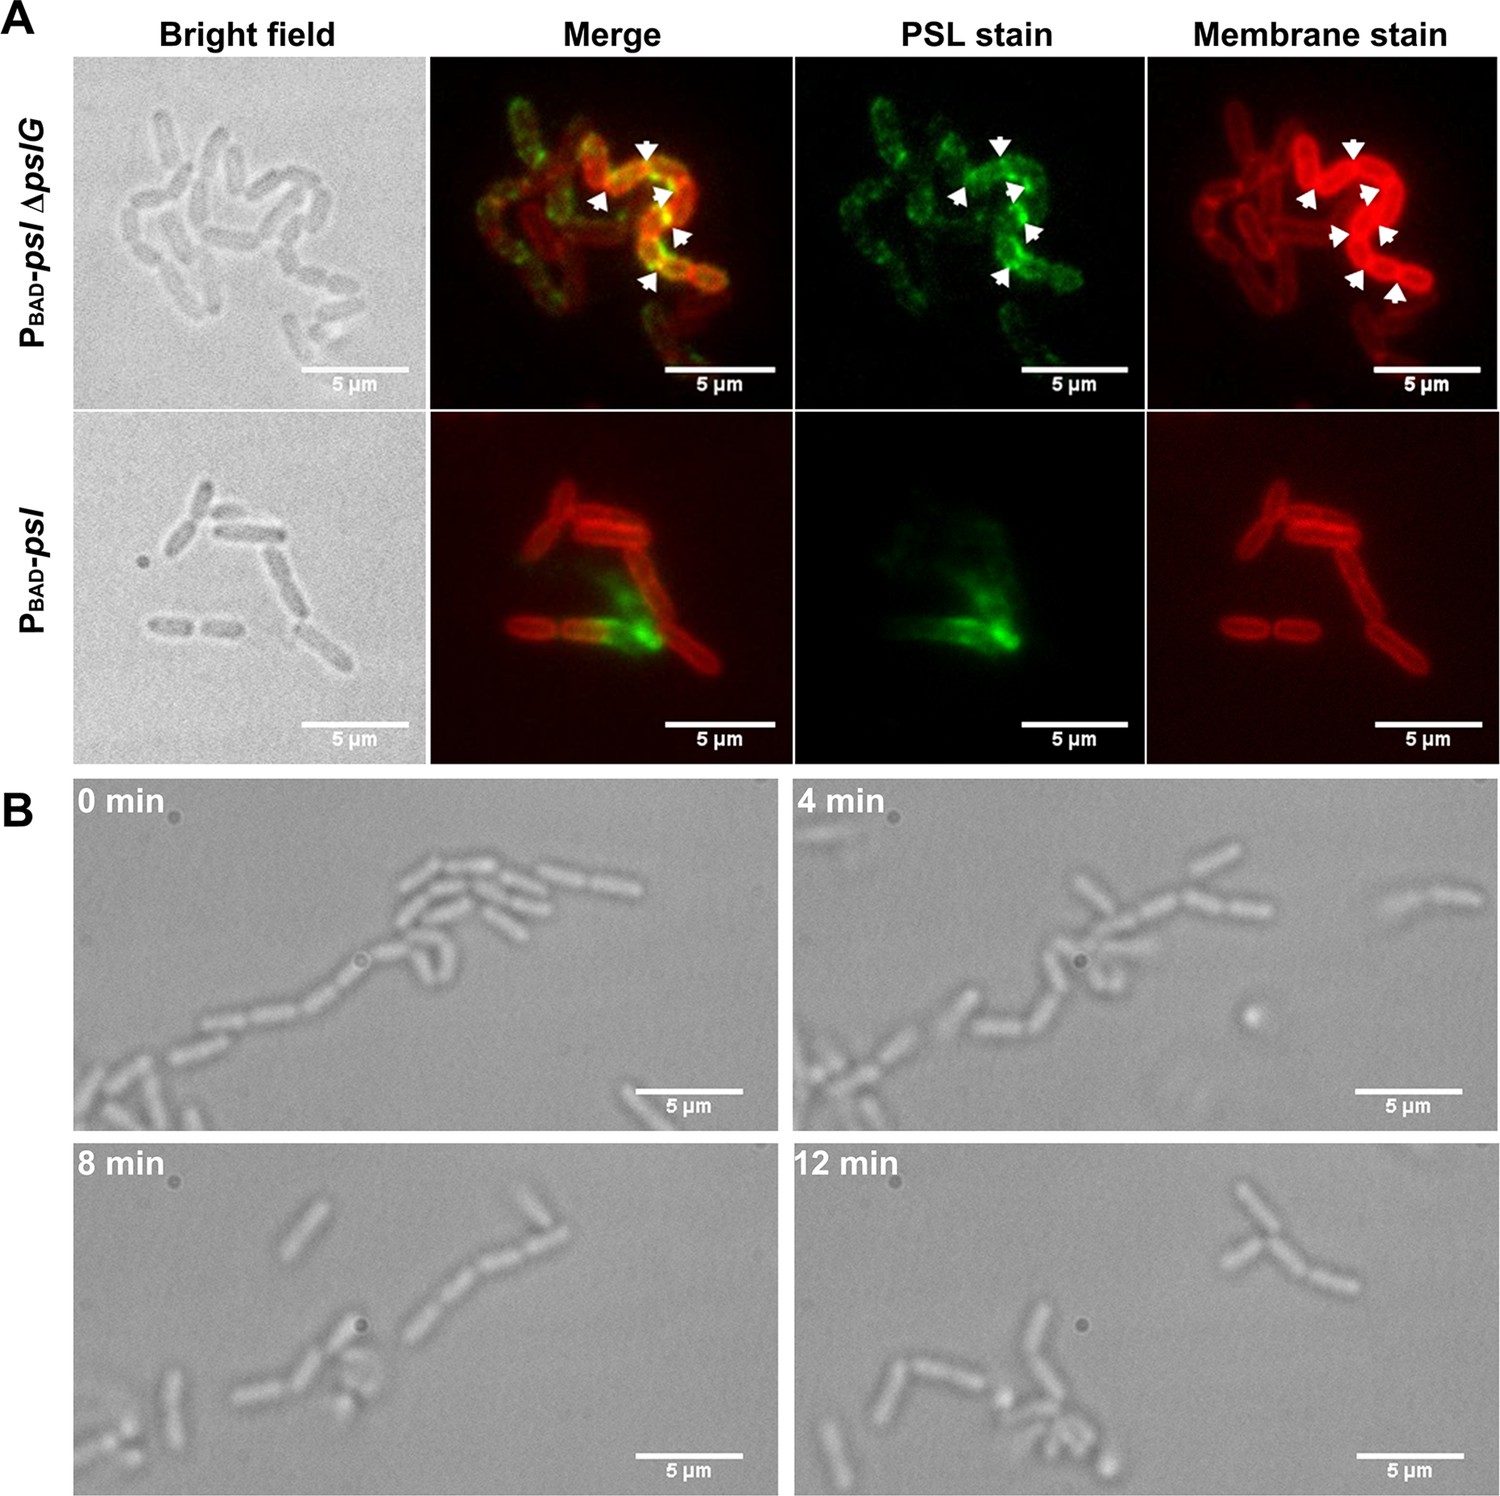
Cells in bacterial chains are connected by PSL and can be disassembled by PslG supplied exogenously.
(A): Fluorescence staining of long bacterial chains formed by PBAD-pslΔpslG cells. Staining of control samples of PBAD-psl is also shown. Green shows PSL stained by FITC-HHA, and red shows the bacterial cell membranes stained by FM4-64. Arrows in the PSL stain image indicate the bright spotted PSL locations, and arrows in the membrane stain image show the septum locations. (B): Time–lapse images show the break-up process of long bacterial chains of PBAD-pslΔpslG when PslG was supplied. Scale bar, 5 μm.
Figure 5—figure supplement 1
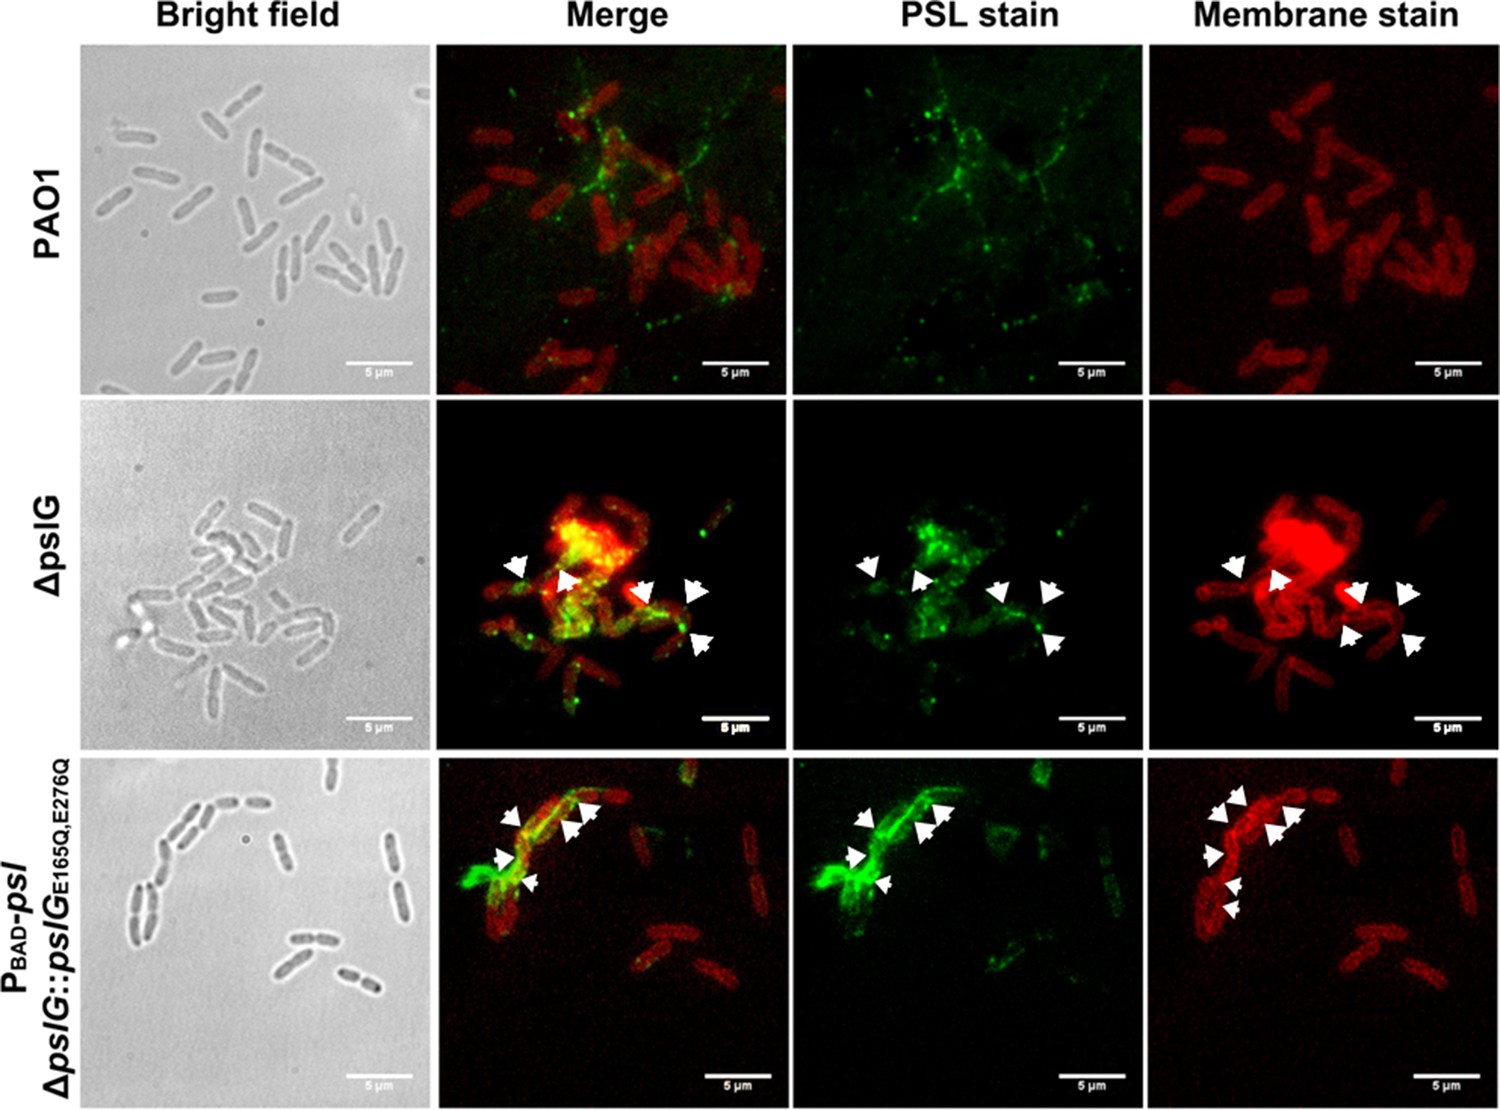
Representative PSL and membrane double staining images of PAO1 and pslG mutants grown in flow-cell systems.
Green shows PSL stained by FITC-HHA, and red shows the plasma membranes stained by FM4-64.
Figure 5—figure supplement 2
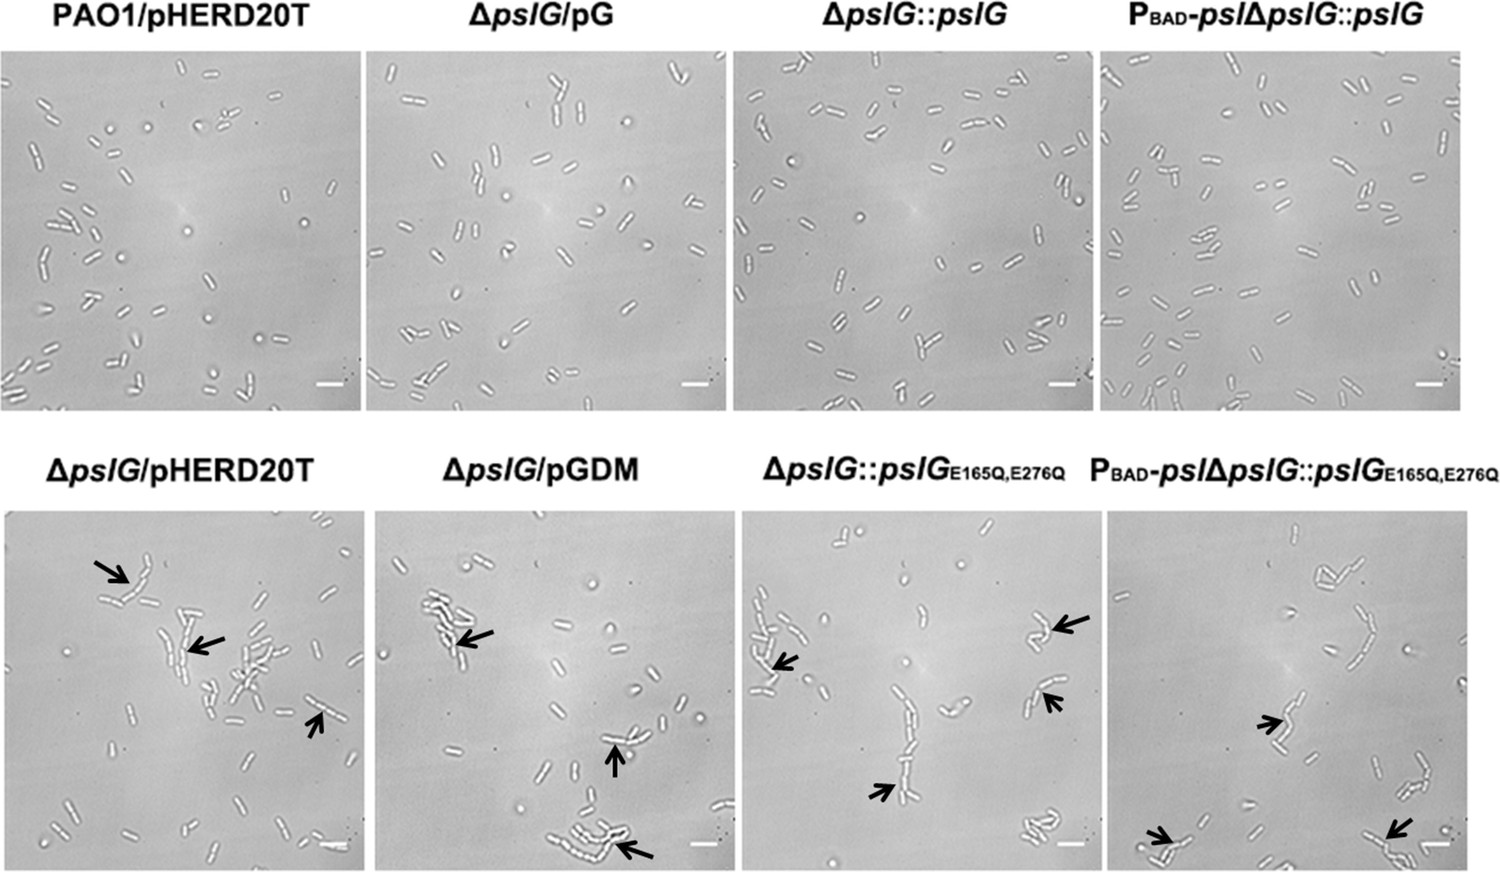
Bacterial morphology of PAO1/pHERD20T, ΔpslG/pHERD20T, ΔpslG/pG, ΔpslG/pGDM, ΔpslG::pslG, ΔpslG::pslGE165Q,E276Q, PBAD-pslΔpslG::pslG and PBAD-pslΔpslG::pslGE165Q,E276Q cells grown 0.1% arabinose.
Long bacterial chains are observed in ΔpslG/pHERD20T, ΔpslG/pGDM, ΔpslG::pslGE165Q,E276Q and PBAD-pslΔpslG::pslGE165Q,E276Q, but not in PAO1/pHERD20T, ΔpslG/pG, ΔpslG::pslG and PBAD-pslΔpslG::pslG; Black arrows indicate the chains of bacterial cells. Scale bar, 5 μm.
Figure 5—figure supplement 3
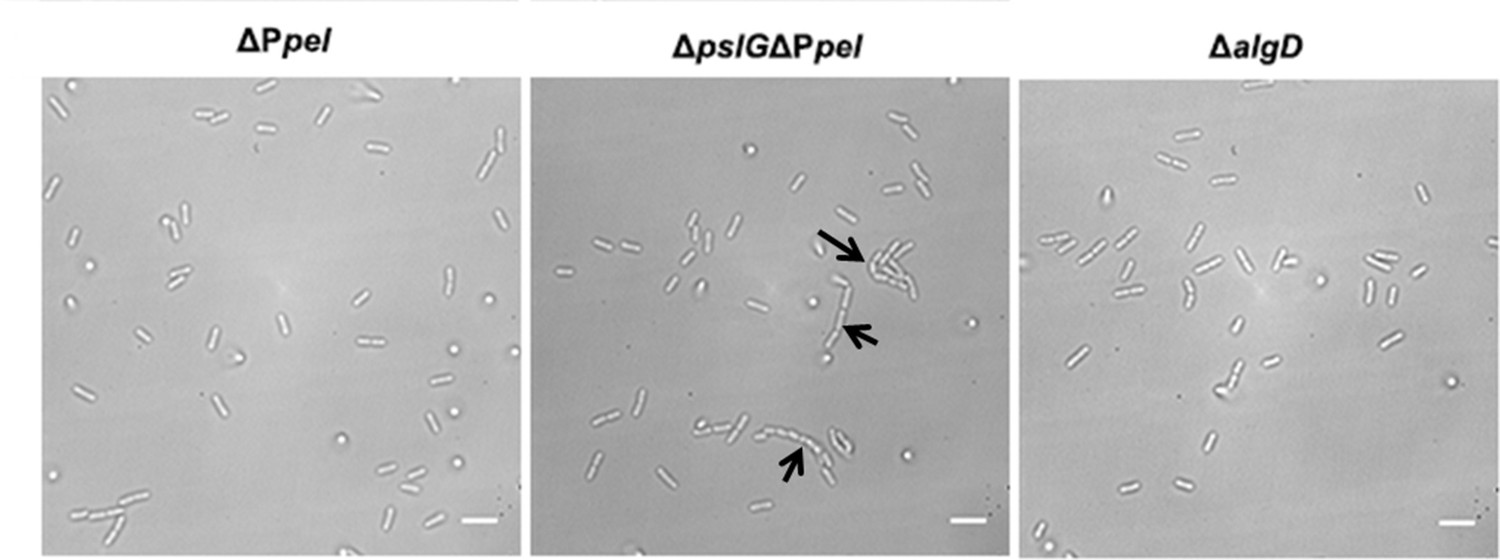
The formation of long bacterial chains by ΔPpel, ΔpslGΔPpel, and ΔalgD cells.
Long bacterial chains are observed in ΔpslGΔPpel, but not in ΔPpel and ΔalgD; Black arrows indicate the chains of bacterial cells. Scale bar, 5 μm.
Figure 6 with 1 supplement
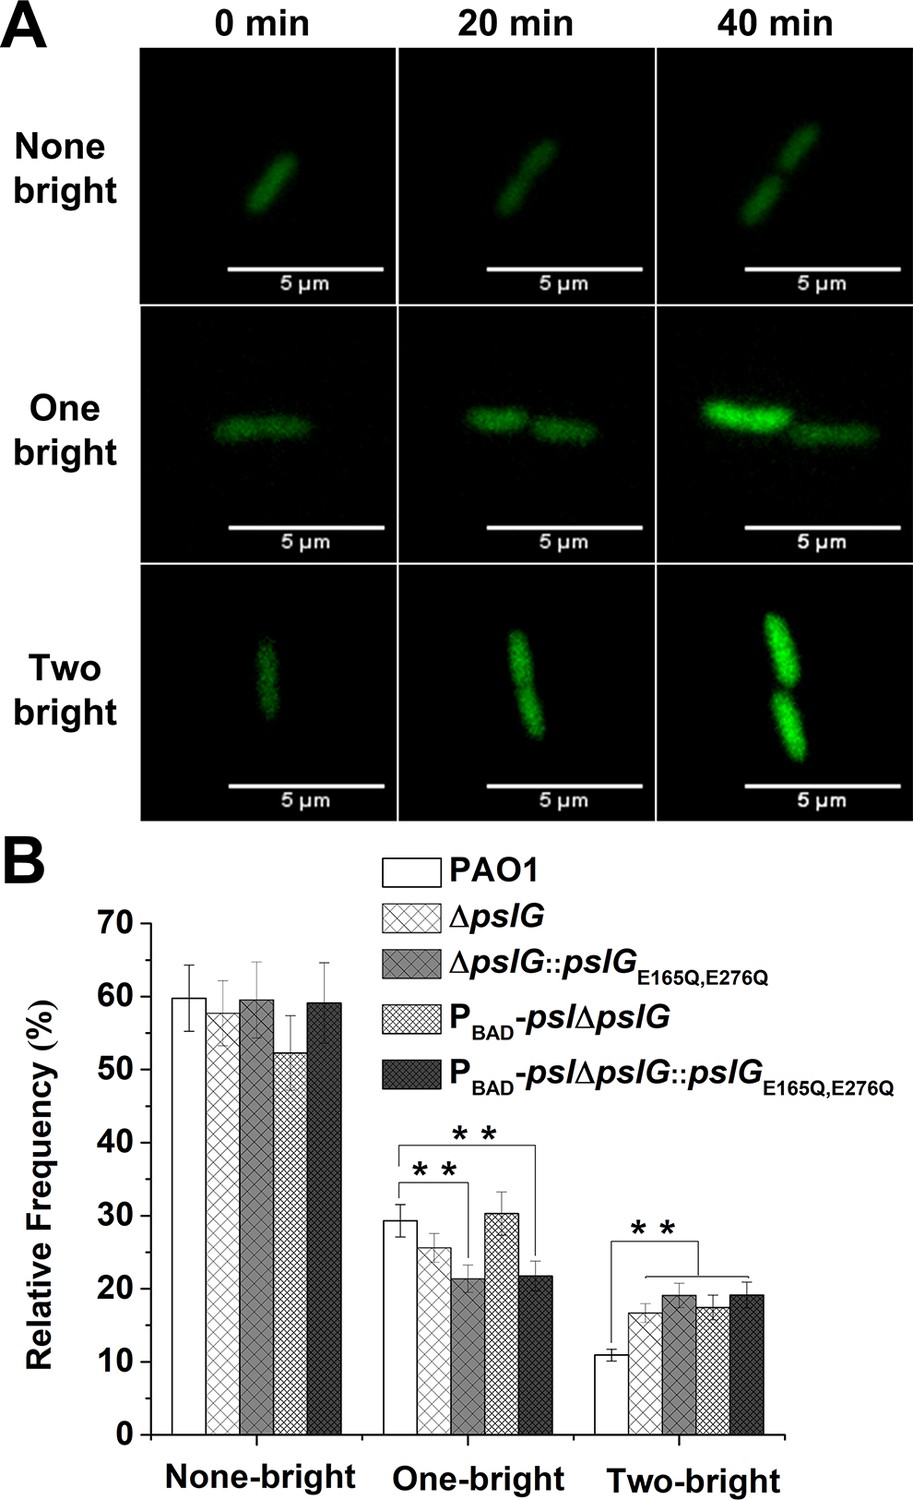
Lacking of PslG or its hydrolytic activity has effects on the fate and c-di-GMP distribution of daughter cells.
(A): Three types of cell division based on fluorescence intensity changes of daughter cells relative to that of their mother cell: none of daughter cells becomes bright (none-bright), one daughter cell becomes bright (one-bright), and both daughter cells become bright (two-bright). Examples given are PAO1 cells. The fluorescence is from pCdrA::gfp, which acts as a reporter for the c-di-GMP level of cells. (B): The measured probability of three types of division in PAO1, ΔpslG, PBAD-pslΔpslG, ΔpslG::pslGE165Q,E276Q, and PBAD-pslΔpslG::pslGE165Q,E276Q. The total number of analyzed division events from more than three repeats is n = 174 for PAO1, n = 168 for ΔpslG, n = 109 for PBAD-pslΔpslG, n = 131 for ΔpslG::pslGE165Q,E276Q, and n = 115 for PBAD-pslΔpslG::pslGE165Q,E276Q. Statistical significances were measured using one-way ANOVA. n.s., not significant; **p < 0. 01. Scale bar, 5 μm.
-
Figure 6—source data 1
Figure 6B source data.
- https://cdn.elifesciences.org/articles/72778/elife-72778-fig6-data1-v3.xlsx
Figure 6—figure supplement 1
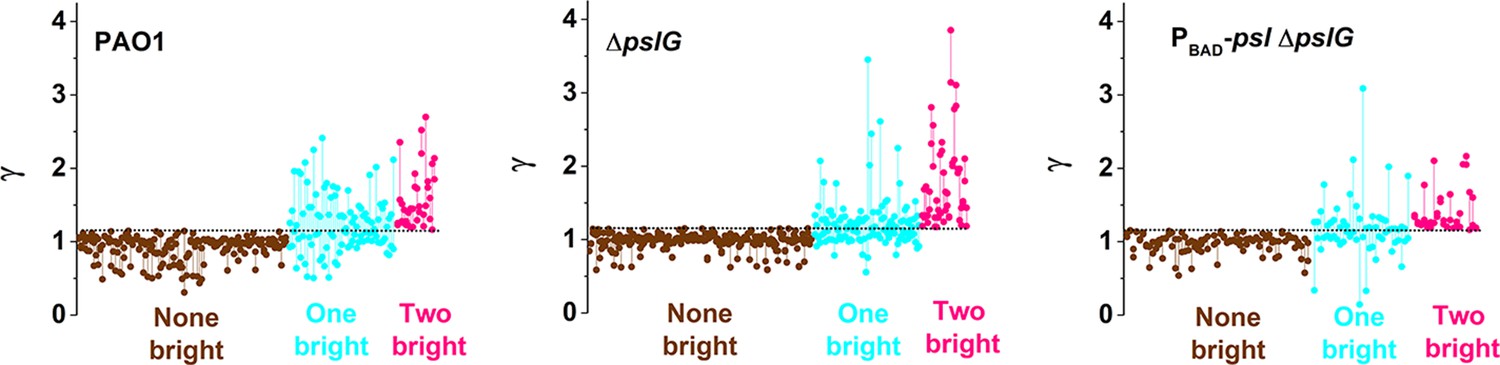
The ratio of fluorescence intensity ( = Idau/Imot) of each daughter cell for each division event.
Each division event is represented as a set of two dots connected with a vertical segment, in which each dot represents one daughter cell. The horizontal dashed lines indicate the threshold value determined by = 1.16, so when a daughter cell has a > 1.16, it is considered to be brighter than its mother cell. The data are grouped based on the three types of division defined in the main text: None-bright (brown), One-bright (cyan), Two-bright (pink).
Figure 7
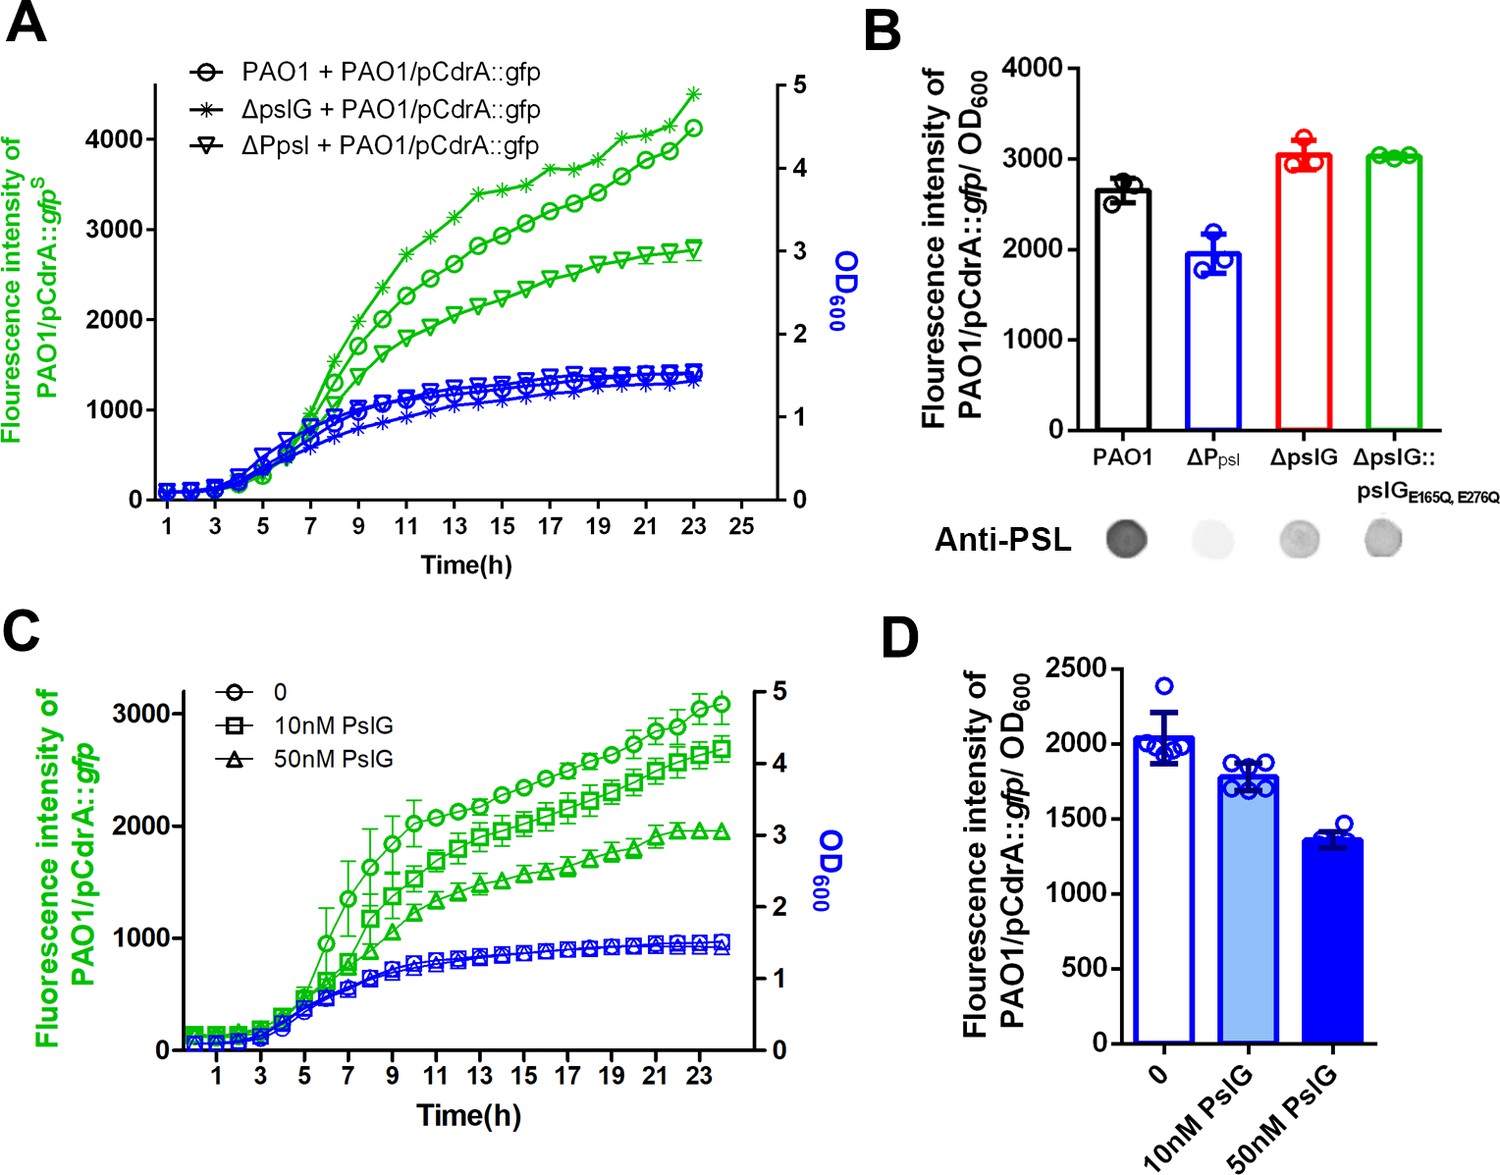
PSL produced by pslG mutant has a stronger signaling function.
(A): A coculture system using pCdrA::gfp as a reporter plasmid to evaluate the intracellular c-di-GMP. The reporter strain (PAO1/pCdrA::gfp) was mixed with PSL provider strain (PAO1, ΔpslG, or ΔPpsl: a PSL-negative mutant) at a ratio of 1: 1, and the GFP fluorescence value and OD600 in each co-culture system was recorded once per hour for 24 hr. (B): The fluorescence intensity per OD600 of PAO1/pCdrA::gfp after 24 hr co-culture with PSL provider strain PAO1, ΔPpsl, ΔpslG, or ΔpslG::pslGE165Q,E276Q. PSL production of each donor strain was shown under corresponding column. Statistical significances were measured using student’s t-test (**, p < 0. 01 when compared to PAO1). (C): The fluorescence intensity and corresponding OD600 of PAO1/pCdrA::gfp during 24 hr of PslG treatment. (D): The fluorescence intensity per OD600 of PAO1/pCdrA::gfp post 24 hr of treatment with different concentration of PslG.
Figure 8
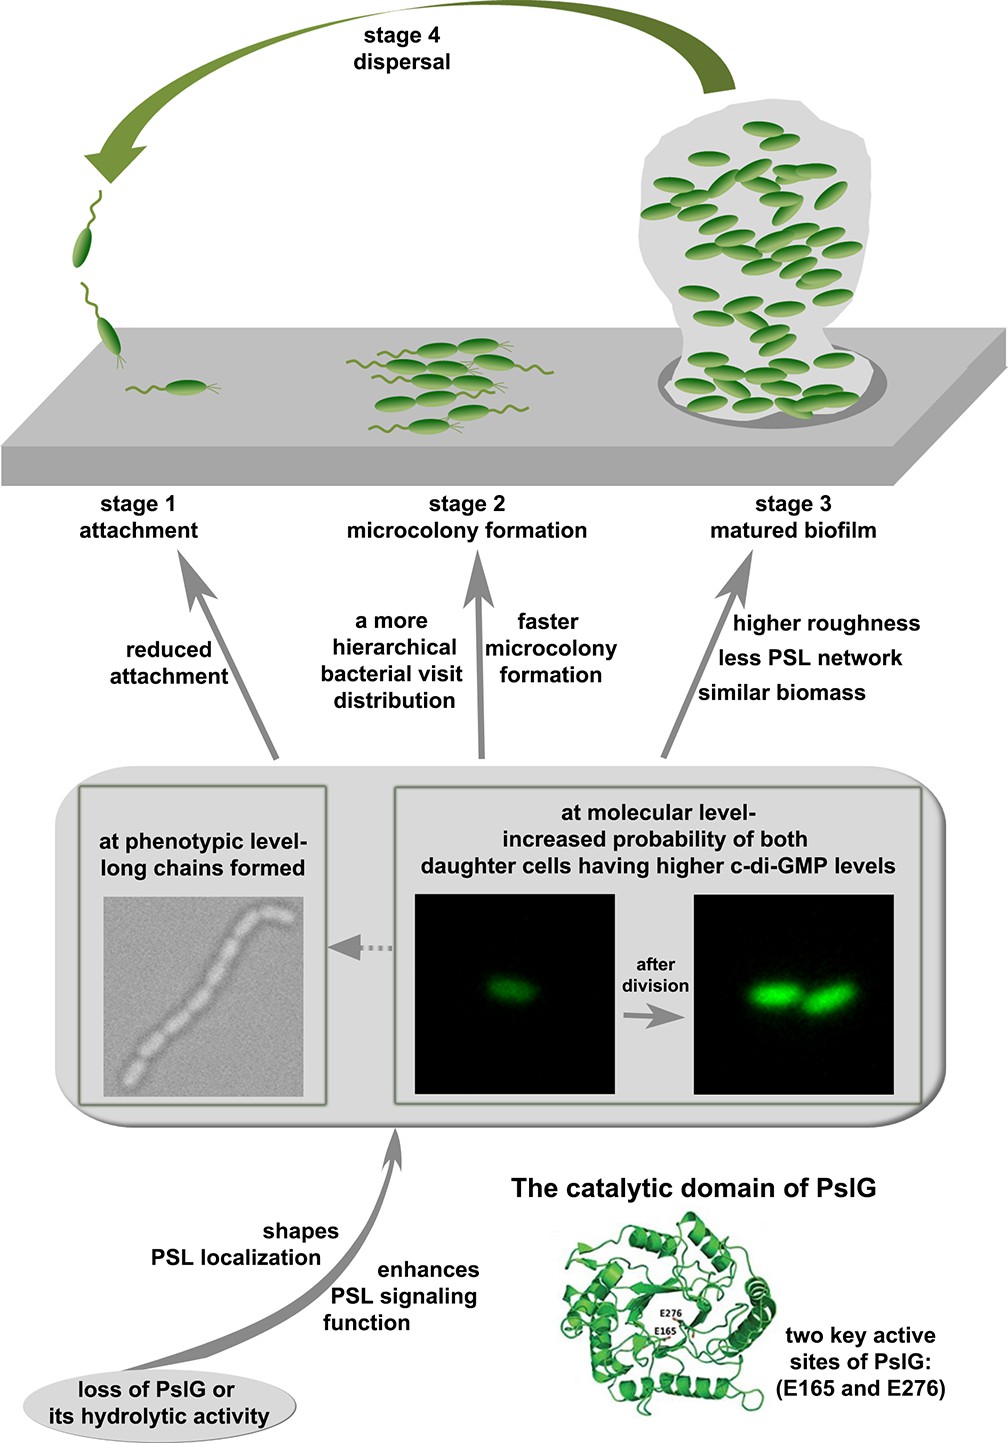
A schematic to show the effects of pslG in the biofilm development of P. aeruginosa.
Author response image 1
Author response image 2
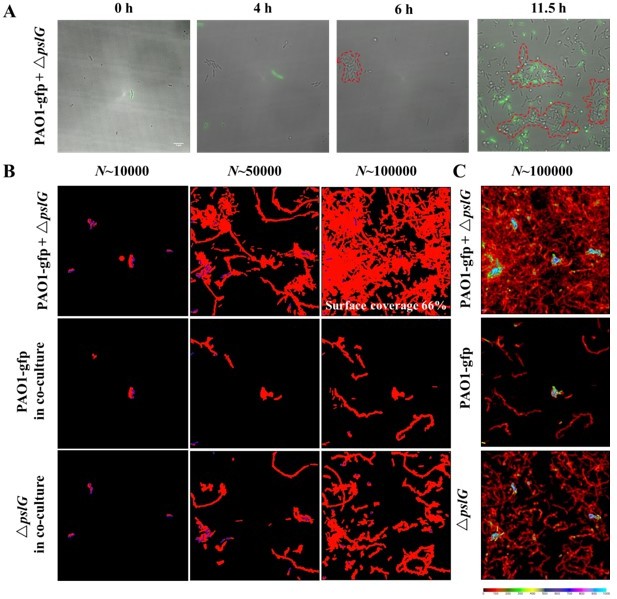
(A): The biofilm microcolonies formation by PAO1 with ΔpslG in flow cell.
PAO1 are GFP-tagged while ΔpslG is not. (B): Surface coverage maps at a total of 10000, 50000 and 100000 bacterial visits for PAO1 with ΔpslG, PAO1 in co-culture and ΔpslG in co-culture. (C): The visit frequency distributions of PAO1 with ΔpslG, PAO1 in co-culture and ΔpslG in co-culture.
Videos
Video 1
An example video of tracking the biofilm formation of Gfp-tagged PAO1 cells.
The video was taken at a frame interval of 10 min for 10 hr and was played back at 5 fps. Scale bar, 5 μm.
Video 2
An example video of tracking the biofilm formation of Gfp-tagged ΔpslG cells.
The video was taken at a frame interval of 10 min for 10 hr and was played back at 5 fps. Scale bar, 5 μm.
Video 3
An example video of the formation of PBAD-pslΔpslG long cell-chain.
The video was taken at a frame interval of 5 min for 3.5 hr and was played back at 5 fps. Scale bar, 5 μm.
Video 4
An example video of the degradation of PBAD-pslΔpslG long cell-chain.
The video was taken at a frame interval of 1 min for 0.5 hr and was played back at 5 fps. Scale bar, 5 μm.
Video 5
An example video of the degradation of ΔpslG long cell-chain.
The video was taken at a frame interval of 1 s for 10 min and was played back at 5 fps. Scale bar, 5 μm.
Tables
Key resources table
| Reagent type (species) or resource | Designation | Source or reference | Identifiers | Additional information |
|---|---|---|---|---|
| Strain, strain background (Pseudomonas aeruginosa) | PAO1 | Holloway, 1955 | Prototroph. | |
| Strain, strain background (Pseudomonas aeruginosa) | ΔpslG | Wu et al., 2019 | In-frame deletion of pslG. | Ma’s lab, strain No. P539. |
| Strain, strain background (Pseudomonas aeruginosa) | ΔPpsl | Ma et al., 2006 | PSL-negative, the promoter of psl operon deletion mutant. | Previous name is WFPA80. |
| Strain, strain background (Pseudomonas aeruginosa) | PBAD-psl | Ma et al., 2006 | PSL-inducible strain, the promoter of psl operon is replaced by araC-PBAD. | Previous name is WFPA801 |
| Strain, strain background (Pseudomonas aeruginosa) | ΔPpel | Ma et al., 2012 | PEL-negative, the promoter of pel operon deletion mutant. | Previous name is WFPA830. |
| Strain, strain background (Pseudomonas aeruginosa) | PBAD-pel | Ma et al., 2012 | PEL-inducible strain, the promoter of pel operon is replaced by araC-PBAD. | Previous name is WFPA831. |
| Strain, strain background (Pseudomonas aeruginosa) | PBAD-psl ΔpslG | This study | In-frame deletion of pslG in PBAD-psl background. | Ma’s lab, strain No. P977. |
| Strain, strain background (Pseudomonas aeruginosa) | ΔpslG ΔPpel | This study | The promoter of pel operon deletion strain in ΔpslG background. | Ma’s lab, strain No. P1717. |
| Strain, strain background (Pseudomonas aeruginosa) | PBAD-psl ΔpslG ΔPpel | This study | The promoter of pel operon deletion strain in PBAD-psl ΔpslG background. | Ma’s lab, strain No. P1711. |
| Strain, strain background (Pseudomonas aeruginosa) | ΔalgD | Whitchurch et al., 2002 | Alginate-negative, the algD:: tet deletion mutant of PAO1. | Previous name is WFPA1. |
| Strain, strain background (Pseudomonas aeruginosa) | ΔpslG::pslG | Wu et al., 2019 | pslG was inserted into pslG deletion mutant at chromosome pslG locus. | Ma’s lab, strain No. P963. |
| Strain, strain background (Pseudomonas aeruginosa) | ΔpslG::pslGE165Q, E276Q | Wu et al., 2019 | pslG was replaced by the active sites mutated pslG (E165Q + E276 Q). | Ma’s lab, strain No. P964. |
| Strain, strain background (Pseudomonas aeruginosa) | ΔpslG attB::PBAD-pslG | Wu et al., 2019 | PBAD-pslG was inserted into pslG deletion mutant at chromosome attB site. | Ma’s lab, strain No. P1716. |
| Strain, strain background (Pseudomonas aeruginosa) | PBAD-psl ΔpslG::pslG | This study | pslG was inserted into PBAD-psl ΔpslG strain at chromosome pslG locus. | Ma’s lab, strain No. P967. |
| Strain, strain background (Pseudomonas aeruginosa) | PBAD-pslΔpslG::pslGE165Q,E276Q | Wu et al., 2019 | pslG was replaced by the active sites mutated pslG (E165Q, E276Q) in PBAD-psl strain. | Ma’s lab, strain No. P966. |
| Strain, strain background (Pseudomonas aeruginosa) | PBAD-psl ΔpslG attB::PBAD-pslG | This study | PBAD-pslG was inserted into PBAD-psl ΔpslG strain at chromosome attB site. | Ma’s lab, strain No. P1715. |
| Strain, strain background (Pseudomonas aeruginosa) | PAO1/pCdrA::gfp | Rybtke et al., 2012 | PAO1 strain carrying plasmid pCdrA::gfp. AmpR, GmR. | |
| Strain, strain background (Pseudomonas aeruginosa) | PAO1/pHERD20T | Wu et al., 2019 | PAO1 strain carrying plasmid pHERD20T | |
| Strain, strain background (Pseudomonas aeruginosa) | ΔpslG /pHERD20T | Wu et al., 2019 | ΔpslG strain carrying plasmid pHERD20T | |
| Strain, strain background (Pseudomonas aeruginosa) | ΔpslG /pG | Yu et al., 2015 | ΔpslG strain carrying plasmid pHERD20T-pslG. AmpR | |
| Strain, strain background (Pseudomonas aeruginosa) | ΔpslG /pGDM | Wu et al., 2019 | ΔpslG strain carrying plasmid pHERD20T-pslGDM, pHERD20T with double active sites mutated pslG (E165Q + E276 Q), AmpR | |
| Recombinant DNA reagent | pCdrA::gfp (plasmid) | Rybtke et al., 2012 | pUCP22Not-RNase III-gfp (ASV)-T0-T1, a cyclic di-GMP level reporter consisting of the cyclic di-GMP-responsive cdrA promoter fused to gfp gene, AmpR, GmR | |
| Recombinant DNA reagent | pHERD20T (plasmid) | Qiu et al., 2008 | pUCP20T Plac replaced with 1.3 kb AflII-EcoRI fragment of araC-PBAD cassette. AmpR | |
| Recombinant DNA reagent | pG(plasmid) | Yu et al., 2015 | pHERD20T-pslG. AmpR | |
| Recombinant DNA reagent | pGDM (plasmid) | Wu et al., 2019 | pHERD20T with double active sites mutated pslG (E165Q + E276 Q), AmpR | |
| Recombinant DNA reagent | pEX18Gm (plasmid) | Hoang et al., 1998 | Allelic exchange vector, GmR | |
| Recombinant DNA reagent | pSW196 (plasmid) | Baynham et al., 2006 | Modified from mini-CTX with pBAD30-based vector, for inserting an arabinose-inducible gene at the neutral attB site. TcR | |
| Recombinant DNA reagent | pFLP2 (plasmid) | Hoang et al., 1998 | Source of Flp recombinase, AmpR | |
| Antibody | anti-ePsl (Rabbit polyclonal) | Byrd et al., 2009 | Exopolysaccharide Psl specific antibody. | IF(1:1667) |
| Other | TRITC-HHA | EY-lab, INC | Fluorescent labeled lectin HHA. | |
| Other | FITC-HHA | EY-lab, INC | Fluorescent labeled lectin HHA. | |
| Other | Syto9 | Invitrogen, Molecular probes | Green-fluorescent nucleic acid stain. | |
| Other | FM4-64 | Invitrogen, Molecular probes | Lipophilic Styryl Dye. |
Additional files
Download links
A two-part list of links to download the article, or parts of the article, in various formats.
Downloads (link to download the article as PDF)
Open citations (links to open the citations from this article in various online reference manager services)
Cite this article (links to download the citations from this article in formats compatible with various reference manager tools)
Intracellular glycosyl hydrolase PslG shapes bacterial cell fate, signaling, and the biofilm development of Pseudomonas aeruginosa
eLife 11:e72778.
https://doi.org/10.7554/eLife.72778


