Multi-omics investigation of Clostridioides difficile-colonized patients reveals pathogen and commensal correlates of C. difficile pathogenesis
- The Edison Family Center for Genome Sciences and Systems Biology, Washington University School of Medicine, United States
- Department of Pathology and Immunology, Washington University School of Medicine, United States
- Center for Women’s Infectious Disease Research, Division of Infectious Diseases, Department of Internal Medicine, Washington University School of Medicine, United States
- Division of Infectious Diseases, Washington University School of Medicine, United States
- Department of Molecular Microbiology, Washington University School of Medicine, United States
- Department of Pediatrics, Washington University School of Medicine, United States
- Department of Biomedical Engineering, Washington University in St. Louis, United States
Abstract
Clostridioides difficile infection (CDI) imposes a substantial burden on the health care system in the United States. Understanding the biological basis for the spectrum of C. difficile-related disease manifestations is imperative to improving treatment and prevention of CDI. Here, we investigate the correlates of asymptomatic C. difficile colonization using a multi-omics approach. We compared the fecal microbiome and metabolome profiles of patients with CDI versus asymptomatically colonized patients, integrating clinical and pathogen factors into our analysis. We found that CDI patients were more likely to be colonized by strains with the binary toxin (CDT) locus or strains of ribotype 027, which are often hypervirulent. We find that microbiomes of asymptomatically colonized patients are significantly enriched for species in the class Clostridia relative to those of symptomatic patients. Relative to CDI microbiomes, asymptomatically colonized patient microbiomes were enriched with sucrose degradation pathways encoded by commensal Clostridia, in addition to glycoside hydrolases putatively involved in starch and sucrose degradation. Fecal metabolomics corroborates the carbohydrate degradation signature: we identify carbohydrate compounds enriched in asymptomatically colonized patients relative to CDI patients. Further, we reveal that across C. difficile isolates, the carbohydrates sucrose, rhamnose, and lactulose do not serve as robust growth substrates in vitro, consistent with their enriched detection in our metagenomic and metabolite profiling of asymptomatically colonized individuals. We conclude that pathogen genetic variation may be strongly related to disease outcome. More interestingly, we hypothesize that in asymptomatically colonized individuals, carbohydrate metabolism by other commensal Clostridia may prevent CDI by inhibiting C. difficile proliferation. These insights into C. difficile colonization and putative commensal competition suggest novel avenues to develop probiotic or prebiotic therapeutics against CDI.
Editor's evaluation
Not everyone colonized by C. difficile has gut symptoms, but the reasons why are unclear. This article uses the combination of sequencing and mass spectrometry to compare patients with or without symptoms, revealing links between specific gut bacteria and diet, which could lead to diet or bacterial treatment or prevention strategies.
https://doi.org/10.7554/eLife.72801.sa0Introduction
Clostridioides difficile infection (CDI) remains a significant cause of morbidity and mortality in the health care setting and in the community (Guh et al., 2020). Antibiotic treatments, among other risk factors associated with weakened colonization resistance, increase susceptibility to CDI (Dubberke and Olsen, 2012; Eze et al., 2017). C. difficile residence in the human gastrointestinal (GI) tract may result in a spectrum of clinical manifestations, from asymptomatic colonization to severe CDI-related colitis and fatal toxic megacolon (Crobach et al., 2018). Diagnosis of CDI relies on detection of the protein toxin, most commonly by enzyme immunoassay (EIA), or the detection of the toxin-encoding genes tcdA and tcdB, by nucleic acid amplification test (NAAT). These diagnostic tools serve as rough benchmarks for assessing the severity of disease. Discrepancies between the results of these assays, as in the case of patients with clinically significant diarrhea (CSD) who are EIA negative (EIA-) but NAAT positive for toxigenic C. difficile (Cx+), highlight the complexity of states in which C. difficile can exist in the GI tract. Because CDI is a multi-factorial interaction between the host, pathogen, and microbiome, clarifying the differences in biological correlates between asymptomatic colonization (Cx+/EIA-) and CDI (Cx+/EIA+) is critical for identifying mechanisms of colonization resistance, and for defining novel probiotic or prebiotic avenues for treatment or prevention of CDI (Kondepudi et al., 2012; Rätsep et al., 2017).
C. difficile enters the GI tract as a spore, germinates in the presence of primary bile acids, and replicates through consumption of amino acids and other microbiota or host-derived nutrients (Hryckowian et al., 2017). Notably, many of these metabolic cues are characteristic of a perturbed microbiome (Nagao-Kitamoto et al., 2020; Battaglioli et al., 2018). The hallmark of C. difficile pathogenesis is the expression of the toxin locus encoded on the tcd operon; this locus is tightly regulated by nutrient levels (Martin-Verstraete et al., 2016). Correspondingly, it is hypothesized that an environment replete of nutrients induces toxinogenesis, allowing C. difficile to restructure the gut environment and acquire nutrients through inflammation (Fletcher et al., 2018; Fletcher et al., 2021). The instances of patients who are colonized but have no detectable C. difficile toxin in their stool suggests that these patients’ microbiomes may be less permissive towards CDI development. Identification of metabolic traits within the microbiome of asymptomatic, C. difficile-colonized patients could reveal a number of potential therapeutic pathways toward precise amelioration of symptomatic C. difficile disease.
A multitude of probiotic and prebiotic approaches have demonstrated efficacy to curb C. difficile proliferation in vivo (Rätsep et al., 2017; Chen et al., 2020; Pereira et al., 2020). While restoration of the microbiota through fecal microbiota transplantation can provide colonization resistance (Laffin et al., 2017), the molecular mechanisms of how this resistance is conferred remain unclear. Recent studies using a murine model of infection have indicated that the administration of carbohydrates (both complex and simple) in the diet can be used to curb or prevent CDI (Mefferd et al., 2020; Schnizlein et al., 2020; Hryckowian et al., 2018). Paradoxically, integrated metabolomics and transcriptomics data collected during murine C. difficile colonization indicates that simple carbohydrates are imperative for pathogen replication (Fletcher et al., 2018). It is critical to understand the mechanism by which catabolism of specific carbohydrates could inhibit C. difficile proliferation in the human GI tract.
Here, we perform a multi-level investigation of two relevant patient populations, those colonized with C. difficile but EIA negative (asymptomatically colonized) and those who are EIA positive (CDI) to understand the microbial and metabolic features that may underlie protection from CDI. First, we use microbiome analyses to identify a number of non-C. difficile, clostridial species that are negatively correlated with C. difficile in asymptomatically colonized individuals. Secondly, interrogation of a metabolomics dataset from the same patient population (Robinson et al., 2019) reveals increased abundance of a number of carbohydrate metabolites in asymptomatically colonized patients. Finally, we show that some metabolites enriched in asymptomatically colonized individuals are largely non-utilizable by C. difficile isolates. Together, these datasets reveal that asymptomatically colonized patients are defined by an interaction of clostridial species and carbohydrate metabolites that may serve as a last-line of resistance against CDI in colonized patients.
Results
The clinical manifestation of C. difficile colonization in a host gastrointestinal tract is determined by a multi-factorial interaction between the host, their microbiome, and the pathogen. We hypothesized that, among these factors, natural variation in C. difficile strains infecting patients might differentiate asymptomatic from CDI patients (Dubberke et al., 2018). Through retrospective analysis of a human cohort of 124 patients (Supplementary file 1) with clinically significant diarrhea (CSD) and stool submitted for C. difficile toxin testing, we defined two cohorts: those diagnosed with CDI (Cx+/EIA+) or those asymptomatically colonized (Cx+/EIA-) (Robinson et al., 2019). EIA status (EIA+ or EIA-) was determined by the result of the clinical toxin EIA performed on the stool specimen, and a positive toxigenic culture (a C. difficile isolate with with tcdA and/or tcdB; Cx+) (Dubberke et al., 2018). In-depth analysis of C. difficile isolate factors related to EIA status was performed on the isolates corresponding to the 102 metagenomic samples analyzed (see Materials and Methods, Supplementary file 2). Multiplex PCR was used to identify isolates with cdtAB, the binary toxin locus (Cowardin et al., 2016). Notably, there was a significant enrichment of isolates with cdtAB in the stools of patients with CDI (Figure 1A; p = 0.0012, Fisher’s exact test). Additionally, there were differences in the distribution of C. difficile strains associated with the two patient cohorts; CDI patients were more likely to be infected by a C. difficile isolate of the ribotype 027 lineage (Figure 1A; p = 0.0058, Fisher’s exact test), a clade likely to contain virulent members (Merrigan et al., 2010). Interestingly, of the isolates positive for cdtAB (22 out of 102 isolates), 36% were considered a ribotype 027 strain. Given these genetic indicators of potential differences in virulence, we asked if strains from both groups were capable of producing toxin, using culture supernatants from in vitro broth culture. We found that 56% of isolates expressed detectable TcdA/B, with no significant different (p = 0.86) in the capacity of strains from Cx+/EIA- stools (24 out of 54 isolates) or Cx+/EIA+ (24 out of 48 isolates) to elaborate toxin (Figure 1—figure supplement 1A). Predictably, differences in genetic indicators of strain virulence (as indicated by prevalence of both a prominent ribotype and a second toxin locus) were significant correlates of EIA status.
Figure 1 with 2 supplements see all
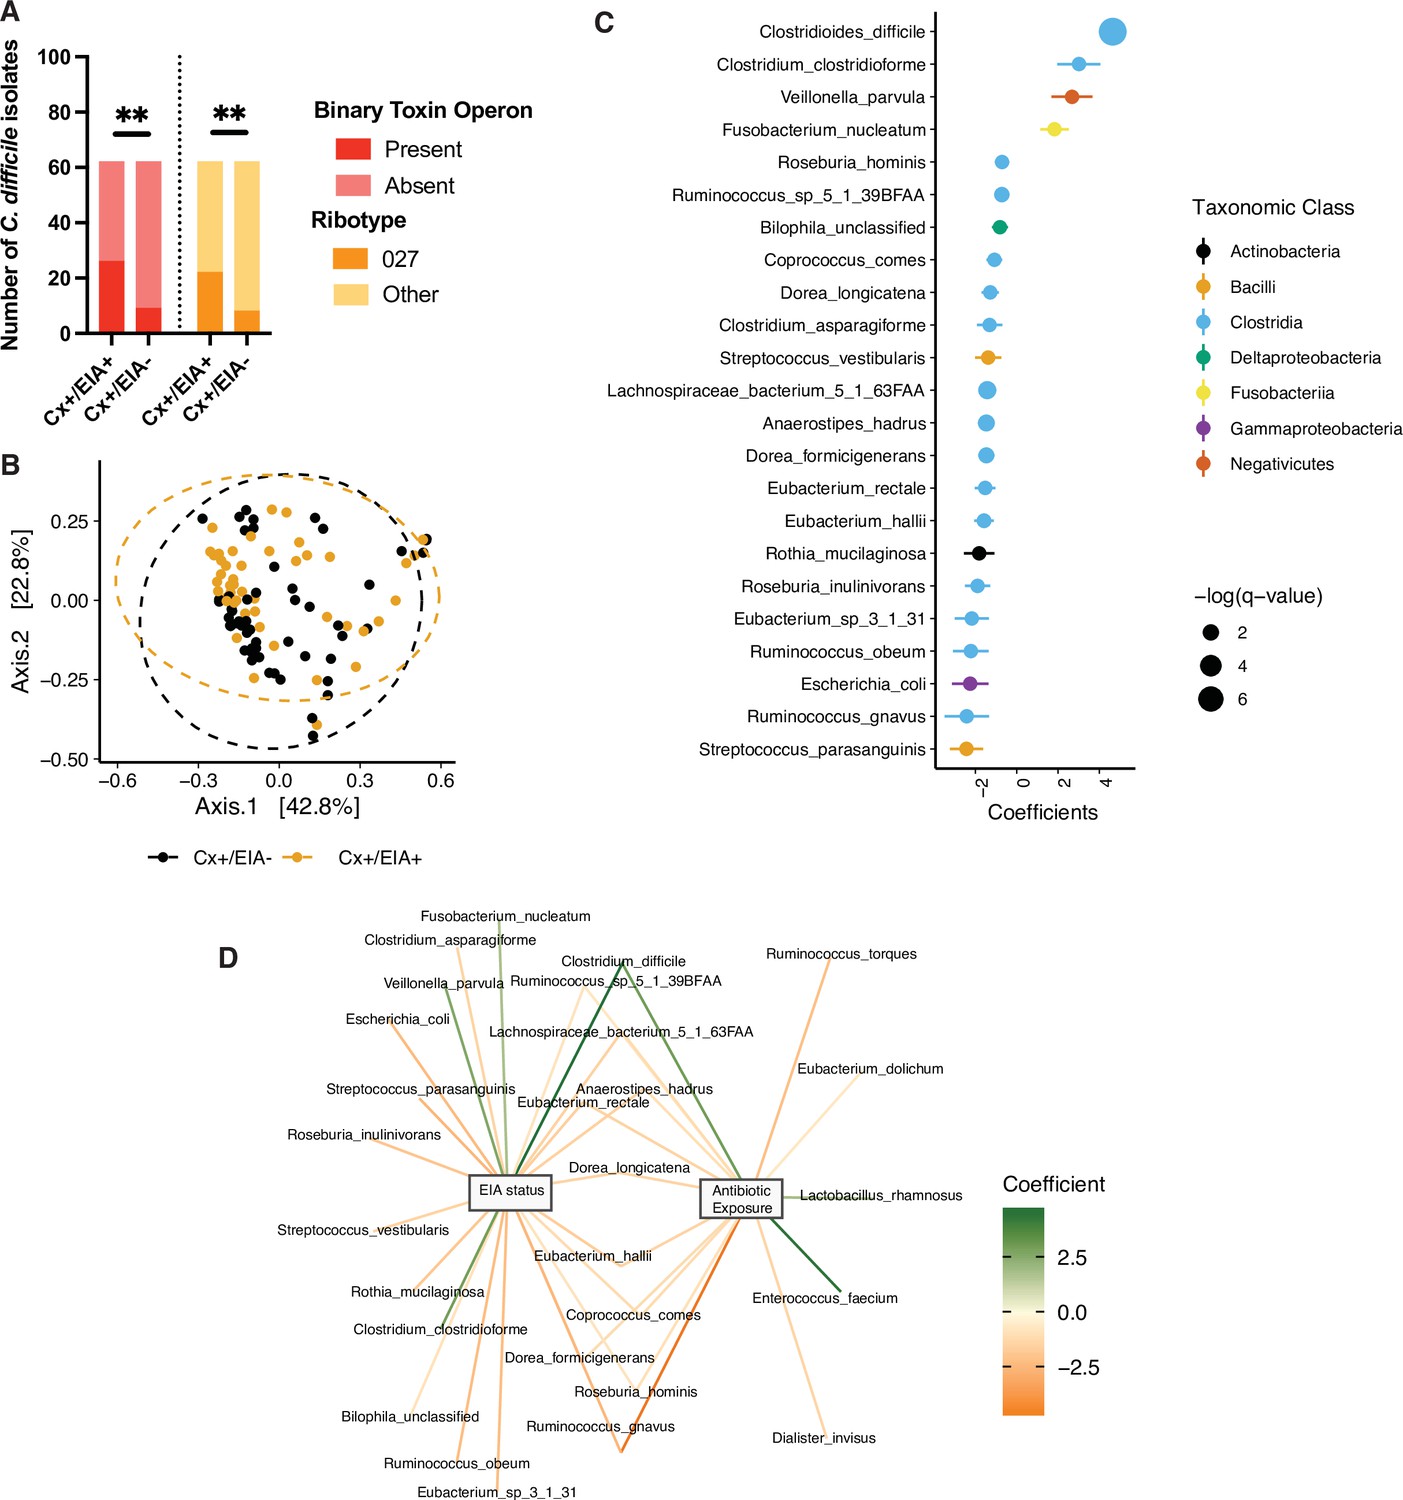
Pathogen and microbiome determinants of C. difficile-colonized patients.
(A) Clostridioides difficile isolate distribution based on PCR and ribotyping data for each isolate cultured from patient stools. **, p < 0.001 as measured by a Fisher’s exact test. (B) Principal coordinate analysis (PCoA) of weighted Unifrac distances between stool microbiomes. Colors indicate EIA status. Groups were not significantly different as measured by a PERMANOVA (p = 0.69). (C) Significant microbial taxa associated with disease state, where a positive coefficient is associated with Cx+/EIA+ state and a negative coefficient is associated with Cx+/EIA- state. Colors indicate taxonomic Class of the microbial feature, and the size of circle corresponds to magnitude of statistical significance. Features with q-value of <0.25 were plotted. (D) Network of features associated with antibiotic exposure or EIA status. Species nodes are connected to metadata nodes by edged colored with the feature weight (coefficient) computed using linear mixed modeling (MaAslin2). All taxa displayed had a q-value of <0.25 in respective analyses.
-
Figure 1—source data 1
Raw absorbance value for in vitro toxin ELISA of 102 C.difficile isolates.
- https://cdn.elifesciences.org/articles/72801/elife-72801-fig1-data1-v1.xlsx
As antibiotics are a well-known risk factor for CDI, we analyzed previous inpatient antibiotic orders (within one month prior to diagnosis) for patients in the Cx+/EIA- and Cx+/EIA+ cohort, as a proxy for antibiotic exposure (Table 1). Fitting antibiotic exposure to a logistic regression model (McFadden’s R2 = 0.306) revealed that CDI was significantly associated with cephalosporin exposure. Analysis of potential antibiotic exposures in our patient cohort confirms the risk that antibiotics pose for CDI development (Mullish and Williams, 2018; Webb et al., 2020).
Table 1
Logistic regression coefficients for antibiotic exposures associated with Cx+/EIA+ in patient cohort.
| Antibiotic | Coefficient | Standard error | p-Value |
|---|---|---|---|
| Cephalosporin | 2.68 | 0.74 | 2.70E-04 |
| Fluoroquinolone | 0.19 | 1.09 | 0.86 |
| Carbapenem | 0.34 | 1.12 | 0.76 |
| Metronidazole | 1.11 | 0.95 | 0.24 |
| Vancomycin (intravenous) | 1.44 | 0.95 | 0.13 |
-
*Hosmer and Lemeshow Goodness of fit test p = 0.7536.
Antibiotics increase susceptibility to CDI through disruption of colonization resistance, mainly conferred to the host via the gut microbiome (Theriot et al., 2014). To determine the microbial correlates of disease state, we performed shotgun metagenomic sequencing on patient stool samples from the asymptomatic (n = 54) and CDI (n = 48) groups, and classified species using MetaPhlAn2. Given the strong association with antibiotic exposure in our CDI cohort, we hypothesized that our asymptomatically colonized patients would have increased microbiome-mediated colonization resistance relative to CDI patients. We examined community structure in stool metagenomes and found that there was no significant difference in Faith’s diversity (Faith and Baker, 2007), a measure of alpha-diversity that incorporates phylogenetic relationships, between patient groups (Figure 1—figure supplement 1B, Wilcoxon rank-sum test, p = 0.1602). There were no significant differences in beta-diversity, as measured by weighted Unifrac distance, between EIA status (p = 0.233, permutational analysis of variance test [PERMANOVA]) (Figure 1B). Although we hypothesized that increased virulence (through additional toxin allele or ribotype) associated with EIA+ could affect microbiome structure, we found no significant association between beta-diversity and cdtAB presence (Figure 1—figure supplement 1C; p = 0.799, PERMANOVA) or ribotype distribution (Figure 1—figure supplement 1D; p = 0.982, PERMANOVA). Previous comparative microbiome studies have revealed phylum-level differences in Bacteroides and Firmicutes in CDI cases versus controls not colonized with C. difficile (Kachrimanidou and Tsintarakis, 2020). In contrast, we found no significant differences in relative abundance of bacterial phyla between asymptomatically colonized patients and patients with CDI (Figure 1—figure supplement 1E). These data indicate that there were no gross differences in microbiome structure related to either EIA status or pathogen features.
Instead, we hypothesized that differences between these states may manifest at higher resolution. We used a multivariable regression model, as implemented by MaAslin2 (Mallick et al., 2021) to identify microbial taxa predictive of either group. Interestingly, species from class Clostridia were most enriched in taxa significantly altered by EIA status (Fisher’s exact test, p = 0.0022). C. difficile was the strongest predictor of CDI state, whereas non-C. difficile clostridial taxa were predictive of asymptomatic state (Figure 1C, FDR < 0.25). Correspondingly, we saw increased C. difficile relative abundance in CDI patients and increased levels of a number of non-C. difficile clostridial species, including Eubacterium spp., Dorea spp., and Lachnospiraceae spp. in asymptomatic patients (Figure 1—figure supplement 1F). Given our inability to detect C. difficile in all sequenced stools (70 out of 102 culture-positive stool samples), we utilized an alternative metagenomic species classifier Kraken (Wood and Salzberg, 2014), to validate our findings. Using Kraken, we detected C. difficile in nearly all stool metagenomes (101 out of 102). Using the identical linear mixed modeling approach (MaAsLin2), we recapitulated data indicating that C. difficile abundance was the strongest predictor of EIA status and increased in Cx+/EIA+ patients. Additionally, a number of commensal clostridial taxa from the Eubacterium genus and Anaerostipes genus were strongly associated with EIA- status, confirming prior MetaPhlAn2 predictions (Figure 1—figure supplement 2A,B).
Using our microbiome data, we examined the association between C. difficile levels and pathogen markers previously associated with EIA status. We found that C. difficile relative abundance was not significantly different when stratified by isolate CDT status (Figure 1—figure supplement 2C; p = 0.3, Wilcoxon rank sum) or isolate ribotype (p = 0.78, Kruskal-Wallis). Notably, there was a slight, yet insignificant increase in C. difficile abundance in microbiomes associated with a ribotype 027 isolate (Figure 1—figure supplement 2D) relative to microbiomes associated with C. difficile isolates of other ribotypes. We also interrogated taxonomic features that were predictive of antibiotic exposure. Expectedly, we found that taxonomic features predictive of CDI state were also associated with antibiotic exposure (Figure 1D). Our data indicate that patients with asymptomatic C. difficile colonization or CDI do not have grossly different gut microbiome community structures but instead have distinctive alterations in a subset of species from class Clostridia and class Bacilli in the microbiota.
C. difficile pathogenesis is heavily affected by carbohydrate, amino acid, and bile acid levels in the gastrointestinal tract, related to the metabolism of competitive commensals (Sorbara and Pamer, 2019). To identify metabolic pathways in other clostridia that might enable them to outcompete C. difficile, we defined metabolic potential in patient microbiomes using HUMAnN2 to quantify microbial pathway abundances. We found no significant differences in alpha- or beta-diversity between overall metabolic pathway composition in the two patient microbiome groups (Figure 2—figure supplement 1A,B; p = 0.2393, Wilcoxon rank sum and p = 0.054, PERMANOVA). Therefore, we trained an elastic net model to identify specific pathways associated with EIA status (Figure 2A). We found a number of carbohydrate degradation pathways and amino acid biosynthetic pathways associated with the asymptomatically-colonized (Cx+/EIA-) patients, including sucrose degradation III and fucose and rhamnose degradation. Investigation of the genera that encode such pathways revealed that the sucrose degradation III pathway was increased in asymptomatic patients, largely due to Blautia spp. and Faecalibacterium spp. of the class Clostridia (Figure 2B). Interestingly, the fucose and rhamnose degradation pathways were entirely defined by Escherichia spp., presumably E. coli. This suggests that metabolic functions such as fucose and rhamnose degradation may be confined to a smaller number of taxa than carbohydrate degradation pathways such as sucrose degradation. Using the HUMAnN2 (Franzosa et al., 2018) gene family information, we used linear mixed modeling to identify carbohydrate-active enzymes differentially associated with EIA status (Figure 2C). Supporting the pathway analysis, we found an increased abundance of a subset of glycoside hydrolase genes, specifically involved in sucrose and starch metabolism in the asymptomatically colonized patients. Our metabolic pathway analyses highlight differentially abundant carbohydrate degradation processes in clostridial taxa that could contribute to colonization resistance against C. difficile in patient microbiomes.
Figure 2 with 1 supplement see all
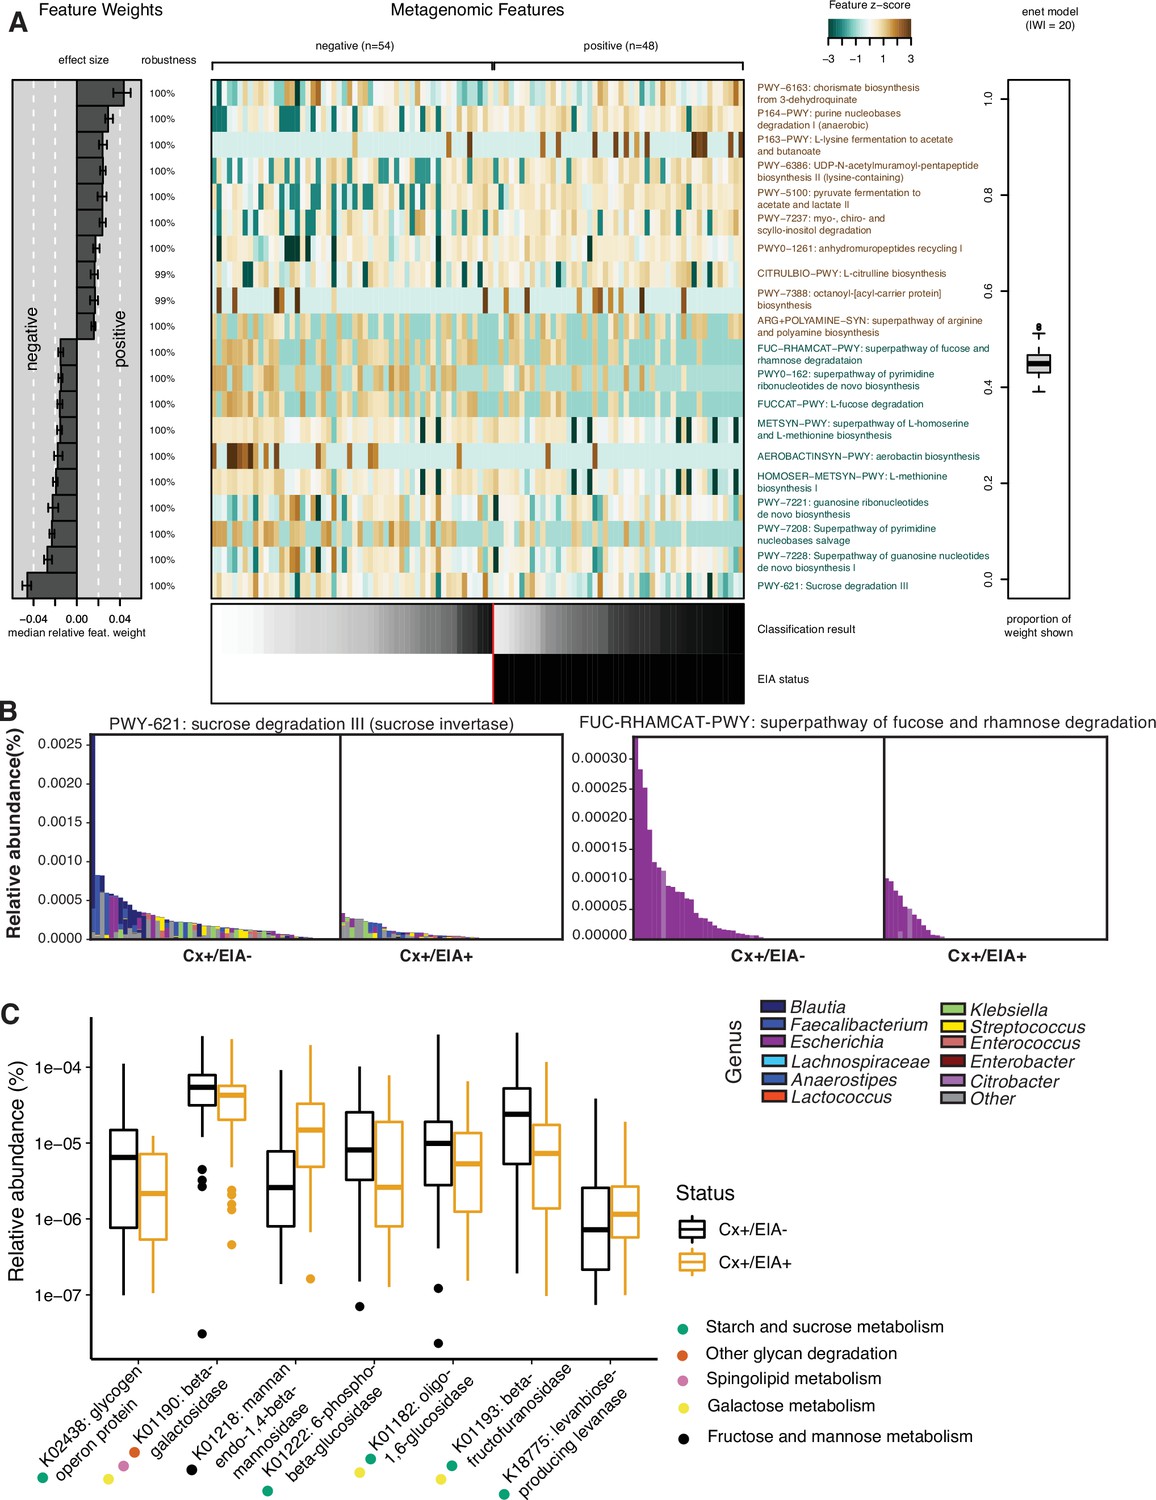
Carbohydrate metabolic processes present in asymptomatic patient microbiome.
(A) Significant pathways associated with EIA status, as derived from the elastic net model. Mean-prediction AUC for the elastic net model was 0.825. (B) Relative abundance of taxa in pathways associated with asymptomatic patients, where each patient’s metagenomic relative abundance is depicted by a single bar. Bars are colored by genera predicted to encode pathway. (C) Relative abundance of glycosidic hydrolase genes significantly associated with EIA status (q-value of <0.25) in stool metagenomes, where circles represent KEGG pathway classification.
We hypothesized that differences in metabolic potential of fecal microbiome communities might be reflected in metabolomic profiles, and therefore sought to identify metabolites that are altered in CDI patients relative to those asymptomatically colonized with C. difficile (Robinson et al., 2019). Ordination of Euclidean distances between Cx+/EIA- and Cx+/EIA+ stool metabolomes revealed no significant differences in metabolome structure (Figure 2—figure supplement 1C, PERMANOVA = 0.426). We again used MaAslin2 to determine metabolites associated with each disease state. Consistent with previous analysis, a number of end-product Stickland fermentation metabolites (4-methypentanoic acid and 5-aminovalerate) were associated with CDI patients. While 4-hydroxyproline was the strongest predictor of asymptomaticallycolonized patients, many of the significant metabolites that were associated with asymptomatic patients were predicted to be carbohydrates (Figure 3A, FDR < 0.25; Supplementary file 3). Putative metabolite identities were initially annotated by matching metabolite spectra to the NIST14 GC-MS spectral library. The preponderance of carbohydrates in asymptomatically colonized patients and the substantial similarity of carbohydrate spectra prompted us to rigorously validate the identities of these metabolites by comparing EI spectra and GC retention times against authentic standards, where commercially available (Supplementary file 3, Figure 3—figure supplement 1). These data reveal a carbohydrate signature that is depleted in CDI patients. Notably, fructose and rhamnose are either substrates or products of the sucrose degradation III and fucose and rhamnose degradation pathways, which we found to be enriched in asymptomatically colonized patients. The co-occurrence of these microbial pathways and their corresponding metabolites in asymptomatically colonized patients suggests that a commensal carbohydrate catabolism may contribute to suppression of C. difficile pathogenesis.
Figure 3 with 1 supplement see all
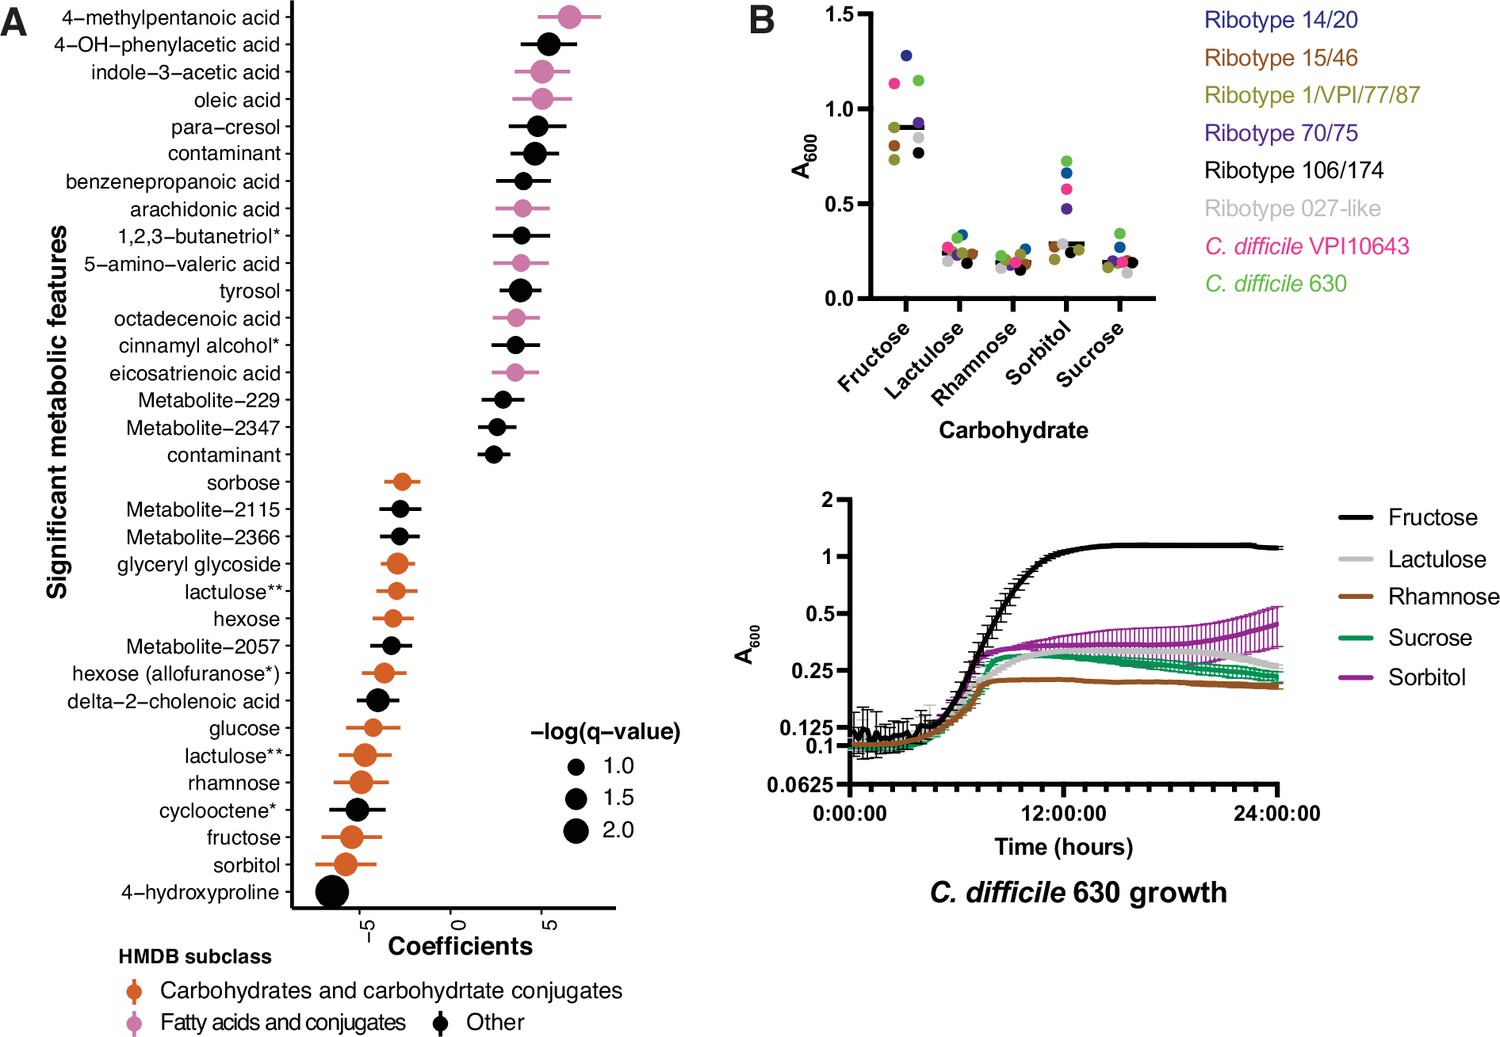
Asymptomatically colonized patients are defined by carbohydrate species.
(A) Significant metabolites associated with EIA state, where a positive coefficient is strongly associated with Cx+/EIA+ metabolomes. Colors indicate human metabolic database (HMDB) sub-classification, and size of circle corresponds to magnitude of statistical significance. * indicates closest potential match; ** indicates two peaks from the same compound; contaminant indicates mass spectrometry contaminant. (B) Clinical and reference strains grown in C. difficile minimal medium (CDMM) with equimolar amounts of carbohydrate sources added. Growth was measured by taking maximum absorbance values over 48 hr. Each point represents the mean of two technical replicates of a unique isolate (top). Growth of C. difficile 630, from same conditions as above (bottom).
-
Figure 3—source data 1
Growth curve data for C. difficile isolates.
- https://cdn.elifesciences.org/articles/72801/elife-72801-fig3-data1-v1.xlsx
Our examination of taxa, metabolic pathways, and metabolites revealed a number of carbohydrates which we predict are undigestible by C. difficile or are end-products of a more complex commensal metabolism that is exclusionary to C. difficile. Using a set of clinical C. difficile isolates cultured from this patient cohort (8 isolates representing six different ribotypes), we examined growth of C. difficile on carbohydrates associated with asymptomatically colonized patients. Using a defined minimal media (CDMM)( Karasawa et al., 1995) to test nutrient utilization, we found that C. difficile isolates grew robustly on fructose as expected (median maximum A600 of 0.90), but did not proliferate on rhamnose or lactulose (median maximum A600 of 0.19 and 0.24, respectively). Notably, in the case of sorbitol, we found that a subset of strains, including the reference strain C. difficile 630 and C. difficile VPI10643, grew to a maximum A600 of greater than 0.47 (Figure 3B). Given that we had found sucrose degradation as a metabolic pathway enriched in asymptomatically colonized patients, we hypothesized that C. difficile would be unable to use this carbohydrate. Indeed, when grown on sucrose as the sole carbon source, strains achieved a median maximum A600 ~4.7-fold less than that of growth on fructose. C. difficile’s restricted carbohydrate metabolism, coupled with the presence of commensal Clostridia could hamper progression to CDI.
We hypothesized that the differential abundance of identified stool metabolites in these patient cohorts is related to the metabolism of specific microbes or host processes. We performed a sparse partial least-squares-discriminatory analysis (sPLS-DA) with the mixOmics package to define relationships between the most predictive features of patient metabolomes and microbiomes. We optimized the number of latent components (Figure 4—figure supplement 1A) and number of variables (Figure 4—figure supplement 1B). Our final model contained two latent components, with the first one composed of 15 metabolites and 25 microbial species. Of the largest metagenomic variable weights, four out of five species (C. difficile, a Lachnospiraceae spp., Anaerostipes hadrus, and Clostridium clostridioforme) were also significantly associated with an EIA state (Figure 1). Of the metabolomic variable weights (Figure 4A), the 10 highest-weighted metabolites were also discovered by previous analyses (Figure 2). The predictive value of each of the components per block was greater that an area under the curve (AUC) of 0.85, with the second metagenomic block component having the best performance (AUC = 0.94, Figure 4—figure supplement 1C). The strong performance of the latent components in classifying samples via EIA status validated our previous findings. Using the variables defining the first latent component, we performed correlational analyses (Figure 4B) and found a number of striking correlations. C. difficile abundance was positively correlated with a number of well-known Stickland metabolites (5-amino-valeric acid and 4-methylpentanoic acid, rho = 0.48 and 0.36, respectively)(Robinson et al., 2019), whereas C. difficile had negative correlations with fructose, rhamnose, and hydroxyproline (rho = –0.27, 0.36, and –0.34, respectively). Given our metagenomic data suggesting that Kraken metagenomic profiling yielded more sensitive estimates of C. difficile abundance, we performed an independent multi-omics analysis on the same dataset using the Kraken metagenomic data. Using a similar process of model building as above, the final model consisted of two latent components, with 15 metabolites and 15 microbes in the first component (Figure 4—figure supplement 1C). C. difficile was also most positively correlated to 5-amino-valeric acid and 4-methylpentanoic acid, with corresponding negative correlations to fructose, rhamnose, and hydroxyproline (Figure 4—figure supplement 1D). These microbe-metabolite relationships highlight the known pathophysiology of CDI, and identify novel C. difficile-carbohydrate relationships that define asymptomatic colonization.
Figure 4 with 1 supplement see all
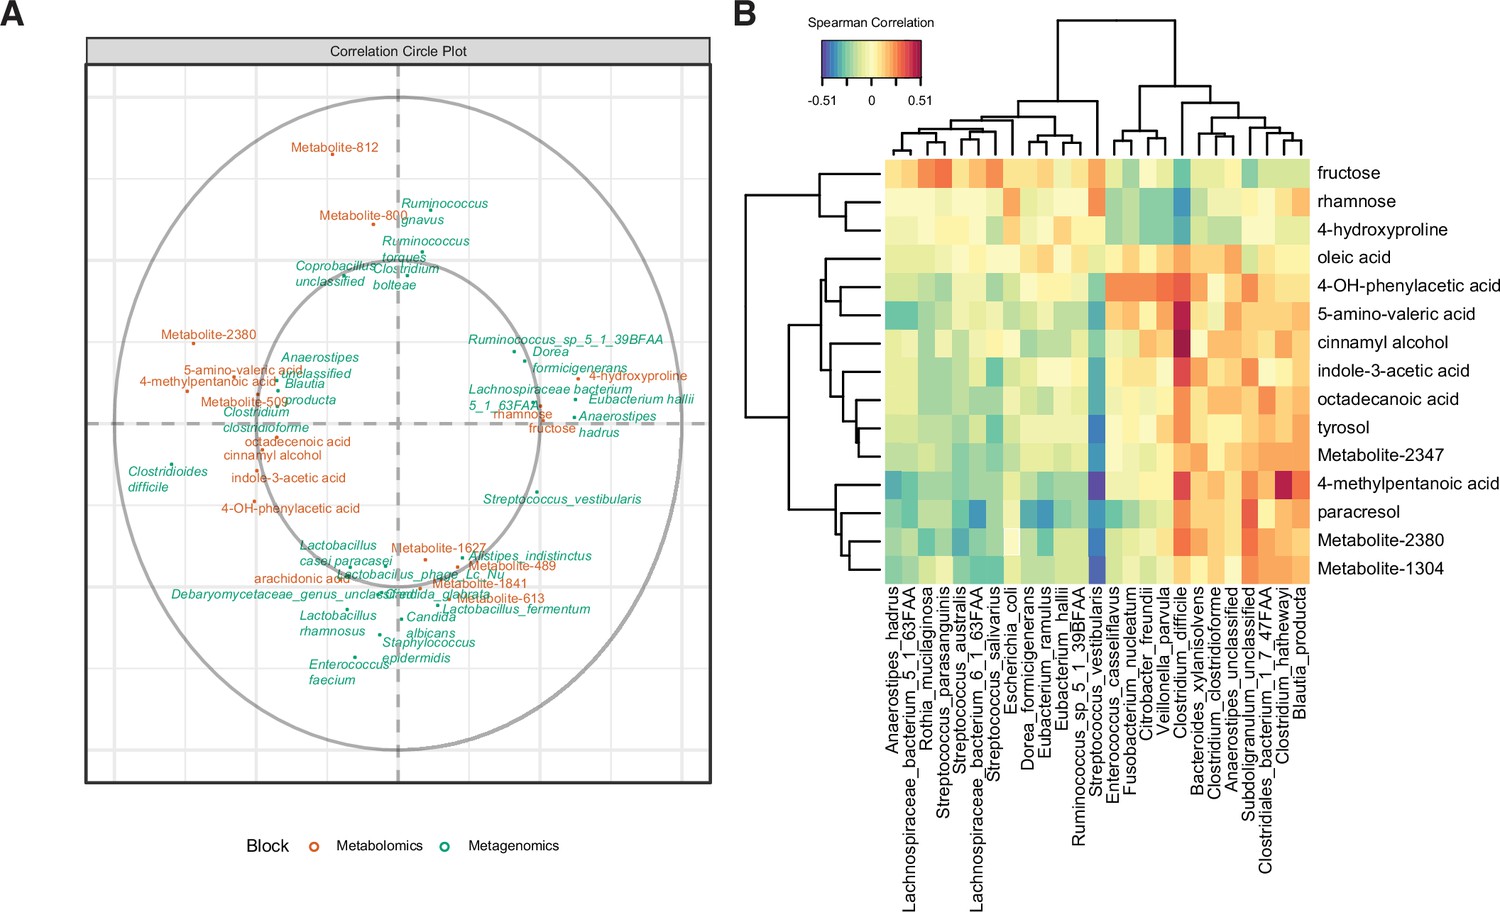
Multi-omics signature of C. difficile-colonized patients reveals C.difficile-metabolite relationships.
(A) Correlation circle indicating the contribution of each variable (microbe or metabolite) to latent component of sparse partial least-squares-discriminatory analysis (sPLS-DA) using MetaPhlAn2 data. (B) Heatmap of Spearman correlations between metagenomic and metabolomic variables from the first latent component using MetaPhlAn2 data.
Given the anticorrelation between C. difficile and rhamnose, we sought to explain the enrichment of this carbohydrate in asymptomatically colonized patients. Though C. difficile cannot grow on rhamnose as the sole carbohydrate, in other organisms rhamnose has substantial transcriptional influence over carbon catabolite gene clusters (Egan and Schleif, 1993; Hirooka et al., 2015). We wanted to rule out the possibility that rhamnose may impact C. difficile through possibly cryptic transcriptional reprogramming, perhaps contributing to C. difficile repression in vivo. Accordingly, we performed whole transcriptome RNA sequencing on C. difficile cultures exposed to a metabolizable substrate, fructose, or a non-metabolizable substrate, rhamnose. In the presence of fructose, we found 555 genes significantly altered (adjusted p-value < 0.05 and |fold-change| > 2) (Supplementary file 4). Some of the most altered genes were indicative of carbon catabolite repression of sugar transport and upregulation of glycolytic processes to metabolize fructose. In contrast, we found only three genes significantly increased in the rhamnose condition. The lack of striking systems-level or targeted (toxin expression, sporulation) regulation by rhamnose, and C. difficile’s inability to utilize it, leads us to conclude that its association with asymptomatically colonized patients’ microbiomes is not through direct interaction or suppression of C. difficile. Instead, we speculate that rhamnose may be the byproduct of a complex commensal metabolism of other dietary polysaccharide substrates, which could exclude C. difficile from the GI tract.
Discussion
Factors affecting the outcome of C. difficile colonization
Susceptibility to CDI is the result of a complex interaction between host factors (variation in bile acid metabolism, adaptive immunity) and abiotic factors such as antibiotic treatment and diet (Mullish and Allegretti, 2021; Littmann et al., 2021). These variables largely affect colonization resistance in the gut microbiome community and influence pathogen proliferation (germination rate, variation in toxin activity, and metabolic capacity). Our study endeavored to identify gut microbiome signatures (both taxonomic and metabolic), bacteriologic traits, and antibiotic exposure histories that might help explain Cx+/EIA- C. difficile colonization. Clinically, this manifestation is an intermediate state on the spectrum of C. difficile- associated disease and correspondingly, a diagnostic conundrum. One limitation of this study is our inability to assess dietary histories of patients leading up the diagnostic event. The metabolomic data provides a snapshot in time. While we hypothesize the increase in monosaccharides is due to an increase in carbohydrate degradation within the community, it is unclear whether the carbohydrate signature is due to microbial community differences in cross-feeding rates or differences in host diet.
Another important limitation to this study is our inability to control for C. difficile strain differences and correspondingly, heterogeneity in processes such as spore germination, nutrient utilization, and toxin expression in vivo (Kumar et al., 2019; Hunt and Ballard, 2013). Strains infecting Cx+/EIA+ patients were more likely to contain the cdtAB toxin locus, and the distribution of ribotypes was qualitatively different between the two cohorts (indicating significant pathogen variation). In vitro examination of toxin production (TcdA and TcdB) using a commercial ELISA indicated that over half of isolates expressed detectable levels of toxins. Toxin expression is well-known to be regulated by nutrient conditions and although our in vitro data indicate that both cohorts contain similar numbers of strains capable of producing toxin in vitro, such conditions are considered inadequate to predict in vivo levels of toxin production (Burnham and Carroll, 2013; Akerlund et al., 2006). Further, we found that a diverse set of clinical C. difficile strains might have variation in their ability to utilize nutrients such as sorbitol, which contrasts with reports of model C. difficile strains harboring more flexibility in their ability to utilize nutrients (Theriot et al., 2014; Jenior et al., 2017; Scaria et al., 2014). The outcome of strain level differences in metabolism and virulence is further complexified by in vivo conditions that might influence pathogen proliferation. Yet, we speculate that certain gastrointestinal environments both encourage some growth of C. difficile and discourage the elaboration of toxin, as toxin expression is actively repressed in nutrient-rich conditions.
Antibiotic treatment is the most well-understood risk factor for CDI (Stevens et al., 2011; Deshpande et al., 2013), and antibiotic exposure in our cohort likely results in loss of the species we find depleted from CDI patients. Here, we confirm that exposure to a number of antibiotics is associated with CDI patients, including cephalosporins (significantly associated) and intravenous vancomycin (weakly associated). Clindamycin and quinolones, two antibiotics also associated with CDI in other human cohorts (Teng et al., 2019) are likely not significantly associated in our population due to the low prevalence of their exposure. Our microbiome data reveals decreased levels of Streptococcus, Ruminococcus, and Eubacterium spp. in CDI patients. Findings from both human cohorts and mouse models of antibiotic treatment indicate that a number of clostridial taxa are depleted upon administration of a variety of antibiotic treatments (Palleja et al., 2018; Rashid et al., 2015). It is also posited that some of these taxa are integral to protection from CDI (Mills et al., 2018). Given the attempts to use FMTs or Firmicutes-enriched probiotics to prevent CDI, we hypothesize that the restoration of lost species from class Clostridia after high-risk antibiotic treatment could be a novel avenue for CDI prevention (McGovern et al., 2021).
Gut metabolites as markers of C. difficile proliferation and the microbiome
While metabolites associated with CDI and correlated with C. difficile abundance (4-methyl-pentanoic acid and 5-amino-valeric acid) clearly reflect C. difficile proliferation (Akerlund et al., 2006), the metabolites associated with Cx+/EIA- patients could reflect a number of non-mutually exclusive biological scenarios, indicating either the absence of C. difficile proliferation or the presence of a stable community where C. difficile pathogenesis is prevented by community metabolic elements.
In the one scenario, we reference two metabolites, 4-hydroxyproline and sorbitol, which have been considered host products of collagen degradation and inflammation (Fletcher et al., 2021; Pruss and Sonnenburg, 2021). The abundance of 4-hydroxyproline in the stools of Cx+/EIA- and its anticorrelation with C. difficile levels would suggest that it is a substrate consumed by C. difficile during pathogenesis. In a mouse model of CDI, sugar alcohols and amino acids observed before infection were considered representative of a ‘pre-colonized state’ (Fletcher et al., 2018; Theriot et al., 2014), as these nutrients declined as CDI progressed. However, we restricted our cohort to patients who were not on their way to developing CDI, by excluding patients with EIA- stool if they were subsequently diagnosed with CDI or received empiric CDI treatment within 10 days of initial stool collection (Dubberke et al., 2018).
In another scenario, the overlap of signatures between pathways, metabolites, and microbes highlights a number of possible metabolic pathways that might be exclusionary to C. difficile, namely starch/sucrose degradation and rhamnose degradation. The combination of our microbiome data, which shows enrichment of number of commensal Clostridia such as Eubacterium spp.(Desai et al., 2016), starch/sucrose degradation pathways, and our in vitro data highlights a possible microbe-metabolite combination that could prevent C. difficile proliferation. Rhamnose is a major component of plant and some bacterial cell-wall polysaccharides (Silva et al., 2020). Metabolic pathway profiling revealed an enrichment of fucose and rhamnose degradation pathways in asymptomatically colonized patients, represented by Enterobacterales taxa. Therefore, we propose that the detected rhamnose is a byproduct of commensal catabolism of more complex polysaccharides containing rhamnose (Porter and Martens, 2017; Mistou et al., 2016). These findings are of course limited by the scope of the in vitro experiment and the correlative nature of our microbiome data. Future work examining in vivo competition between diverse C. difficile isolates and commensal isolates with critical metabolic elements would be required.
Lactulose was a carbohydrate associated with asymptomatically-colonized patients and not a robust growth substrate for C. difficile. Interestingly, lactulose has been previously associated with a decrease in C. difficile-related diarrhea (Maltz et al., 2020) and decreased risk of CDI (Maltz et al., 2020; Agarwalla et al., 2017). Lactulose is a disaccharide product from heat treatment of lactose (a common sugar in dairy products), but it is also a component of some laxatives (Adachi, 1958). However, patients were screened and excluded from this cohort if they were prescribed laxatives in the 24 hr prior to sample collection. In addition to this screening/exclusion criteria, lactulose is almost exclusively prescribed to liver failure patients (there were none reported in this study), thus it is more likely to be present from consumption of heated milk (containing lactose). Other in vitro work demonstrates that addition of ‘non-digestible’ oligosaccharides, such as lactulose, provides a competitive advantage to Bifidobacterium spp. over C. difficile (Kondepudi et al., 2012; Hopkins and Macfarlane, 2003). While we do not recommend lactulose, a laxative, as such a prebiotic, there are a number of other ‘non-digestible’ oligosaccharides that might serve similar purposes in future interventions (Hopkins and Macfarlane, 2003). Taken together, these data emphasize the potential for synthetic or natural prebiotic interventions to shift a vulnerable microbiota away from CDI.
Strategies to ameliorate toxigenic C. difficile proliferation
Our multi-omics analyses of a colonized asymptomatic patient population support a growing body of literature concerning commensal metabolism as a tool against C. difficile. Evidence from both mouse models of disease and human studies indicate that administration of polysaccharides or ‘microbial accessible carbohydrates’ may prevent C. difficile proliferation or decrease the risk of CDI (Mefferd et al., 2020; Schnizlein et al., 2020; Hryckowian et al., 2018; Maltz et al., 2020; Lewis et al., 2005). Recently, a probiotics-based attempt to design a consortium of mucosal sugar utilizers revealed its ability to decrease C. difficile colonization in vivo (Pereira et al., 2020), indicating that increasing mucosal metabolism, or carbohydrate catabolism, may be another route to strengthening commensal resistance to C. difficile. Interestingly, previous attempts to combinatorically assemble species and nutrient combinations that might inhibit C. difficile indicate that success is afforded by species able to competitively utilize carbohydrates such as sorbitol and mannitol (Ghimire et al., 2020). Given the plethora of prebiotics and probiotics explored in the C. difficile field, we emphasize the need for an approach that harnesses both probiotic- and prebiotic-based components to inhibit the proliferation of C. difficile and toxin-mediated pathogenesis.
Materials and methods
Patient cohort analysis
Request a detailed protocolA previous retrospective cohort study was conducted to understand C. difficile colonization. In that study, C. difficile isolates were cultured from patient stool as described. Ribotyping was performed using the DiversiLab Bacterial Barcodes software (bioMerieux) (Dubberke et al., 2018; Westblade et al., 2013). Analysis of isolate genetic traits and in vitro toxin production was performed on the 102 isolates for which we had corresponding metagenomic sequencing data (see below). Data concerning isolate ribotype was aggregated into the three most abundant ribotypes (ribotype 027, ribotype 106, ribotype 14/20), where all other ribotypes or unclassified strains were grouped into ‘Other’. For the purposes of this study, data concerning inpatient antibiotic orders were retrospectively collected from the electronic medical informatics database for patients with toxin EIA positive (Cx+/EIA+) stool (n = 62) or toxin EIA negative (Cx+/EIA-) stool (n = 62). The presence of antibiotic orders was classified into three dichotomous groups by timing of exposure: antibiotics in 0–7 days before stool collection (1 week), antibiotics in >7–14 days before stool collection (2 weeks), and antibiotics in >14–30 days before stool collection (1 month). To understand the specific antibiotics associated with EIA status in our patient cohort, raw antibiotic exposure data was aggregated by time. Additionally, low-prevalent antibiotics ( < 10% exposure in patients) were removed from analysis. Logistic regression analysis was performed using the glm function in R. To understand overall antibiotic exposure as it relates to EIA status, any antibiotic exposure was considered ‘1’ and zero antibiotic exposure in a patient was considered ‘0’. The binary antibiotic exposure variable was then used in linear mixed modeling analysis to understand species associated with antibiotic exposure.
Metagenomic sequencing and analysis of patient stool
Request a detailed protocolMetagenomic DNA was extracted from patient stools as previously described (Fishbein et al., 2021a). C. difficile was isolated from patient stools as previously described (Fishbein et al., 2021a). Illumina libraries of patient stool metagenomic DNA were prepared and pooled as previous described (Fishbein et al., 2021a; Baym et al., 2015). Fecal metagenomic libraries were submitted for 2 × 150 bp paired-end sequencing on an Illumina NextSeq High-Output platform. Reads were binned by index sequences and reads were trimmed and quality filtered using Trimmomatic v.0.38 (Bolger et al., 2014) to remove adapter sequences and DeconSeq (Schmieder and Edwards, 2011) to remove human sequences. Samples that were less than 15% bacterial DNA during initial sequencing were discarded, and all samples were sequenced to a depth of at least 5 million reads. Sample loss due to low bacterial DNA resulted in a smaller cohort than originally reported (Dubberke et al., 2018), with the final set of metagenomes representing 54 Cx+/EIA- and 48 Cx+/EIA+ patients.
We performed taxonomic profiling of metagenomic sequences using MetaPhlAn2 (Truong et al., 2015), and functional pathway profiling using HUMAnN2 (Franzosa et al., 2018). MetaCyc pathway abundances were normalized to relative abundances using the humann2_renorm.py function. The humann2_barplot.py function was used to assess taxonomic composition of metabolic pathways. Custom python scripts were used to parse MetaPhlAn2 ‘_profiled_metagenome.txt’ and HUMAnN2 ‘pathwayabundance.txt’ files. Data were imported to R to analyze community composition and differential associations. To analyze carbohydrate-active enzymes, we used humann2_regroup.py and humann2_rename.py function to reannotate the ‘_genefamilies.txt’ files and identify genes with the enzyme classification number EC:3.2.1.*, representing glycosidases, enzymes that participate in carbohydrate degradation (Ghimire et al., 2020).
Metagenomic data analysis
Request a detailed protocolFor both microbiome and metabolomic data, the nearZeroVar function of the caret package was used to remove low-prevalent or invariant taxa/pathways/metabolites (Kuhn, 2008). These filtered data sets were analyzed for differential association and multi-omics modeling. Alpha-diversity and beta-diversity were calculated using the vegan package. Weighted UniFrac distance was used as a beta-diversity metric for microbial taxa and Bray Curtis dissimiliarity was used as a beta-diversity metric for metabolic pathways, while Euclidean distance was used as a beta-diversity metric for metabolomes. The MaAslin2 package was used for linear mixed modeling to identify microbial taxa, gene families, and metabolites associated with EIA/antibiotic exposure status.
To analyze HUMAnN2 pathways enriched in cohorts, we used statistical inference of associations between microbial communities and host phenotypes (SIAMCAT) (Wirbel et al., 2021), using the siamcat package in R, to fit an elastic net model to the data. We used the following parameters: log.std normalization, 10 folds and 10 resamples for data splitting. The model.interpretation.plot function was used to display features weights for features used in >70% of models generated in training.
Determination of candidate metabolites
Request a detailed protocolPutative identification of metabolites of interest (Supplementary file 3) was initially performed through spectral matching against the NIST14 electron ionization spectrum library. Several features were previously identified by our group (see Robinson et al., 2019). Features predicted to be sugars or sugar alcohols were compared to a panel of authentic standards (D-sorbitol, D-mannitol, D-fructose, L-rhamnose, L-fucose, lactulose, glucose, mannose, D-galactose, D-talose, myo-inositol, and L-sorbose). Because isomeric sugars generate very similar spectra, we utilized both spectral similarity and retention time to identify sugar metabolites (Figure 3—figure supplement 1).
Multi-omics analysis
Request a detailed protocolThe metagenomic relative abundance data was imputed with min(abundance >0)/2, and the metabolomic data was imputed with a value of 1. For both filtered datasets, a centered log-ratio transformation was used to analyze filtered metagenomic and metabolomic datasets above. The mixOmics (Rohart et al., 2017) package in R was used for multi-omics analysis of both MetaPhlAn and Kraken metagenomic relative abundance data. To avoid over-fitting on the large number of variables in our datasets, we utilized sPLS-DA. Briefly, to determine the number of variables from each dataset to keep in the final model, we estimated model error rates for all combinations of seq(15,30,5) variables for both metagenomic and metabolomic datasets, using the function tune.block.splsda (10-fold cross-validation, repeated 50 times, “max.dist” distance metric). Spearman correlations were calculated between CLR-transformed microbial taxa and metabolite abundances, from the variables defining the first latent components, and plotted using the cim package.
Bacteriology and in vitro growth assays
Request a detailed protocolC. difficile strains were isolated from patient stools by plating on cycloserine-cefoxitin fructose agar as previously described; strains were stored at –80°C (Fishbein et al., 2021a). C. difficile VPI10643 and C. difficile 630 reference strains were purchased from ATCC, and included in the assays described below using the same conditions as clinical isolates. For in vitro growth assays, CDMM was prepared as previously described (Karasawa et al., 1995) and 20 mM of specified carbohydrates were added. Clinical isolates were inoculated into tryptone-yeast extract (TY) broth and grown for 16 hr, then washed with PBS and diluted 1:100 into media with different carbohydrates sources. Growth was measured in a shaking, 96-well plate at 37°C for 48 hours.
In vitro ELISAs to assess toxin production in each isolate were performed on using TGCbiomics kits for ‘Simultaneous detection of TcdA and TcdB’ and ‘C. difficile GDH detection kit’ as a control ELISA. Cultures were grown for 24 hr in TY media in deep 96-well plate. Following, cultures were spun down and culture supernatants were diluted 1:5 in dilution buffer and loaded onto ELISA plates for detection of both toxin and control protein (GmbH), per manufacturer’s instructions. Isolates were considered positive for toxin if they had greater absorbance than that of the negative control.
RNA sequencing and data analysis
Request a detailed protocolFive mL of each strain (in biological triplicate) were grown to log-phase (OD600 ~0.4)in TY and exposed to TY- rhamnose or TY-fructose (with each carbohydrate at 30 mM). Cells were harvested by adding one volume of 1:1(v/v) acetone/ethanol to the culture to arrest growth and RNA degradation. Sample were spun at 4000 x g for 5 min. The cell pellet was washed with 500 µl TE buffer (0.5 M EDTA, 1 M Tris pH 7.4) and spun down to remove the supernatant. The cell pellet was resuspend in one mL Trizol and two rounds of bead-beating at 4500 rpm for 45 s were performed. A total of 300 µl of chloroform was added to the suspension, lysates were vortexed, and centrifuged at 4000 rpm for 10 min at 4°C. The aqueous layer was removed and RNA was precipitated using isopropanol, washed with 70% ethanol, and resolubilized in TE buffer. Total RNA was treated with Turbo DNase (for two rounds of digestion). rRNA depletion was performed using the QiaFastSelect kit (Hilden, Germany), following manufacturer’s instructions. Libraries were prepared using the rRNA-depleted RNA as input for NEBNext Ultra II RNA Library Prep Kit (NEB, Ipswich, MA). Libraries were pooled and submitted for 2 × 150 bp paired-end sequencing on an Illumina NextSeq High-Output platform at the Center for Genome Sciences and Systems Biology at Washington University in St. Louis.
Raw reads were trimmed using Trimmomatic v. 0.38, and aligned to a C. difficile VPI10643 reference genome (GCF_000155025.1) using Bowtie2. SAM files were converted to BAM format and indexed using samtools. Read counts for each gene feature were obtained using the featureCounts function of subread-1.6.5 package. Counts were manually imported into R, and DEseq2 was used to identify differentially expressed gene products in the case of TY-fructose relative to TY and TY-rhamnose relative to TY.
Data deposition
Request a detailed protocolMetagenomic reads were deposited under BioProject accession number PRJNA748262 and RNA sequencing reads were deposited under BioProject accession number PRJNA748261. All R code and metadata used to generate figures is deposited at https://github.com/srsfishbein/2021EIACdiff_multiomics, (Fishbein, 2021b copy archived at swh:1:rev:0c2a33d873e43194afb5818733e46c6ff28d6947).
Data availability
Metagenomics reads were deposited under BioProject accession number PRJNA748262 and RNA sequencing reads were deposited under BioProject accession number PRJNA748261.
-
NCBI BioProjectID PRJNA748262. Fecal metagenomes of C. difficile colonized patients.
-
NCBI BioProjectID PRJNA748261. C. difficile carbohydrate transcriptomics.
References
-
Lactulose Is Associated With Decreased Risk of Clostridium difficile Infection in Decompensated CirrhosisClinical Gastroenterology and Hepatology 15:953–954.https://doi.org/10.1016/j.cgh.2017.01.012
-
Trimmomatic: a flexible trimmer for Illumina sequence dataBioinformatics 30:2114–2120.https://doi.org/10.1093/bioinformatics/btu170
-
Diagnosis of Clostridium difficile infection: an ongoing conundrum for clinicians and for clinical laboratoriesClinical Microbiology Reviews 26:604–630.https://doi.org/10.1128/CMR.00016-13
-
A probiotic yeast-based immunotherapy against Clostridioides difficile infectionScience Translational Medicine 12:567.https://doi.org/10.1126/scitranslmed.aax4905
-
Understanding Clostridium difficile ColonizationClinical Microbiology Reviews 31:e00021-17.https://doi.org/10.1128/CMR.00021-17
-
Community-associated Clostridium difficile infection and antibiotics: a meta-analysisThe Journal of Antimicrobial Chemotherapy 68:1951–1961.https://doi.org/10.1093/jac/dkt129
-
Burden of Clostridium difficile on the healthcare systemClinical Infectious Diseases 55 Suppl 2:S88–S92.https://doi.org/10.1093/cid/cis335
-
Clostridium difficile colonization among patients with clinically significant diarrhea and no identifiable cause of diarrheaInfection Control and Hospital Epidemiology 39:1330–1333.https://doi.org/10.1017/ice.2018.225
-
A regulatory cascade in the induction of rhaBADJournal of Molecular Biology 234:87–98.https://doi.org/10.1006/jmbi.1993.1565
-
Phylogenetic diversity (PD) and biodiversity conservation: some bioinformatics challengesEvolutionary Bioinformatics Online 2:121–128.
-
Software2021EIACdiff_multiomics, version swh:1:rev:0c2a33d873e43194afb5818733e46c6ff28d6947Software Heritage.
-
Identification of Clostridioides difficile-Inhibiting Gut Commensals Using CulturomicsPhenotyping, and Combinatorial Community Assembly. MSystems 5:e19.https://doi.org/10.1128/mSystems.00620-19
-
Emerging Infections Program Clostridioides difficile Infection Working, Trends in U.SBurden of Clostridioides Difficile Infection and Outcomes. N Engl J Med 382:1320–1330.https://doi.org/10.1056/NEJMoa1910215
-
Nondigestible oligosaccharides enhance bacterial colonization resistance against Clostridium difficile in vitroApplied and Environmental Microbiology 69:1920–1927.https://doi.org/10.1128/AEM.69.4.1920-1927.2003
-
The emerging metabolic view of Clostridium difficile pathogenesisCurrent Opinion in Microbiology 35:42–47.https://doi.org/10.1016/j.mib.2016.11.006
-
Variations in virulence and molecular biology among emerging strains of Clostridium difficileMicrobiology and Molecular Biology Reviews 77:567–581.https://doi.org/10.1128/MMBR.00017-13
-
A defined growth medium for Clostridium difficileMicrobiology 141 (Pt 2):371–375.https://doi.org/10.1099/13500872-141-2-371
-
Building Predictive Models in R Using the caret PackageJournal of Statistical Software 28:1–26.https://doi.org/10.18637/jss.v028.i05
-
Effect of the prebiotic oligofructose on relapse of Clostridium difficile-associated diarrhea: a randomized, controlled studyClinical Gastroenterology and Hepatology 3:442–448.https://doi.org/10.1016/s1542-3565(04)00677-9
-
Multivariable association discovery in population-scale meta-omics studiesPLOS Computational Biology 17:e1009442.https://doi.org/10.1371/journal.pcbi.1009442
-
A High-Fat/High-Protein, Atkins-Type Diet Exacerbates Clostridioides (Clostridium)Difficile Infection in Mice, Whereas a High-Carbohydrate Diet Protects. MSystems 5:e19.https://doi.org/10.1128/mSystems.00765-19
-
Probiotics for prevention of Clostridium difficile infectionCurrent Opinion in Gastroenterology 34:3–10.https://doi.org/10.1097/MOG.0000000000000410
-
Bacterial glycobiology: rhamnose-containing cell wall polysaccharides in Gram-positive bacteriaFEMS Microbiology Reviews 40:464–479.https://doi.org/10.1093/femsre/fuw006
-
Clostridium difficile infection and antibiotic-associated diarrhoeaClinical Medicine 18:237–241.https://doi.org/10.7861/clinmedicine.18-3-237
-
The contribution of bile acid metabolism to the pathogenesis of Clostridioides difficile infectionTherapeutic Advances in Gastroenterology 14:17562848211017725.https://doi.org/10.1177/17562848211017725
-
Recovery of gut microbiota of healthy adults following antibiotic exposureNature Microbiology 3:1255–1265.https://doi.org/10.1038/s41564-018-0257-9
-
The Critical Roles of Polysaccharides in Gut Microbial Ecology and PhysiologyAnnual Review of Microbiology 71:349–369.https://doi.org/10.1146/annurev-micro-102215-095316
-
Determining the Long-term Effect of Antibiotic Administration on the Human Normal Intestinal Microbiota Using Culture and Pyrosequencing MethodsClinical Infectious Diseases 60 Suppl 2:S77–S84.https://doi.org/10.1093/cid/civ137
-
Metabolomic networks connect host-microbiome processes to human Clostridioides difficile infectionsThe Journal of Clinical Investigation 129:3792–3806.https://doi.org/10.1172/JCI126905
-
mixOmics: An R package for ’omics feature selection and multiple data integrationPLOS Computational Biology 13:e1005752.https://doi.org/10.1371/journal.pcbi.1005752
-
Comparative nutritional and chemical phenome of Clostridium difficile isolates determined using phenotype microarraysInternational Journal of Infectious Diseases 27:20–25.https://doi.org/10.1016/j.ijid.2014.06.018
-
Three Decades of Advances in Arabinogalactan-Protein BiosynthesisFrontiers in Plant Science 11:610377.https://doi.org/10.3389/fpls.2020.610377
-
Cumulative antibiotic exposures over time and the risk of Clostridium difficile infectionClinical Infectious Diseases 53:42–48.https://doi.org/10.1093/cid/cir301
-
Clostridium difficile Infection Risk with Important Antibiotic Classes: An Analysis of the FDA Adverse Event Reporting SystemInternational Journal of Medical Sciences 16:630–635.https://doi.org/10.7150/ijms.30739
-
MetaPhlAn2 for enhanced metagenomic taxonomic profilingNature Methods 12:902–903.https://doi.org/10.1038/nmeth.3589
-
Antibiotic Exposure and Risk for Hospital-Associated Clostridioides difficile InfectionAntimicrobial Agents and Chemotherapy 64:e02169-19.https://doi.org/10.1128/AAC.02169-19
-
Development and evaluation of a novel, semiautomated Clostridium difficile typing platformJournal of Clinical Microbiology 51:621–624.https://doi.org/10.1128/JCM.02627-12
Article and author information
Author details
Funding
National Institute of Diabetes and Digestive and Kidney Diseases (RO1DK111930)
- Jeffrey P Henderson
Centers for Disease Control and Prevention (200-2017-96178)
- Erik R Dubberke
National Center for Complementary and Integrative Health (R01AT009741)
- Gautam Dantas
National Institute for Occupational Safety and Health (R01OH011578l)
- Gautam Dantas
Congressionally Directed Medical Research Programs (W81XWH1810225)
- Gautam Dantas
Eunice Kennedy Shriver National Institute of Child Health and Human Development (T32 HD004010)
- Skye RS Fishbein
The funders had no role in study design, data collection and interpretation, or the decision to submit the work for publication.
Acknowledgements
The authors are grateful for members of the Dantas lab for their helpful feedback on the data analysis and preparation of the manuscript. The authors are specifically grateful to Drew J Schwartz for his insightful feedback. The authors would also like to thank the Edison Family Center for Genome Sciences and Systems Biology staff, Eric Martin, Brian Koebbe, MariaLynn Crosby, and Jessica Hoisington-López for their expertise and support in in sequencing/data analysis.
This work was supported in part by awards to ERD from the CDC Broad Agency Announcement, contract 200-2017-96178). JPH was supported by CDC (Broad Agency Announcement, contract (Broad Agency Announcement, contract 200-2019-05950) and the National Institute of Diabetes, Digestive, and Kidney Diseases of the National Institutes of Health (RO1DK111930). GD received support from the National Center for Complementary and Integrative Health (NCCIH: https://nccih.nih.gov/) of the National Institute of Health (NIH) under award number R01AT009741; the National Institute for Occupational Safety and Health (NIOSH: https://www.cdc.gov/niosh/index.htm) of the US Center for Disease Control and Prevention (CDC) under award number R01OH011578l, and the Congressionally Directed Medical Research Program (CDMRP: https://cdmrp.army.mil/prmrp/default) of the US Department of Defense DOD under award number W81XWH1810225. SRSF is supported by the T32 Pediatric Gastroenterology Research Training Program under the National Institute of Child Health and Human Development (NICHD: https://www.nicdhd.nih/gov) of the NIH under award number T32DK077653 (PI: P.I. Tarr).
Copyright
© 2022, Fishbein et al.
This article is distributed under the terms of the Creative Commons Attribution License, which permits unrestricted use and redistribution provided that the original author and source are credited.
Metrics
-
- 3,280
- views
-
- 408
- downloads
-
- 36
- citations
Views, downloads and citations are aggregated across all versions of this paper published by eLife.
Citations by DOI
-
- 36
- citations for umbrella DOI https://doi.org/10.7554/eLife.72801
Download links
A two-part list of links to download the article, or parts of the article, in various formats.
Downloads (link to download the article as PDF)
Open citations (links to open the citations from this article in various online reference manager services)
Cite this article (links to download the citations from this article in formats compatible with various reference manager tools)
Multi-omics investigation of Clostridioides difficile-colonized patients reveals pathogen and commensal correlates of C. difficile pathogenesis
eLife 11:e72801.
https://doi.org/10.7554/eLife.72801


