Efficient differentiation of human primordial germ cells through geometric control reveals a key role for Nodal signaling
- Department of Cell and Developmental Biology, University of Michigan Medical School, United States
- Department of Biomedical Engineering, University of Michigan, United States
- Center for Organogenesis, University of Michigan Medical School, United States
- Department of Internal Medicine, Gastroenterology, University of Michigan Medical School, United States
- Department of Physics, University of Michigan, United States
Figures
Figure 1 with 3 supplements
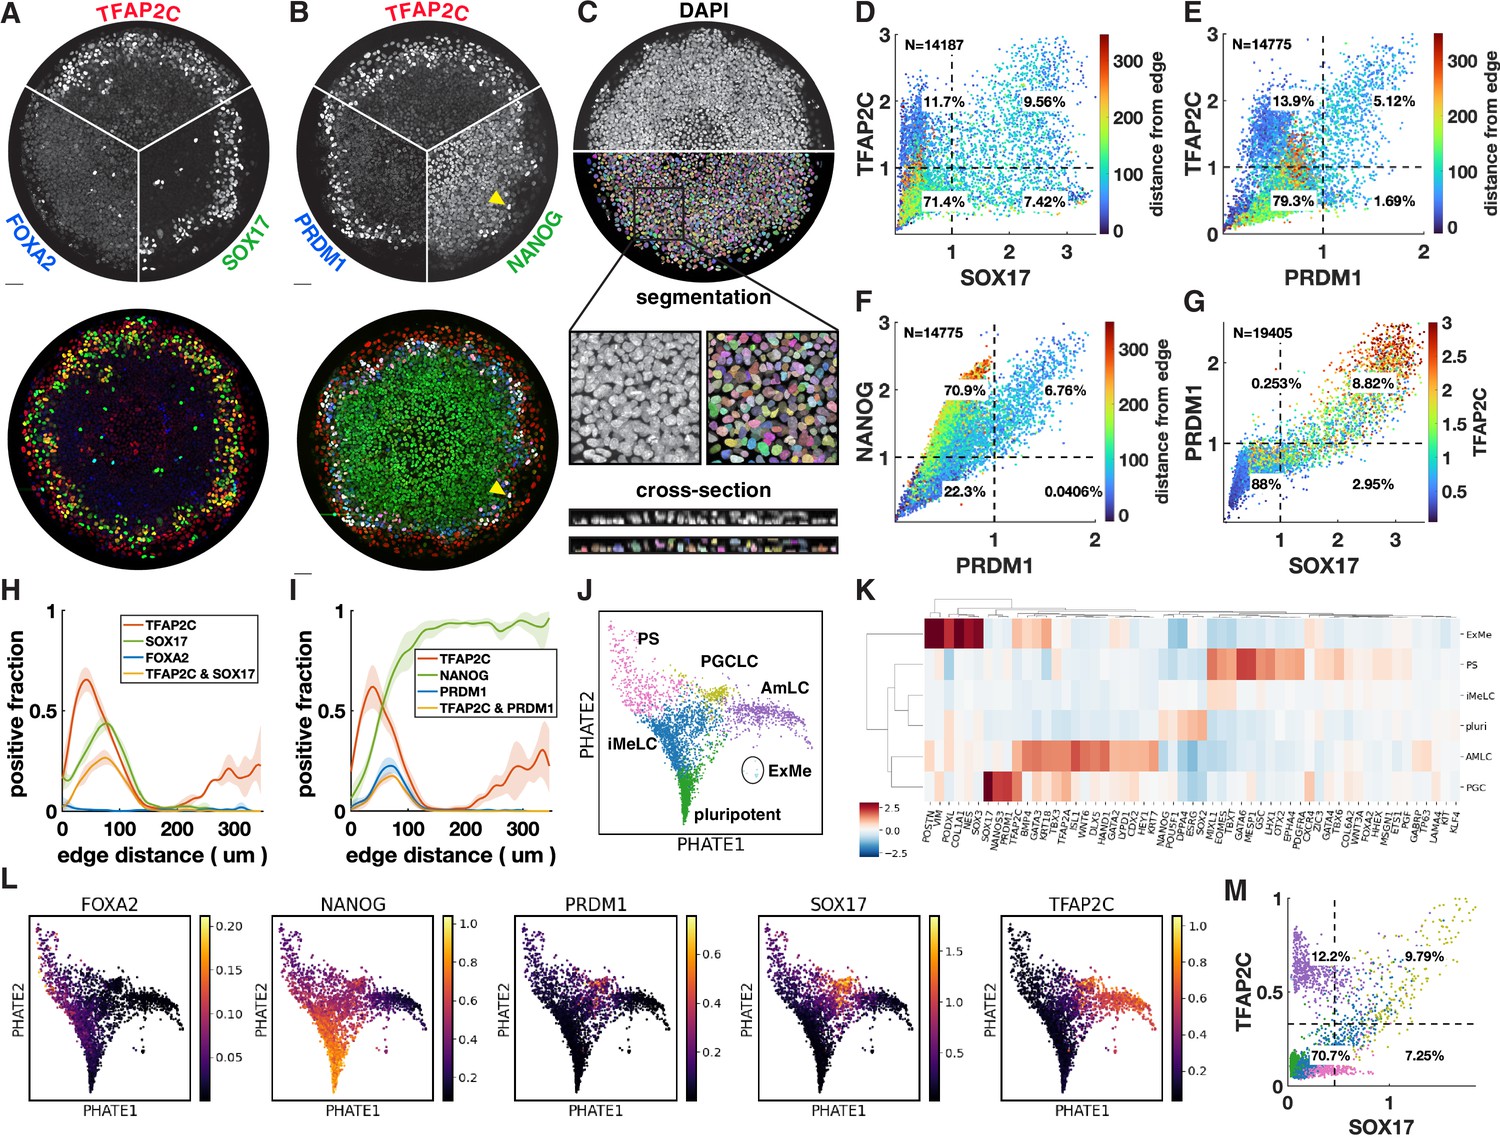
Primordial germ cell-like cells (PGCLCs) form at the interface between extraembryonic and primitive streak-like cells.
(A, B) Immunofluorescence for different marker genes (maximal intensity projection along z). Yellow arrowhead in (B) points to higher NANOG expression in PGCLCs than pluripotent cells in the colony center. (C) Segmentation of nuclei based on DAPI staining. (D–F) Scatterplots of marker expression colored for radial position, normalized to threshold and log(1 + x) transformed, (D) corresponds to (A); (E, F) correspond to (B). (G) Scatterplot of PRDM1 vs. SOX17 colored for TFAP2C. (H, I) Spatial distribution of positive cells, dark lines represent the mean kernel density estimate of the positive fraction over four colonies, colored bands represent the standard deviation. (J) Clusters generated by Louvain. (K) Heatmap of differential expression between clusters (average z-scores) of genes associated with gastrulation. (I) PHATE visualization of scRNA-seq data showing denoised expression of markers used in (B–I) (raw in Figure 1—figure supplement 2D). (M) Scatterplot of TFAP2C vs. SOX17 from denoised scRNA-seq data (raw in Figure 1—figure supplement 1P), with colors matching clusters in (J). Scale bars 50 µm. All colonies are 700 µm diameter.
Figure 1—figure supplement 1
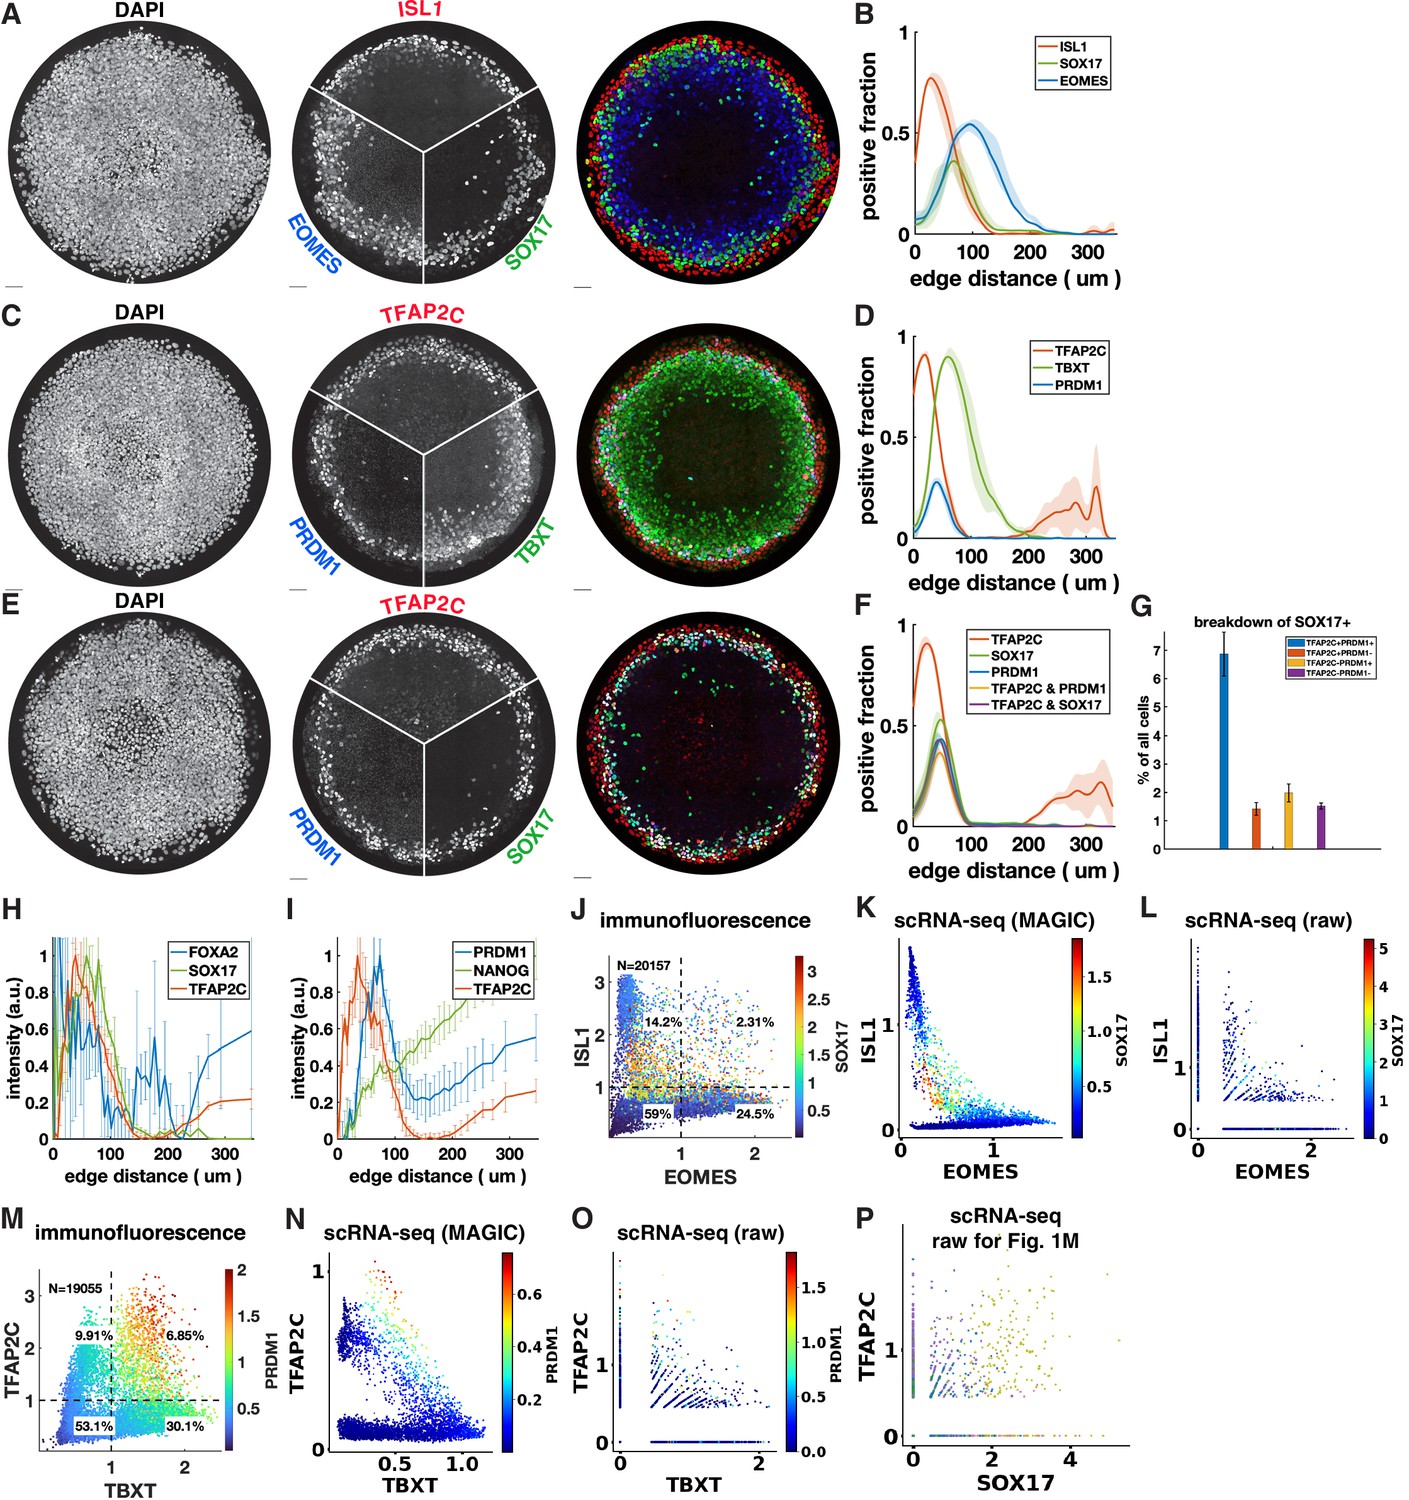
Quantitative relationships between marker genes with immunofluorescence (IF) and scRNA-seq.
(A–F) Additional stainings of micropatterned colonies and spatial distribution of positive cells. (G) Breakdown of cell populations corresponding to Figure 1G and (E, F). (H, I) Normalized radial intensity profiles corresponding to Figure 1A and B. (J–L) Scatterplots comparing the relationship between ISL1, EOMES, SOX17 measured with IF (K) and denoised (K) vs. raw (L) scRNA-seq. (M–O) Scatterplots comparing the relationship between TFAP2C, TBXT, PRDM1 measured with IF (M) and denoised (N) vs. raw (O) scRNA-seq. (P) Scatterplot of TFAP2C vs. SOX17 from scRNA-seq data before denoising with MAGIC, compare with Figure 1M.
Figure 1—figure supplement 2
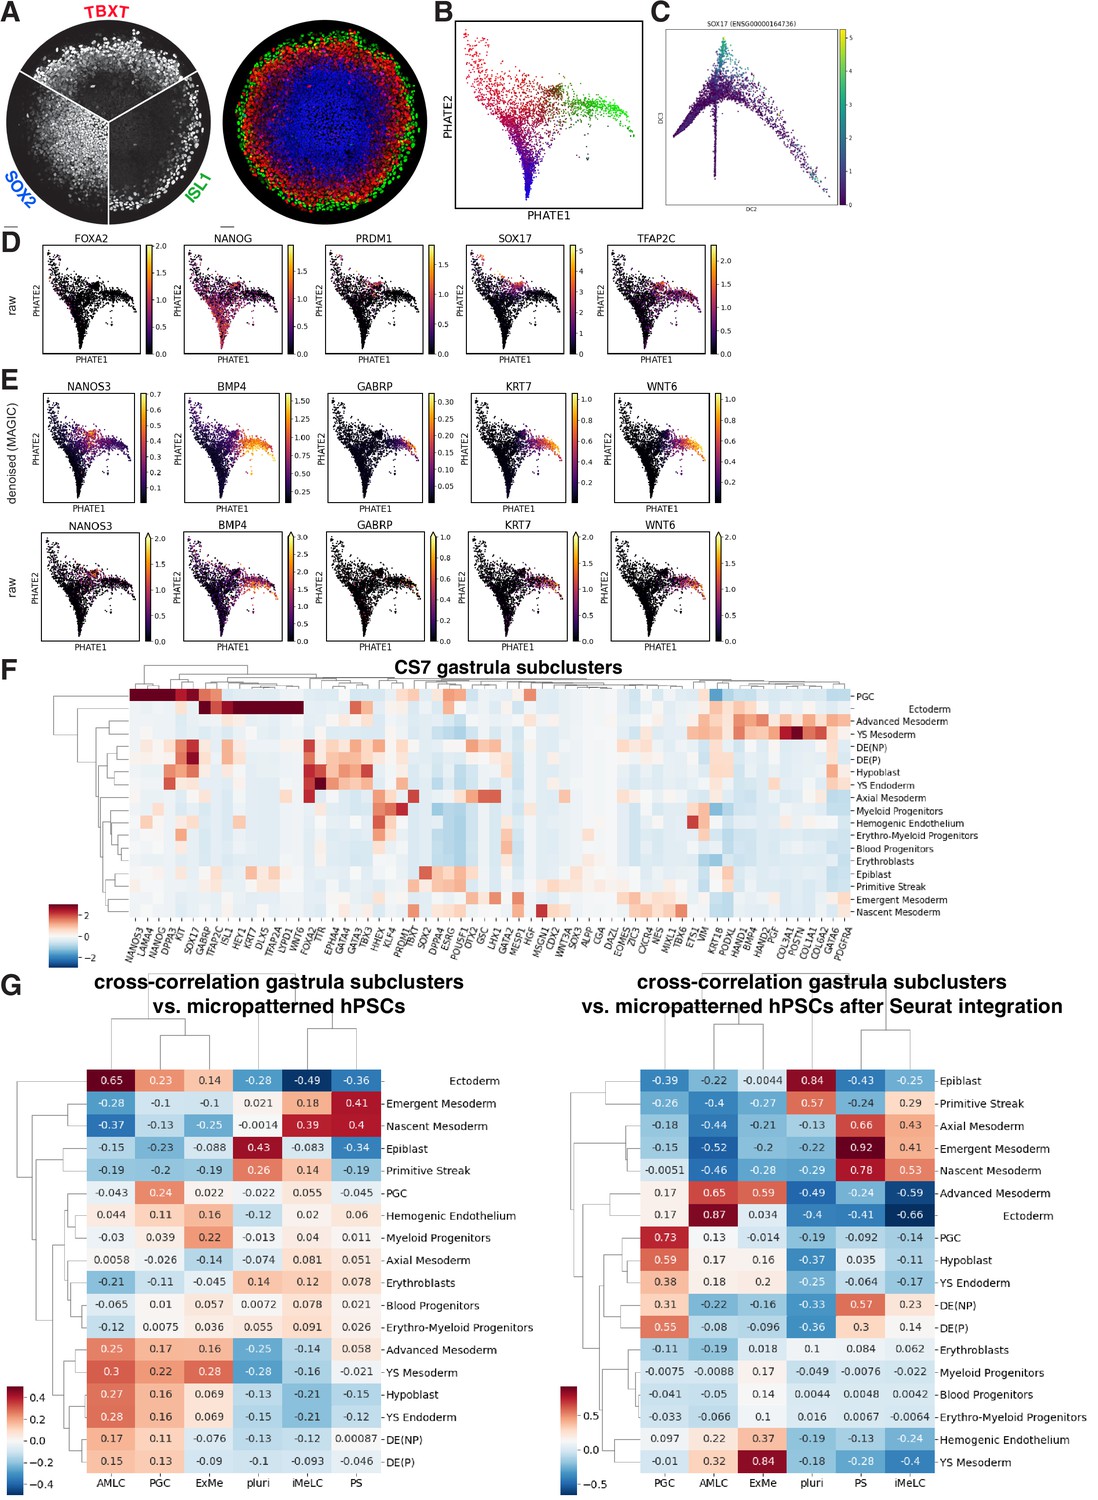
Additional scRNA-seq analysis, including correlation with CS7 human gastrula.
(A, B) Comparison of immunofluorescence (IF) for ISL1, TBXT, SOX2 with their expression on the PHATE visualization of the scRNA-seq data. (C) Primordial germ cells (PGCs) budding off as a lineage along diffusion component 3. (D) Visualization of raw expression corresponding to (L). (E) Expression of amnion and PGC markers on PHATE visualization with and without denoising. (F) Differential expression of gastrula markers from (K) in subclusters of CS7 human gastrula from Tyser et al. (G) Correlation of highly variable genes between the clusters from micropatterned human pluripotent stem cells (hPSCs) and clusters from human gastrula with and without integration using Seurat.
Figure 1—figure supplement 3
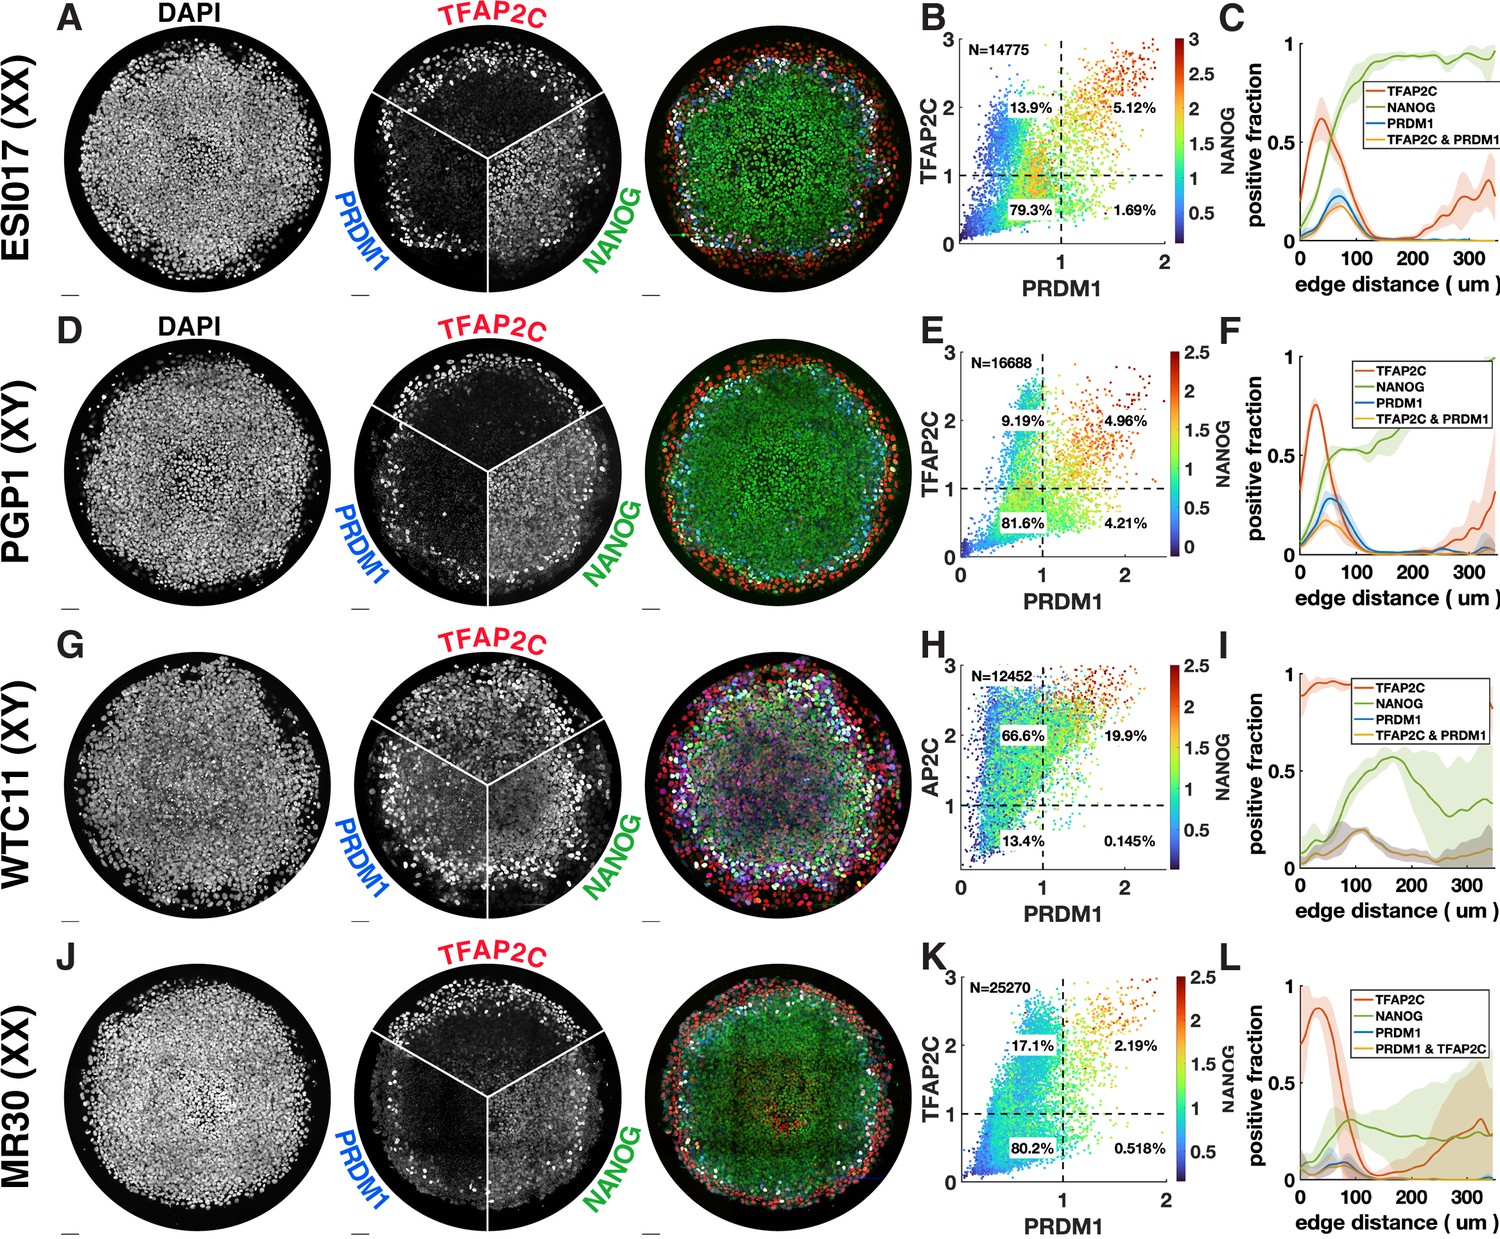
Primordial germ cell-like cell (PGCLC) differentiation in different male and female cell lines.
Each row shows immunofluorescence (IF) and quantification for PGC markers in different cell lines. (A–C) ESI017, also shown in Figure 1B, shown here for comparison. (E–F) PGP1, male induced pluripotent stem cell (iPSC). (G–I) WTC11, male iPSC. (J–L) MR30, female iPSC. WTC11, a widely used iPSC line deviates from the norm. It consistently expresses TFAP2C throughout the colony and gives rise to higher numbers of PGCLCs.
Figure 2 with 2 supplements
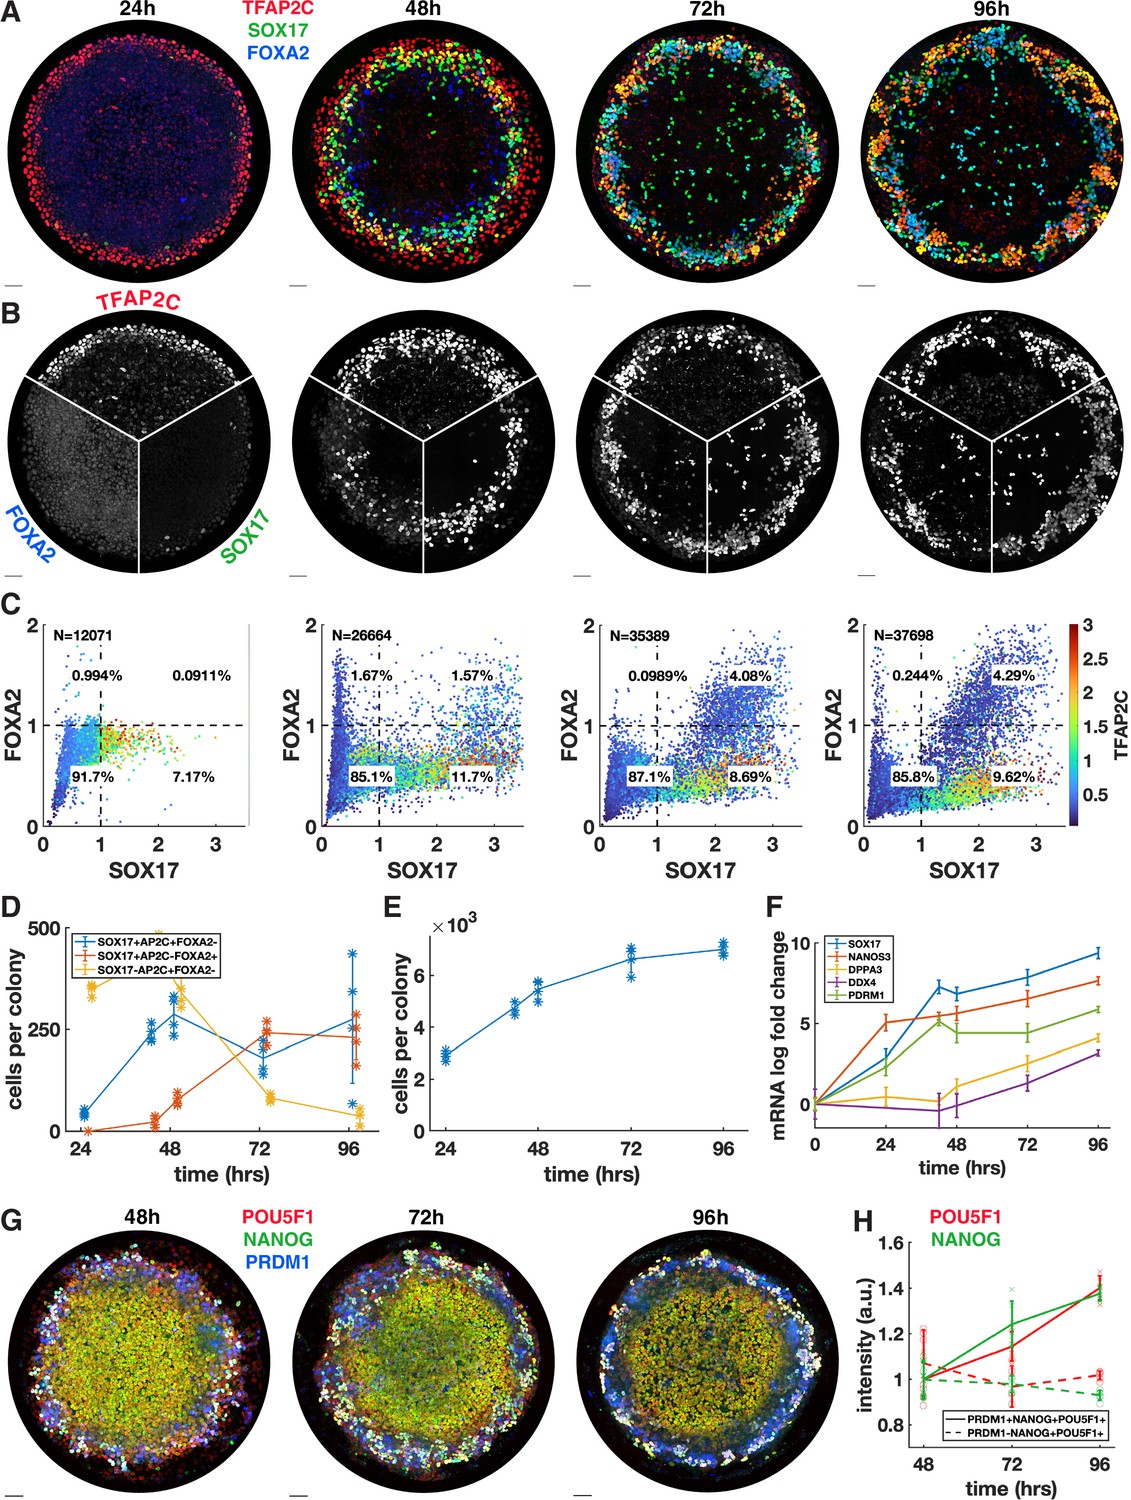
Primordial germ cells (PGCs) are specified by 42 hr but continue to mature while endoderm arises between 42 and 72 hr.
(A, B) Immunofluorescence over time showing a stable PGC population and later emergence of endoderm. (C) Quantification of marker expression at different times showing the emergence of endoderm starting at 48 hr. (D) Absolute numbers of cell-expressing marker combinations corresponding to endoderm (red, SOX17+ AP2C-FOXA2+) primordial germ cell-like cells (PGCLCs) (blue, SOX17+ AP2C+ FOXA2-) and SOX17-AP2C+ FOXA2- (yellow). (E) Average cell number per colony over time. (F) qPCR data for PGC markers over time. (G, H) Immunofluorescence and quantification of pluripotency markers in PGCs over time. DAPI stainings corresponding to (A, B) are shown in Figure 2—figure supplement 1. Scale bar 50 µm.
Figure 2—figure supplement 1
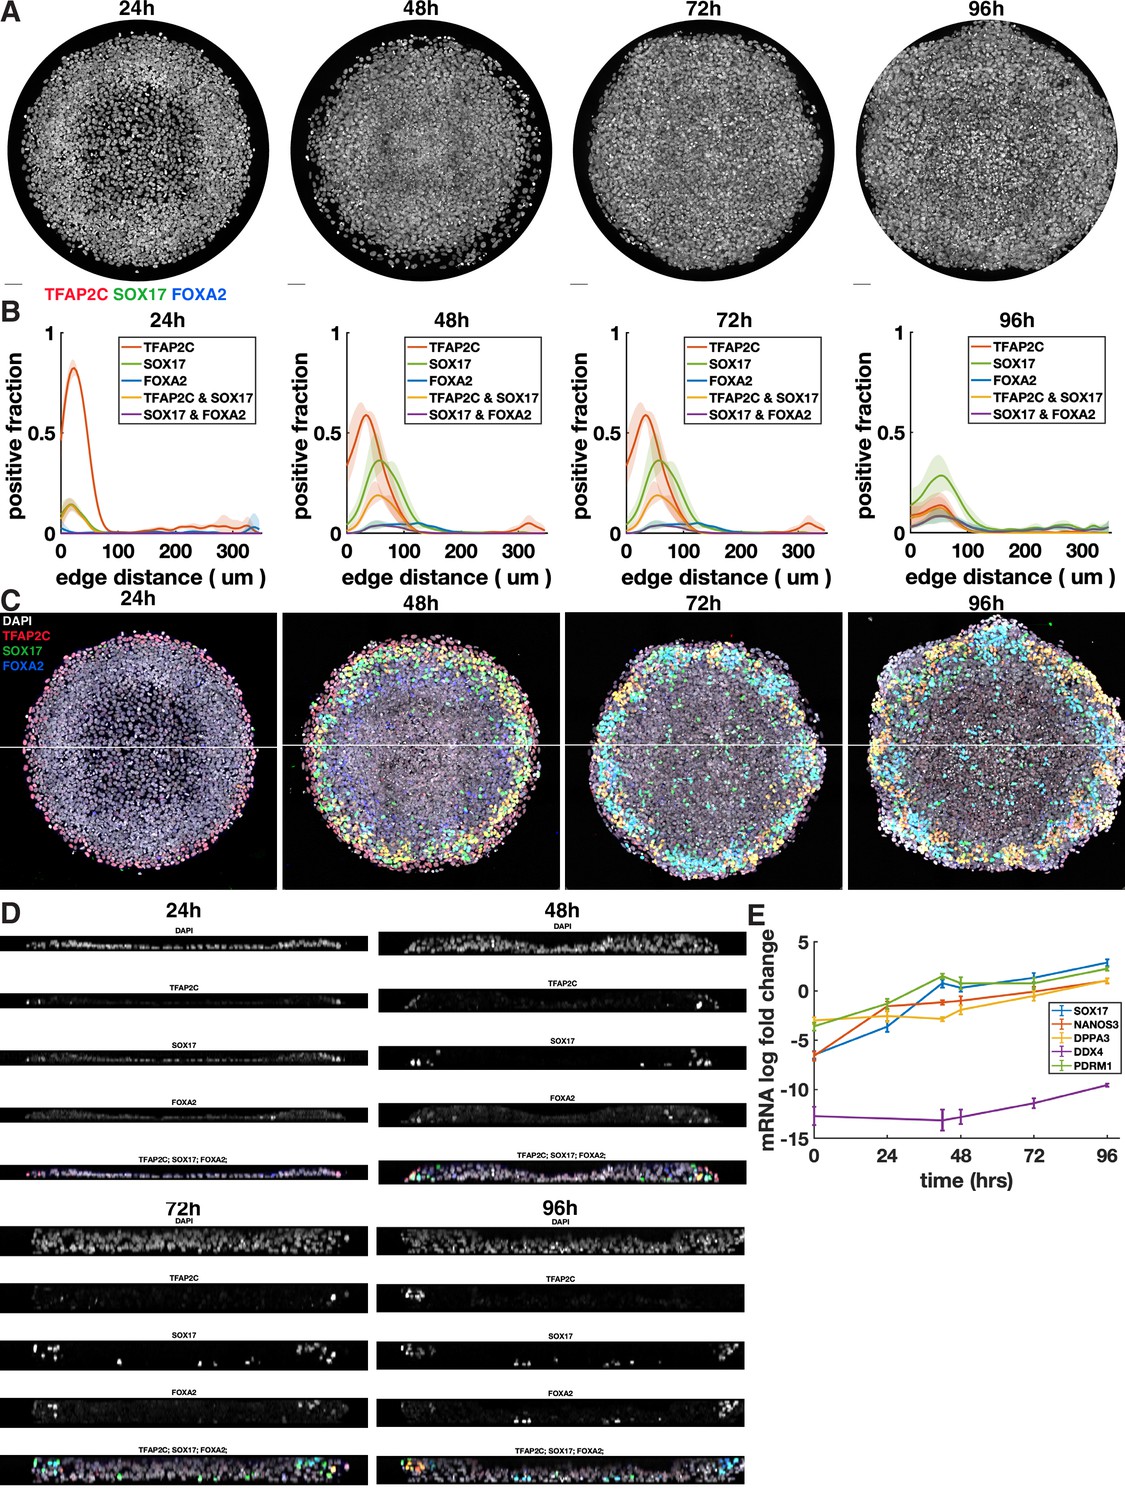
Additional images and quantification for time series up to 96 hr.
(A) DAPI staining for colonies shown in Figure 2A and B. (B) Radial profile of marker expression at different times. (C) Overlay of colonies from Figure 2A and B, including DAPI, showing location of cross section in (D). (D) Cross sections through colonies at different times. (E) qPCR data for primordial germ cell (PGC) markers over time without normalization to pluripotent cells (CT values relative to GAPDH).
Figure 2—figure supplement 2
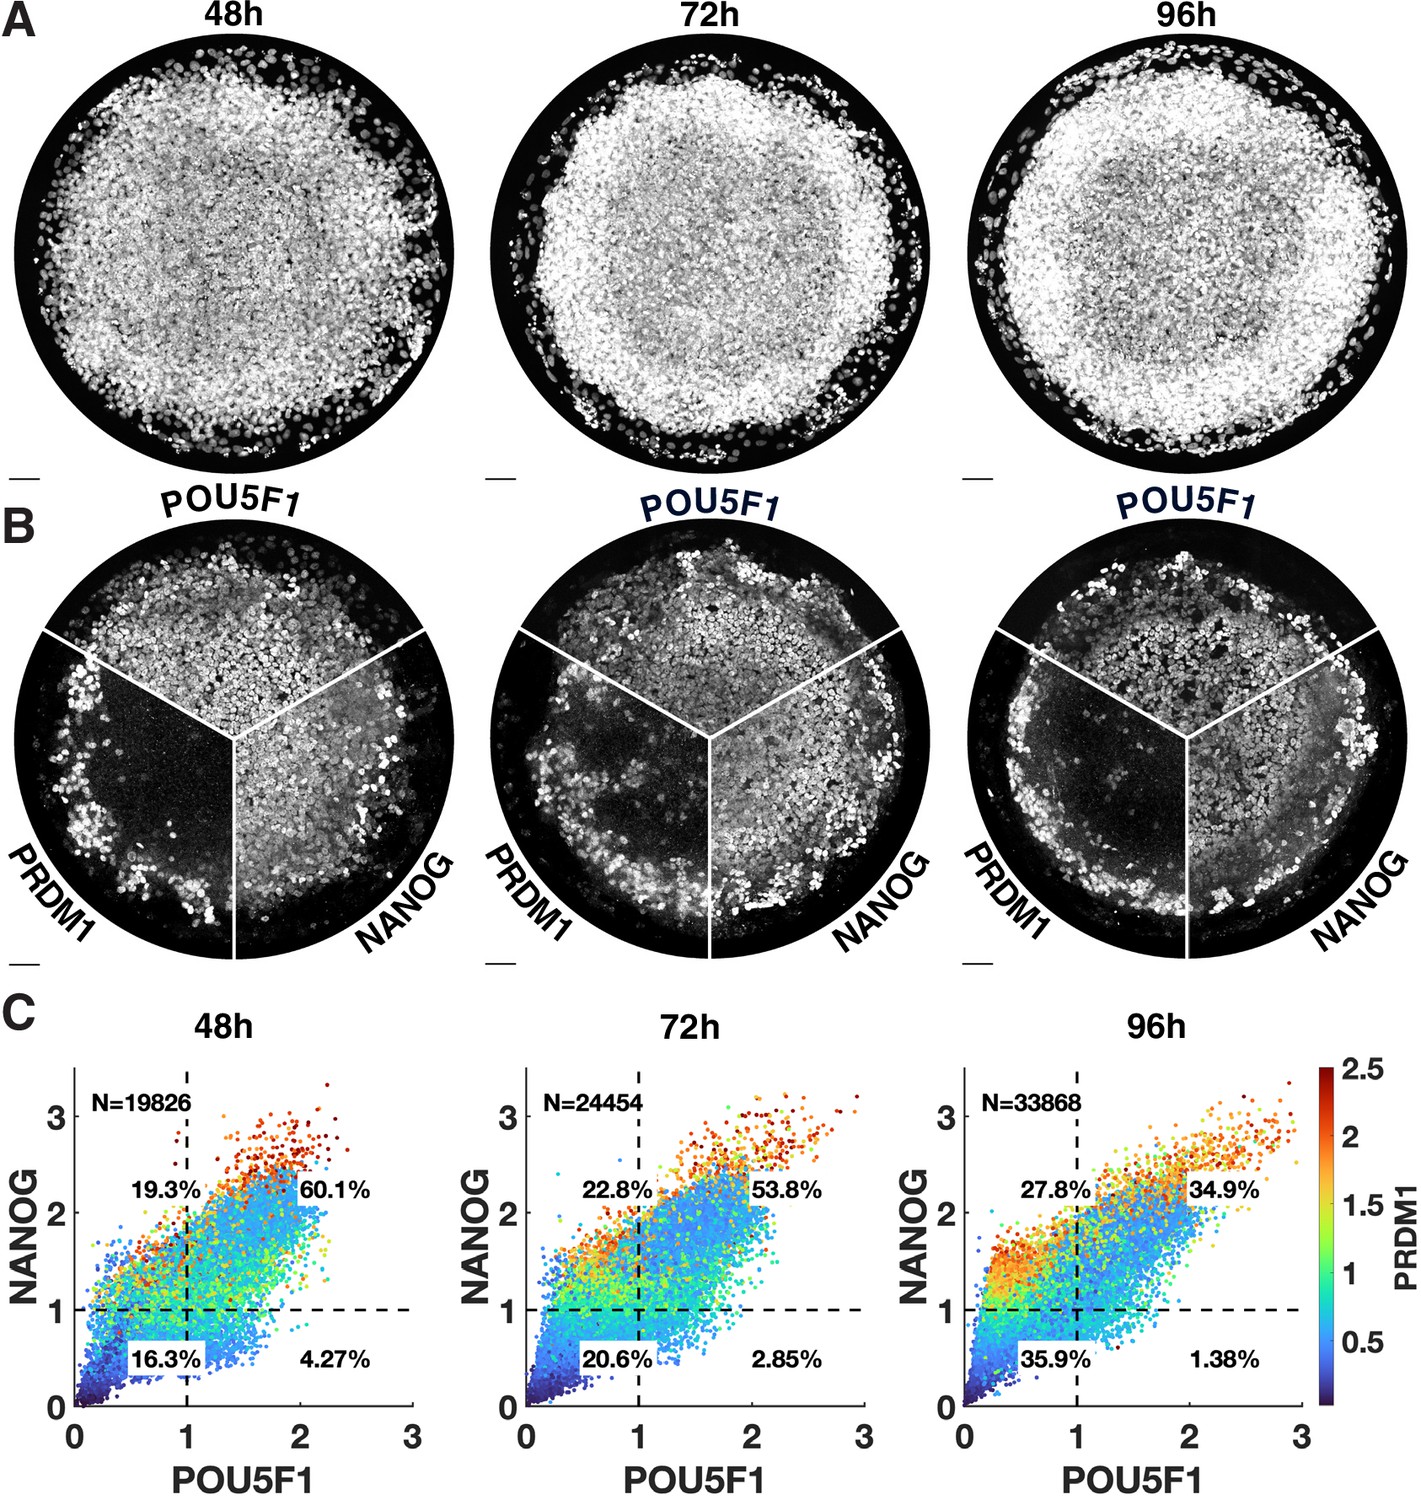
Additional images for pluripotency markers over time.
(A, B) Separate channels for Figure 2G. (C) Scatterplots of corresponding quantification.
Figure 3 with 1 supplement
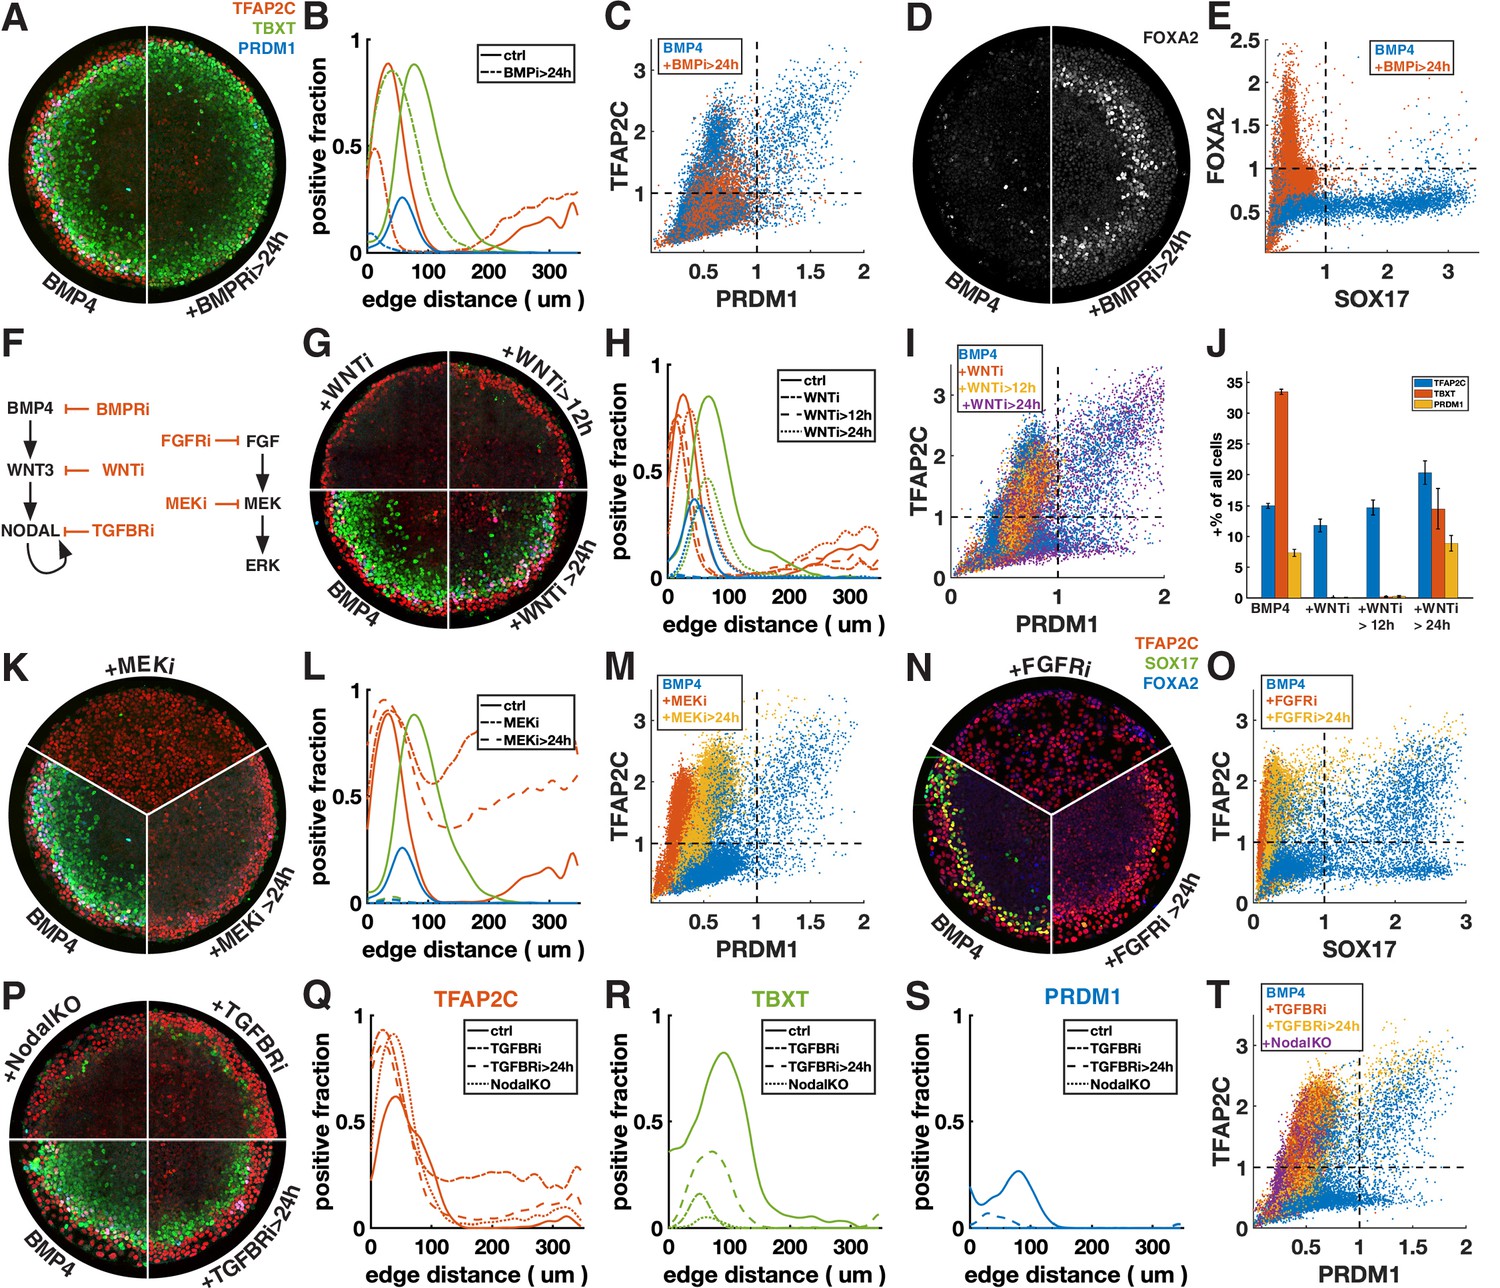
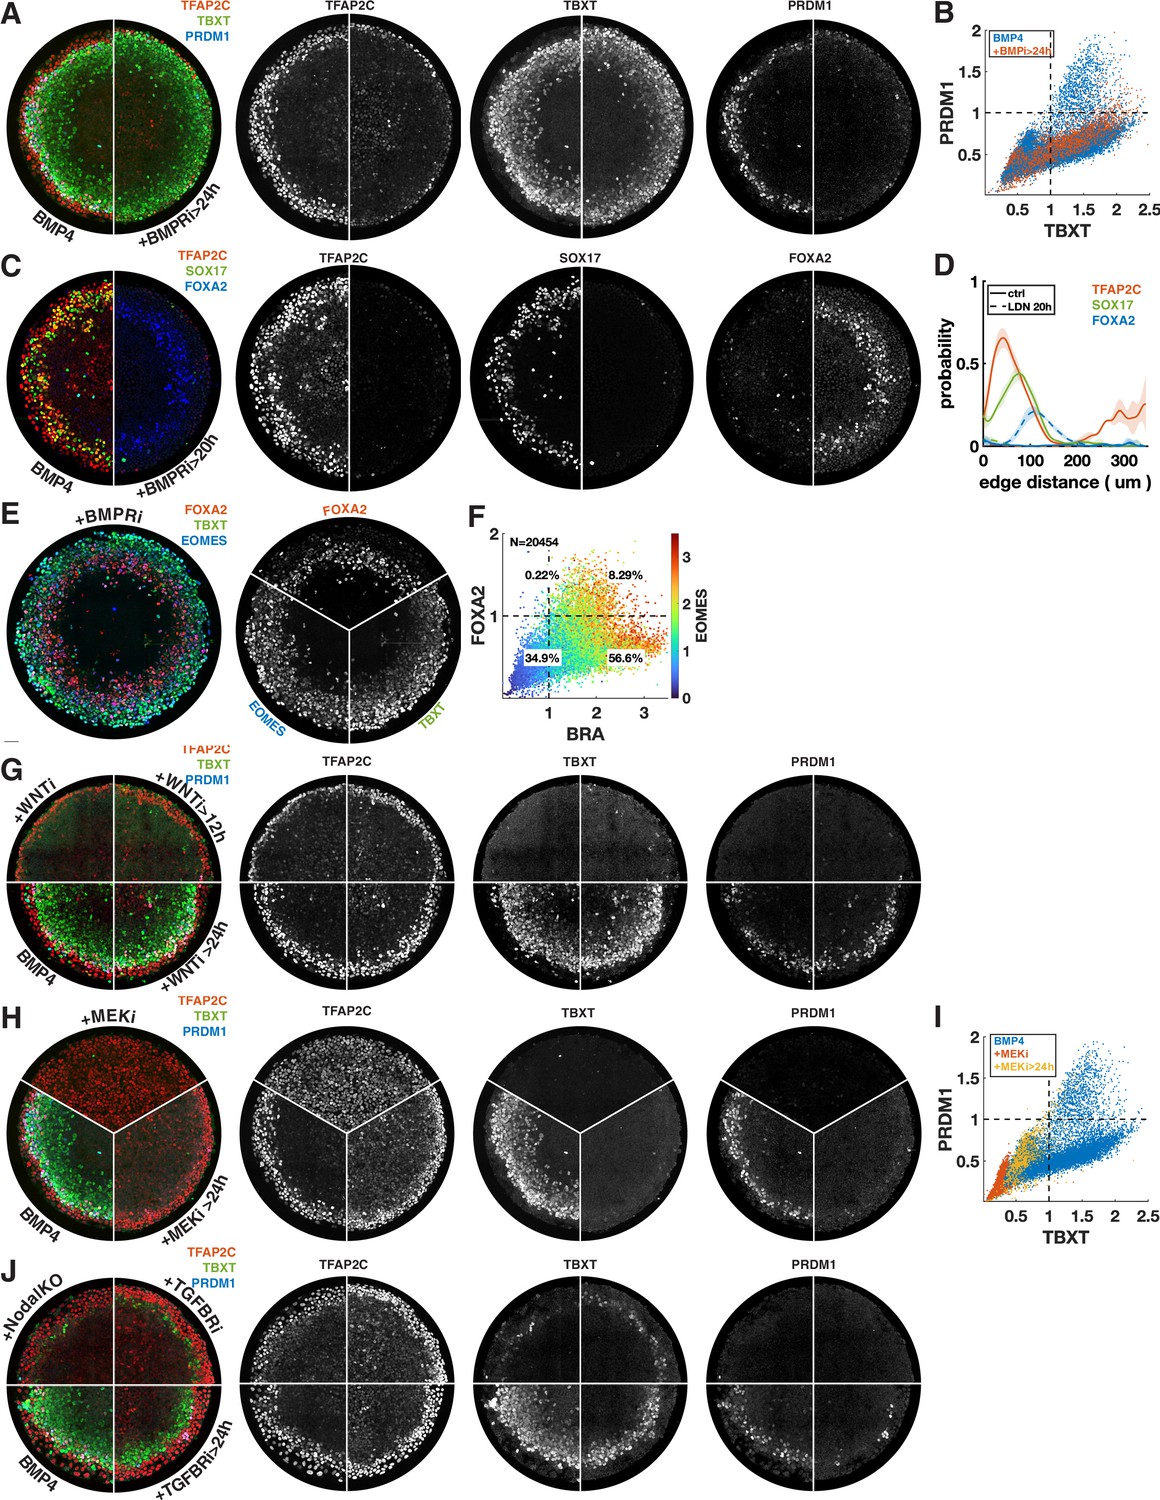
Primordial germ cell-like cells (PGCLCs) require sustained BMP, Nodal, and FGF but only brief Wnt signaling.
Each row shows staining and quantification of PGC markers after perturbation of different pathways. Error bands in spatial distributions are omitted for clarity but are similar in magnitude to Figure 1C and E. (A–E) BMP4-treated colonies with or without BMP-receptor inhibition after 24 hr (BMPRi, LDN193189, 250 nM) shows loss of PGCLCs (A–C) and emergence of FOXA2+ SOX17- population. (F) Diagram of signaling hierarchy (black) and perturbations in this figure (red). (G–J) Wnt inhibition using IWP2 5 µM after 0, 12, and 24 hr showing PGCLC specification only requires Wnt signaling between 12 and 24 hr. (K–O) Inhibition of FGFR (PD-173074, 1 µM) or MEK (PD-0325901, 5 µM) at 0 and 24 hr showing complete loss of PGCLCs in both cases. (P–T) Inhibition of Nodal receptors (TGFBRi, SB-431542, 10 µM) at 0 and 24 hr and Nodal knockout (NodalKO) showing complete loss or severe reduction of PGCLCs. Images of each channel separately are shown in Figure 2—figure supplement 2. Scale bar 50 µm.
Figure 3—figure supplement 1
Additional images and quantification for signaling perturbations in Figure 3.
(A) Overlay and separate channels for Figure 3A. (B) scatterplot of PRDM1 vs. TBXT for BMP4-treated colonies with or without BMP-receptor inhibition after 24 hr, colored for the condition. (C) Overlay and separate channels for Figure 3D. (D) Corresponding radial expression profile. (E, F) Staining and quantification for FOXA2, TBXT, EOMES of BMP4-treated colony treated with BMPRi after 24 hr, showing co-expression of FOXA2 and TBXT, which, together with lack of SOX17 in (C), suggests axial mesoderm. (G) Additional staining for TFAP2C, SOX17, FOXA2 of Wnt inhibition after 0 and 24 hr compared to BMP4 only. (H) Overlay and separate channels for Figure 3K. (I) Scatterplot of PRDM1 vs. TBXT for BMP4-treated colonies with or without MEK inhibition after 0 or 24 hr, colored for the condition. (J) Overlay and separate channels for Figure 3P.
Figure 4 with 2 supplements
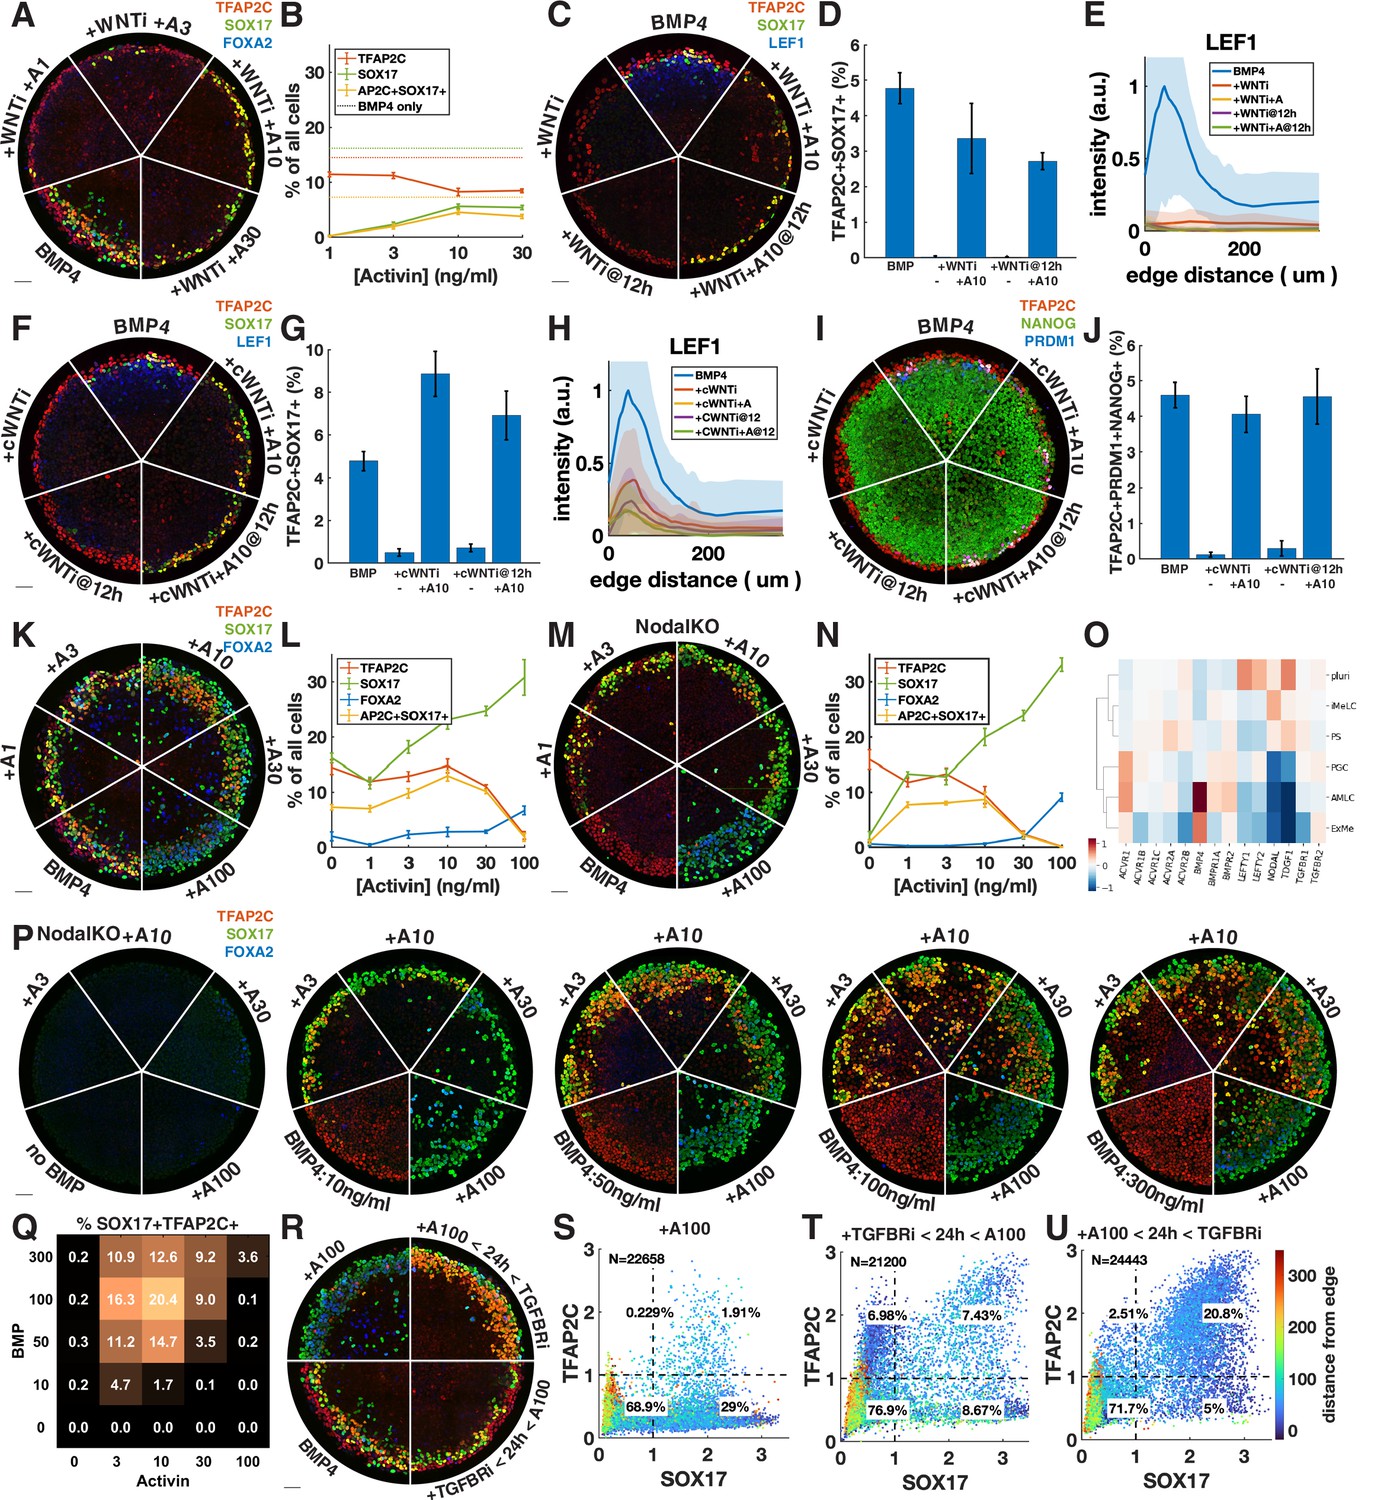
Exogenous Activin rescues primordial germ cells (PGCs) in the absence of endogenous Wnt or Nodal in a dose- and time-dependent manner.
(A, B) Wnt inhibition (WNTi, IWP2, 5 µM) with different doses of Activin, for example, A3 = 3 ng/ml Activin. (C–E) Activin rescue of WNTi at 0 hr vs. 12 hr with LEF1 staining. (F–H) Like (C–E) but with canonical WNT inhibitor (cWNTi, IWR-1, 50 µM). (I, J) Like (F–H) stained for additional PGC markers. (K–N) Effect of treatment with Activin in WT and NodalKO cells on expression of PGC and endoderm markers. (O) Differential expression from scRNA-seq for Nodal and BMP receptors, as well as Nodal, BMP, and Lefty. (P, Q) Effect of Activin treatment on PGC differentiation of NodalKO cells for different doses of BMP and quantification. (R–U) Effect of 100 ng/ml Activin for 42 hr, only during the first 24 hr, or only after 24 hr. Images of each channel separately are shown in Figure 3—figure supplement 1. Scale bar 50 µm.
Figure 4—figure supplement 1
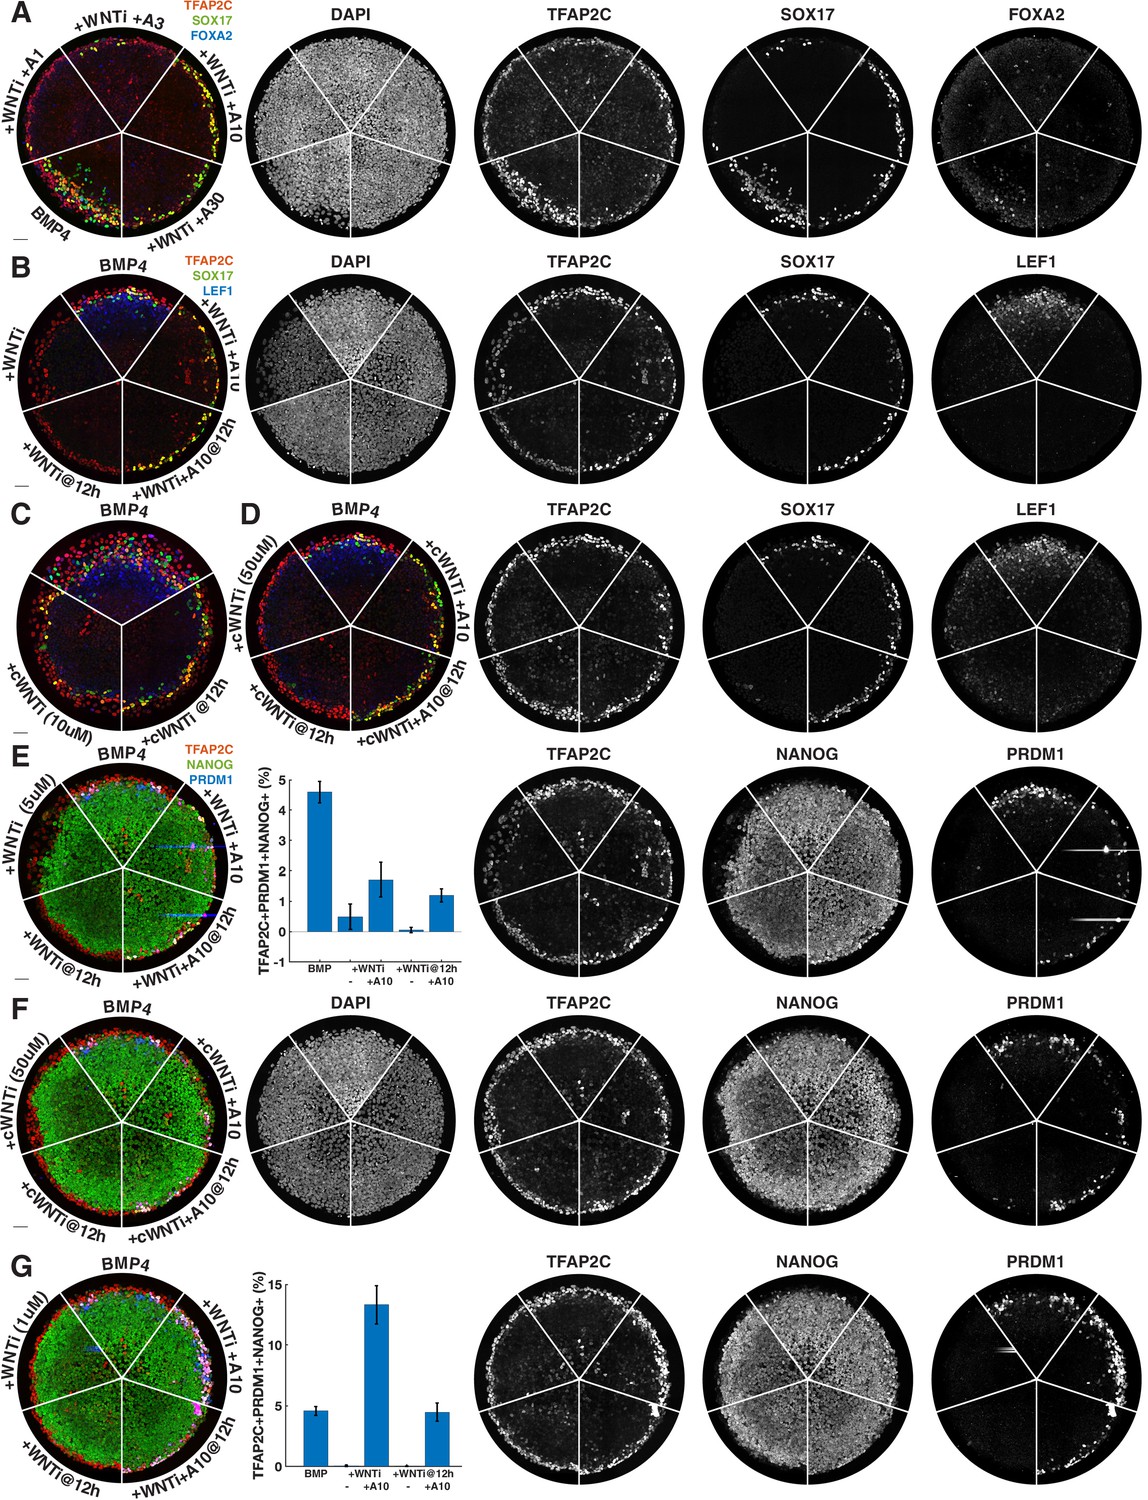
Additional images of primordial germ cell (PGC) rescue by Activin after WNT inhibition.
(A, B) Individual channels for Figure 4A and C. (C) IWR-1 does not block PGC specification at 10 µM. (D) Individual channels for Figure 4F (IWR-1 inhibition at 50 µM and rescue of PGCs by Activin). (E) Like Figure 4C but with TFAP2C, NANOG, PRDM1 staining (PGC rescue by Activin after 5 µM IWP2 treatment). (F) Individual channels for Figure 4I. (G) Increased rescue of PGCs by Activin after inhibition with 1 µM IWP2.
Figure 4—figure supplement 2
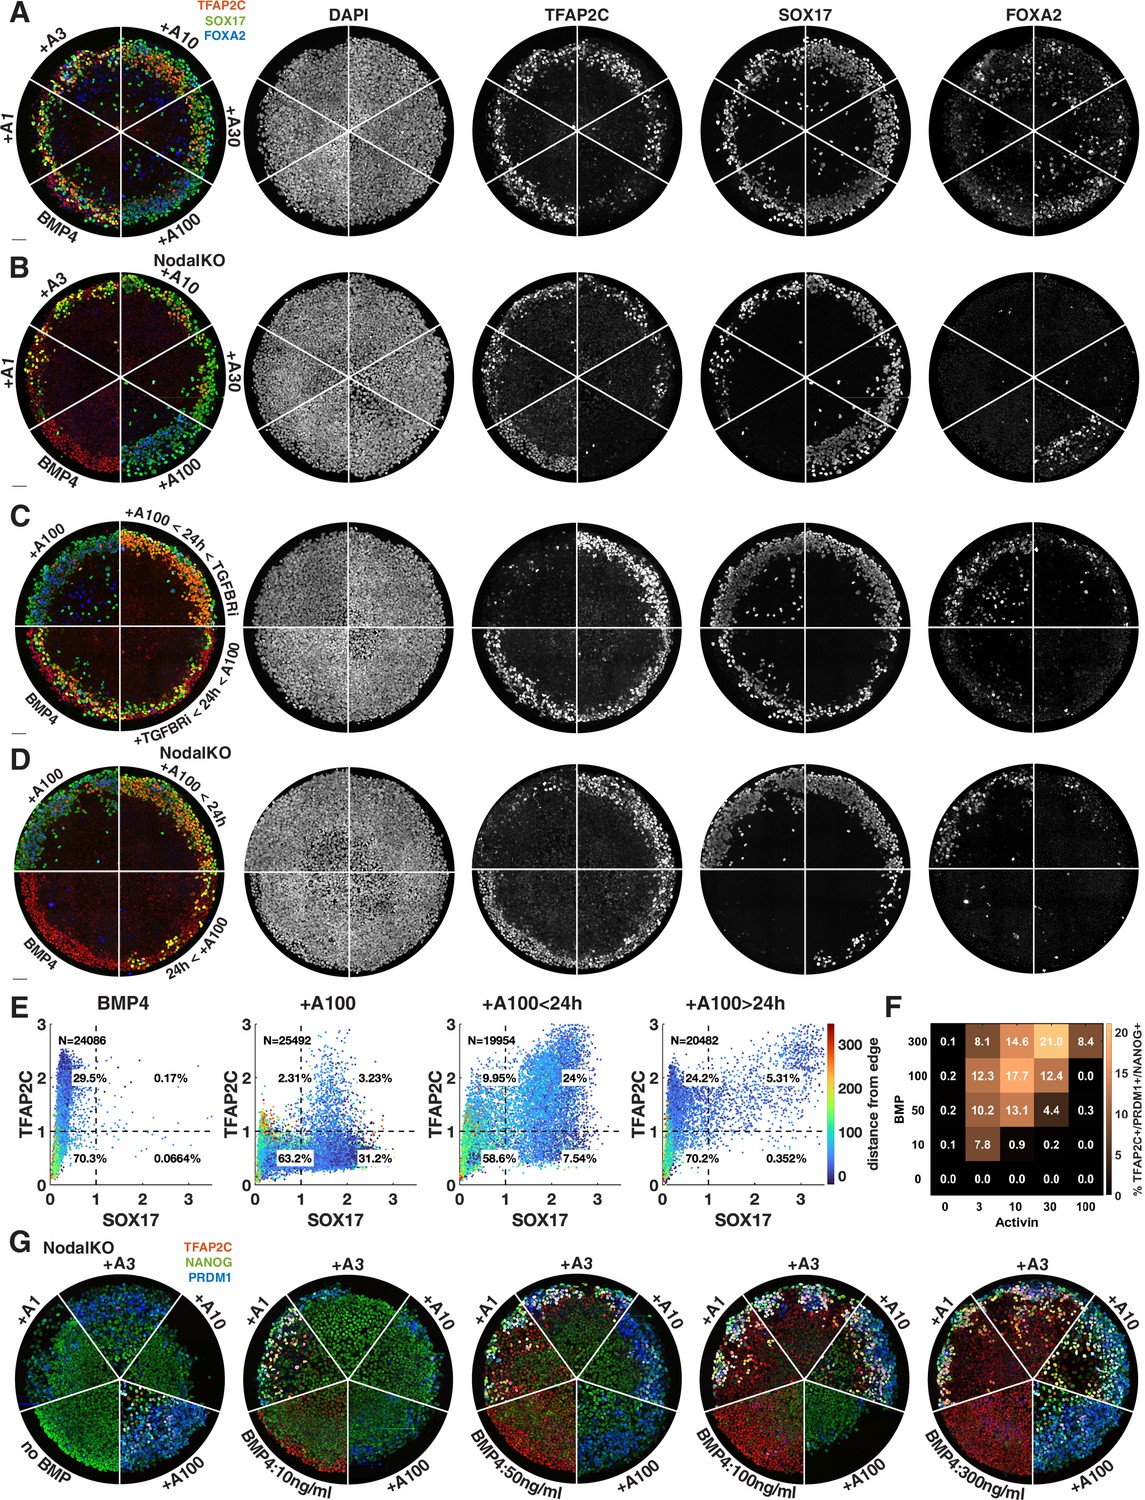
Additional images of the effect of Activin timing and dose on primordial germ cell (PGC) specification.
(A–C) Images of individual channels for Figure 4K, M, and R. (A) corresponds to Figure 4K, (B) to Figure 4M, (C) to Figure 4R. (D, E) Effect of exogenous Activin timing on cell fate in NodalKO cells. (F, G) TFAP2C, NANOG, PRDM1 staining of effect of Activin treatment on PGC differentiation of NodalKO cells for different doses of BMP and quantification.
Figure 5 with 1 supplement
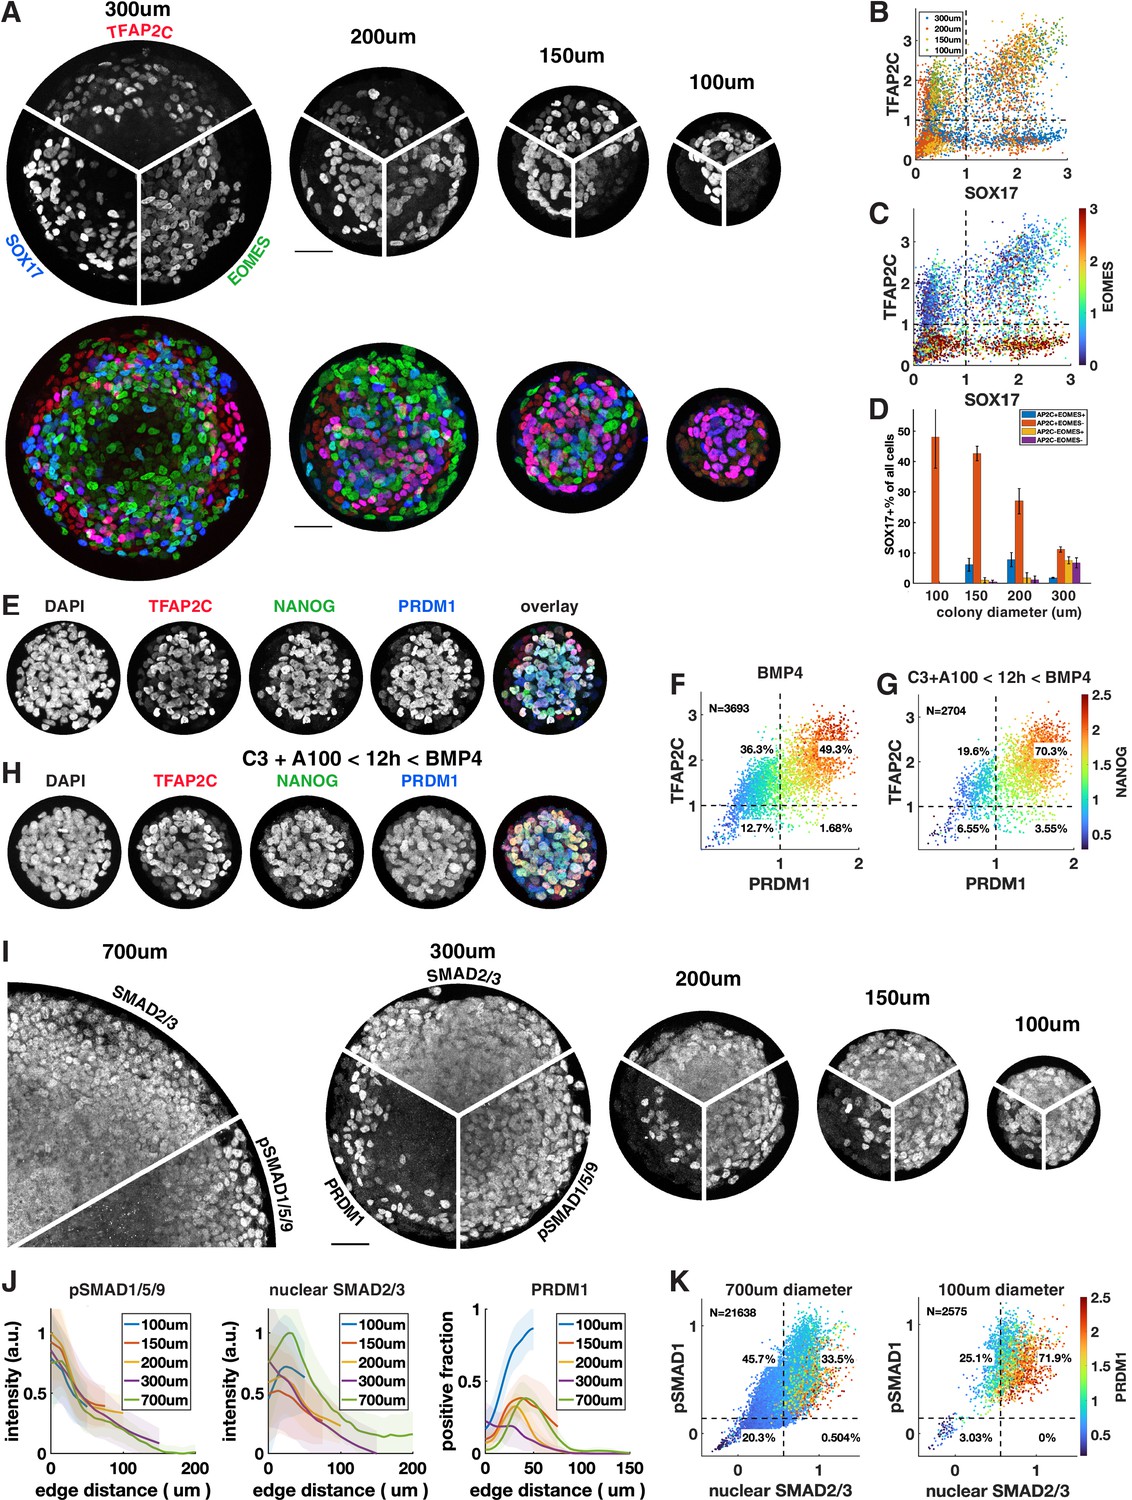
Control of colony size dramatically impacts the fraction of primordial germ cell-like cells (PGCLCs).
(A–D) Different diameter colonies stained for TFAP2C, SOX17, EOMES at 42 hr and quantification, (B) SOX17 vs. TFAP2C scatterplot colored for colony size. (C) Same plot colored for EOMES expression. (D) SOX17+ subpopulations for each colony diameter. (E–G) 100 µm colonies differentiated with BMP only or with incipient mesoderm-like state (iMeLC) pre-differentiation stained for TFAP2C, NANOG, PRDM1 at 48 hr and quantification. C3 = 3 µM CHIR-99021, other notation is like in Figure 4. (I–K) Stainings and quantification of pSMAD1 and SMAD2/3 for different size colonies. Scale bars 50 µm.
Figure 5—figure supplement 1

Additional images of primordial germ cell (PGC) specification on small micropatterns.
(A, B) Staining for PGC markers and quantification after treatment with Activin for 24 hr followed by inhibition of TGFb signaling by SB431542 (compare Figure 4R). (C) Scatterplots corresponding to (B) and Figure 5F and G colored for cell density show clusters. (D) Differentiation of PGP1 (a male induced pluripotent stem cell [hiPSC] line) on small micropatterns.
Figure 6 with 1 supplement
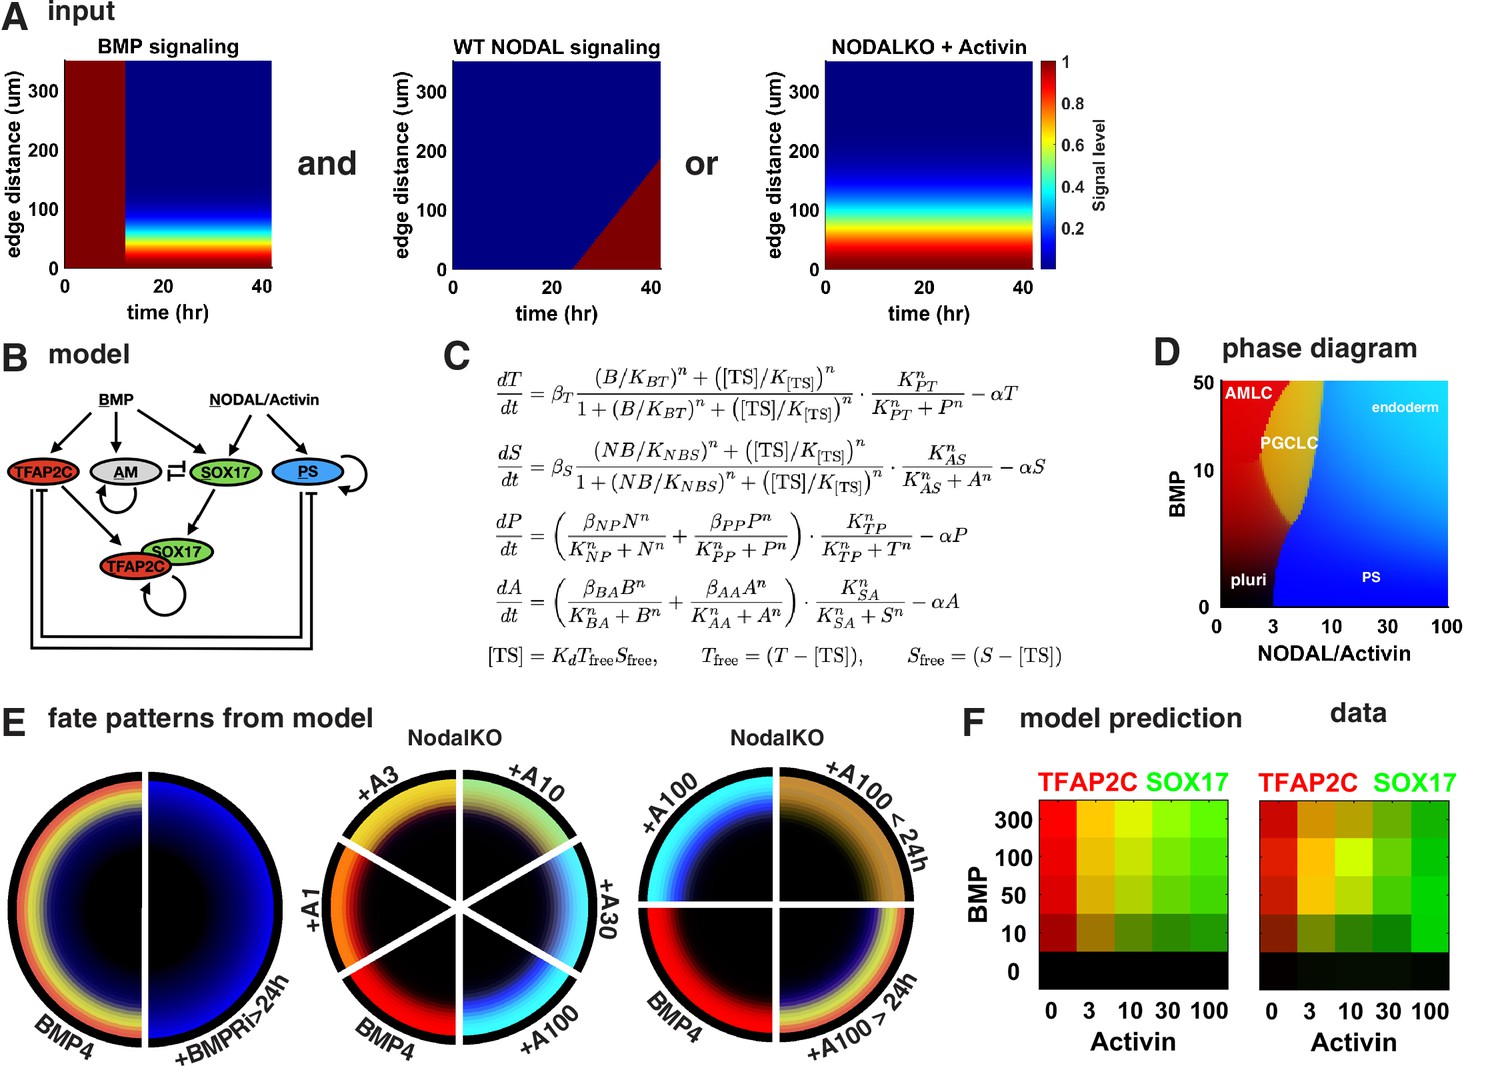
A network of cross-repressive cell fates qualitatively explains Nodal perturbations.
(A) Input signaling profile in space and time. (B) Diagram of the model. (C) Definition of the model. (D) Phase diagram showing predicted expression of cell fate markers at steady state for different levels constant of BMP and Nodal activation (i.e., behavior of the cells on the very edge at late times). (E) Cell fate patterns predicted by the model from the input signaling profiles with different perturbations. Compare with data in Figures 3A and 4M, and Figure 4—figure supplement 2D. Colors match (B, D). (F) Predicted and measured expression of TFAP2C and SOX17 in a 100-µm-wide ring from the edge for different doses of BMP and Activin. .
Figure 6—figure supplement 1
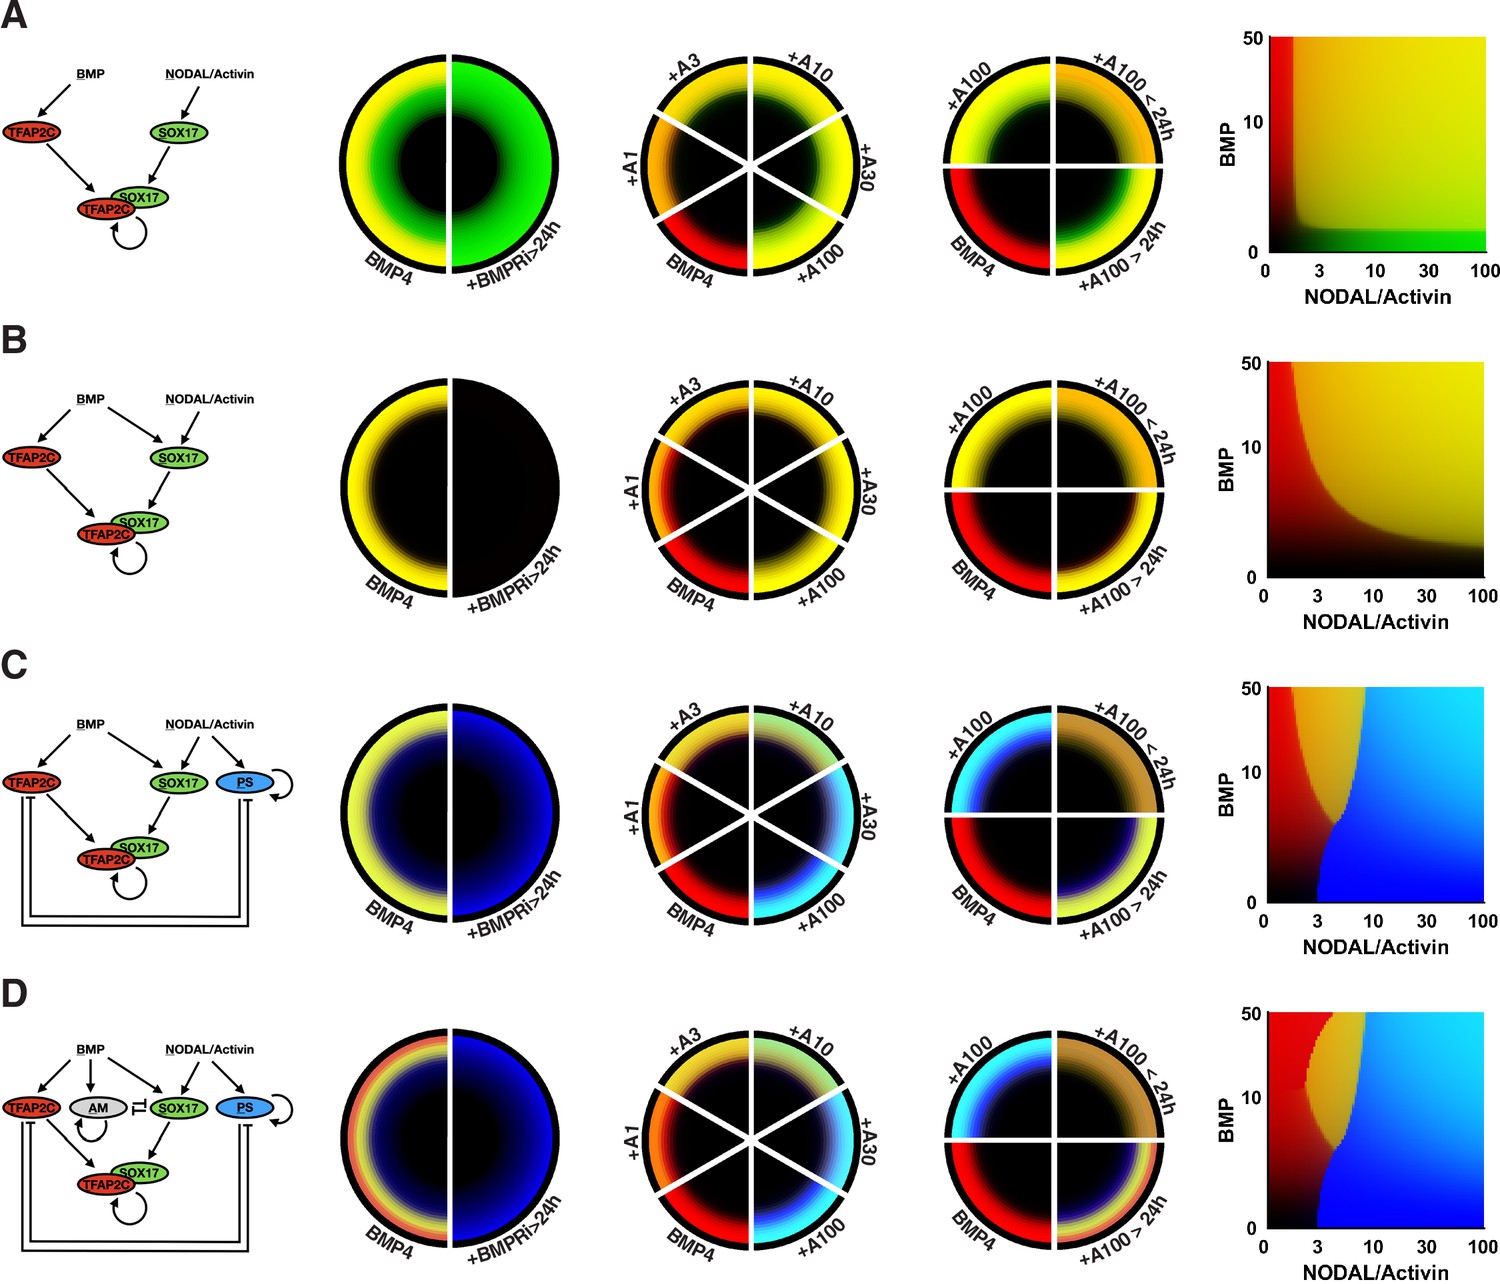
Simpler mathematical models.
Each row shows a model and its predicted patterns for the perturbations we wanted to explain. (A) Stable primordial germ cell-like cells (PGCLCs) through autoregulation of SOX17 in combination with TFAP2C and SOX17 activated by Nodal. (B) Activation of SOX17 by BMP and Nodal. (C) Inclusion of a stable primitive streak (PS)-like state activated by Nodal, which cross-represses with TFAP2C. (D) Full model including a stable amnion-like state that cross-represses with SOX17.
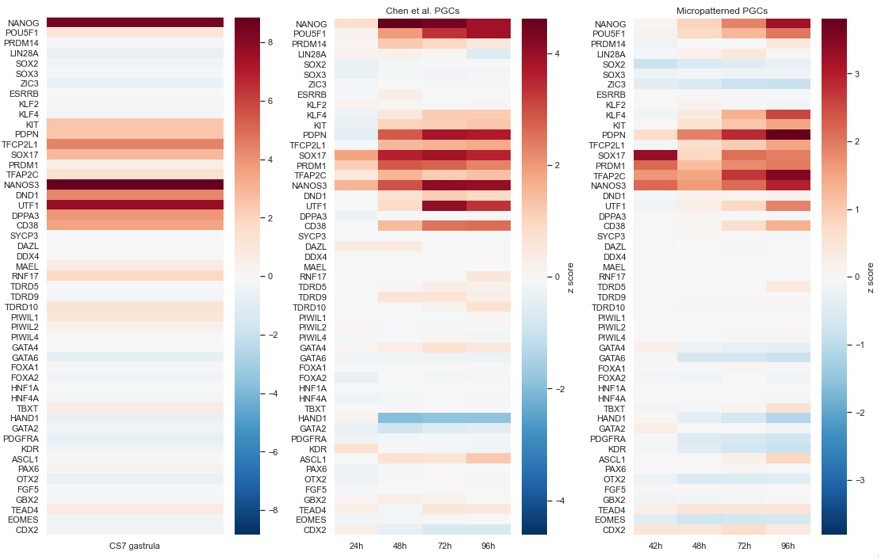
Author response image 1
Author response image 2
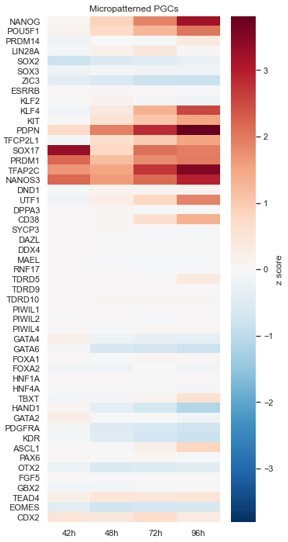
Micropatterned PGCLCs.
Author response image 3
Author response image 4

Author response image 5
Author response image 6
Tables
Table 1
Cell signaling reagents.
| Reagent | Nickname | Vendor, catalog # | Dose | Function |
|---|---|---|---|---|
| rhBMP4 | BMP4 | R&D Systems, #314BP/CF | See figures | Activate BMP pathway |
| rhActivin | A | R&D Systems, #AFL338 | See figures | Activate TGFb pathway |
| CHIR-99021 | C | Tocris, #4423 | See figures | Canonical Wnt agonist |
| IWP 2 | WNTi | Tocris, #3533 | 5 µM unless stated otherwise | Block Wnt secretion |
| IWR-1 | cWNTi | Thermo Fisher, 50-101-4191 | 50 µM unless stated otherwise | Block canonical Wnt signaling |
| LDN-193189 | BMPRi | MedChemExpress, # HY-12071 | 250 nM | Block BMP signaling |
| SB-431542 | TGFBRi | Apexbio, #A8249 | 10 µM | Block TGFb signaling |
| PD-0325901 | MEKi | ESIBIO, #ST10009 | 5 µM | Block MEK signaling |
| PD-173074 | FGFRi | MedChemExpress, #HY-10321 | 1 µM | Block FGF signaling |
Table 2
Primary antibodies used for immunostaining.
| Protein | Species | Dilution | Catalog # | Vendor |
|---|---|---|---|---|
| ISL1 | Mouse | 1:200 | 39.4D5 | DSHB |
| SOX2 | Rabbit | 1:200 | 3579S | Cell Signaling Technology |
| TBXT (BRA) | Goat | 1:300 | AF2085 | R&D Systems |
| PRDM1 (BLIMP1) | Rat | 1:50 | SC-47732 | Santa Cruz Biotechnology |
| SOX17 | Goat | 1:200 | AF1924 | R&D Systems |
| TFAP2C | Mouse | 1:150 | SC-12762 | Santa Cruz Biotechnology |
| NANOG | Goat | 1:100 | AF1997 | R&D Systems |
| EOMES (TBR2) | Rabbit | 1:500 | AB23345 | Abcam |
| POU5F1 | Mouse | 1:400 | 611,202 | BD Biosciences |
| LEF1 | Rabbit | 1:200 | C12A5 | Cell Signaling Technology |
Table 3
Secondary antibodies.
| Protein | Species | Dilution | Catalog # | Vendor |
|---|---|---|---|---|
| Alexa Fluor 647 anti-goat | Donkey IgG | 1:500 | A21447 | Thermo Fisher Scientific |
| Alexa Fluor 555 anti-goat | Donkey IgG | 1:500 | A21432 | Thermo Fisher Scientific |
| Alexa Fluor 488 anti-mouse | Donkey IgG | 1:500 | A21202 | Thermo Fisher Scientific |
| Alexa Fluor 647 anti-rat | Whole IgG | 1:500 | 112-605-167 | Jackson ImmunoResearch |
| Alexa Fluor 647 anti-rabbit | Donkey IgG | 1:500 | A31573 | Thermo Fisher Scientific |
| Alexa Fluor 555 anti-rabbit | Donkey IgG | 1:500 | A31572 | Thermo Fisher Scientific |
Table 4
qPCR primers.
| GAPDH | ACAACTTTGGTATCGTGGAAGG | GCCATCACGCCACAGTTTC |
| SOX17 | GTGGACCGCACGGAATTTG | GGAGATTCACACCGGAGTCA |
| NANOS3 | CTTTGACCTGTGGACAGATTACC | GCCTGGTTTCAGGACCCTC |
| DPPA3 | TTAATCCAACCTACATCCCAGGG | AGGGGAAACAGATTCGCTACTA |
| DDX4 | TTGTTGCTGTTGGACAAGTGGGTG | GCAACAAGAACTGGGCACTTTCCA |
| EOMES | CGCCACCAAACTGAGATGAT | CACATTGTAGTGGGCAGTGG |
| PRDM1 | CTACCCTTATCCCGGAGAGC | GGACATTCTTTGGGCAGAGT |
Appendix 1—table 1
Model parameters.
| Parameter | Value | Meaning |
|---|---|---|
| n | 2 | Hill function coefficient |
| 0.1733 | Protein dilution + degradation rate | |
| 0.173 | Production rate for and | |
| 1 | Autoactivation steady state for and | |
| (0.313, 0.338, 0.371, 1.2) | Signaling thresholds | |
| Inhibition thresholds | ||
| (0.269, 0.135) | Maximum signaling-driven protein level | |
| Autoactivation thresholds | ||
| 0.5 | activation threshold for on and | |
| 100 | dimerization constant for |
Additional files
-
Supplementary file 1
List of gastrulation genes used for visualization and clustering.
- https://cdn.elifesciences.org/articles/72811/elife-72811-supp1-v2.xlsx
-
Supplementary file 2
Most differentially expressed genes in clusters found in scRNA-seq data.
- https://cdn.elifesciences.org/articles/72811/elife-72811-supp2-v2.xlsx
-
Supplementary file 3
Most differentially expressed genes from Supplementary file 1 in clusters found in scRNA-seq data.
- https://cdn.elifesciences.org/articles/72811/elife-72811-supp3-v2.xlsx
-
Transparent reporting form
- https://cdn.elifesciences.org/articles/72811/elife-72811-transrepform1-v2.docx
Download links
A two-part list of links to download the article, or parts of the article, in various formats.
Downloads (link to download the article as PDF)
Open citations (links to open the citations from this article in various online reference manager services)
Cite this article (links to download the citations from this article in formats compatible with various reference manager tools)
Efficient differentiation of human primordial germ cells through geometric control reveals a key role for Nodal signaling
eLife 11:e72811.
https://doi.org/10.7554/eLife.72811


