HIF1α stabilization in hypoxia is not oxidant-initiated
- Burke Neurological Institute, White Plains, United States
- Brain and Mind Research Institute, Weill Medical College of Cornell University, United States
- Department of Neurology, Weill Medical College of Cornell University, United States
- Pandemic Response Lab, United States
- Department of Anatomy and Cell Biology, New York Medical College, United States
- Institute for Biotechnology, Cornell University, United States
- Department of Biochemistry and Molecular Biology, New York Medical College, United States
- Department of Medicine, University of Washington, United States
- Department of Pain and Anesthesiology, University of Washington, United States
Figures
Figure 1
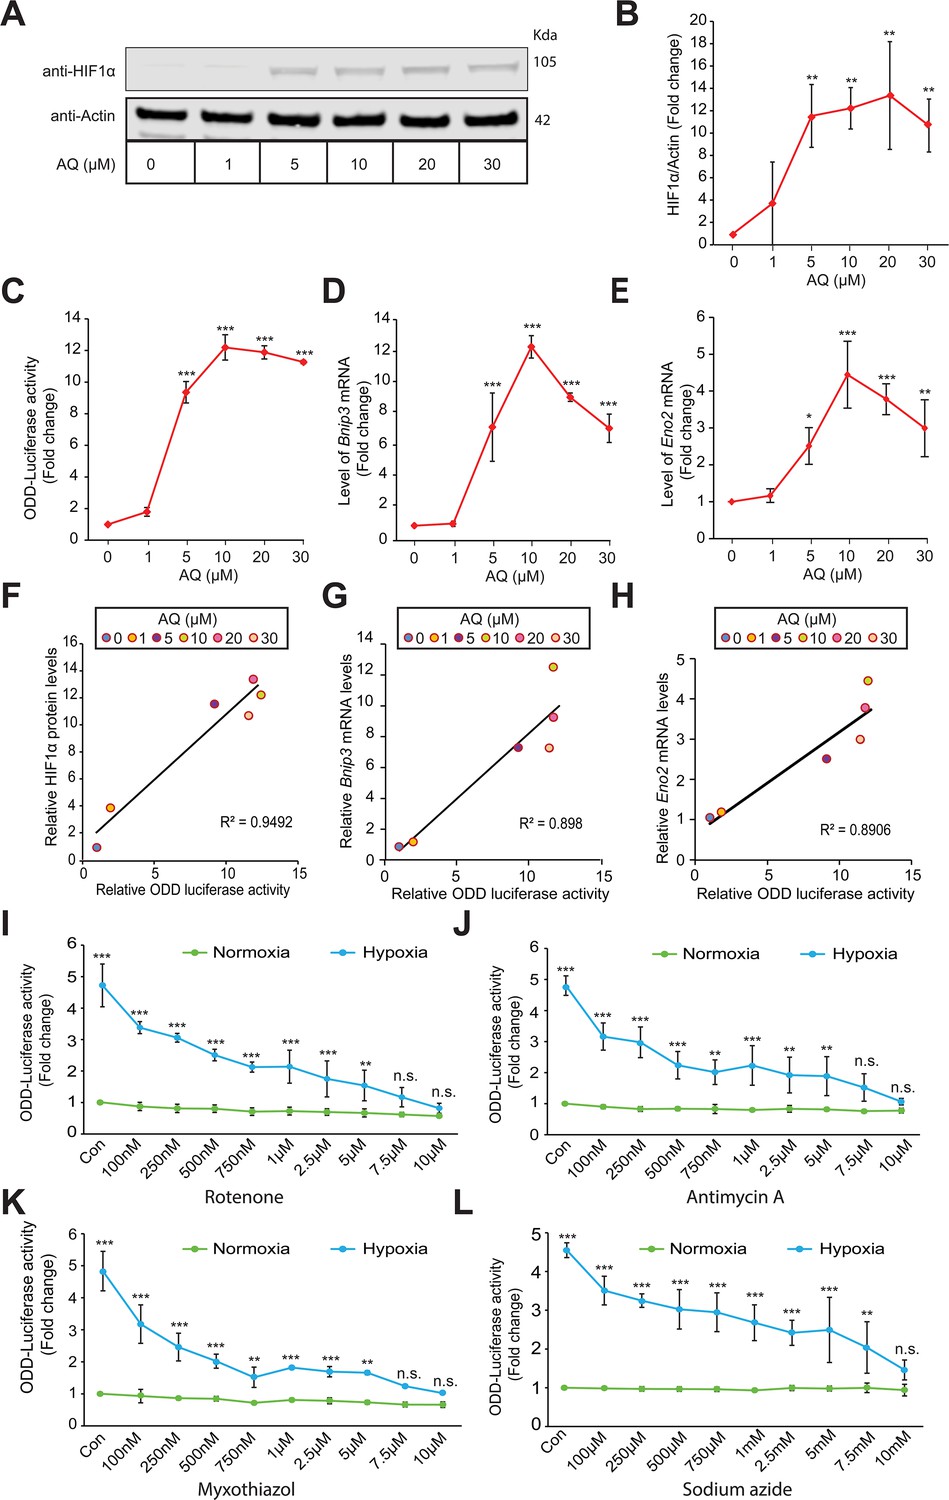
Mitochondrial electron transport chain is involved in hypoxic HIF1α stabilization in human neuroblastoma cells.
Experiments A - H establish specificity and sensitivity of HIF-reporter activity (i.e. ODD-Luciferase activity) while experiments I-L establish involvement of mitochondrial ETC in the hypoxic HIF1α stabilization. SH-SY5Y ODD-Luc. cells that stably overexpressed ODD (HIF Oxygen Dependent Domain-luciferase fusion) were treated with increasing concentrations of adaptaquin (AQ, 1 µM – 30 µM) for 4 hr and were, thereafter, processed for assessment of either changes in HIF protein level via immunoblotting (A, B) or changes in HIF reporter luciferase activity (i.e. ODD-luciferase activity) (C) or changes in expression of HIF1α target genes, Eno2 and Bnip3 (D, E). (F) Correlation between relative changes in HIF reporter luciferase activity (i.e. ODD-luciferase activity) and relative changes in HIF1α protein. (G, H) Correlation between relative changes in HIF reporter luciferase activity (i.e. ODD-luciferase activity) and relative changes in HIF1α target genes, Eno2 and Bnip3. (I–L) SH-SY5Y ODD-Luc. cells were treated with increasing concentrations of rotenone (Complex I inhibitor), antimycin A (Complex III inhibitor), myxothiazol (Complex III inhibitor), and sodium azide (Complex IV inhibitor) and then were exposed to either normoxia or hypoxia for 4 hr. Thereafter, HIF reporter luciferase activity was measured in cell lysates. All experiments were performed in three independent sets. The statistical analyses were performed using One way ANOVA with Dunnett post-test (B–E) and Student’s t test (J–L). (B–E) (n.s.), (*), (**), and (***) indicate non-significant difference and the statistical differences of p < 0.05, p < 0.01, and p < 0.001 with respect to normoxia control. Two-way ANOVA with Bonferroni’s post-test was used for all statistical analyses (I–L). (n.s.), (**), and (***) indicate non-significant difference or statistical differences of p < 0.01 and p < 0.001 with respect to respective control or treatment concentration under normoxia.
-
Figure 1—source data 1
Original western blot files for Figure 1A.
- https://cdn.elifesciences.org/articles/72873/elife-72873-fig1-data1-v2.zip
Figure 2 with 2 supplements
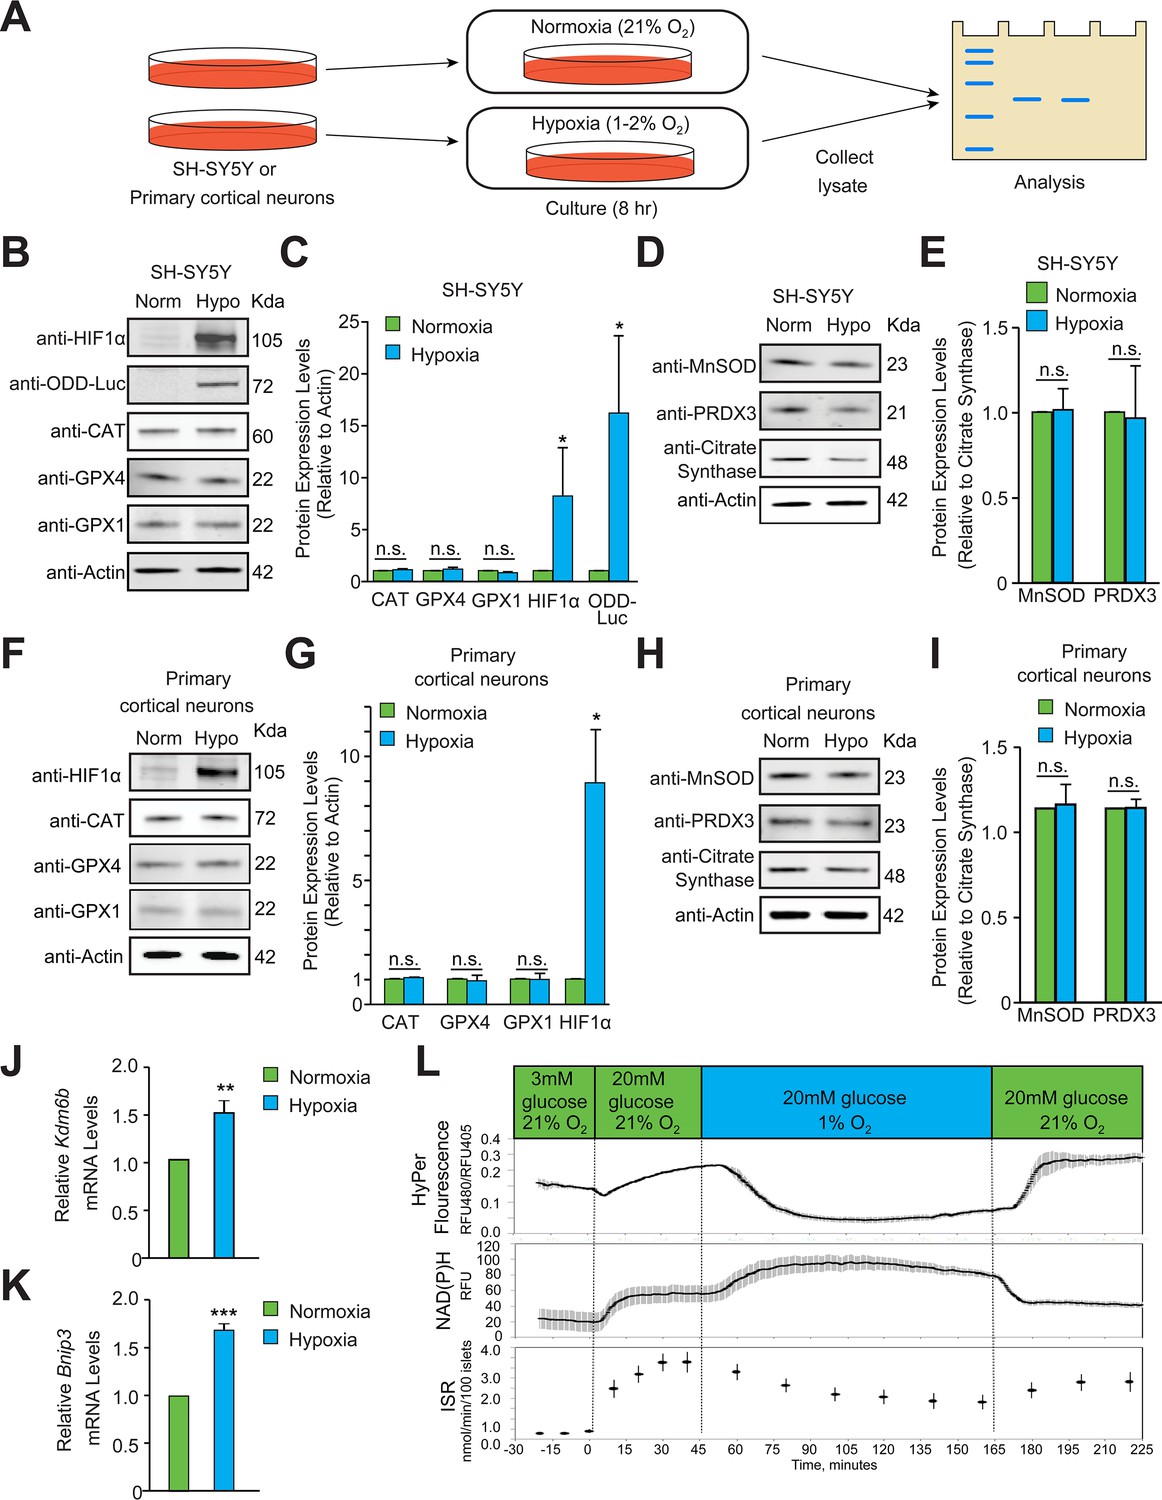
Hypoxia does not induce homeostatic increases in antioxidant enzymes or increase peroxide levels.
(A) Experimental approach employed to examine changes in the protein levels of endogenous antioxidant enzymes in hypoxia. Immunoblots or densitometric analyses of catalase (peroxisome), GPX1 and GPX4 (cytosol and mitochondria) or MnSOD and PRDX3 (mitochondria) in SH-SY5Y ODD Luc. cells that stably overexpressed ODD (HIF Oxygen Dependent Domain-luciferase fusion) (B–E) or PCNs (F-I) exposed to normoxia or hypoxia for 8 hr. The protein levels of catalase, GPX4, and GPX1 were normalized to actin while those of MnSOD and PRDX3 were normalized to the mitochondrial protein, citrate synthase. A monoclonal antibody to luciferase (indicated as anti-ODD-Luc. in the figure) was used to detect changes in ODD-luciferase protein levels in SH-SY5Y ODD-Luc. cells. (J–K) Pancreatic islets were exposed to hypoxia for 2 hr and then were lysed and processed for mRNA expression analysis of HIF1α target genes, Kdm6b and Bnip3. The densitometric data and gene expression data were pooled from three independent experiments in the form of mean ± SD. The statistical analyses of densitometric data and gene expression data were done using Student’s t test (B–K). (n.s.) indicates non-significant difference, (**) indicates p < 0.01 and (***) indicates p < 0.001 with respect to respective normoxia controls. (L) Hypoxia leads to large decrease in H2O2 levels (top), increased NAD(P)H (middle), and decreased insulin secretion (bottom). Glucose stimulation by 20 mM glucose was added as reference, and oxygen levels were changed using an artificial gas equilibration device placed inline in the flow system. All three experiments were carried out separately but using the same flow culture system.
-
Figure 2—source data 1
Original western blot files for Figure 2B, D.
- https://cdn.elifesciences.org/articles/72873/elife-72873-fig2-data1-v2.zip
-
Figure 2—source data 2
Original western blot files for Figure 2F, H.
- https://cdn.elifesciences.org/articles/72873/elife-72873-fig2-data2-v2.zip
Figure 2—figure supplement 1
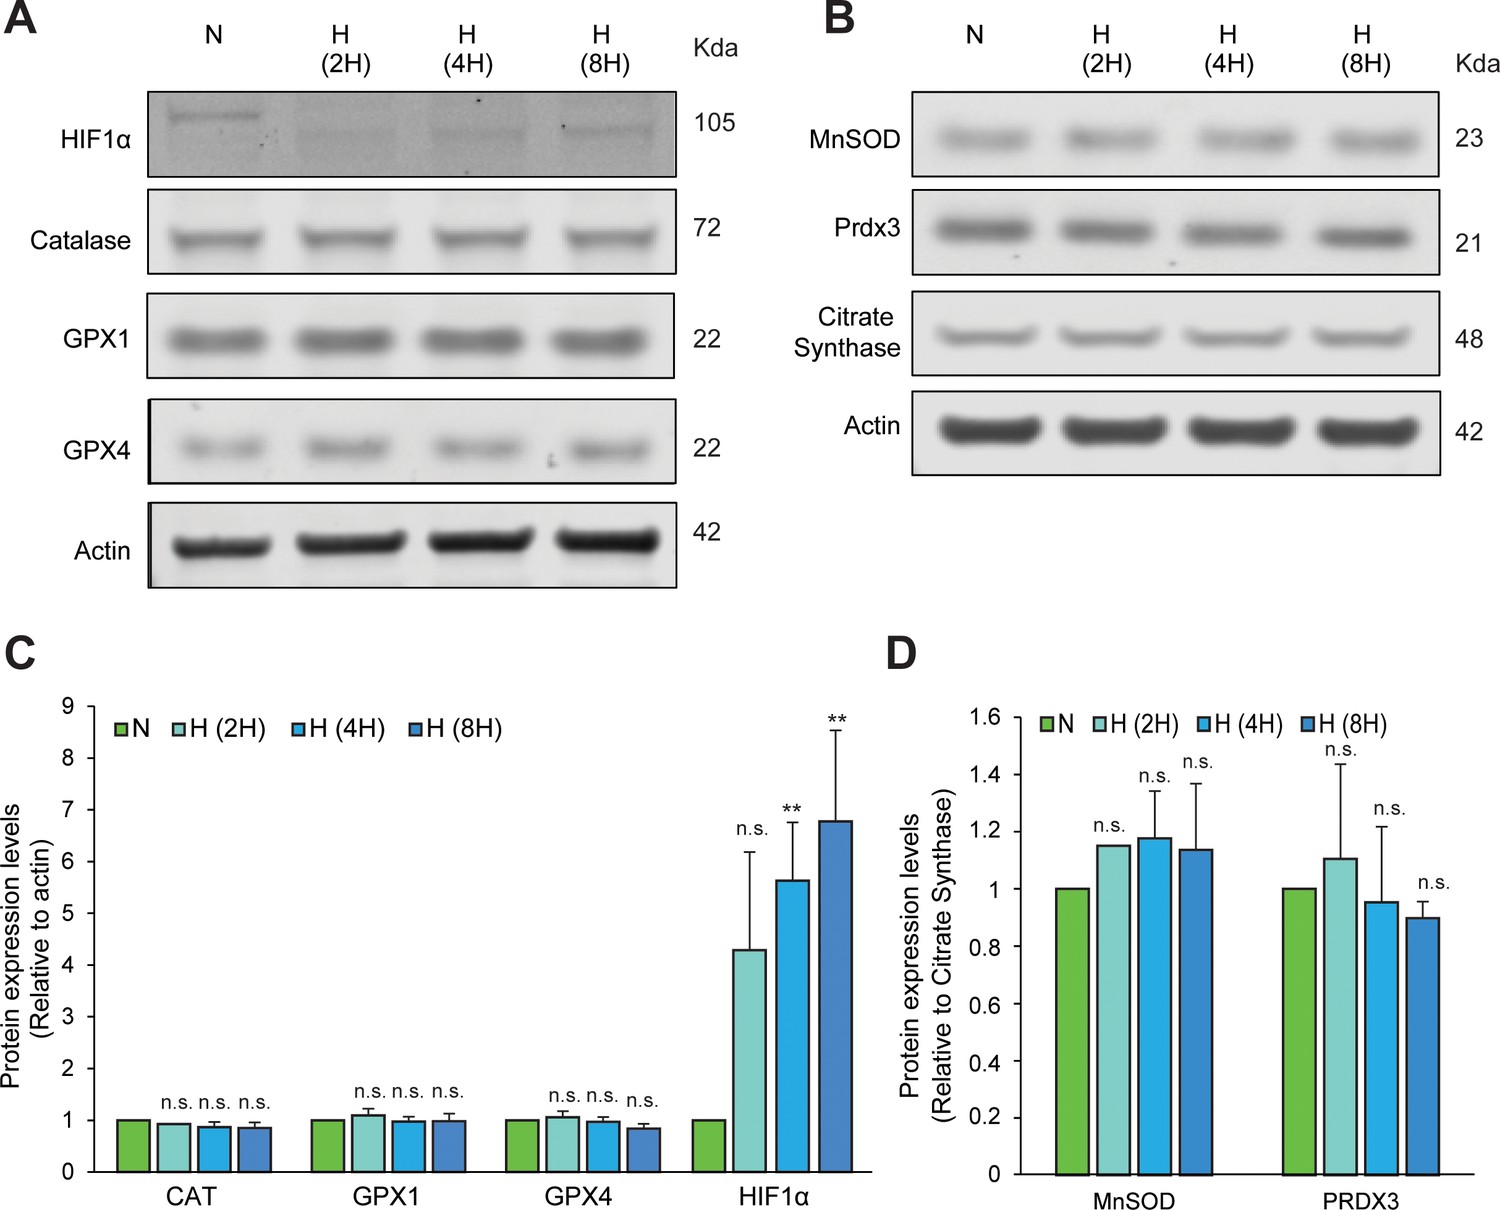
Hypoxic exposure for different time periods does not induce homeostatic increases in antioxidant enzymes.
Immunoblots of endoenous catalase, GPX1 and GPX4 (A) or MnSOD and PRDX3 (B) in SH-SY5Y ODD Luc. cells exposed to either 8 hr normoxia or different periods of hypoxia (2, 4, and 8 hr). HIF1α immunoblot was used to confirm the hypoxic state of these cells (C, D) Densitometric analysis of immunoblots. The protein levels of CAT, GPX1, GPX4, and HIF1α were normalized to actin levels as a loading control while those of MnSOD and PRDX3 were normalized to the mitochondrial protein, citrate synthase. All western blot experiments were performed as three independent sets and a representative blot of each was shown in the figure. One-way ANOVA with Dunnett’s post-test was used for all comparisons. (n.s.) and (**) indicate non-significant difference, and the statistical difference of p < 0.001, respectively, with respect to normoxia control.
-
Figure 2—figure supplement 1—source data 1
Original western blot files for Figure 2—figure supplement 1.
- https://cdn.elifesciences.org/articles/72873/elife-72873-fig2-figsupp1-data1-v2.zip
Figure 2—figure supplement 2
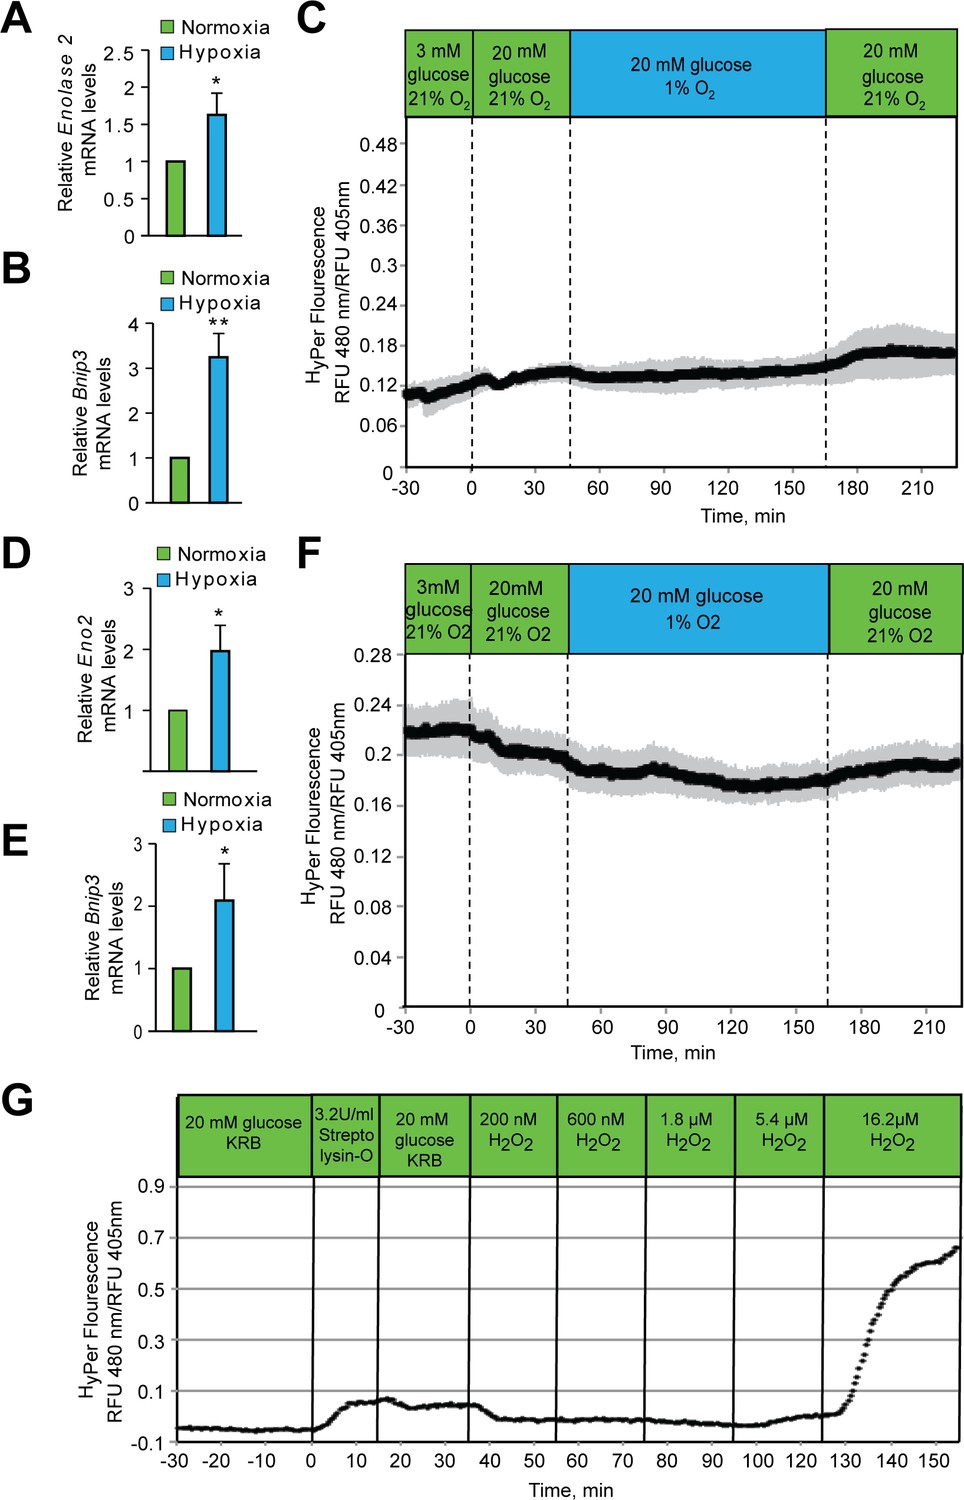
Hypoxia does not increase peroxide levels in SH-SY5Y cells or Hep3B cells.
SH-SY5Y cells (A, B) or Hep3B cells (D, E) were exposed to hypoxia for 2 hr and then were lysed and processed for mRNA expression analysis of HIF1α target genes, Eno2 and Bnip3. The gene expression data was pooled from three independent experiments in the form of mean ± SD. The statistical analyses of gene expression data were done using Student’s t test (J–K). (**) indicates p < 0.01 and (***) indicates p < 0.001 with respect to respective normoxia controls. (C, F) Hypoxia does not change in HyPer fluorescence in either SH-SY5Y cells (C) or Hep3B cells (F). Glucose stimulation by 20 mM glucose was added as reference, and oxygen levels were changed by use of an artificial gas equilibration device placed inline in the flow system. (G) Hep3B cells, under normoxic conditions, were treated with bacterial Streptolysin-O to selectively permeabilize the plasma membrane followed by their exposure to increasing concentrations of H2O2. Real time measurement of H2O2 confirmed the specificity of Hyper signals with respect to H2O2. All three experiments (C, F, and G) were carried out separately, but using the same flow culture system. Each Experiment was performed as three independent sets and a representative picture of each is shown.
Figure 3 with 6 supplements
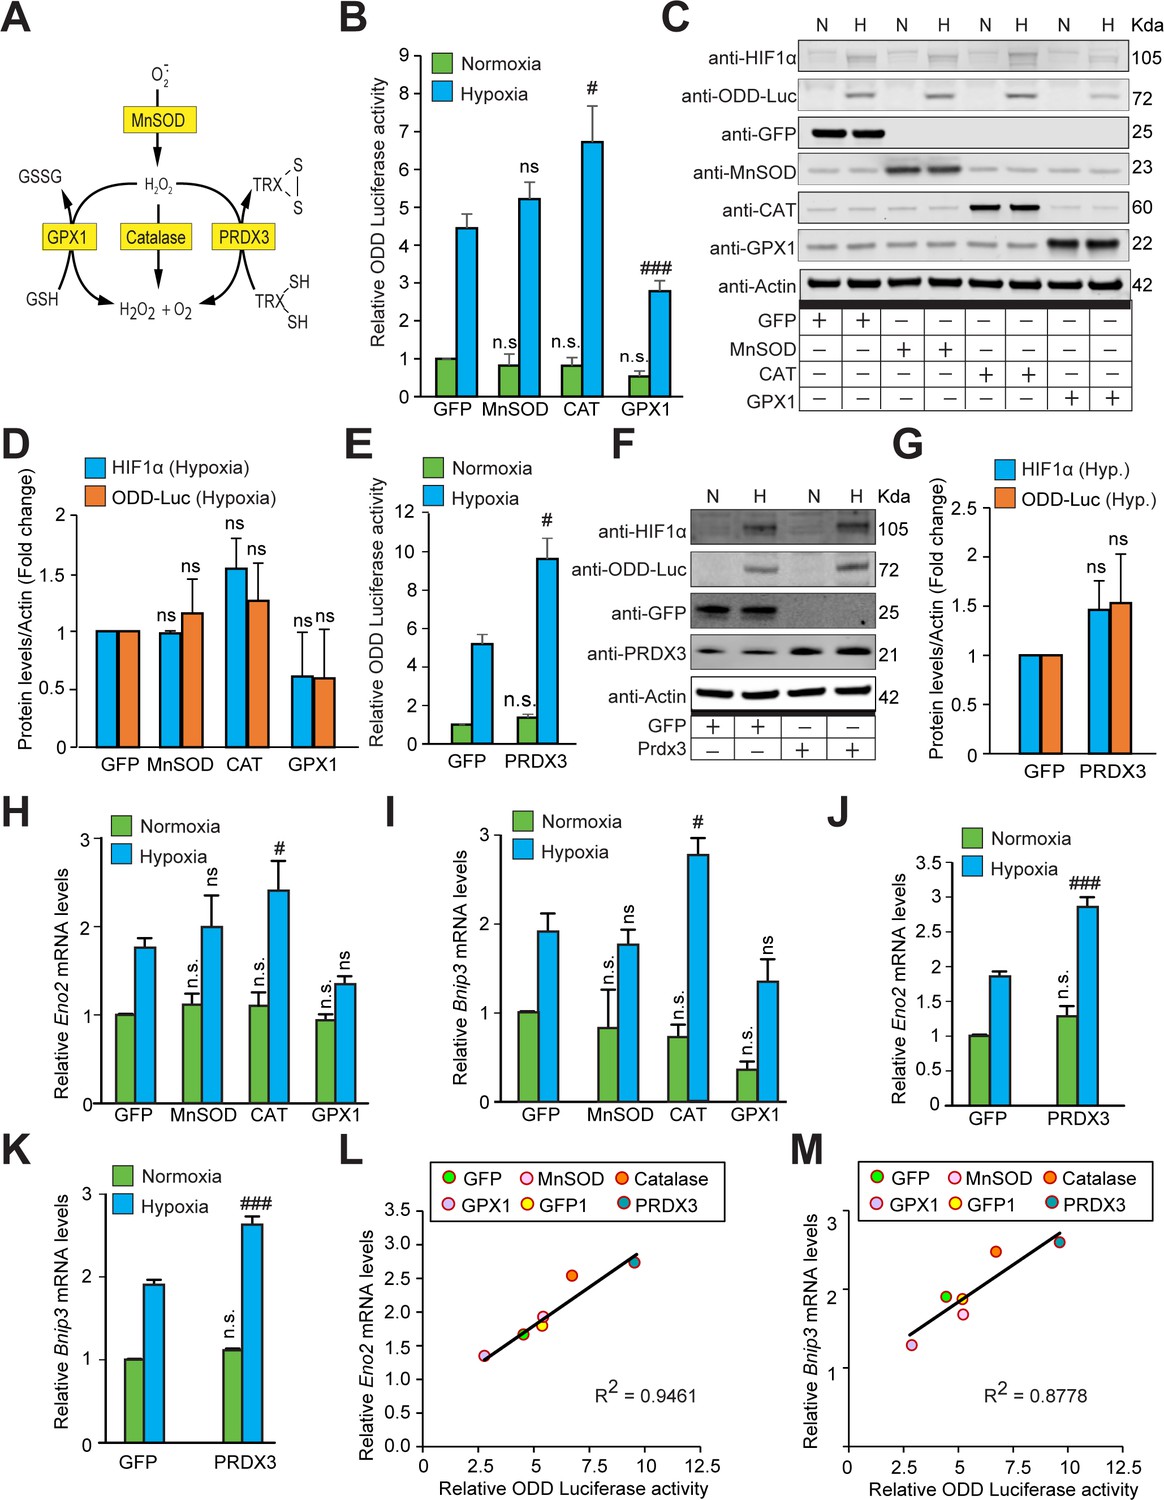
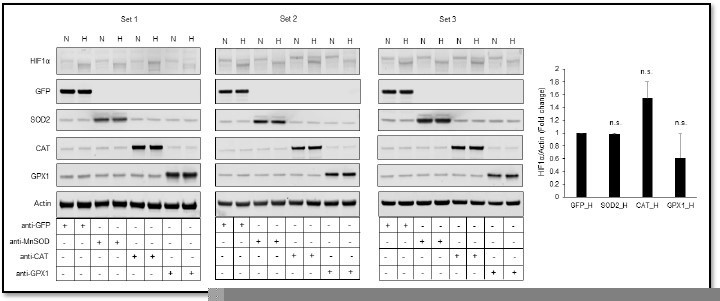
The stabilization of HIF1α and its transcriptional activity are not oxidant-initiated in hypoxia.
(A) A schematic diagram showing known mechanisms of H2O2 detoxification by peroxisomal, cytosolic and mitochondrial antioxidants. (B–K) SH-SY5Y cells stably expressing ODD-luciferase were transduced with adenoviruses encoding distinct antioxidant enzymes for 72 hr and then exposed to normoxia or hypoxia in parallel and were either processed for luciferase activity assay (A measure of quantitative changes in ODD) (B and E) or immunoblot analysis (A measure of quantitative changes in protein levels of ODD and HIF1α) (C, D, F, and G) or gene expression analyses of HIF1α target genes, Eno2 and Bnip3 (H–K). (L, M) Correlation between relative changes in either Eno2 or Bnip3 and relative ODD-luciferase activities. Two-way ANOVA with Bonferroni post-test was used for comparisons in B, E, H, I, J, and K. One-way ANOVA with Dunnett post-test was used in the statistical analysis in D while Student t test in was used in G. (n.s.) indicates non-significant difference with respect to GFP control under normoxia while (ns), (#) and (###) indicate non-significant difference and the statistical differences of p < 0.05, and p < 0.001, respectively, with respect to GFP control in hypoxia. All experiments were performed as three independent sets and a representative blot or an average of three independent sets was shown in the figure. “N” stands for normoxia and “H” stands for hypoxia.
-
Figure 3—source data 1
Original western blot files for Figure 3C.
- https://cdn.elifesciences.org/articles/72873/elife-72873-fig3-data1-v2.zip
-
Figure 3—source data 2
Original western blot files for Figure 3F.
- https://cdn.elifesciences.org/articles/72873/elife-72873-fig3-data2-v2.zip
Figure 3—figure supplement 1
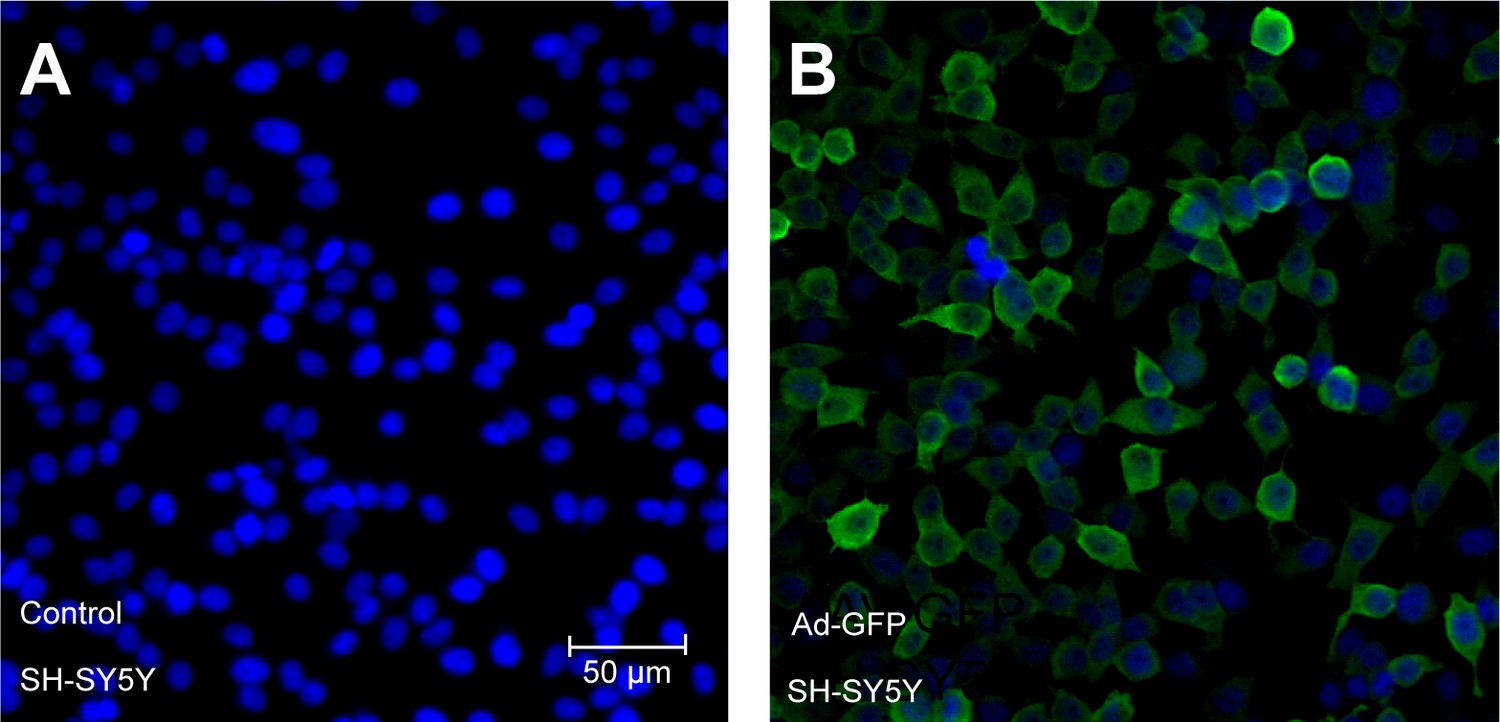
Validation of transgene expression after forced expression of transgenes encoded within adenoviral vectors in SH-SY5Y cells.
Adenoviruses encoding GFP (Ad-GFP) were used to infect SH-SY5Y cells and expression was examined after 72 hr to achieve steady-state levels of expression. Cells were immunostained using a GFP antibody to monitor the efficiency of overexpression. Parallel sets without adenoviral transduction were also monitored with GFP antibody and excluded non-specific staining. Experiments were performed as three independent sets and a representative picture of each is shown.
Figure 3—figure supplement 2
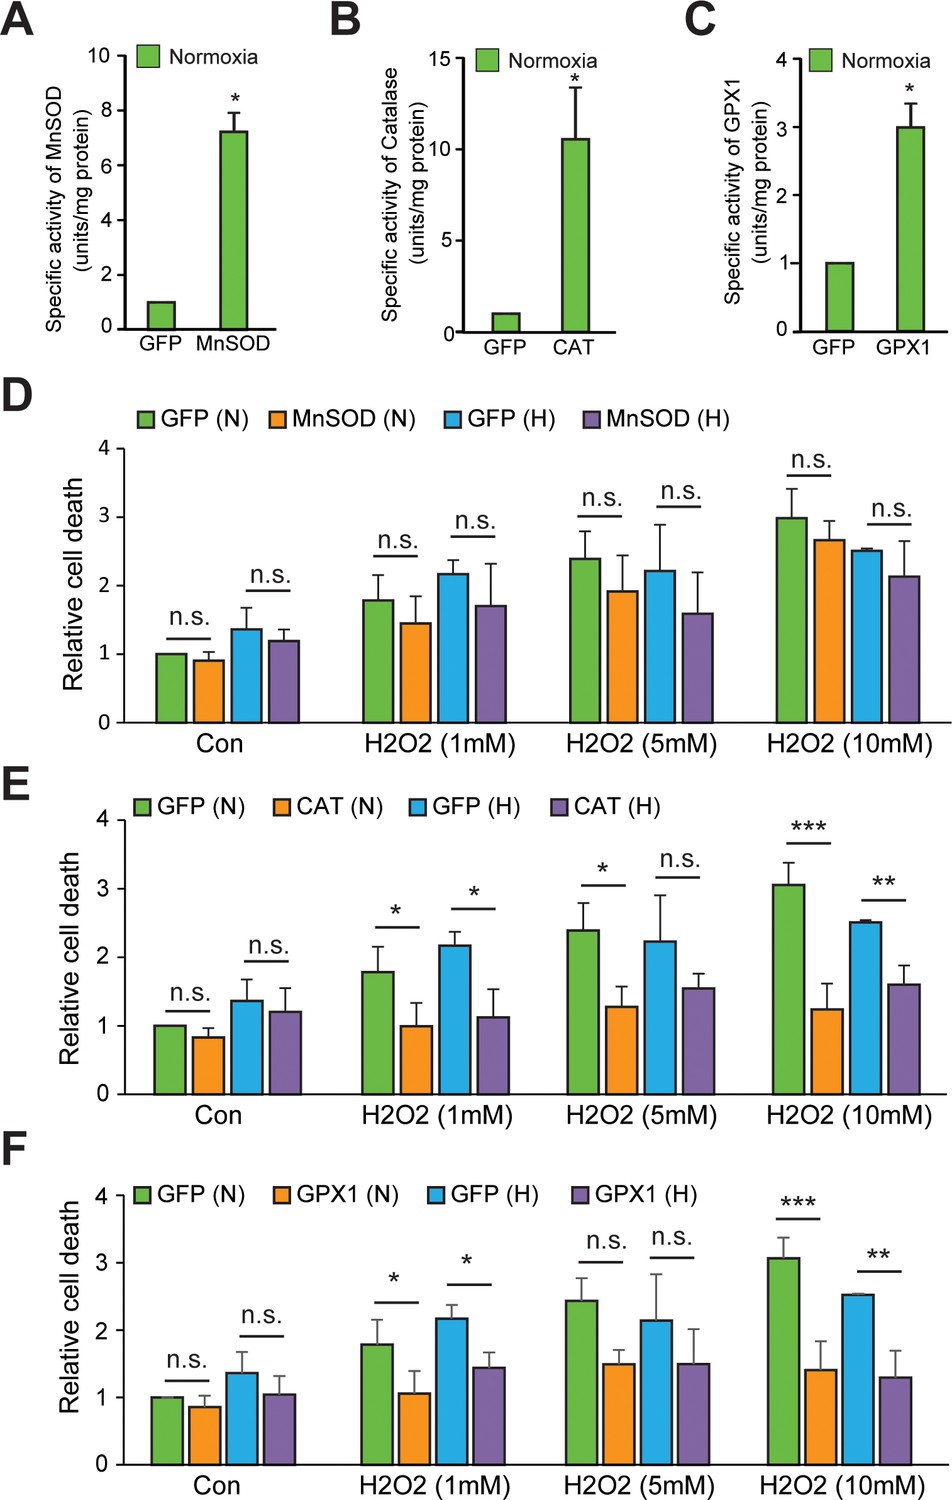
Validation of the enzyme activities of various antioxidants in normoxia and hypoxia.
(A–C) SH-SY5Y cells were transduced with adenoviral constructs encoding MnSOD, catalase, GPX1 or a GFP control and incubated for 72 hr for steady-state expression. Cells were processed for measurement of specific activities of MnSOD, catalase, and GPX1 enzymes in normoxia in sets overexpressing MnSOD, catalase, and GPX1 adenoviral constructs, respectively. The final values were pooled as mean ± S.D. of three independent experiments in all cases. The statistical analyses were performed using Student’s t test. (*) indicates statistical difference of p < 0.05 with respect to respective GFP control. (D–F) In order to indirectly assess the enzyme activities of these antioxidant constructs in normoxia as well as hypoxia, SH-SY5Y cells expressing either GFP or antioxidants (MnOSD, Catalase or GPX1) were treated with increasing conc. of H2O2 (1 mM –10 mM) and then were either exposed to normoxia or hypoxia for 4 hr in parallel. Thereafter, media was carefully removed and 100 μl of 1xPBS containing 10 μM Sytox blue dye (ThermoFisher Scientific; Catalog number: S11348) was added in wells and the plate was incubated for 20 min at room temperature in dark before taking the fluorescence reading at Ex/Em: 440/480. The final values were pooled as mean ± S.D. of three independent experiments in all cases. Two-way ANOVA with Bonferroni post-test was used for the statistical analysis. (n.s.), (*) and (***) indicate non-significant difference, and the statistical differences of p < 0.05, and p < 0.001, respectively, with respect to respective GFP control under normoxia or hypoxia.
Figure 3—figure supplement 3
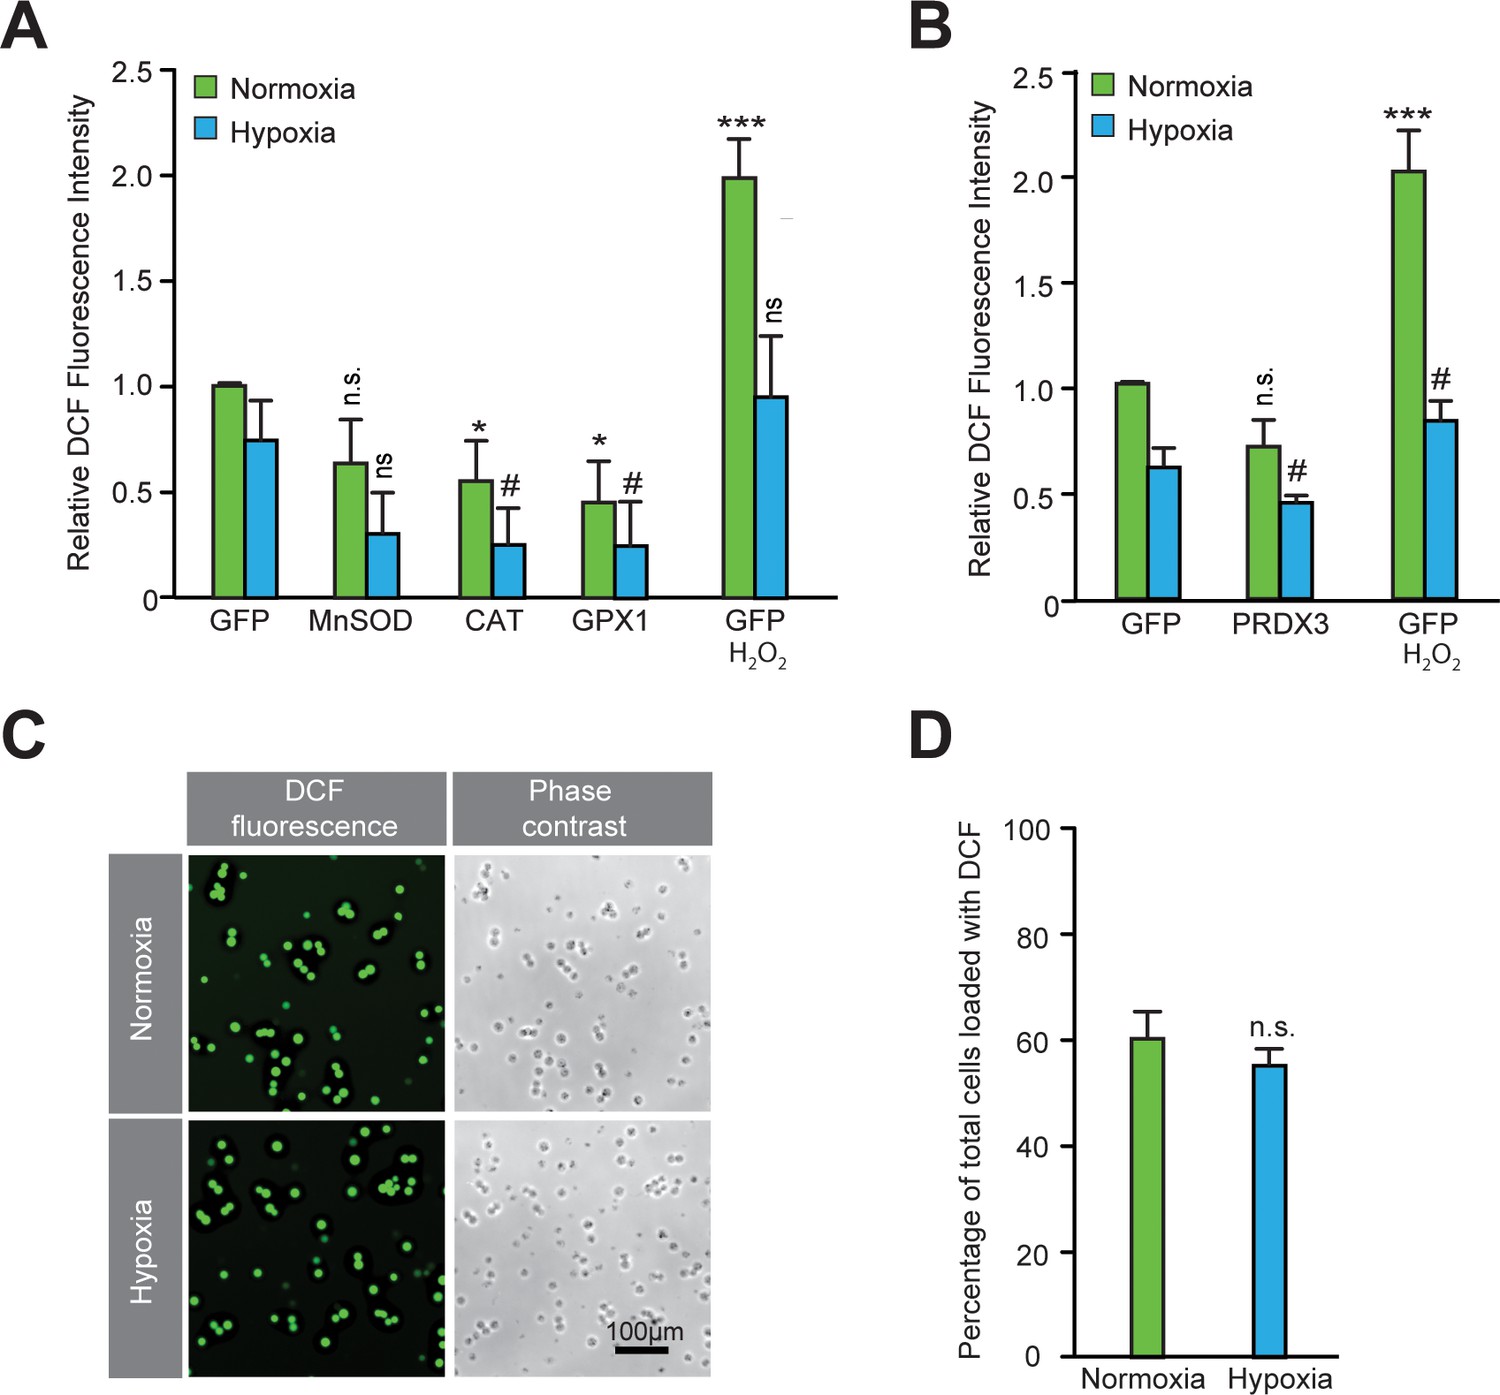
Validation of the functional activity of antioxidants to reduce reactive oxygen species.
(A–B) After exposing parallel sets of SH-SY5Y ODD-Luc cells to either normoxia or hypoxia for 4 hr, media was removed, cells were washed with 1xPBS, and then 1xPBS with 20 μM DCFDA was added in each well. Additional parallel sets of cells from both conditions were also treated with 5 mM H2O2 at the same time and were used as positive controls. Plates from both normoxia and hypoxia were then incubated at room temperature for 30 min in normoxic condition. Thereafter, the fluorescence of DCFDA loaded SH-SY5Y cells were measured through flow cytometry using standard fluorescein wavelengths. Fluorescence values were obtained by multiplying cell counts with mean fluorescence and later converted into relative fold change with respect to cells expressing GFP exposed to either normoxia or hypoxia. The final values were pooled as mean ± S.D. of three independent experiments in all cases. One-way ANOVA with Dunnett’s post-test was used for all comparisons and a similar comparison was done in hypoxia separately. (n.s.), (*) and (***) indicate non-significant difference, and the statistical differences of p < 0.05, and p < 0.001, respectively, with respect to GFP control under normoxia while (ns) and (#) indicate non-significant difference and the statistical differences of p < 0.05, respectively, with respect to GFP control in hypoxia. (C, D) DCF loading was equivalent in normoxic and hypoxic cells. SH-SY5Y cells were loaded with DCFDA for 30 min either in normoxia or hypoxia and then exposed to visible light equally to completely oxidize fluorescein. Illuminated cells incubated under normoxic or hypoxic conditions (from five independent sets) were counted manually to establish whether cells had equal DCFDA loading under both conditions. These values were pooled as mean ± SD. The statistical analysis was done using Student’s t test. (n.s.) indicates non-significant difference with respect to normoxia.
Figure 3—figure supplement 4
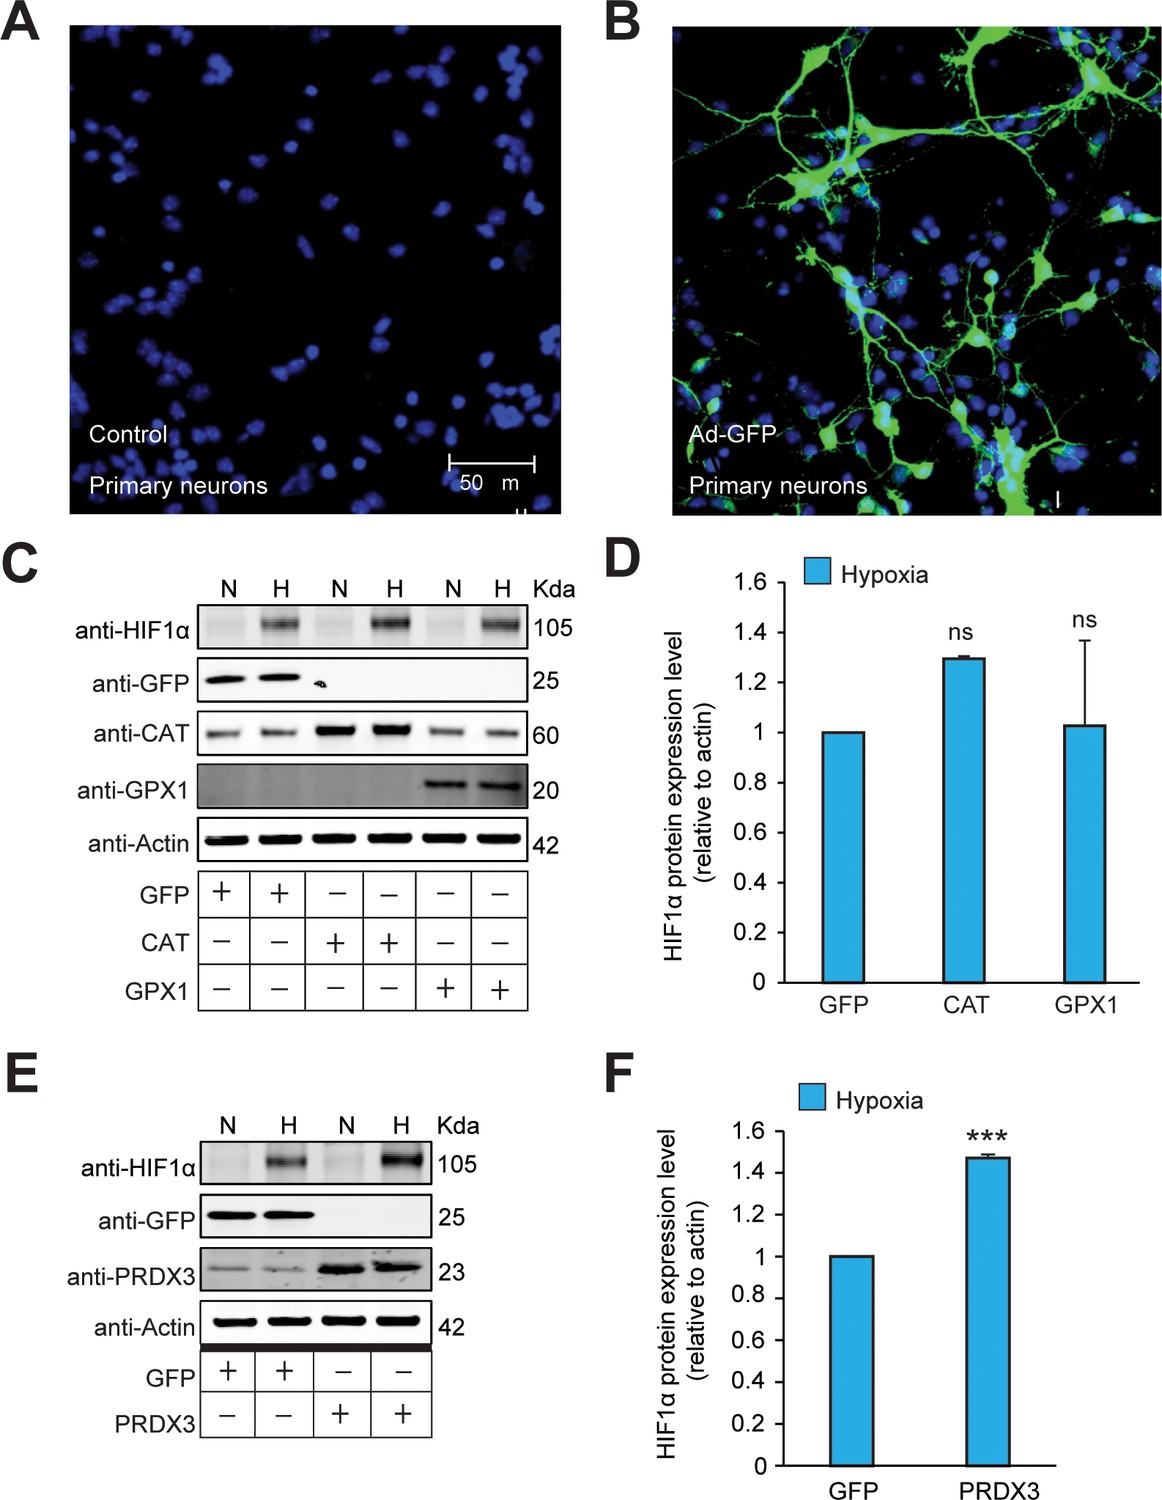
The stabilization of HIF1α is not oxidant-initiated in hypoxia in primary cortical neurons.
(A, B) The transgene expression after forced expression of transgenes encoded within adenoviral vectors in primary cortical neuronal cultures (PCNs) were validated by infecting PCNs using adenovirus encoding GFP (Ad-GFP) and then examining the expression after 48 hr. Cells were immunostained using a GFP antibody to monitor the efficiency of overexpression. Parallel sets without adenoviral transduction were also monitored with GFP antibody and excluded non-specific staining. Experiments were performed as three independent sets and a representative picture of each is shown. (C–F) Mouse primary neurons were transduced with adenoviral vectors encoding distinct antioxidant enzymes or GFP for 48 hr and then exposed to normoxia or hypoxia in parallel for 4 hr. (C and E) represent immunoblots and (D and F) represent densitometric analysis of the respective HIF1α blots. All western blot experiments were performed as three independent sets and a representative blot of each was shown in the figure. The statistical analyses were performed using One-way ANOVA with Dunnett post-test in (D) and unpaired t test in (F). (n.s.) and (***) indicate non-significant difference and the statistical differences of p < 0.001, respectively, with respect to GFP control in hypoxia.
-
Figure 3—figure supplement 4—source data 1
Original western blot files for Figure 3—figure supplement 4C.
- https://cdn.elifesciences.org/articles/72873/elife-72873-fig3-figsupp4-data1-v2.zip
-
Figure 3—figure supplement 4—source data 2
Original western blot files for Figure 3—figure supplement 4E.
- https://cdn.elifesciences.org/articles/72873/elife-72873-fig3-figsupp4-data2-v2.zip
Figure 3—figure supplement 5
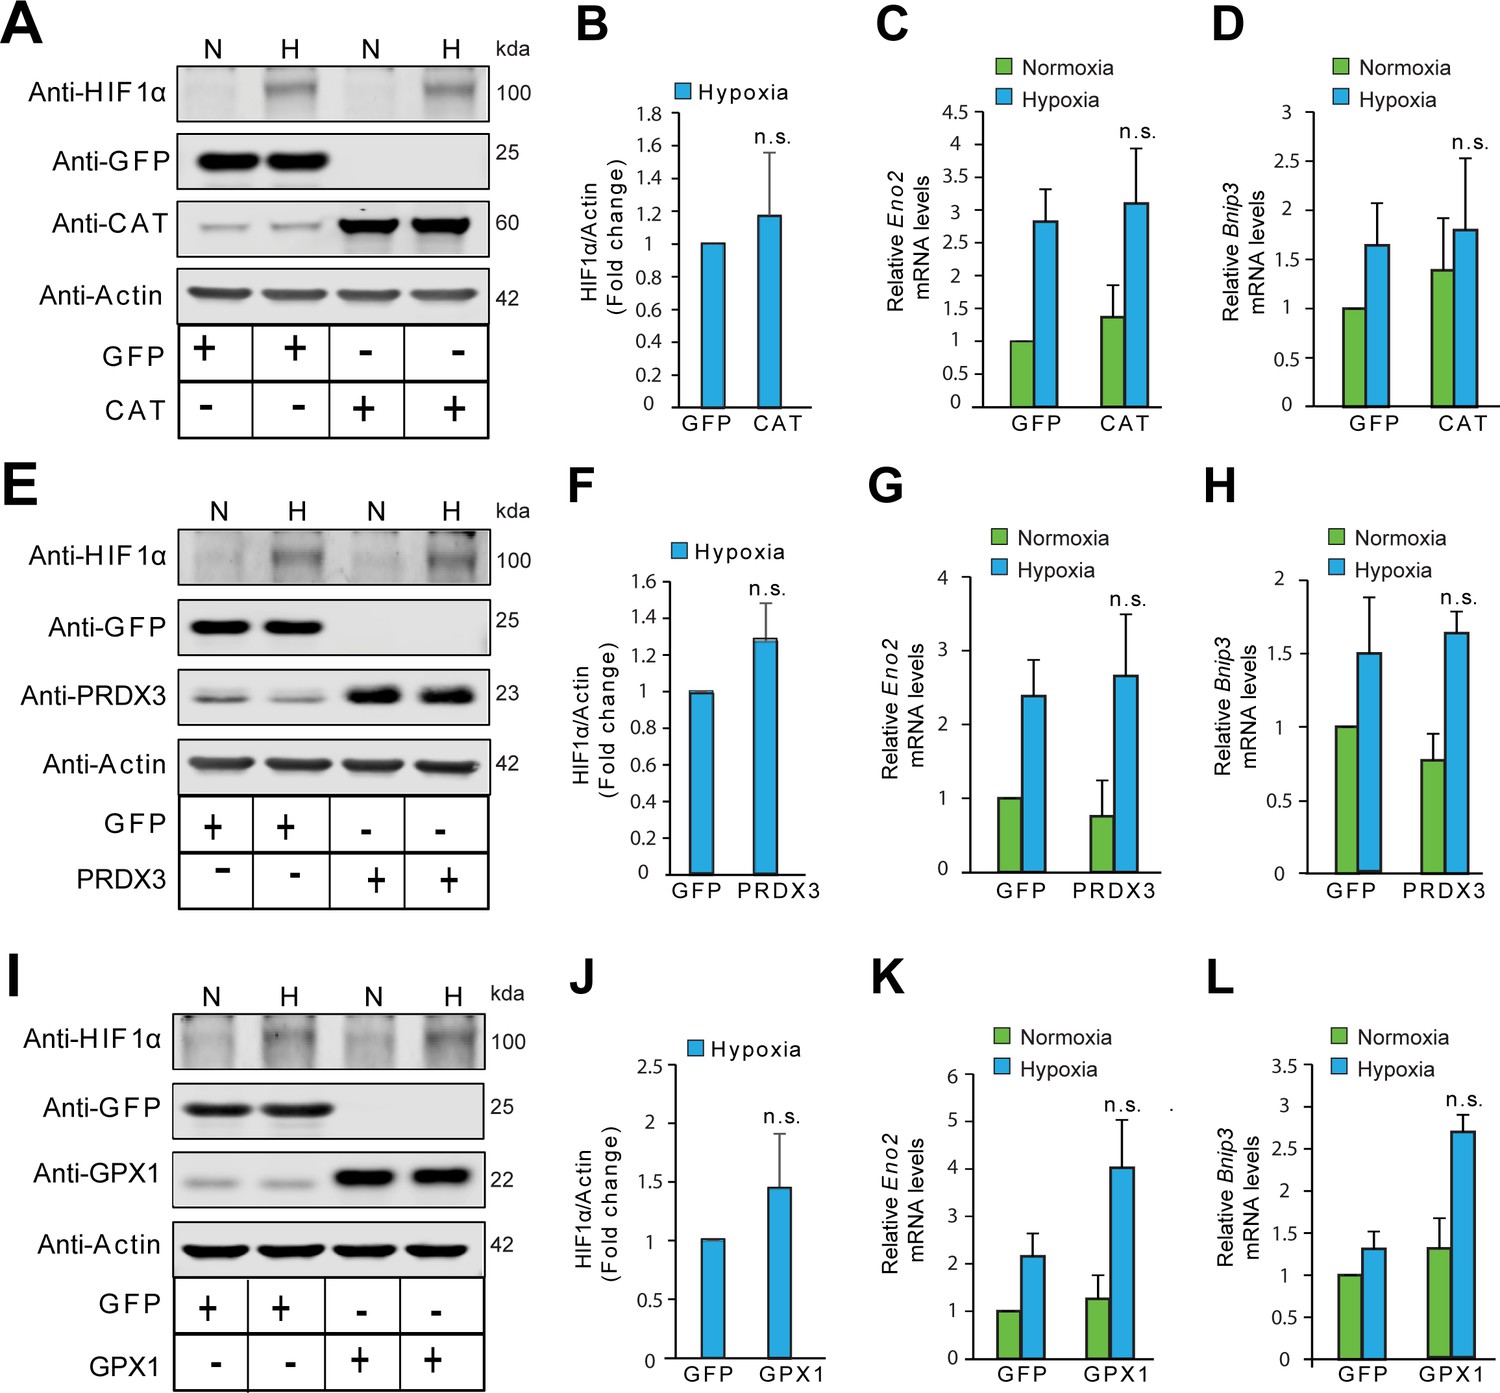
The stabilization of HIF1α is not oxidant-initiated in hypoxia in HeLa cells.
HeLa cells were infected with adenoviruses encoding designated antioxidant enzymes and gene expression was assessed after 72 hr. Cells with forced expression of GFP or designated antioxidant enzymes were exposed to normoxia or hypoxia in parallel experiments and were processed for immunobloting of HIF1α or mRNA expression analysis of HIF1α target genes, Eno2 and Bnip3. (A, E, I) Immunoblots showing changes in the protein level of HIF1α in response to catalase (CAT) overexpression (A), peroxiredoxin 3 (PRDX3) overexpression (E) or glutathione peroxidase 1 (GPX1) overexpression (I) under normoxia and hypoxia. (B, F, J) Densitometric analysis of changes in the protein level of HIF1α in hypoxia with designated antioxidant enyzmes. (C, G, K) Changes in mRNA level of HIF1α target gene, Eno2 in respective overexpression conditions in normoxia and hypoxia. (D, H, L) Changes in mRNA level of HIF1α target gene, Bnip3 in respective overexpression conditions in normoxia and hypoxia. The final values were pooled as mean ± S.D. of three independent experiments in all cases. Student’s t test was used to compare the statistical difference between cells expressing antioxidants such as CAT, PRDX3, or GPX1 with that of respective GFP controls under hypoxia in densitometric analysis as well as gene expression analysis. (n.s.) indicates non-significant difference with respect to respective GFP controls under hypoxia. All western blot experiments were performed as three independent sets and a representative blot of each was shown in the figure.
-
Figure 3—figure supplement 5—source data 1
Original western blot files for Figure 3—figure supplement 5E.
- https://cdn.elifesciences.org/articles/72873/elife-72873-fig3-figsupp5-data1-v2.zip
-
Figure 3—figure supplement 5—source data 2
Original western blot files for Figure 3—figure supplement 5E.
- https://cdn.elifesciences.org/articles/72873/elife-72873-fig3-figsupp5-data2-v2.zip
-
Figure 3—figure supplement 5—source data 3
Original western blot files for Figure 3—figure supplement 5I.
- https://cdn.elifesciences.org/articles/72873/elife-72873-fig3-figsupp5-data3-v2.zip
Figure 3—figure supplement 6
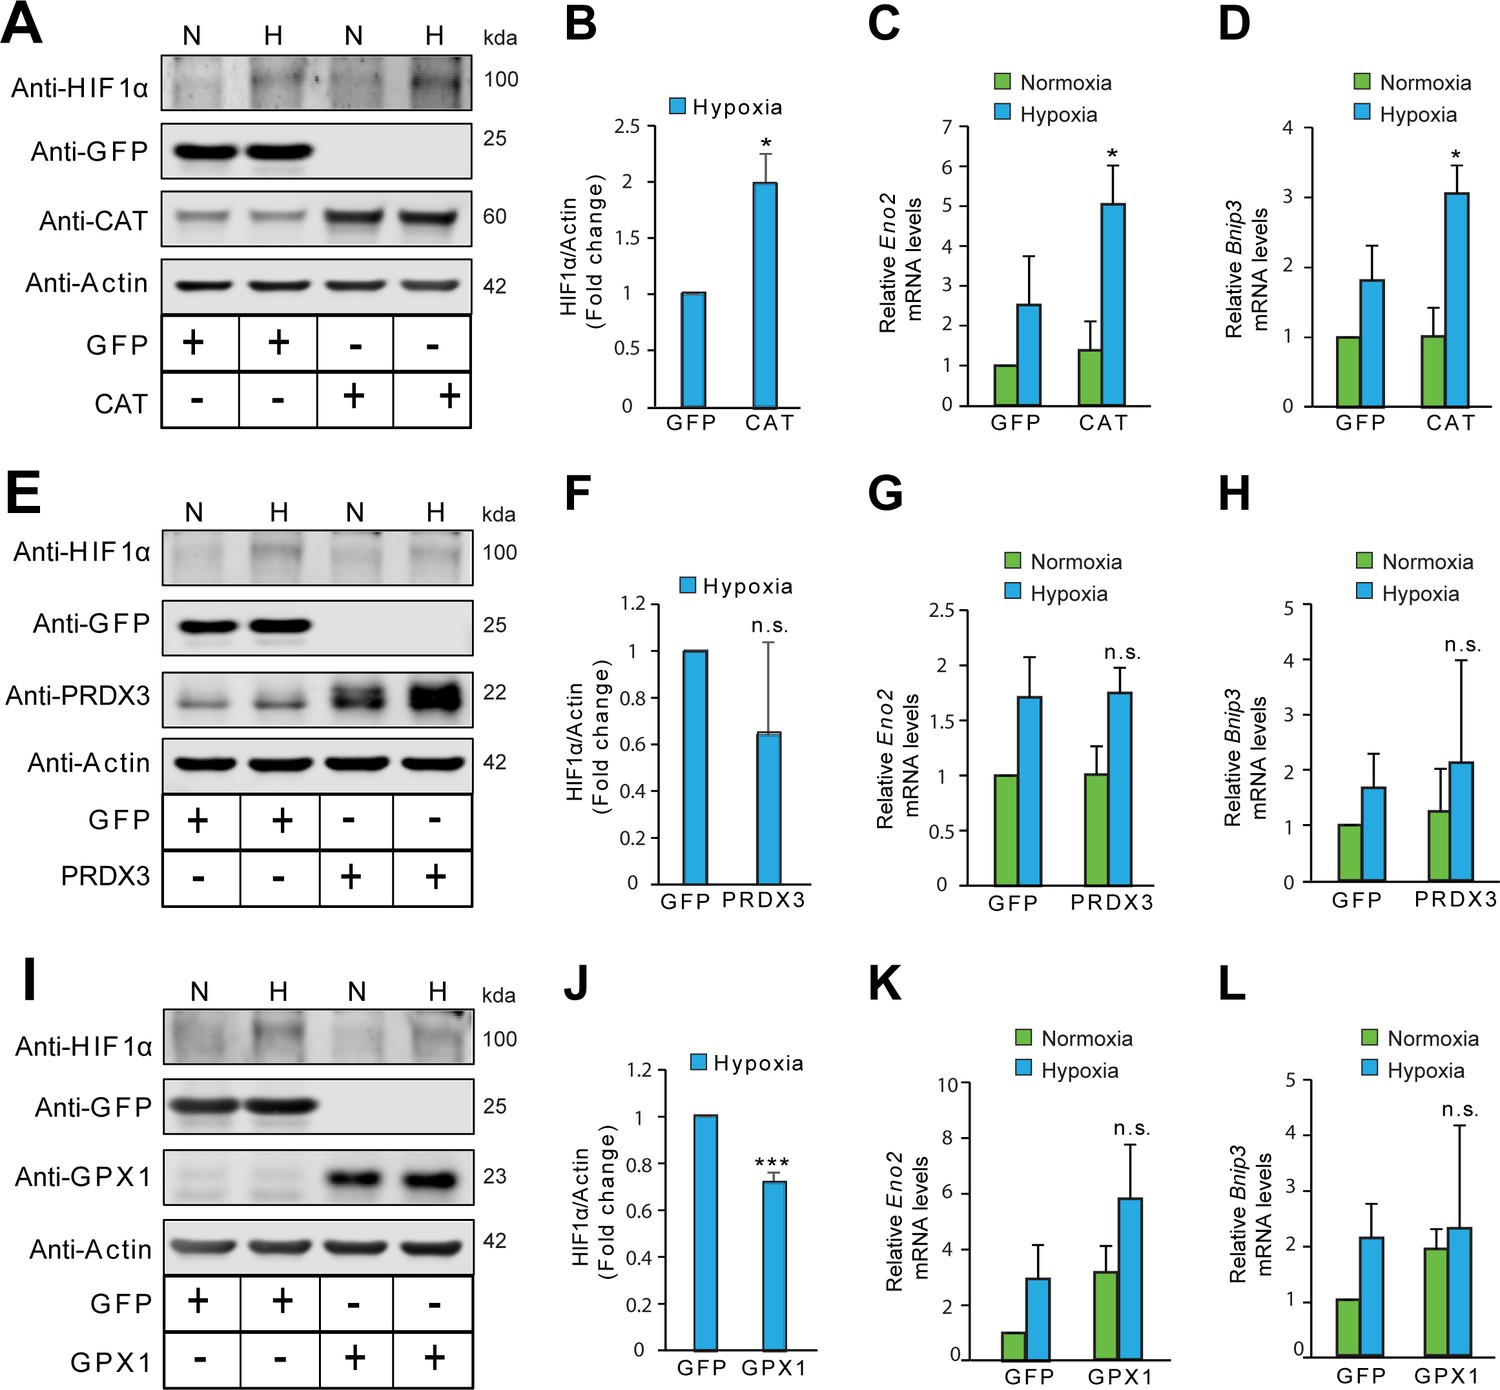
The stabilization of HIF1α is not oxidant-initiated in hypoxia in Hep3B cells.
Hep3B cells were infected with adenoviruses encoding distinct antioxidant enzymes and transgenes reached steady state expression after 72 hr. Transduced cells were then exposed to normoxia or hypoxia in parallel experiments and were processed for immunoblotting to assess protein levels of HIF1α or mRNA analysis for assessing changes in levels of established HIF1α target genes, Eno2 and Bnip3. (A, E, I) Immunoblots demonstrating changes in the protein level of HIF1α in response to either catalase (CAT) overexpression (A), peroxiredoxin 3 (PRDX3) overexpression, (E) or glutathione peroxidase 1 (GPX1) overexpression (I) under normoxia and hypoxia. (B, F, J) Densitometric analysis of changes in the protein level of HIF1α under hypoxia in respective overexpression conditions. (C, G, K) Changes in mRNA level of HIF1α target gene, Eno2 in respective overexpression conditions in normoxia and hypoxia. (D, H, L) Changes in mRNA level of HIF1α target gene, Bnip3 in respective overexpression conditions in normoxia and hypoxia. The final values were pooled as mean ± S.D. of three independent experiments in all cases. Student’s t test was used to compare the statistical difference between cells expressing antioxidants such as CAT, PRDX3 or GPX1 with that of respective GFP controls under hypoxia in densitometric analysis as well as gene expression analysis. (n.s.), (*) and (***) indicate non-significant differences, and the statistical differences of p < 0.05, and p < 0.001, respectively with respect to respective GFP controls under hypoxia. All immunoblot experiments were performed as three independent sets and a representative blot of each was shown in the figure.
-
Figure 3—figure supplement 6—source data 1
Original western blot files for Figure 3—figure supplement 6A.
- https://cdn.elifesciences.org/articles/72873/elife-72873-fig3-figsupp6-data1-v2.zip
-
Figure 3—figure supplement 6—source data 2
Original western blot files for Figure 3—figure supplement 6E.
- https://cdn.elifesciences.org/articles/72873/elife-72873-fig3-figsupp6-data2-v2.zip
-
Figure 3—figure supplement 6—source data 3
Original western blot files for Figure 3—figure supplement 6I.
- https://cdn.elifesciences.org/articles/72873/elife-72873-fig3-figsupp6-data3-v2.zip
Figure 4
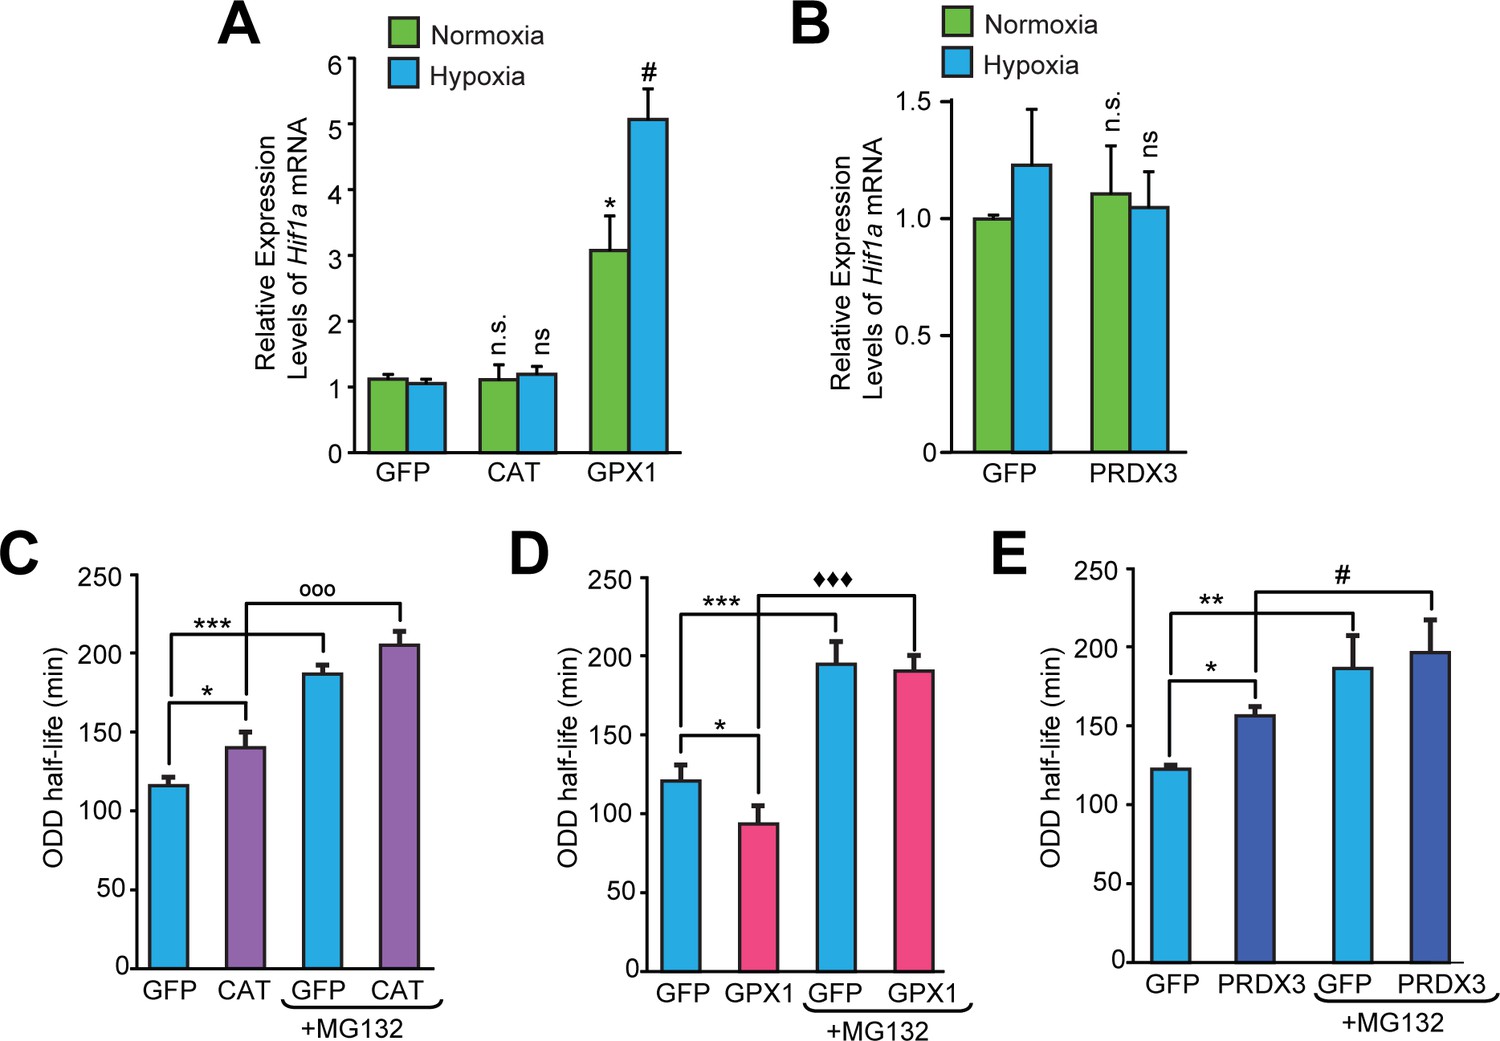
Divergent changes in HIF1α protein levels induced by antioxidant enzymes capable of scavenging peroxide cannot be attributed to differential changes in Hif1a mRNA synthesis or stability.
(A, B) Relative changes in Hif1a mRNA in SH-SY5Y cells in response to forced expression of various antioxidant enzymes. Data were pooled from three independent experiments in the form of mean ± SD. One-way ANOVA with Dunnett’s post-test was used for comparing cells expressing catalase or GPX1 with respect to cells expressing GFP and Student’s t test was used for comparing cells expressing PRDX3 with respect to GFP. (n.s.) indicates non-significant difference with respect to respective GFP controls under normoxia while (ns) and (#) indicate non-significant difference and the statistical difference of p < 0.05, respectively, with respect to GFP control in hypoxia. (C, D, E) Changes in half-life of HIF1α in SH-SY5Y ODD-Luc cells expressing catalase or GPX1 or PRDX3 with respect to that of respective GFP controls in hypoxia. ODD Half-life was assessed by performing a pulse chase experiment by adding 35 µM cycloheximide at every 20 min for a total of 4 hr using luciferase activity assay in SH-SY5Y cells expressing these antioxidants pre-treated either with or without 10 µM MG132. Data were pooled from three independent experiments in the form of mean ± SD. Two-way ANOVA with Bonferroni’s post-test was used for statistical analysis. (*), (**), and (***) indicate statistical differences of p < 0.05, p < 0.01, and p < 0.001 with respect to respective GFP controls in hypoxia. (°°°), (♦♦♦) and (#) represent statistical differences of p < 0.001w.r.t CAT, p < 0.001 w.r.t GPX1 and p < 0.05 w.r.t PRDX3, respectively.
Figure 5 with 1 supplement
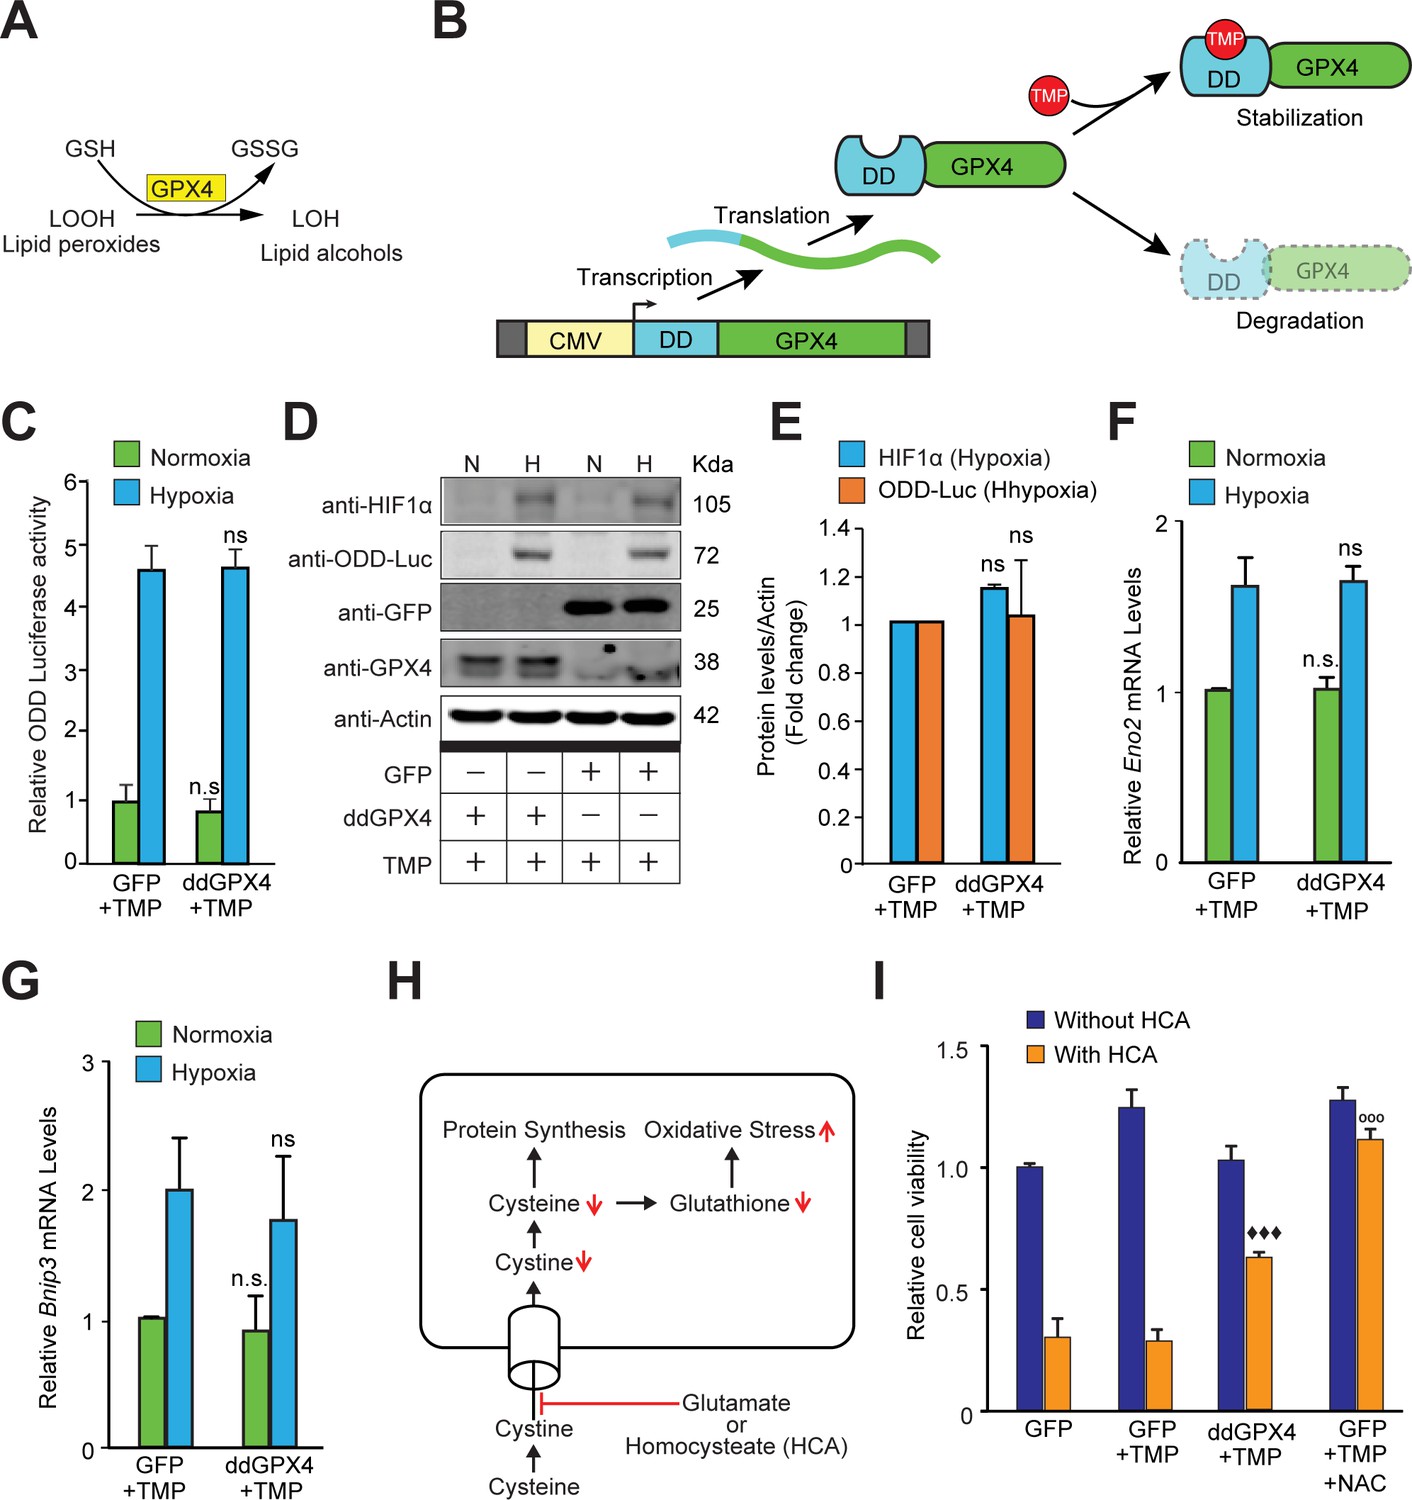
Reactive lipid species do not regulate HIF1α stabilization or its transcriptional activity in hypoxia.
(A) A schematic diagram showing that GPX4 converts lipid hydroperoxides into lipid alcohols using GSH as a cofactor. (B) A schematic showing regulated protein expression of GPX4 fusion containing an optimized destabilization domain when exposed to the antibiotic, Trimethoprim (TMP). Reversible stability of GPX4 protein was conferred by fusing its coding sequence to a destabilization domain sequence (mutants of E. coli dihydrofolate reductase). Accordingly, GPX4 protein possessing the destabilization domain is degraded resulting in low steady levels of GPX4. Trimethoprim binds to and neutralizes the destabilization domain stabilizing GPX4 protein in a dose-dependent manner. (C–E) SH-SY5Y ODD-Luc cells were transduced with adenoviral vectors encoding a destabilized form of GPX4 (ddGPX4) or GFP and then exposed to normoxia/hypoxia and were either processed for luciferase activity assay (C) or immunoblotting (D) and densitometric quantitation of three independent western blots of HIF1α and ODD-Luc protein were shown in (E). 10 µM TMP was added to ddGPX4 expressing cells after 60 h of adenoviral incubation for 12 hr to achieve stabilized GPX4 expression. (F, G) Relative changes in mRNA levels of HIF1α target genes, Eno2 and Bnip3 in SH-SY5Y cells. (H) A schematic diagram depicting the glutathione depletion model of oxidative stress. (I) PCNs were transduced with GFP/GPX4 for 24 hr and then treated with 5 mM HCA. Cells were simultaneously treated with 10 µM TMP. Then, cells were incubated for 24 hr to induce oxidative stress. Thereafter, viability of cells was measured via the MTT assay. 100 µM NAC was used as positive control. The final values were pooled as mean ± S.D. of three independent experiments. Two-way ANOVA with Bonferroni’s post-test was used for statistical analyses. One-way ANOVA with Dunnett’s post-test was used for comparing DCF fluorescence and viability. (n.s.), (*) and (***) indicate non-significant difference, and the statistical differences of p < 0.05, and p < 0.001, respectively, with respect to GFP control under normoxia while (ns), (#) and (###) indicate non-significant difference, and the statistical differences of p < 0.05, and p < 0.001, respectively, with respect to GFP control in hypoxia. (°°°) indicates statistical difference of p < 0.001 with respect to GFP treated with HCA only while (♦♦♦) indicates statistical difference of p < 0.001 with respect to GFP treated with both TMP and HCA.
-
Figure 5—source data 1
Original western blot files for Figure 5D.
- https://cdn.elifesciences.org/articles/72873/elife-72873-fig5-data1-v2.zip
Figure 5—figure supplement 1
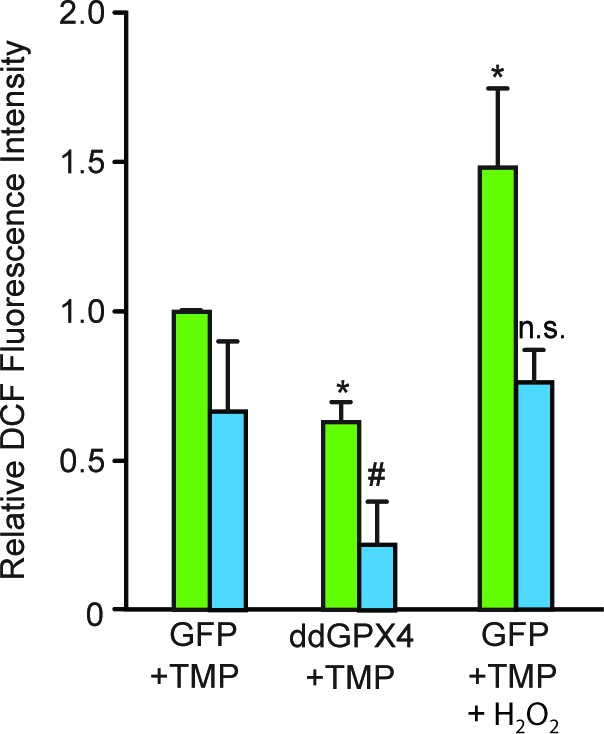
Validation of the functional activity of GPX4 to reduce reactive lipid species.
After exposing parallel sets of SH-SY5Y ODD-Luc cells to either normoxia or hypoxia for 4 hr, media was removed, cells were washed with 1xPBS, and then 1xPBS with 20 μM DCFDA was added in each well. Additional parallel sets of cells from both conditions were also treated with 5 mM H2O2 at the same time and were used as positive controls. Plates from both normoxia and hypoxia were then incubated at room temperature for 30 min in normoxic condition. Thereafter, the fluorescence of DCFDA loaded SH-SY5Y cells were measured through flow cytometry using standard fluorescein wavelengths. Fluorescence values were obtained by multiplying cell counts with mean fluorescence and later converted into relative fold change with respect to cells expressing GFP exposed to either normoxia or hypoxia. The final values were pooled as mean ± S.D. of three independent experiments. One-way ANOVA with Dunnett’s post-test was used for all comparisons and a similar comparison was done in hypoxia separately. (*) indicate the statistical difference of p < 0.05 with respect to GFP control under normoxia while (n.s.) and (#) indicate non-significant difference and the statistical difference of p < 0.05 with respect to GFP control in hypoxia.
Author response image 1

Sub-cellular localization of various antioxidants.
Author response image 2
Relative changes in HIF1α protein level in response to overexpression of MnSOD, catalase or GPX1 under normoxia and hypoxia.
Tables
Key resources table
| Reagent type (species) or resource | Designation | Source or reference | Identifiers | Additional information |
|---|---|---|---|---|
| Antibody | Anti-GFP(Rabbit polyclonal) | Cell Signaling Technology | Cat#2555; RRID:AB_390710 | WB (1:1000) |
| Antibody | Anti-MnSOD(Rabbit polyclonal) | Sigma-Aldrich | Cat#HPA001814; RRID:AB_1080134 | WB(1:10000) |
| Antibody | Anti-Catalase(Mouse monoclonal) | Sigma-Aldrich | Cat#C0979; RRID:AB_258720 | WB(1:1000) |
| Antibody | Anti-GPX1(Rabbit monoclonal) | Cell Signaling Technology | Cat#3,286 S; RRID:AB_2067572 | WB(1:1000) |
| Antibody | Anti-GPX1(Rabbit polyclonal) | Novus Biologicals | Cat#NBP1-33620; RRID:AB_10004091 | WB(1:2000) |
| Antibody | Anti-GPX4(Rabbit polyclonal) | LSBio | Cat#LS B1596 | WB(1:1000) |
| Antibody | Anti-PRDX3(Rabbit polyclonal) | Novus Biologicals | Cat#NBP2-19777 | WB(1:2000) |
| Antibody | Anti-Luciferase(Mouse monoclonal) | Santa Cruz Biotechnology | Cat#sc-74548; RRID: AB_1125118 | WB(1:1000) |
| Antibody | Anti-HIF1α(Rabbit polyclonal) | Novus Biologicals | Cat#NB100-479; RRID:AB_10000633 | WB(1:1000) |
| Antibody | Anti-HIF1α(Mouse monoclonal) | Novus Biologicals | Cat#NB100-105; RRID:AB_10001154 | WB(1:500) |
| Antibody | Anti-Citrate synthase(Rabbit monoclonal) | Cell Signaling Technology | Cat#14,309 S; RRID:AB_2665545 | WB(1:3000) |
| Antibody | Anti-β-actin(Rabbit polyclonal) | Sigma-Aldrich | Cat#A2066; RRID:AB_476693 | WB(1:10000) |
| Antibody | Anti-β-actin(Mouse monoclonal) | Sigma-Aldrich | Cat#A5316; RRID:AB_476743 | WB(1:10000) |
| Other | Ad-GFP | ViraQuest, Inc (North liberty, IA) | MSRN: 22,576 | Adenoviral construct |
| Other | Ad-ddGPX4 | ViraQuest, Inc (North liberty, IA) | MSRN: 22,665 | Adenoviral construct |
| Other | Ad5CMV-GFP | Univ. of Iowa, Viral Vector Core Facility | Adenoviral construct | |
| Other | Ad5CMV-MnSOD | Univ. of Iowa, Viral Vector Core Facility | Adenoviral construct | |
| Other | Ad5CMV-CAT | Univ. of Iowa, Viral Vector Core Facility | Adenoviral construct | |
| Other | Ad5CMV-GPX1 | Univ. of Iowa, Viral Vector Core Facility | Adenoviral construct | |
| Other | Ad-CMV-GFP | Vector Biolabs | Adenoviral construct | |
| Other | Ad-h-PRDX3 | Vector Biolabs | ADV-219772 | Adenoviral construct |
| Other | Ad-h-GRX1 | Vector Biolabs | ADV-209995 | Adenoviral construct |
| Other | Ad-HyPer-cyto vector | Vector Biolabs | Adenoviral construct | |
| Biological sample (Rattus norvegicus) | Islets from Sprague–Dawley male rats | Charles River | ||
| Biological sample(Mus musculus) | Primary cortical neurons from CD-1 strain mice | Charles River | ||
| Chemical compound, drug | Adaptaquin | Tocris Bioscience | 5953; CAS Number 385786-48-1 | |
| Chemical compound, drug | Rotenone | Sigma-Aldrich | R8875; CAS Number 83-79-4 | |
| Chemical compound, drug | Antimycin A | Sigma-Aldrich | A8674; CAS Number 1397-94-0 | |
| Chemical compound, drug | Myxothiazol | Sigma-Aldrich | T5580; CAS Number 76706-55-3 | |
| Chemical compound, drug | Sodium azide | Sigma-Aldrich | S2002; CAS Number 26628-22-8 | |
| Chemical compound, drug | Potassium cyanide (KCN) | Sigma-Aldrich | 207810; CAS Number 151-50-8 | |
| Chemical compound, drug | FCCP | Sigma-Aldrich | C2920; CAS Number 370-86-5 | |
| Chemical compound, drug | Trimethoprim (TMP) | Sigma-Aldrich | T7883; CAS Number 738-70-5 | |
| Chemical compound, drug | L-Homocysteic acid (HCA) | Sigma-Aldrich | H9633; CAS Number 14857-77-3 | |
| Chemical compound, drug | N-acetyl-L-cysteine (NAC) | Sigma-Aldrich | A7250; CAS Number 616-91-1 | |
| Chemical compound, drug | Hydrogen peroxide solution, 30% w/w | Sigma-Aldrich | H1009; CAS Number 7722-84-1 | |
| Commercial Assay or kit | Rat Insulin Radioimmunoassay (RIA) | Millipore-Sigma | RI-13K | |
| Commercial Assay or kit | DCFDA-Cellular Reactive Oxygen Species Detection Assay Kit | Abcam | ab113851 | |
| Commercial Assay or kit | DC Protein Assay Kit 1 | Bio-Rad | 5000111 | |
| Commercial Assay or kit | Luciferase Assay System | Promega | E1501 | |
| Commercial Assay or kit | MTT assay (CellTiter 96 Non-Radioactive Cell Proliferation Assay) | Promega | G4100 (G4101+ G4102) | |
| Other | Sytox blue nucleic acid stain | ThermoFisher Scientific | SS11348 | |
| Cell line (Homo sapiens) | SH-SY5Y | ATCC | CRL-2266; RRID:CVCL_0019 | |
| Cell line(Homo sapiens) | HeLa | ATCC | ATCC CCL-2; RRID:CVCL_0058 | |
| Cell line(Homo sapiens) | Hep3B | ATCC | ATCC HB-8064; RRID:CVCL_0326 | |
| Sequence-based reagent | FAM labeled Enolase2 (Taqman probe) | ThermoFisher Scientific | Hs00157360_m1 | |
| Sequence-based reagent | FAM labeled Bnip3 (Taqman probe) | ThermoFisher Scientific | Hs00969291_m1 | |
| Sequence-based reagent | FAM labeled Hif1α (Taqman probe) | ThermoFisher Scientific | Hs00153153_m1 | |
| Sequence-based reagent | VIC labeled human β actin (Taqman probe) | ThermoFisher Scientific | 4326315E | |
| Sequence-based reagent | FAM labeled RNA28S5 (Taqman probe) | ThermoFisher Scientific | Hs03654441_s1 | |
| Sequence-based reagent | VIC labelled RNA28S5 (Taqman probe) | ThermoFisher Scientific | Hs03654441_s1 | |
| Sequence-based reagent | FAM labeled Bnip3 (Taqman probe) | ThermoFisher Scientific | Rn00821446_g1 | |
| Sequence-based reagent | FAM labeled Kdm6b (Taqman probe) | ThermoFisher Scientific | Rn01471506_m1 | |
| Sequence-based reagent | VIC labeled rat β actin (Taqman probe) | ThermoFisher Scientific | 4352340E | |
| Software, algorithm | Graphpad Prism | RRID:SCR_002798 | ||
| Software, algorithm | Adobe Illustrator | RRID:SCR_010279 | ||
| Software, algorithm | Adobe Photoshop | RRID:SCR_014199 |
Additional files
Download links
A two-part list of links to download the article, or parts of the article, in various formats.
Downloads (link to download the article as PDF)
Open citations (links to open the citations from this article in various online reference manager services)
Cite this article (links to download the citations from this article in formats compatible with various reference manager tools)
HIF1α stabilization in hypoxia is not oxidant-initiated
eLife 10:e72873.
https://doi.org/10.7554/eLife.72873


