Addition of a carboxy-terminal tail to the normally tailless gonadotropin-releasing hormone receptor impairs fertility in female mice
- Department of Pharmacology and Therapeutics, McGill University, Canada
- Département de biomédecine vétérinaire, Université de Montréal, Canada
- Departamento de Ecología y Recursos Naturales, Biología, Facultad de Ciencias, Universidad Nacional Autónoma de México, Ciudad Universitaria, Mexico
- Department of Internal Medicine, Section Endocrinology and Metabolic Diseases, Leiden University Medical Center, Netherlands
- School of Biomedical Sciences, Faculty of Medicine, The University of Queensland, Australia
- Department of Neurology, Royal Brisbane & Women's Hospital, Queensland, United Kingdom
- Institute of Reproductive and Developmental Biology, Department of Metabolism, Digestion and Reproduction, Imperial College, United Kingdom
Figures
Figure 1 with 2 supplements
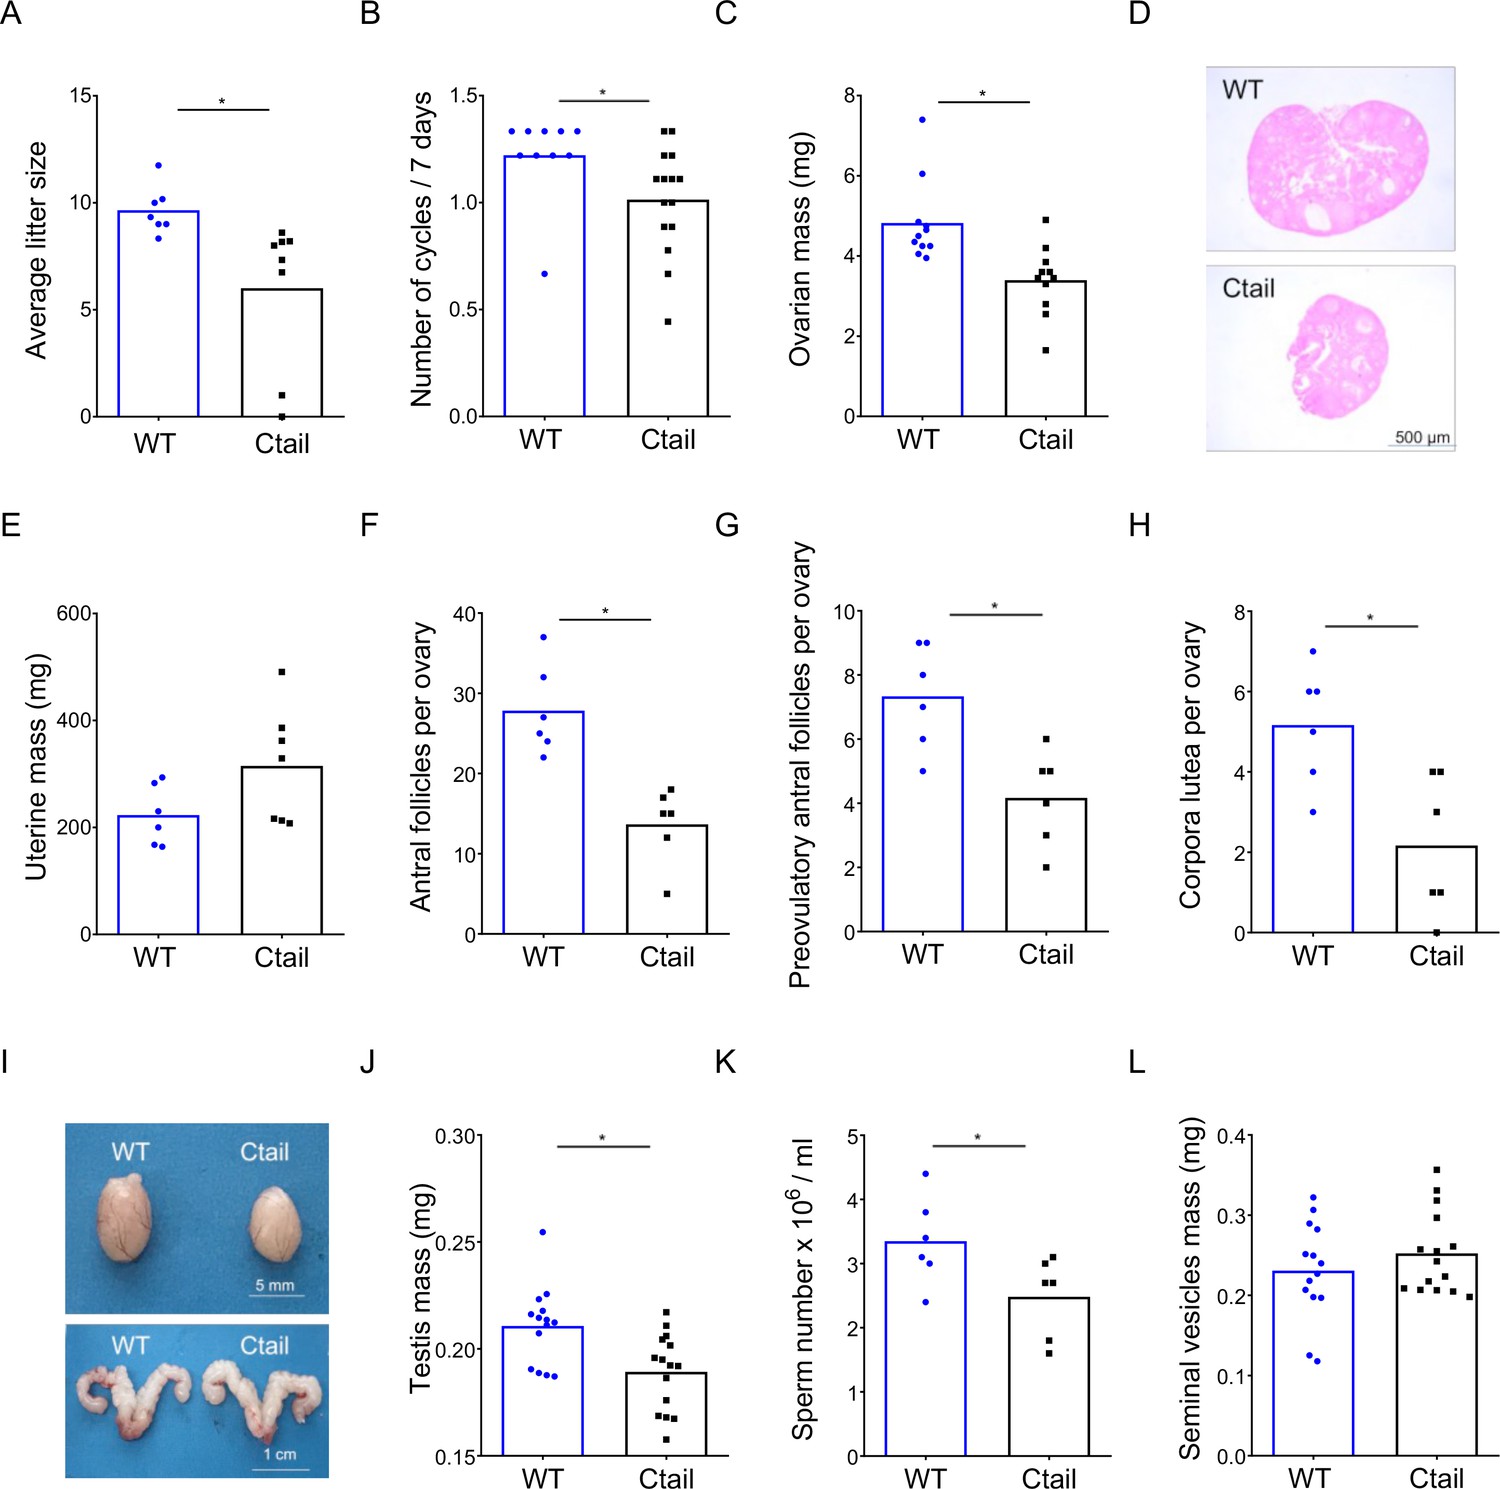
Ctail mice are hypogonadal and subfertile.
(A) Average litter sizes in wild-type (WT) and Ctail females paired with WT C57BL/6 males over a 6-month breeding trial (*p = 0.0196). (B) Estrous cycle frequency in WT and Ctail females (*p = 0.0384). (C) Ovarian mass of 10- to 12-week-old females (*p = 0.002). (D) H&E-stained ovarian sections from a WT and a Ctail mouse. (E) Uterine mass of 10- to 12-week-old females (ns, p = 0.088). Numbers of (F) antral follicles (*p = 0.0008), (G) preovulatory follicles (*p = 0.0055), and (H) corpora lutea per ovary (*p = 0.0088). (I) Testes (top) and seminal vesicles (bottom) from a WT and a Ctail male. (J) Testicular mass (*p = 0.0037), (K) number of mature spermatozoa per testis (*p = 0.0468), and (L) seminal vesicle mass (ns, p = 0.3123) in 10- to 12-week-old males. In A–C, E–H, and J–L, the bar height reflects the group mean and dots and squares reflect individual animals. Student’s t-tests were performed for statistical analysis.
Figure 1—figure supplement 1
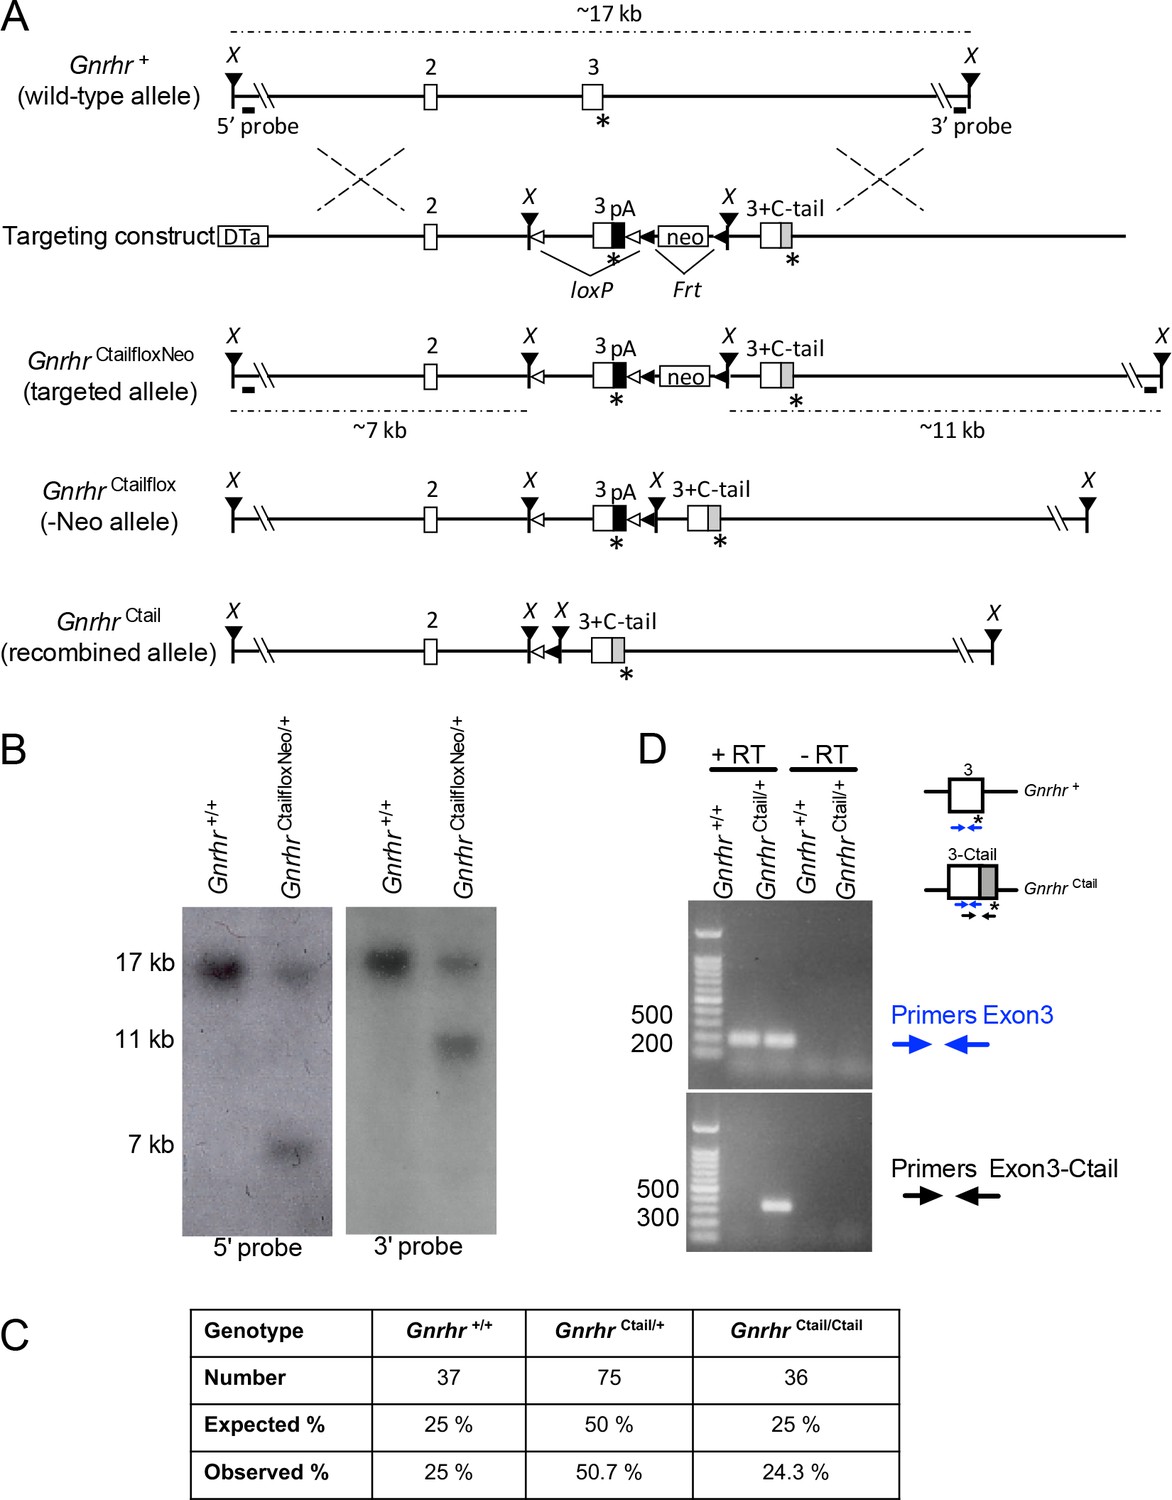
Generation of Ctail mice by gene targeting in embryonic stem cells.
(A) Targeting strategy showing the wild-type (WT) Gnrhr allele (Gnrhr+), the targeting construct, the targeted allele (GnrhrCtailfloxNeo), the Flp-recombined allele (GnrhrCtailflox; -Neo), and the Cre recombined allele (GnrhrCtail). Exons 2 and 3 are shown as white boxes, with their corresponding numbers above. The asterisks (*) indicate STOP codons. ‘X’ refers to XmaI restriction sites. The positions of the 5′ and 3′ Southern blot probes are shown as horizontal lines below the wild-type and targeted alleles. The sizes of the XmaI restriction fragments, detected by the 5′ and 3′ Southern blot probes, are indicated above the wild-type and below the targeted alleles. The loxP sites are indicated with open triangles, and the Frt sites with black (leftward facing) triangles. The chimeric murine exon 3 fused to the coding sequence of the chicken GnRHR Ctail (indicated by a gray box) is the labeled as exon ‘3+ C-tail’. pA: bovine growth hormone polyA signal sequence; Neo: neomycin resistance cassette; DTa: diphtheria toxin A chain negative selection marker. (B) Confirmation of successful gene targeting and germline transmission of the modified allele. Southern blot with 5′ (left) and 3′ probes (right) performed on genomic DNA from a WT (Gnrhr+/+) and a heterozygous mouse carrying the targeted allele (GnrhrCtaifloxNeo/+). (C) Ctail mice were born at the expected frequency. Number and percentage (%) of WT (Gnrhr+/+), heterozygous (GnrhrCtail/+), and Ctail mice (GnrhrCtail/Ctail) mice born from crosses of heterozygous mice. Pups were counted and genotyped at postnatal day 21. (D) WT and Ctail transcripts amplified from cDNA reverse transcribed from pituitary RNA of either WT (Gnrhr+/+) or heterozygous (GnrhrCtail/+) male mice with the recombined allele (after Cre-mediated recombination). PCR was performed using primers that amplify within exon 3 of the Gnrhr+ transcript (primers exon 3), or primers that amplify part of exon 3 and the Ctail (primers Exon3-Ctail). Minus RT (-RT) controls lack the reverse transcriptase enzyme.
Figure 1—figure supplement 2
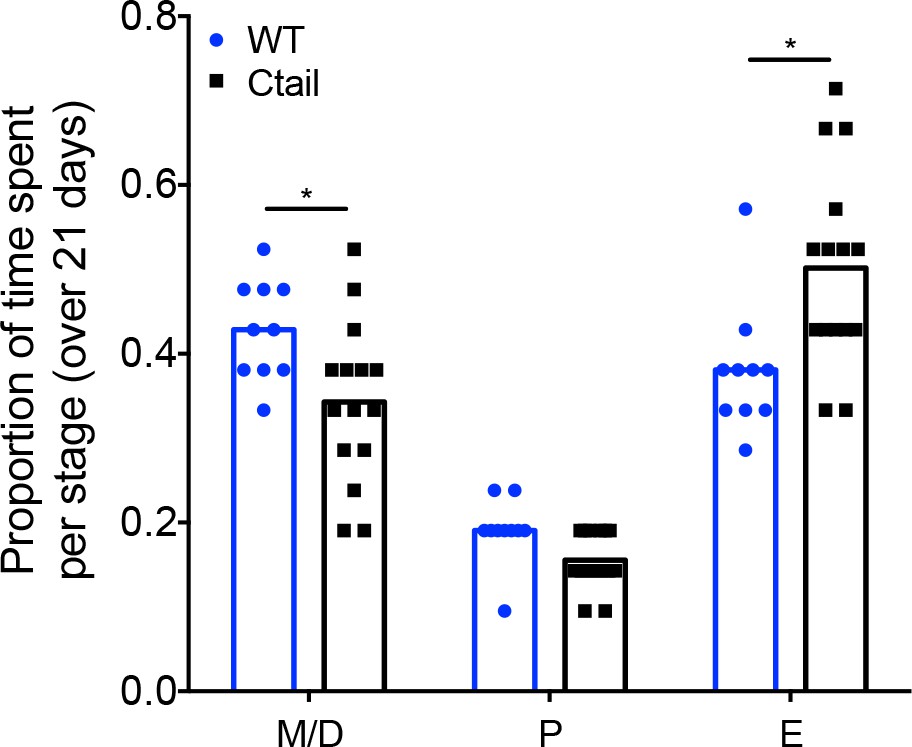
Ctail females exhibit altered estrous cyclicity.
Proportion of time spent in each stage of the estrous cycle in wild-type (WT) and Ctail mice. Individual data points are shown as circles and squares. The height of the bars reflects the group means. Data at each cycle stage were analyzed with paired t-tests. Bars with different letters differed significantly. M/D, metestrus/diestrus (*p = 0.0099); P, proestrus (p = 0.2841); E, estrus (*p = 0.0003).
Figure 2 with 1 supplement

Serum follicle-stimulating hormone (FSH) levels are reduced in Ctail mice.
Serum (A, C) FSH and (B, D) luteinizing hormone (LH) levels were measured in 10- to 12-week-old sham-operated (Sham) or gonadectomized female (A, B) and male (C, D) wild-type (WT) and Ctail mice. Females were sampled on diestrus afternoon. Gonadectomized animals were sampled 2-week postovariectomy (OVX) or castration (Cast). Male serum samples were measured with FSH/LH multiplex assays. In females, FSH was measured using an FSH Luminex assay and LH levels in females were measured by in-house ELISA. In each panel, the bar height reflects the group mean and dots and squares reflect individual animals. Statistical analyses in all panels were performed using two-way analyses of variance (ANOVAs), followed by Tukey’s multiple comparison tests. Bars with different letters differed significantly [female FSH: WT (sham) vs. Ctail (sham) p = 0.8241; WT (sham) vs. WT (OVX) p = 0.0001; Ctail (sham) vs. Ctail (OVX) p = 0.0010; WT (OVX) vs. Ctail (OVX) p = 0.4372. Female LH: WT (sham) vs. Ctail (sham) p = 0.99861; WT (sham) vs. WT (OVX) p = 0.0002; Ctail (sham) vs. Ctail (OVX) p = 0.0126; WT (OVX) vs. Ctail (OVX) p = 0.6399; male FSH: WT (sham) vs. Ctail (sham) p = 0.0005; WT (sham) vs. WT (Cast) p = 0.7155; Ctail (sham) vs. Ctail (Cast) p = 0.8218; WT (Cast) vs. Ctail (Cast) p = 0.0002. Male LH: WT (sham) vs. Ctail (sham) p = 0.9162; WT (sham) vs. WT (Cast) p = 0.0002; Ctail (sham) vs. Ctail (Cast) p = 0.2477; WT (Cast) vs. Ctail (Cast) p = 0.0018].
Figure 2—figure supplement 1
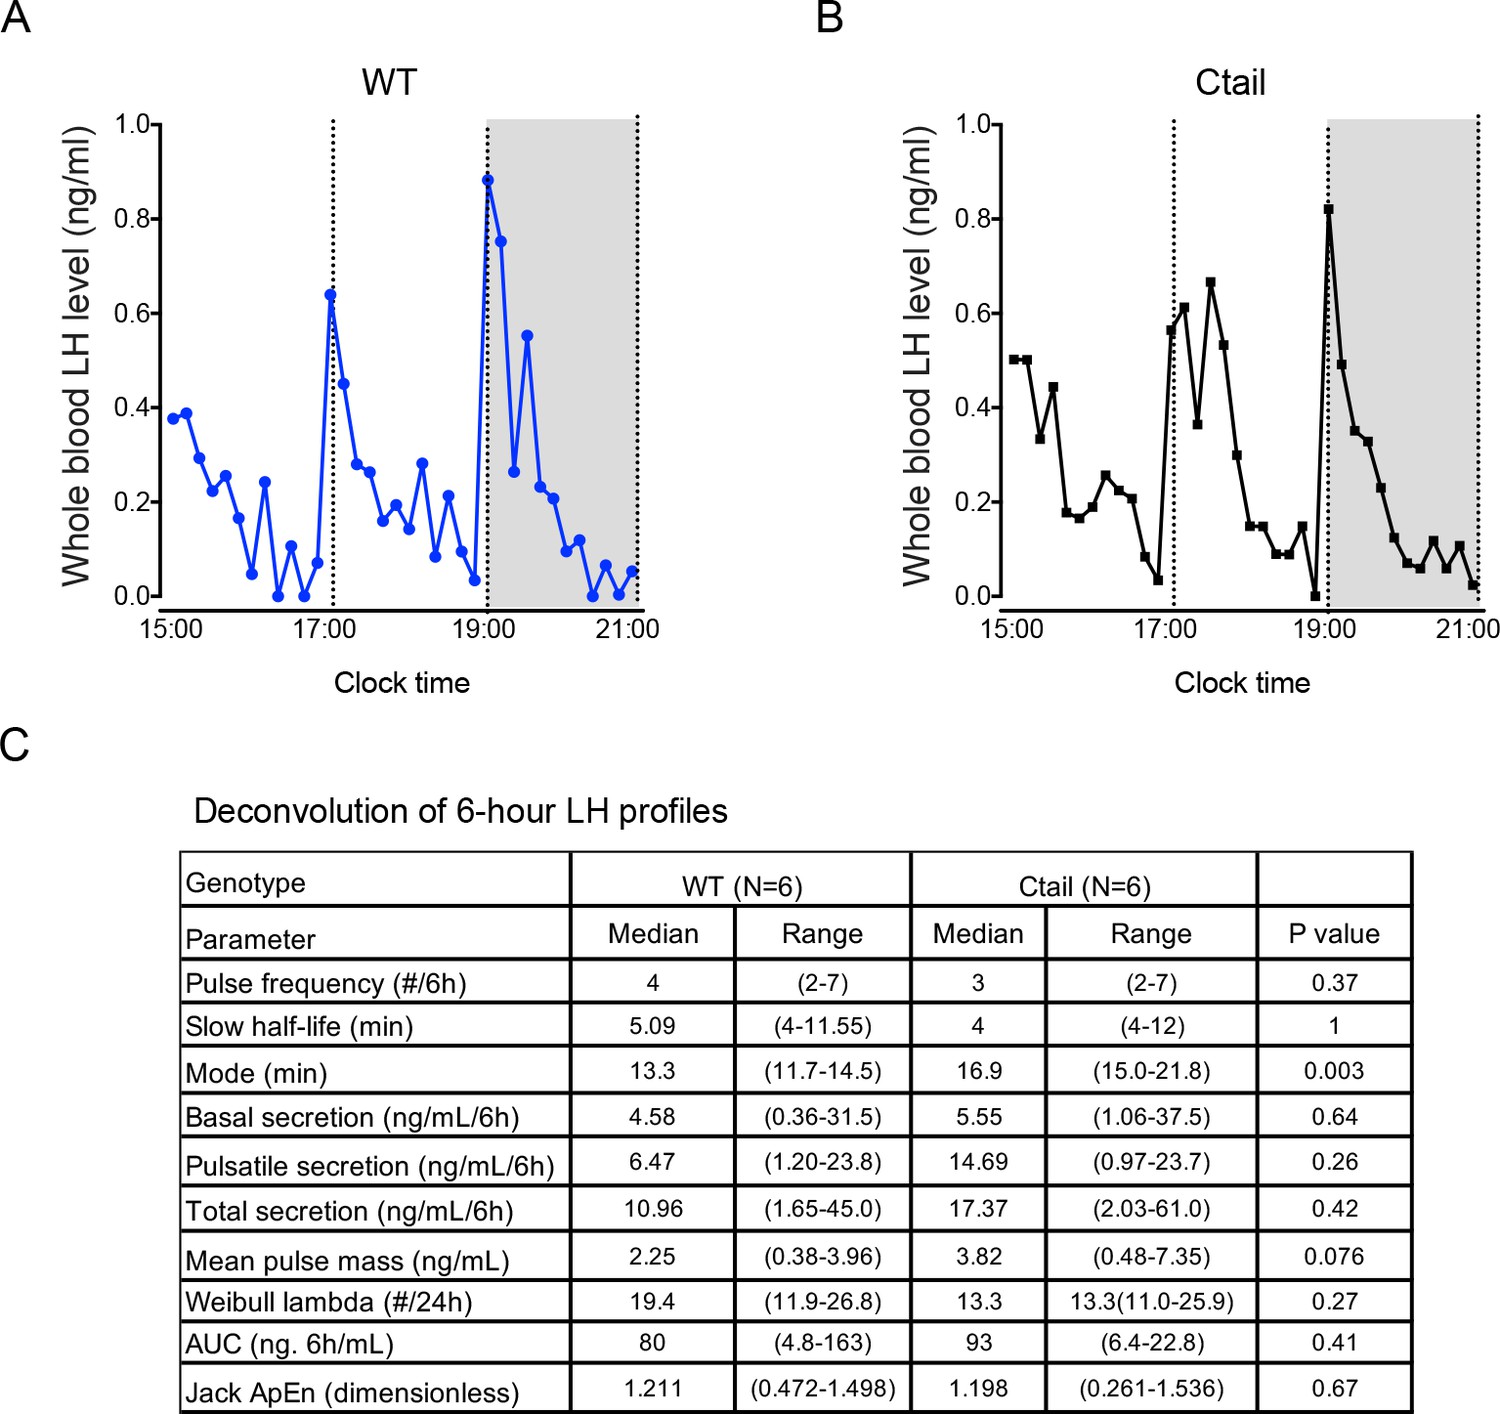
Normal luteinizing hormone (LH) pulse frequency in male Ctail mice.
Representative profiles of LH secretion from male (A) wild-type (WT; blue) and (B) Ctail mice (black). Gray area represents the dark period of a 7 am/7 pm light/dark cycle. Mice were sampled every 10 min over 6 hr. (C) Deconvolution analysis of LH release profiles over 6 hr from WT and Ctail mice (N = 6 per genotype). Student’s t-tests were performed for statistical analysis. Whole blood LH levels were measured using an in-house LH ELISA.
Figure 3

Pituitary gonadotropin subunit and Gnrhr mRNA levels are regulated by genotype and gonadal status.
Relative pituitary (A, E) Fshb, (B, F) Lhb, (C, G) Cga, and (D, H) Gnrhr mRNA levels in the mice from Figure 2 were measured by RT-qPCR. Gene expression was normalized to the reference gene ribosomal protein L19 (Rpl19). In each panel, the bar height reflects the group mean and dots and squares reflect individual animals. Statistical analyses were performed using two-way analysis of variance (ANOVA) tests, followed by Tukey’s multiple comparison test. Bars with different letters differed significantly [female Fshb: wild-type (WT; sham) vs. Ctail (sham) p = 0.99; WT (sham) vs. WT (OVX) p < 0.0001; Ctail (sham) vs. Ctail (OVX) p = 0.0002; WT (OVX) vs. Ctail (OVX) p = 0.1057]. Female Lhb: WT (sham) vs. Ctail (sham) p = 0.9989; WT (sham) vs. WT (OVX) p < 0.0001; Ctail (sham) vs. Ctail (OVX) p = 0.0033; WT (OVX) vs. Ctail (OVX) p = 0.0267. Female Cga: WT (sham) vs. Ctail (sham) p = 0.9893; WT (sham) vs. WT (OVX) p < 0.0001; Ctail (sham) vs. Ctail (OVX) p = 0.0016; WT (OVX) vs. Ctail (OVX) p = 0.0138. Female Gnrhr: WT (sham) vs. Ctail (sham) p < 0.0001; WT (sham) vs. WT (OVX) p = 0.1332; Ctail (sham) vs. Ctail (OVX) p = 0.8731; WT (OVX) vs. Ctail (OVX) p = 0.1922. Male Fshb: WT (sham) vs. Ctail (sham) p = 0.0468; WT (sham) vs. WT (Cast) p = 0.0019; Ctail (sham) vs. Ctail (Cast) p = 0.1103; WT (Cast) vs. Ctail (Cast) p = 0.0109. Male Lhb: WT (sham) vs. Ctail (sham) p = 0.9345; WT (sham) vs. WT (Cast) p < 0.0001; Ctail (sham) vs. Ctail (Cast) p = 0.4394; WT (Cast) vs. Ctail (Cast) p = 0.0266. Male Cga: WT (sham) vs. Ctail (sham) p = 0.8192; WT (sham) vs. WT (Cast) p = 0.0013; Ctail (sham) vs. Ctail (Cast) p = 0.9772; WT (Cast) vs. Ctail (Cast) p = 0.0005. Male Gnrhr: WT (sham) vs. Ctail (sham) p = 0.0029; WT (sham) vs. WT (Cast) p = 0.6634; Ctail (sham) vs. Ctail (Cast) p > 0.9999; WT (Cast) vs. Ctail (Cast) p = 0.5638.
Figure 4 with 1 supplement
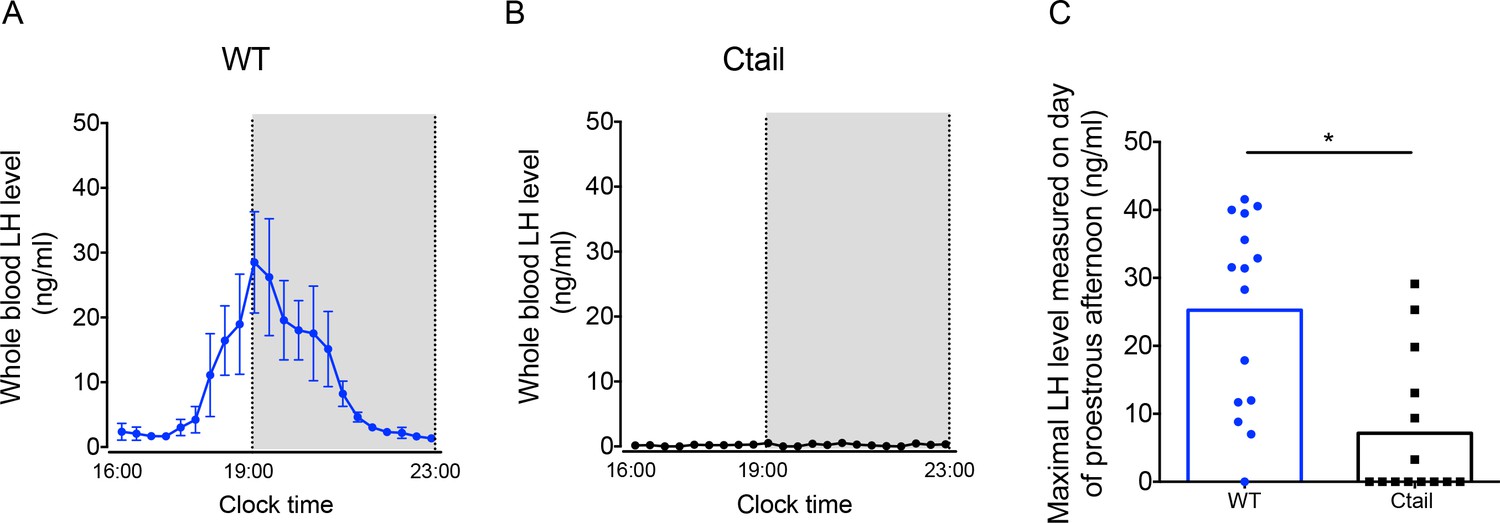
Luteinizing hormone (LH) surge amplitude is attenuated in Ctail females.
(A) Preovulatory LH surge profiles in wild-type (WT; N = 5) and (B) Ctail females (N = 5) on proestrus, as identified by vaginal cytology. Blood samples were collected every 20 min from 4:00 pm (16:00) to 11:00 pm (23:00). Gray areas represent the dark phase of the light/dark cycle. (C) Maximal LH levels measured on proestrus from WT and Ctail females sampled four times daily for 11 days (see Methods). LH levels were measured in whole blood by with an in-house ELISA. In panels A and B, each dot reflects the group mean ± standard error of the mean (SEM). In C, the bar height reflects the group mean and dots and squares reflect individual animals. A Student t-test was performed for statistical analysis, *p = 0.0006.
Figure 4—figure supplement 1
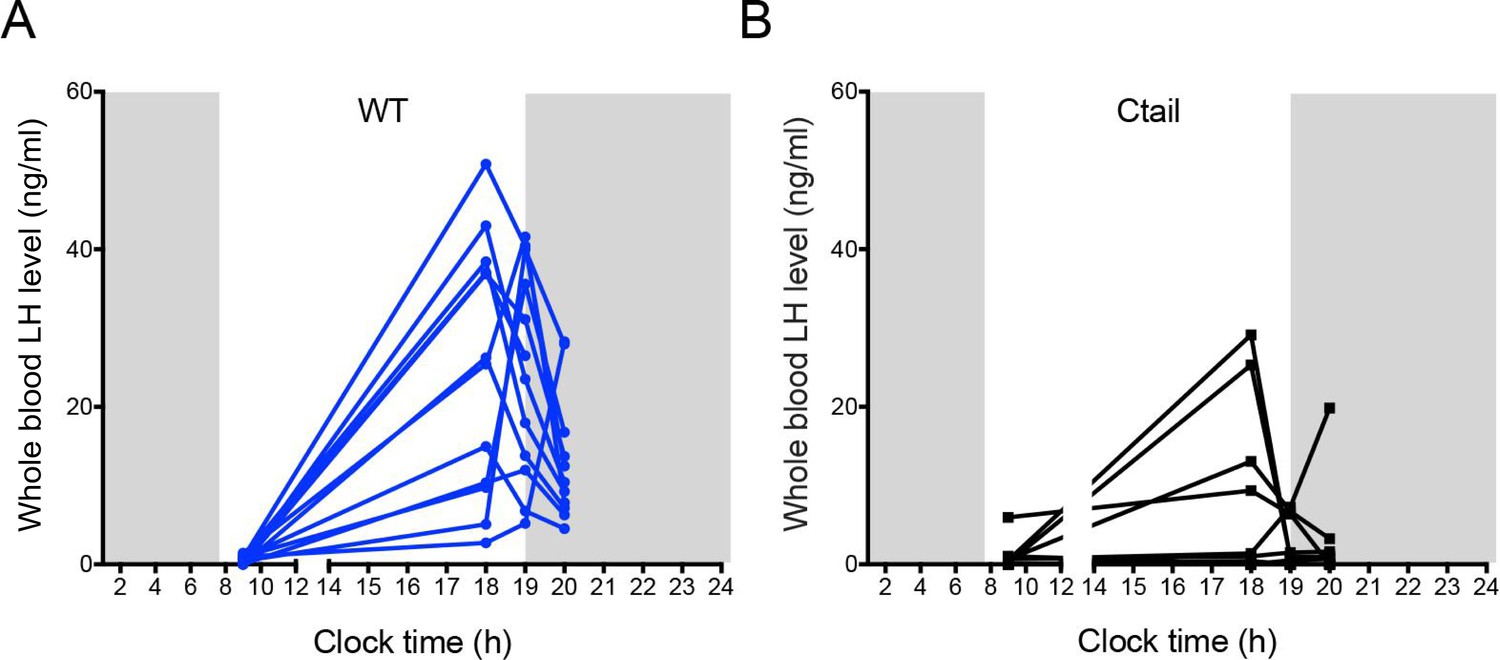
Ctail females exhibit altered luteinizing hormone (LH) surges.
Whole blood LH levels measured at four different time points (10 am, and 6, 7, and 8 pm) on proestrus in (A) wild-type (WT) and (B) Ctail females. Each line reflects an individual mouse and data are only shown from mice that surged. The peak LH values from this analysis are used in Figure 4C.
Figure 5
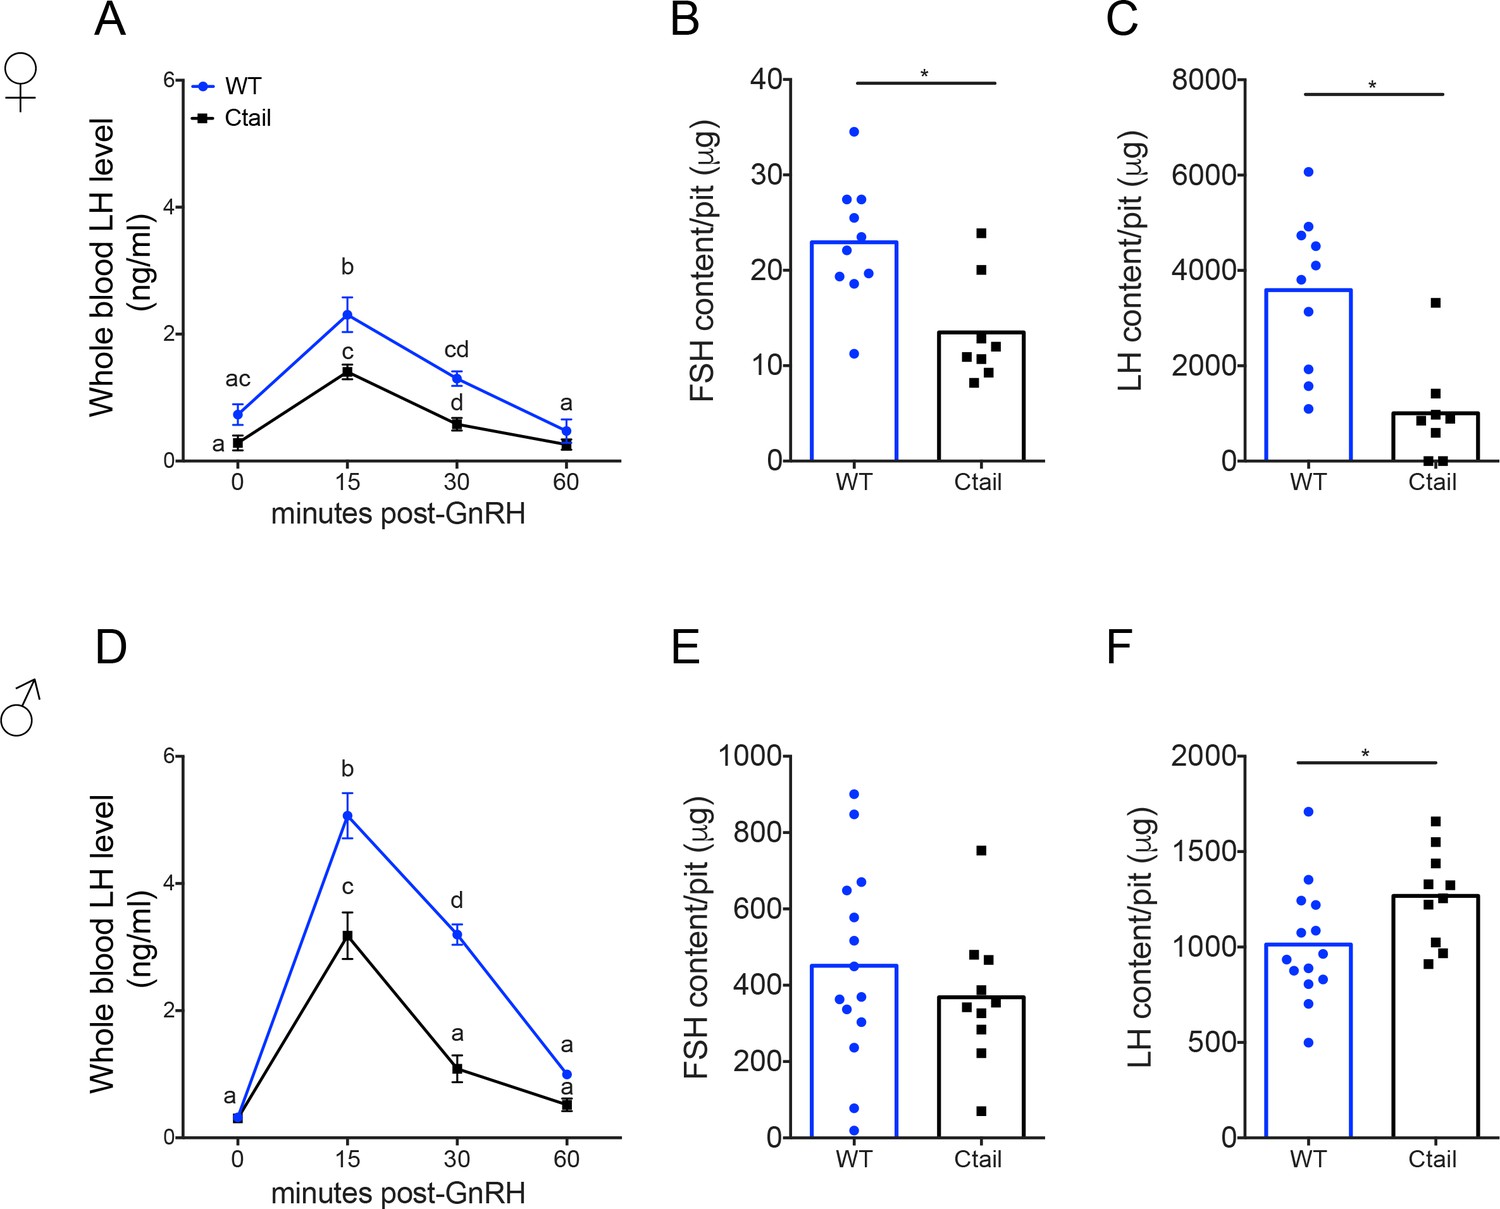
Gonadotropin-releasing hormone (GnRH)-stimulated luteinizing hormone (LH) release is attenuated in Ctail mice.
Whole blood LH levels in 10- to 12-week-old (A) female and (D) male wild-type (WT; blue, N = 12 females and N = 14 males) and Ctail (black, N = 9 for females and N = 11 for males) mice before (0) and 15-, 30-, and 60-min post-i.p. injection of 1.25 ng of GnRH per g of body mass. Each point is the mean ± standard error of the mean (SEM). Data were analyzed using two-way analyses of variance (ANOVAs), followed by Tukey’s post hoc tests for multiple comparisons. Points with different letters differ significantly (females WT vs. Ctail: 0 min p = 0.0514; 15 min p = 0.0139; 30 min p = 0.0002, 60 min p = 0.3536; males WT vs. Ctail: 0 min p = 0.959653; 15 min p < 0.0001; 30 min p < 0.0001, 60 min p = 0.1112). Intrapituitary contents of (B, E) follicle-stimulating hormone (FSH) and (C, F) LH in randomly cycling (B, C) female and (E, F) male WT and Ctail mice. The bar height reflects the group mean and dots and squares reflect individual animals. Data were analyzed by Student’s t-tests (B, *p = 0.0043; C, *p = 0.0122; E, *p = 0.3977; F, *p = 0.0394). FSH levels were measured using a Luminex assay in females and by RIA in males. LH levels were measured with the in-house ELISA in both sexes.
Figure 6 with 1 supplement
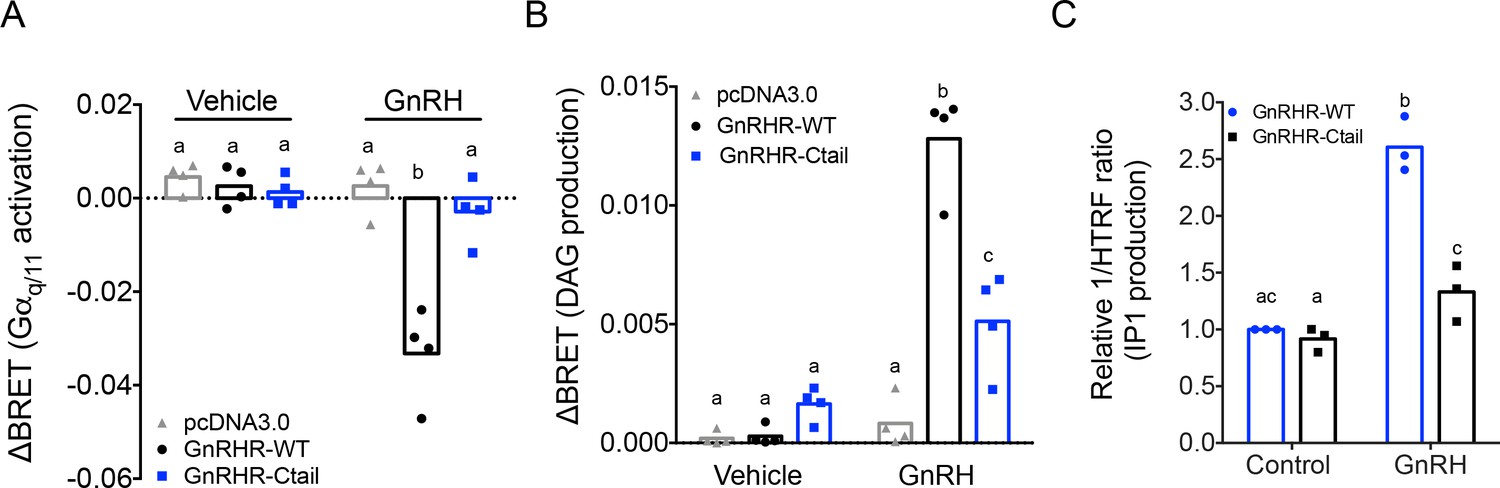
Gonadotropin-releasing hormone (GnRH) activation of Gq, diacylglycerol, and inositol phosphate via GnRHR-Ctail is impaired in heterologous cells.
HEK 293 cells were transfected with empty vector (pcDNA3.0), GnRH-WT, or GnRHR-Ctail with (A) Gq or (B) DAG BRET-based biosensors. Cells were loaded with Coelenterazine 400a for 5 min, and luminescence values recorded 10 s before and 30-s post-treatment with vehicle (water) or 100 nM GnRH. ΔBRET values were calculated as the average of BRET values before treatment minus the average values post-treatment. Data are shown from four independent experiments. Bar heights reflect group means. (C) HEK 293 cells were transfected with GnRHR-WT or GnRHR-Ctail. Cells were treated with vehicle or 100 nM GnRH for 30 min. IP1 production was measured and reported as represented as the inverse of the Homogeneous Time-Resolved Fluorescence (HTRF) ratio relative to control condition. Data are shown from three independent experiments. Bar heights reflect group means. In all panels, two-way analyses of variance (ANOVAs) followed by Tukey’s multiple comparison test was used for statistical analysis. Different letters indicate statistically significant differences. In (A), untreated vs. treated with GnRH: pcDNA3.0 p = 0.9969; GnRHR-WT p < 0.0001; and GnRHR-Ctail p = 0.9093. In GnRH-treated conditions: pcDNA3.0 vs. GnRHR-WT p < 0.0001; pcDNA3.0 vs. GnRHR-Ctail p = 0.7775, and GnRHR-WT vs. GnRHR-Ctail p < 0.000, and in (B), untreated vs. treated with GnRH: pcDNA3.0 p = 0.9838; GnRHR-WT p < 0.0001 and GnRHR-Ctail p = 0.0180. In GnRH-treated conditions: pcDNA3.0 vs. GnRHR-WT p < 0.0001; pcDNA3.0 vs. GnRHR-Ctail p = 0.0029, and GnRHR-WT vs. GnRHR-Ctail p < 0.0001. In (C), GnRHR-WT (control) vs. GnRHR-Ctail (control) p = 0.6321; GnRHR-WT (control) vs. GnRHR-WT (GnRH) p = 0.0004; GnRHR-Ctail (control) vs. GnRHR-Ctail (GnRH) p = 0.0170; GnRHR-WT (GnRH) vs. GnRHR-Ctail (GnRH) p = 0.0073.
Figure 6—figure supplement 1
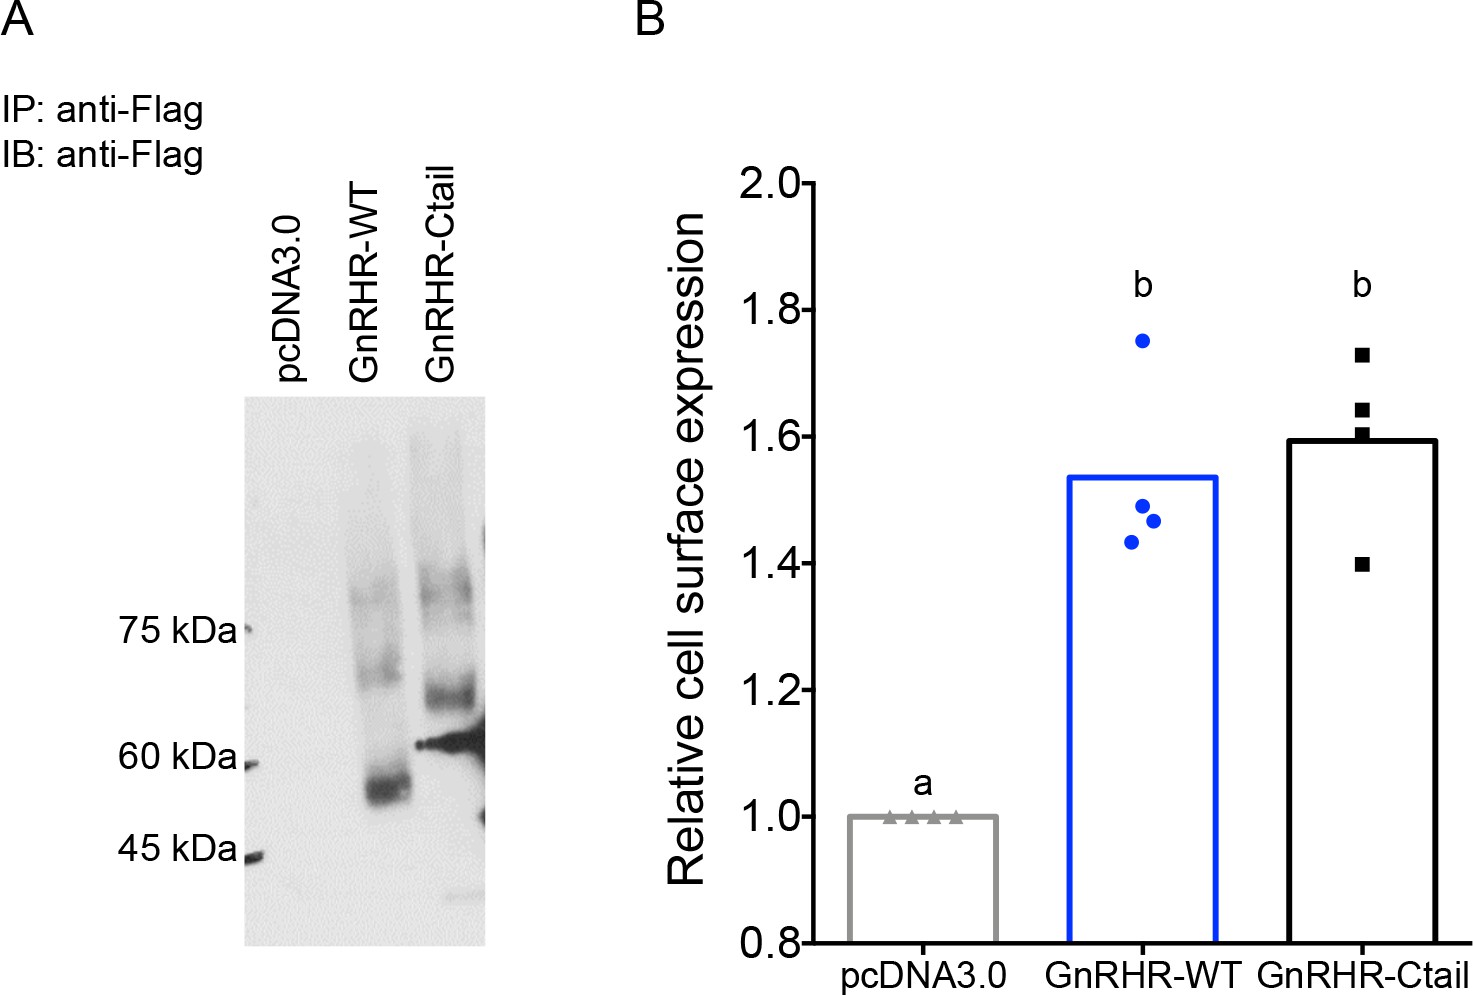
Cell surface expression of wild-type (WT) and Ctail receptors is comparable in HEK 293T cells.
(A) HEK 293T cells were transfected with either flag-tagged GnRHR-WT or GnRHR-Ctail expression vector, or empty vector (pcDNA3.0) as control. Cell lysates were collected and immunoprecipitated (IP) using anti-Flag beads. Precipitates were than subjected to immunoblot (IB) using an anti-Flag antibody. The blot is from an individual experiment. (B) Whole cell anti-Flag ELISA performed on nonpermeabilized HEK 293T cells expressing either GnRHR-WT or GnRHR-Ctail. pcDNA3.0 was used as a negative control. Cell surface receptor expression was quantified by dividing the OD450 for each receptor by the OD450 for pcDNA3.0. Data are shown from four independent experiments, with the bar height reflecting the group mean. Statistical analysis was performed using one-way analysis of variance (ANOVA), followed by Tukey’s post hoc comparison. Bars with different letters differed significantly. pcDNA3.0 vs. GnRHR-WT p = 0.0020; pcDNA3.0 vs. GnRHR-Ctail p = 0.0013; GnRHR-WT vs. GnRHR-Ctail p = 0.9495.
-
Figure 6—figure supplement 1—source data 1
Source data for Figure 6—figure supplement 1A.
- https://cdn.elifesciences.org/articles/72937/elife-72937-fig6-figsupp1-data1-v2.zip
Figure 7 with 2 supplements
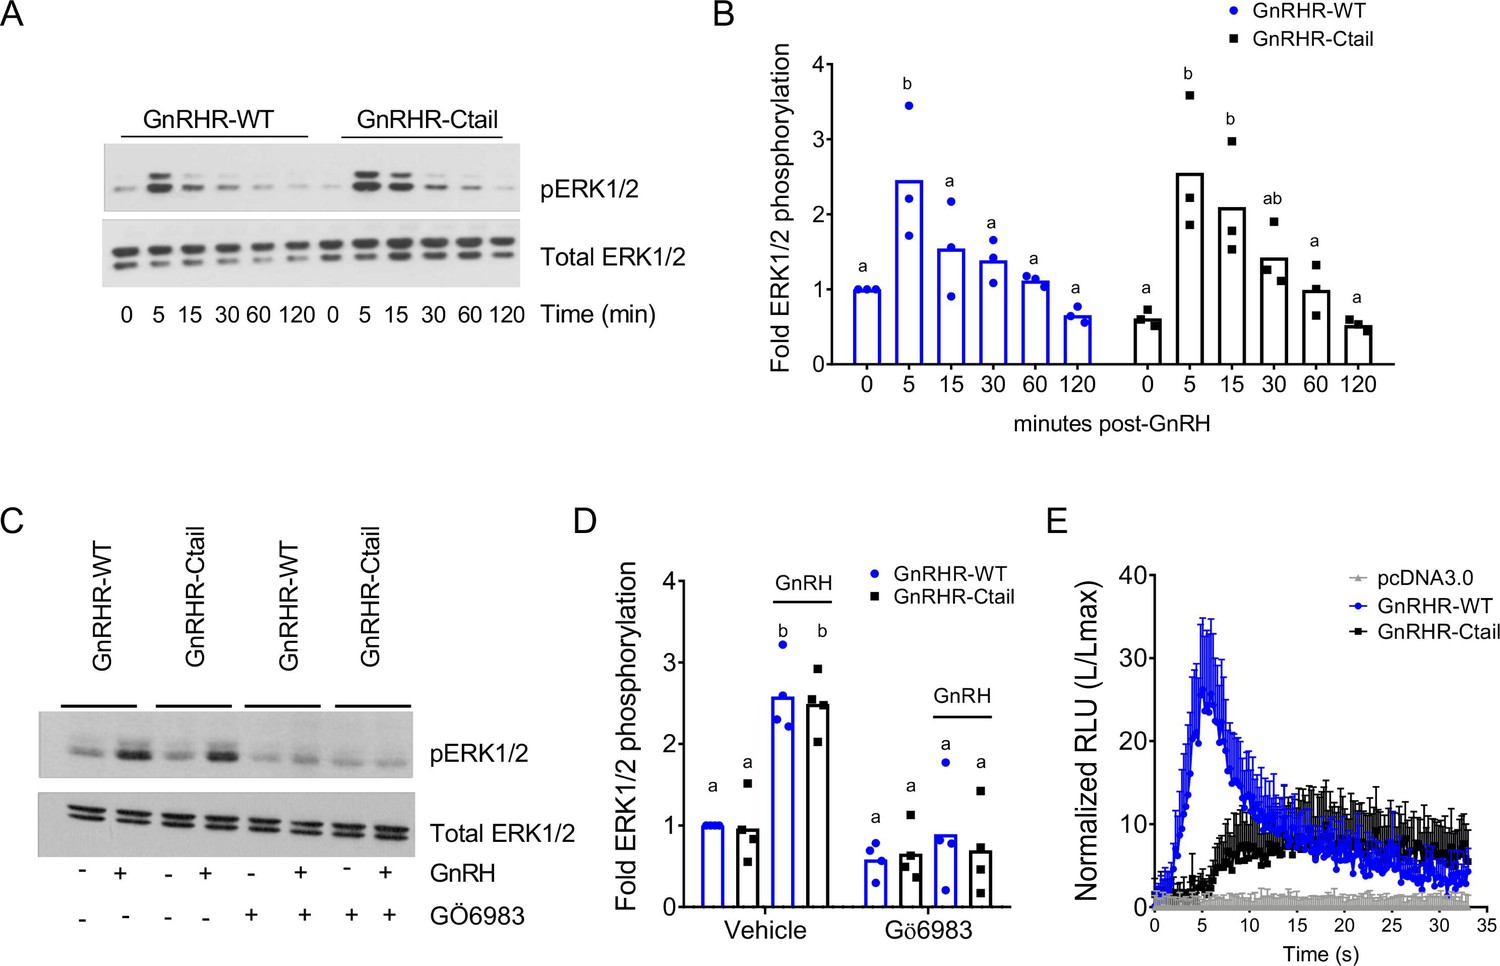
Gonadotropin-releasing hormone (GnRH)-stimulated intracellular calcium mobilization, but not ERK1/2 phosphorylation, is attenuated via GnRH-Ctail in heterologous cells.
(A) HEK 293 cells were transfected with GnRH-WT or GnRHR-Ctail. Twenty-four hours post-transfection, cells were treated with vehicle (water; 0) as control or 100 nM GnRH for 5, 15, 30, 60, and 120 min. Whole cell protein lysates were collected and subjected to sodium dodecyl sulphate–polyacrylamide gel electrophoresis (SDS–PAGE) and western blotting with phospho- (top) or total (bottom) ERK1/2 antibodies. Blots from 1 of 3 replicate experiments are shown. (B) Data from the three independent experiments exemplified in panel A were quantified by normalizing the densitometry for pERK1/2 to total ERK1/2 and are presented relative to the control condition of the WT receptor. Two-way analysis of variance (ANOVA) followed by Tukey’s multiple comparison test was used for statistical analysis. Bars with different letters differed significantly. GnRH-WT: 0 vs. 5 min p = 0.0179; 0 vs. 15 min p = 0.7673; 0 vs. 30 min p = 0.9309; 0 vs. 120 min p = 0.9572; GnRH-Ctail: 0 vs. 5 min p = 0.0010; 0 vs. 15 min p = 0.0156; 0 vs. 30 min p = 0.3846; 0 vs. 120 min p > 0.9999. (C) HEK 293 cells were transfected with GnRH-WT or GnRHR-Ctail. Twenty-four-hour post-transfection, cells were pretreated with 5 µM pan-PKC inhibitor GÖ6983 for 20 min, and then treated with vehicle (water) or 100 nM GnRH for 5 min. Western blotting was performed as in panel A. One blot from four independent experiments is presented. (D) Data from the four independent experiments exemplified in panel C were quantified and statistically analyzed as in panel B. In GnRH-treated conditions: GnRHR-WT (vehicle) vs. GnRHR-Ctail (vehicle) p > 0.9999; GnRHR-WT (Gö6983) vs. GnRHR-Ctail (Gö6983) p = 0.9969; GnRHR-WT (vehicle) vs. GnRHR-WT (Gö6983) p = 0.0001; GnRHR-Ctail (vehicle) vs. GnRHR-Ctail (Gö6983) p < 0.0001. (E) HEK 293 cells were transfected with GnRHR-WT, GnRHR-Ctail, or empty vector (pcDNA3.0) along with the luminescence Obelin biosensor. Twenty-four-hour post-transfection, cells were loaded with Coelenterazine cp for 2 hr. Cells were then treated with 100 nM GnRH. Intracellular Ca2+ was measured as relative luminescence emitted every 22 ms over 0.5 min. Data are presented as the ratio of total luminescence after GnRH over maximal luminescence (not shown) following Triton X-100 treatment from three independent experiments (mean ± standard error of the mean [SEM]).
-
Figure 7—source data 1
Source data for Figure 7A.
- https://cdn.elifesciences.org/articles/72937/elife-72937-fig7-data1-v2.zip
-
Figure 7—source data 2
Source data for Figure 7C.
- https://cdn.elifesciences.org/articles/72937/elife-72937-fig7-data2-v2.zip
Figure 7—figure supplement 1
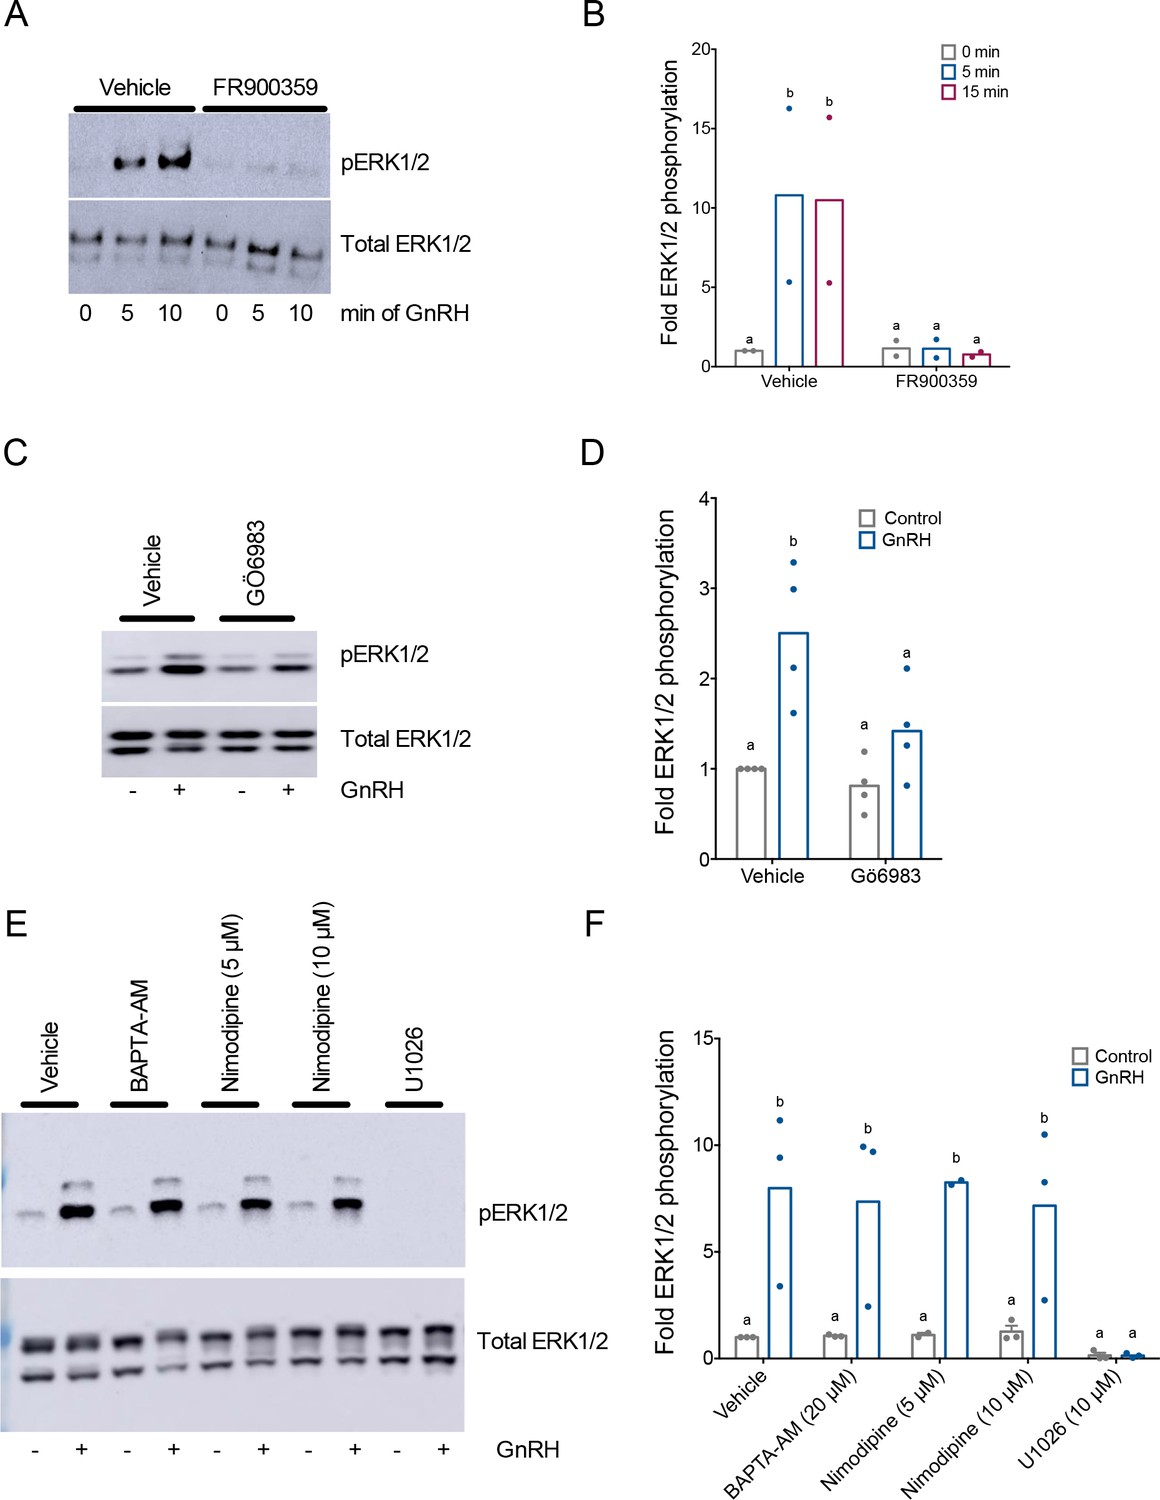
Gonadotropin-releasing hormone (GnRH)-induced ERK1/2 phosphorylation is Gαq/11 and protein kinase C (PKC) dependent, and calcium independent in homologous LβT2 cells.
(A) LβT2 cells were pretreated with 10 µM FR900359 (Gαq/11 inhibitor) or vehicle (dimethyl sulfoxide, DMSO) for 1 hr, and then treated with vehicle (water) or 10 nM GnRH for 5 or 15 min. Whole cell protein lysates were collected and subjected to sodium dodecyl sulphate–polyacrylamide gel electrophoresis (SDS–PAGE) and western blotting with phospho- (top) or total (bottom) ERK1/2 antibodies. Blots from one of two replicate experiments are shown. (B) Data from independent duplicate experiments exemplified in panel A were quantified by normalizing the densitometry for the pERK1/2 bands to the total ERK1/2 bands. Data are presented as fold phospho-ERK1/2 relative to the control condition. Bar height reflects the group mean. Data were analyzed by two-way analysis of variance (ANOVA), followed by Sidak’s post hoc comparison tests. Bars with different letters differed significantly. Vehicle vs. FR900359: 0 min GnRH p > 0.9999; 5 min GnRH p = 0.0106; 15 min GnRH p = 0.0085. (C) LβT2 cells were pretreated for 20 min with vehicle (dimethyl sulfoxide, DMSO) or 5 µM Gö6983 for 20 min followed by treatment with vehicle (water) or 10 nM GnRH for 5 min. Western blots were performed as in panel A. (D) Data from three independent experiments in exemplified panel C were presented and quantified as in panel B. Data were analyzed by two-way ANOVA, followed by Sidak’s post hoc comparison tests. Bars with different letters differed significantly. Control (vehicle) vs. GnRH (vehicle) p = 0.0048; Control (Gö6983) vs. GnRH (Gö6983) p = 0.3470. Control (vehicle) vs. Control (Gö6983) p = 0.9472; GnRH (vehicle) vs. GnRH (Gö6983) p = 0.0389. (E) LβT2 cells were pretreated for 20 min with vehicle (dimethyl sulfoxide, DMSO), 20 µM BAPTA-AM, 5 µM or 10 µM nimodipine, or 10 µM U0126 for 20 min followed by vehicle (water) or 10 nM GnRH for 5 min. Western blots were performed as in panel A. (F) Data from three independent experiments in panel E were presented and quantified as in panel B. Data were analyzed by two-way ANOVA, followed by Sidak’s post hoc comparison tests. Bars with different letters differed significantly. Control vs. GnRH: Vehicle p = 0.0103; BAPTA-AM p = 0.0229; Nimodipine (5 µM) p = 0.0377; Nimodipine (10 µM) p = 0.0350; U1026 p > 0.9999.
-
Figure 7—figure supplement 1—source data 1
Source data for Figure 7—figure supplement 1A.
- https://cdn.elifesciences.org/articles/72937/elife-72937-fig7-figsupp1-data1-v2.zip
-
Figure 7—figure supplement 1—source data 2
Source data for Figure 7—figure supplement 1C.
- https://cdn.elifesciences.org/articles/72937/elife-72937-fig7-figsupp1-data2-v2.zip
-
Figure 7—figure supplement 1—source data 3
Source data for Figure 7—figure supplement 1E.
- https://cdn.elifesciences.org/articles/72937/elife-72937-fig7-figsupp1-data3-v2.zip
Figure 7—figure supplement 2
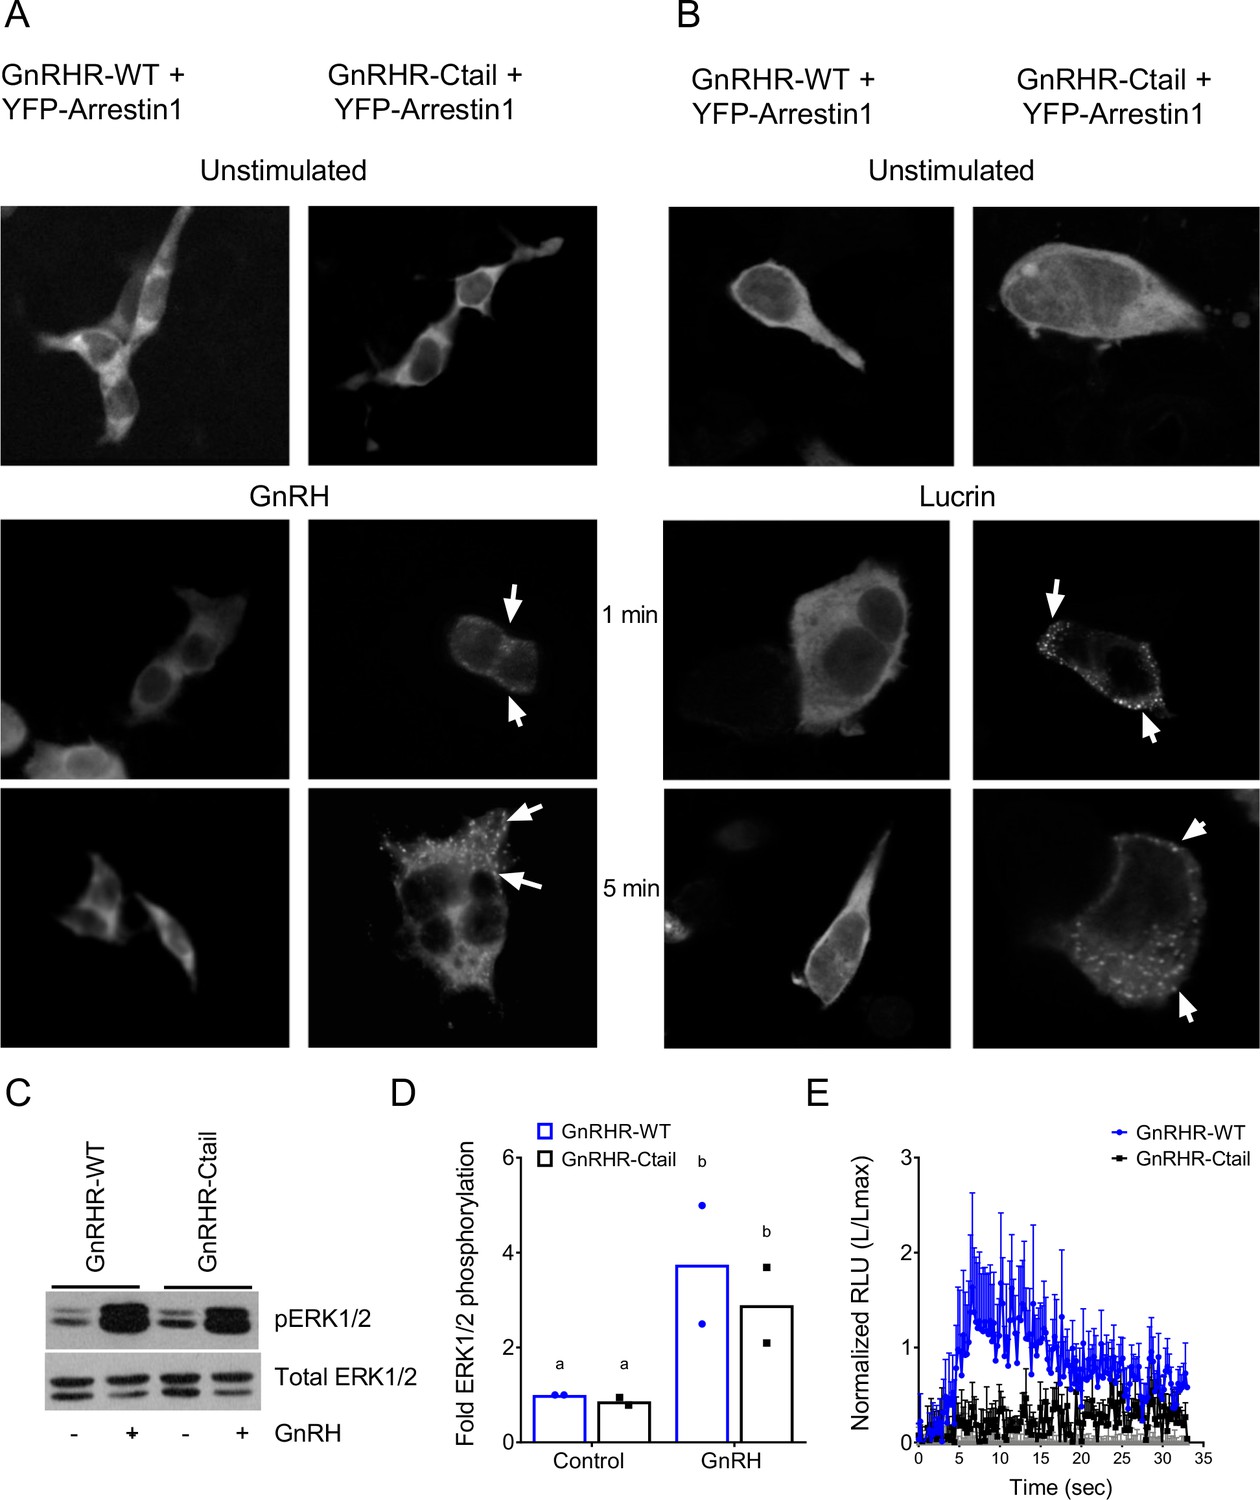
Gonadotropin-releasing hormone (GnRH)-induced pERK1/2 and calcium mobilization via GnRHR-Ctail are β-arrestin independent.
(A, B) HEK 293 cells were transfected with expression vectors for GnRHR-WT or GnRHR-Ctail along with YFP-β-arrestin-1. Cells were either left unstimulated or were treated with (A) 100 nM GnRH or (B) 1 µM Lucrin for 1 or 5 min. Cells were then fixed and imaged on a fluorescence microscope. Puncta at the cell membrane (white arrows) indicate the recruitment of β-arrestin-1. (C) β-Arrestin-1/2 knockout (Arr1;Arr2 KO) HEK 293T cells were transfected with GnRH-WT or GnRH-Ctail and treated with vehicle (water) or 100 nM GnRH for 5 min. Whole cell lysates were collected and subjected to western blotting for pERK1/2 and total ERK1/2 as in Figure 7—figure supplement 1. (D) Data from two independent experiments exemplified in panel C were quantified and analyzed as in Figure 7—figure supplement 1. Data are presented as fold phospho-ERK1/2 relative to the control condition. Data were analyzed by two-way analysis of variance (ANOVA), followed by Sidak’s post hoc comparison tests. Bars with different letters differed significantly. GnRHR-WT (control) vs. GnRHR-Ctail (control) p = 0.9178; GnRHR-WT (control) vs. GnRHR-WT (GnRH) p = 0.0115; GnRHR-Ctail (control) vs. GnRHR-Ctail (GnRH) p = 0.0334; GnRHR-WT (GnRH) vs. GnRHR-Ctail (GnRH) p = 0.2502. (E) β-Arrestin-1/2 KO HEK 293 cells were cotransfected with pcDNA3.0 (gray), GnRHR-WT (blue), or GnRHR-Ctail (black) expression vector and the Obelin biosensor. Cells were then treated with 100 nM GnRH. Luminescence was measured for 30 s at 22-ms intervals. Data from three independent experiments (mean ± standard error of the mean [SEM]) are represented as the ratio of total luminescence after ligand injection over maximal luminescence (not shown) following Triton X-100 injection.
-
Figure 7—figure supplement 2—source data 1
Source data for Figure 7—figure supplement 2A.
- https://cdn.elifesciences.org/articles/72937/elife-72937-fig7-figsupp2-data1-v2.zip
Figure 8 with 2 supplements

Gonadotropin-releasing hormone (GnRH)-stimulated calcium responses are altered in gonadotropes of Ctail mice.
Raster plots of calcium responses in gonadotropes from a representative adult male (A) wild-type (WT) and (F) Ctail mouse. Each row represents an individual cell. Cells are numbered on the y-axis. The x-axis shows time in seconds. The timing of GnRH administration is indicated. The heatmap at the top shows the strength of the response, with yellower colors reflecting stronger calcium responses. Examples of calcium responses in individual gonadotropes from (B–E) WT and (G–J) Ctail mice. (K) Area under the curve (AUC) and (L) maximum intensity of fluorescence (MIF) were quantified (N = 3 WT and N = 8 Ctail). (M) Numbers of oscillatory peaks were also quantified (p < 0.0001; N = 3 [710 cells] WT and N = 8 [534 cells] Ctail). (N) Correlation between AUC vs. MIF measurements from one mouse per genotype (250 cells of WT and 128 cells of Ctail). (O) Comparison of the calcium pattern of response (N = 3 WT and N = 8 Ctail): oscillatory (O) (73.223 ± 7.489 vs. 21.037 ± 10.262; WT vs. Ctail, respectively, p = 0.0121); biphasic (B) (18.388 ± 8.885 vs. 10.430 ± 6.075; WT vs. Ctail, respectively, p = ns); extended biphasic (EB) (0.419 ± 0.307 vs. 21.444 ± 19.528; WT vs. Ctail, respectively, p = 0.0167); and extended oscillatory (EO) (7.969 ± 1.497 vs. 53.036 ± 14.069; WT vs. Ctail, respectively, p = 0.0167). Statistical analyses were performed using Wilcoxon rank-sum tests. *, significantly different.
Figure 8—figure supplement 1
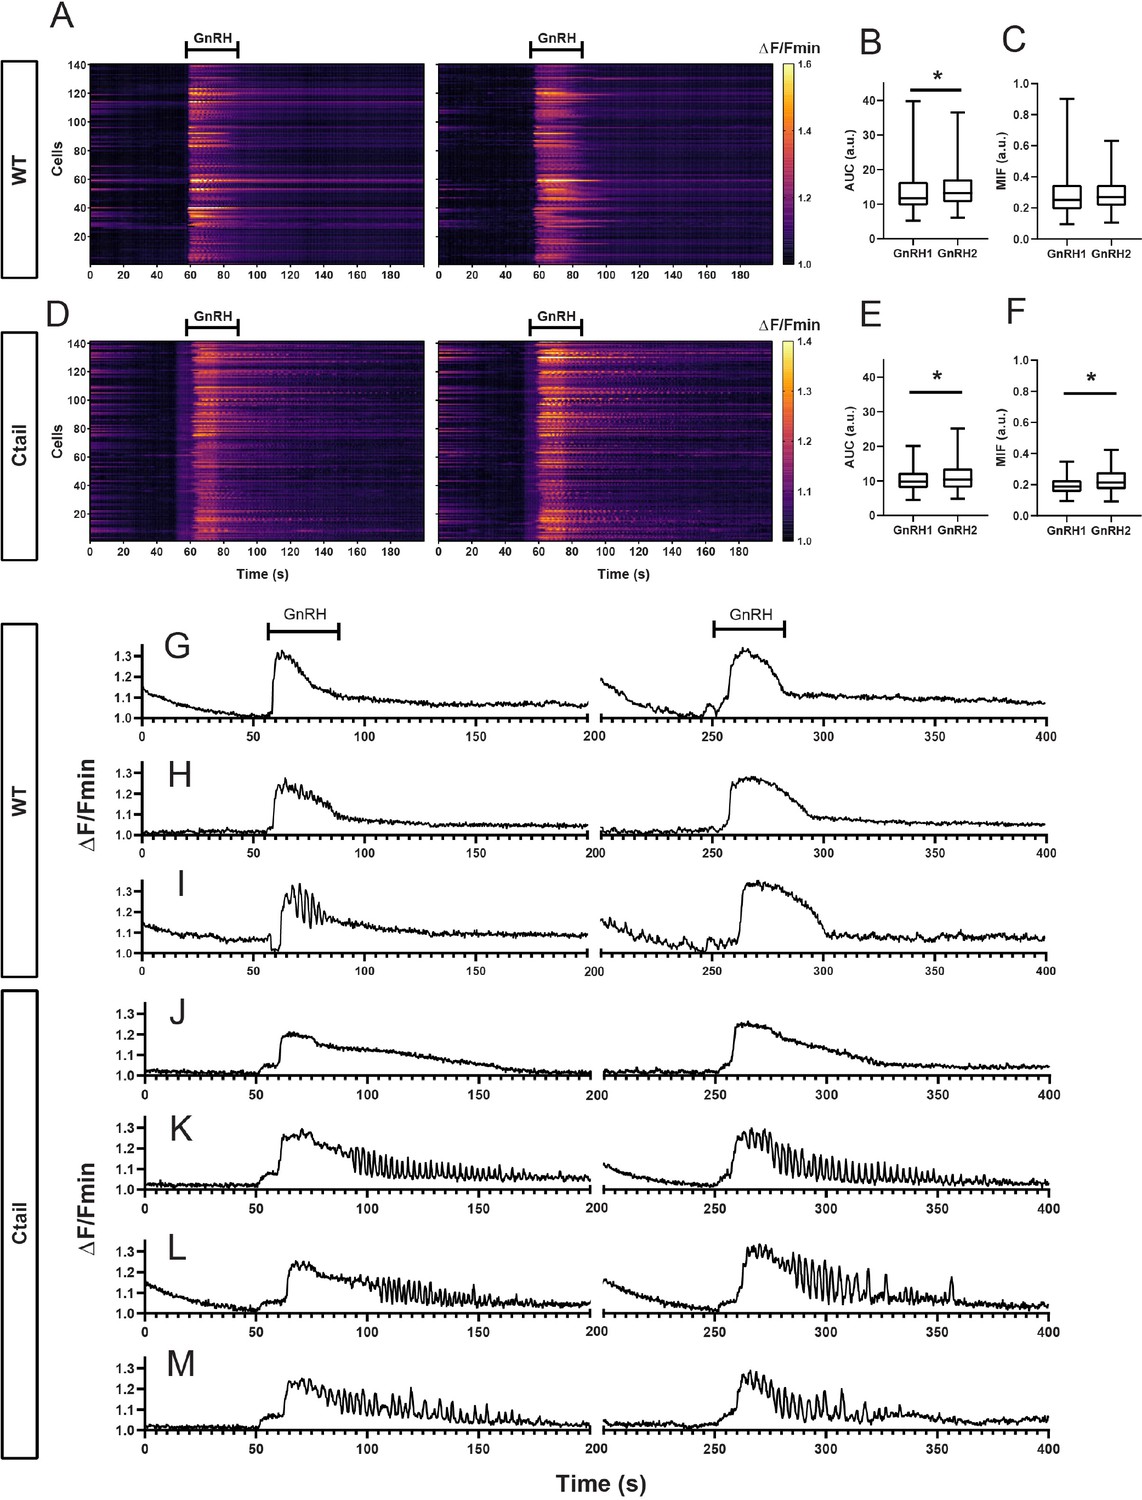
Gonadotropes of wild-type (WT) and Ctail mice respond to repeated gonadotropin-releasing hormone (GnRH) pulses.
Raster plots of calcium responses to first (left) and second (right) GnRH pulses in gonadotropes from a representative adult male (A) WT and (D) Ctail mouse. Each row represents an individual cell. Cells are numbered on the y-axis. The x-axis shows time in seconds. The timing of the two GnRH pulses is indicated. Pulses were separated by 60 min. The yellower colors reflect calcium responses. (B) Comparison of the area under the curve (AUC) after each GnRH stimulus from one WT mouse (201 cells; 13.536 ± 6.093 vs. 14.241 ± 4.876 a.u. for GnRH1 and GnRH2, respectively; p = 0.0095). (C) Comparison of the MIF after each GnRH stimulus from one WT mouse (201 cells; 0.285 ± 0.138 vs. 0.281 ± 0.088 a.u. for GnRH1 and GnRH2, respectively; p = ns). (E) Comparison of the AUC after two GnRH pulses from one Ctail mouse (141 cells; 10.242 ± 3.151 vs. 11.173 ± 4.031 a.u. for GnRH1 and GnRH2, respectively; p = ns). (F) Comparison of the MIF after the two GnRH pulses from one Ctail mouse (141 cells; 0.196 ± 0.054 vs. 0.225 ± 0.076 a.u. for GnRH1 and GnRH2, respectively; p = 0.0020). Examples of calcium responses in individual gonadotropes from (G–I) WT and (J–M) Ctail mice. Statistical analyses were performed using Wilcoxon signed-rank tests. *, significantly different.
Figure 8—figure supplement 2
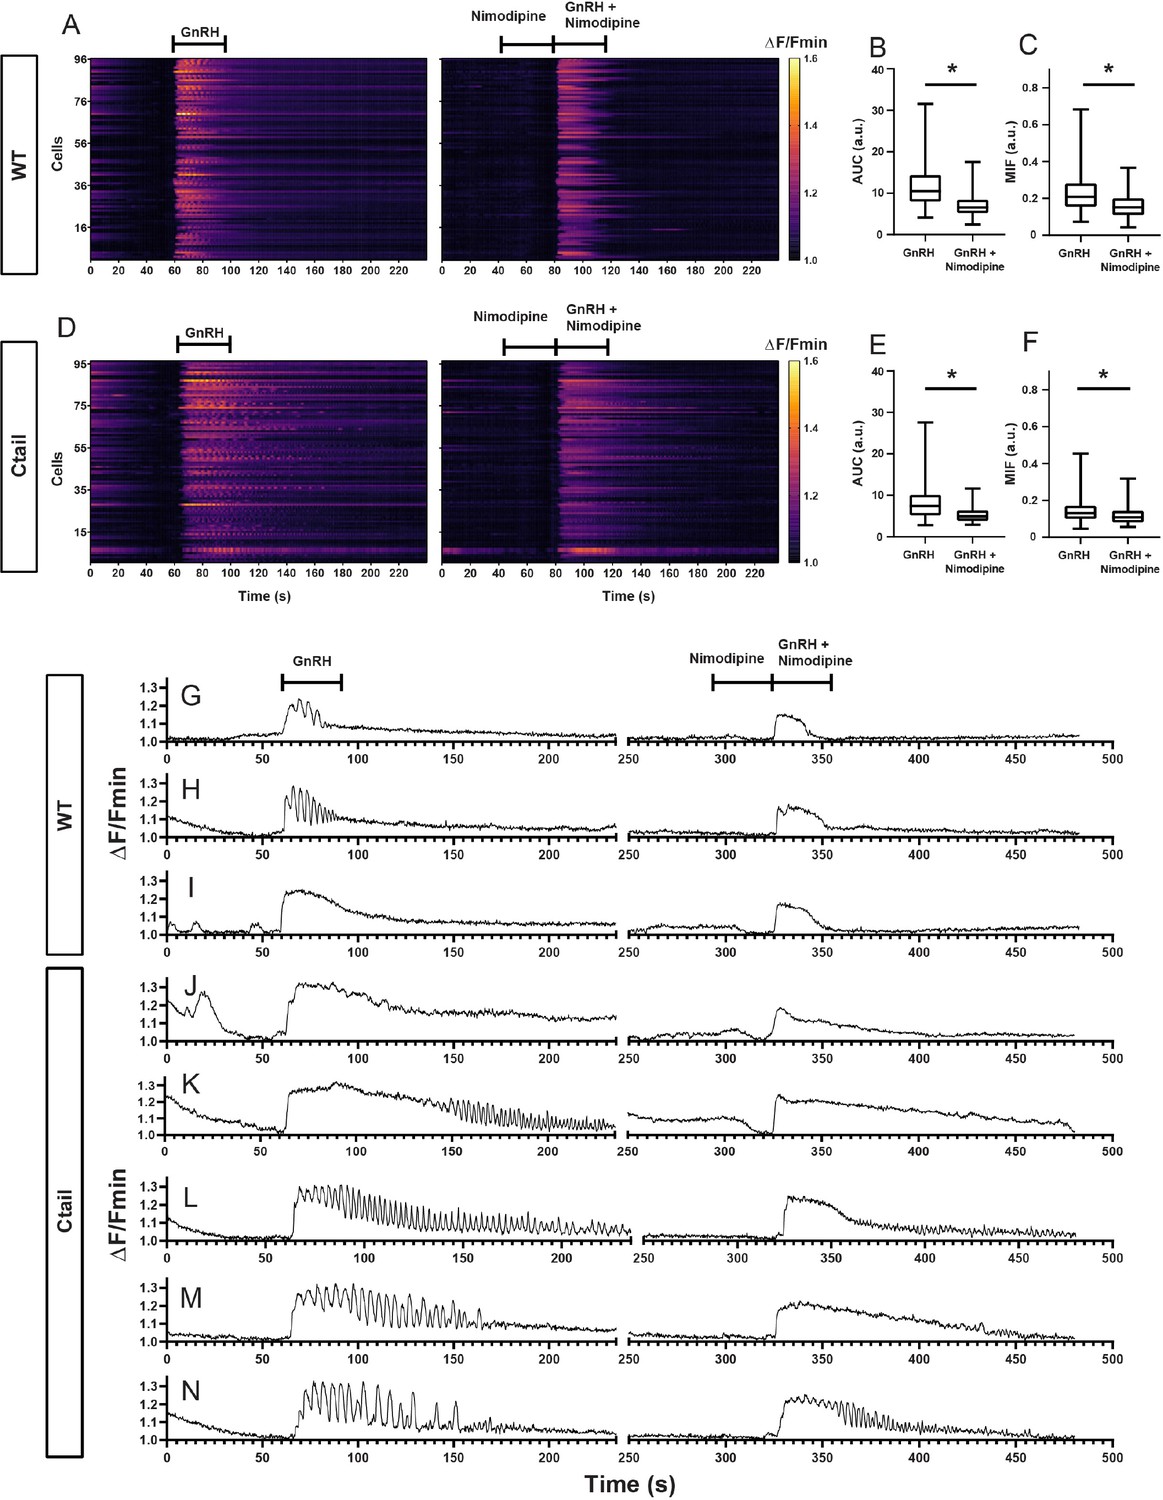
Nimodipine alters gonadotropin-releasing hormone (GnRH)-induced calcium responses in gonadotropes of wild-type and Ctail mice.
The analysis in Figure 8—figure supplement 1 was repeated but with the L-type calcium channel blocker nimodipine (Nim) applied prior to and during the second GnRH pulse. Raster plots of GnRH-induced calcium responses in the absence (left) and presence of nimodipine (right) in gonadotropes from a representative adult male (A) wild-type and (D) Ctail mouse. The two stimuli were separated by 60 min wash with Krebs–Ringer. Comparisons of AUC from a (B) wild-type (275 cells; 11.5 ± 4.7 vs. 7.1 ± 2.8 a.u. for GnRH and GnRH/Nim, respectively; p < 0.0001) and a (E) Ctail mouse (127 cells; 8.15 ± 3.9 vs. 5.4 ± 2.0 a.u. for GnRH and GnRH/Nim, respectively; p < 0.0001). Comparisons of MIF from the (C) wild-type (275 cells; 0.228 ± 0.101 vs. 0.163 ± 0.07 a.u. for GnRH and GnRH/Nim, respectively; p < 0.0001) and (F) Ctail mouse (127 cells; 0.145 ± 0.067 vs. 0.117 ± 0.046 a.u. for GnRH and GnRH/Nim, respectively; p < 0.0001). Examples of calcium responses in individual gonadotropes from (G–I) wild-type and (J–N) Ctail mice. Statistical analyses were performed using Wilcoxon signed-rank tests. *, significantly different.
Figure 9 with 1 supplement
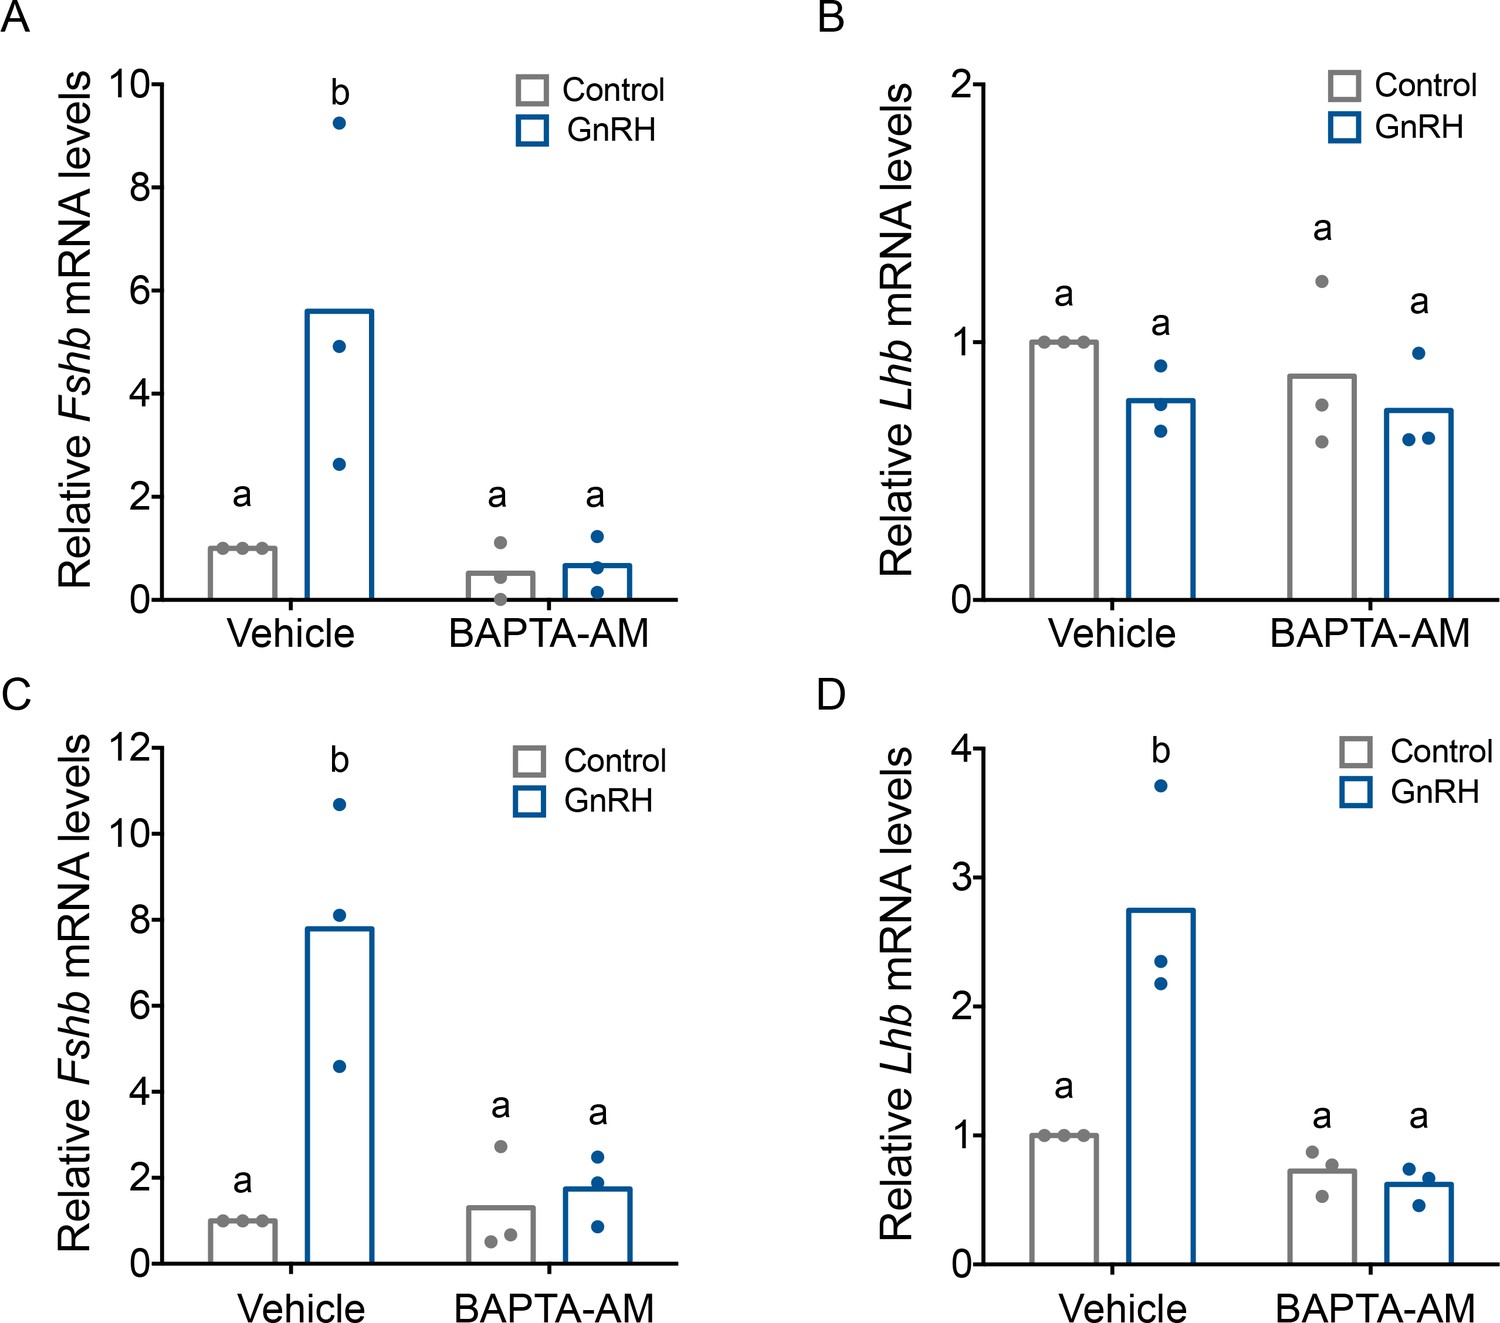
Gonadotropin-releasing hormone (GnRH)-induced Fshb expression is calcium dependent in homologous LβT2 cells.
Relative Fshb (A–C) and Lhb (B–D) expression in LβT2 cells treated with vehicle (dimethyl sulfoxide, DMSO) or 20 µM BAPTA-AM for 20 min followed by treatment with water (control) or low (A, B) or high GnRH (10 nM) pulse frequency (C, D). Gene expression was assessed by RT-qPCR and normalized to the reference gene ribosomal protein L19 (Rpl19). Data shown are from three independent experiments. The bar heights reflect group means. Data were analyzed with two-way analyses of variance (ANOVAs), followed by post hoc Tukey test for multiple comparisons. Bars with different letters differed significantly. Panel A: control (vehicle) vs. GnRH (vehicle) p = 0.0193; control (vehicle) vs. control (BAPTA-AM) p = 0.9981; control (vehicle) vs. GnRH (BAPTA-AM) p = 0.9933; GnRH (vehicle) vs. GnRH (BAPTA-AM) p = 0.0122. Panel B: control (vehicle) vs. GnRH (vehicle) p = 0.5389; control (vehicle) vs. control (BAPTA-AM) p = 0.8495; control (vehicle) vs. GnRH (BAPTA-AM) p = 0.4184; GnRH (vehicle) vs. GnRH (BAPTA-AM) p = 0.9951. Panel C: control (vehicle) vs. GnRH (vehicle) p = 0.0072; control (vehicle) vs. control (BAPTA-AM) p > 0.9999; control (vehicle) vs. GnRH (BAPTA-AM) p = 0.9964; GnRH (vehicle) vs. GnRH (BAPTA-AM) p = 0.0143. Panel D: control (vehicle) vs. GnRH (vehicle) p = 0.0052; control (vehicle) vs. control (BAPTA-AM) p = 0.8627; control (vehicle) vs. GnRH (BAPTA-AM) p = 0.7190; GnRH (vehicle) vs. GnRH (BAPTA-AM) p = 0.0015.
Figure 9—figure supplement 1
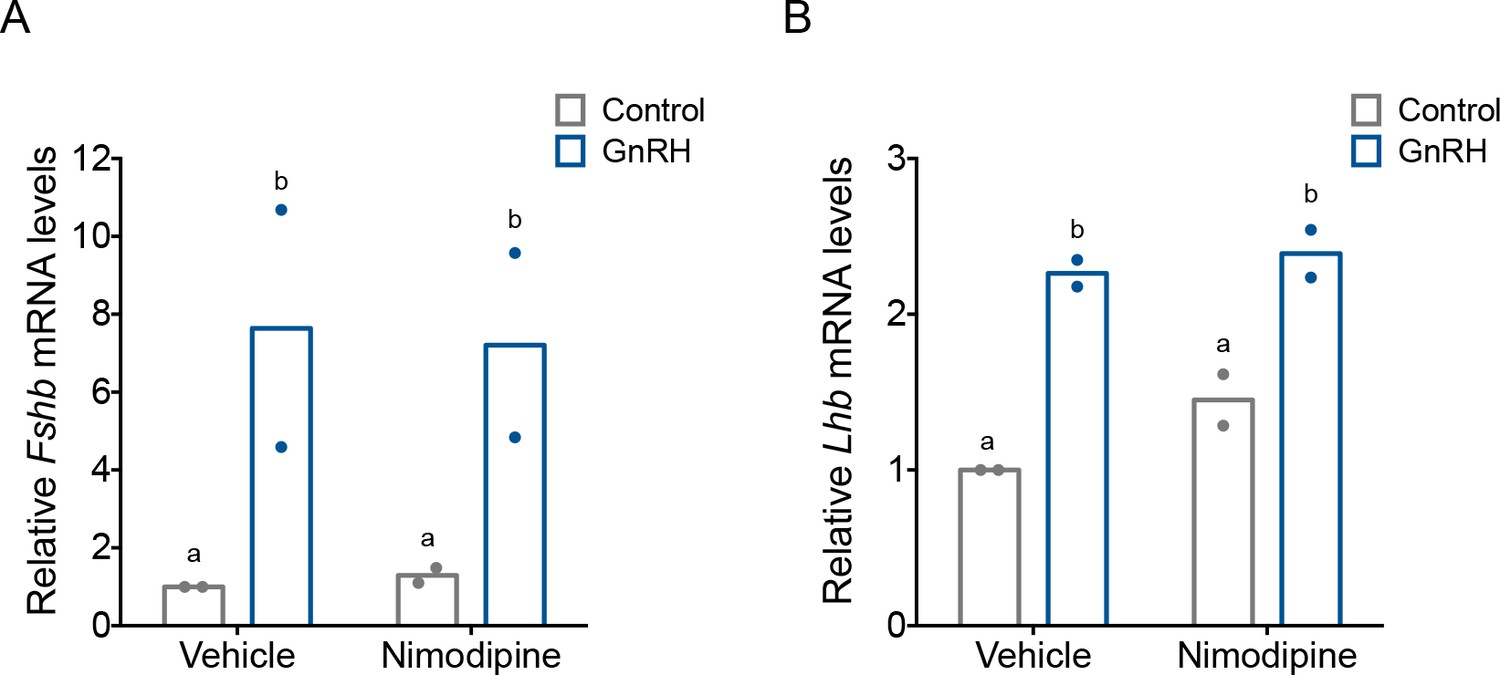
Gonadotropin-releasing hormone (GnRH)-induced Fshb and Lhb expression does not depend on calcium entry via L-type channels in homologous LβT2 cells.
(A) Relative Fshb and (B) Lhb expression in LβT2 cells treated with vehicle (dimethyl sulfoxide, DMSO) or 10 µM nimodipine for 20 min followed by treatment with water (vehicle) or high-frequency GnRH (10 nM) pulses. Gene expression was assessed by RT-qPCR and normalized to Rpl19. Data reflect the means of two independent experiments. Data were analyzed with two-way analyses of variance (ANOVAs), followed by post hoc Tukey’s test for multiple comparisons. Bars with different letters differed significantly. Panel A: Control (vehicle) vs. GnRH (vehicle) p = 0.0178; Control (vehicle) vs. GnRH (Nimodipine) p = 0.0232; GnRH (vehicle) vs. GnRH (Nimodipine) p = 0.8545; Control (Nimodipine) vs. GnRH (Nimodipine) p = 0.0235. Panel B: Control (vehicle) vs. GnRH (vehicle) p = 0.0061; Control (vehicle) vs. GnRH (Nimodipine) p = 0.0043; GnRH (vehicle) vs. GnRH (Nimodipine) p = 0.8770; Control (Nimodipine) vs. GnRH (Nimodipine) p = 0.0178.
Figure 10 with 1 supplement
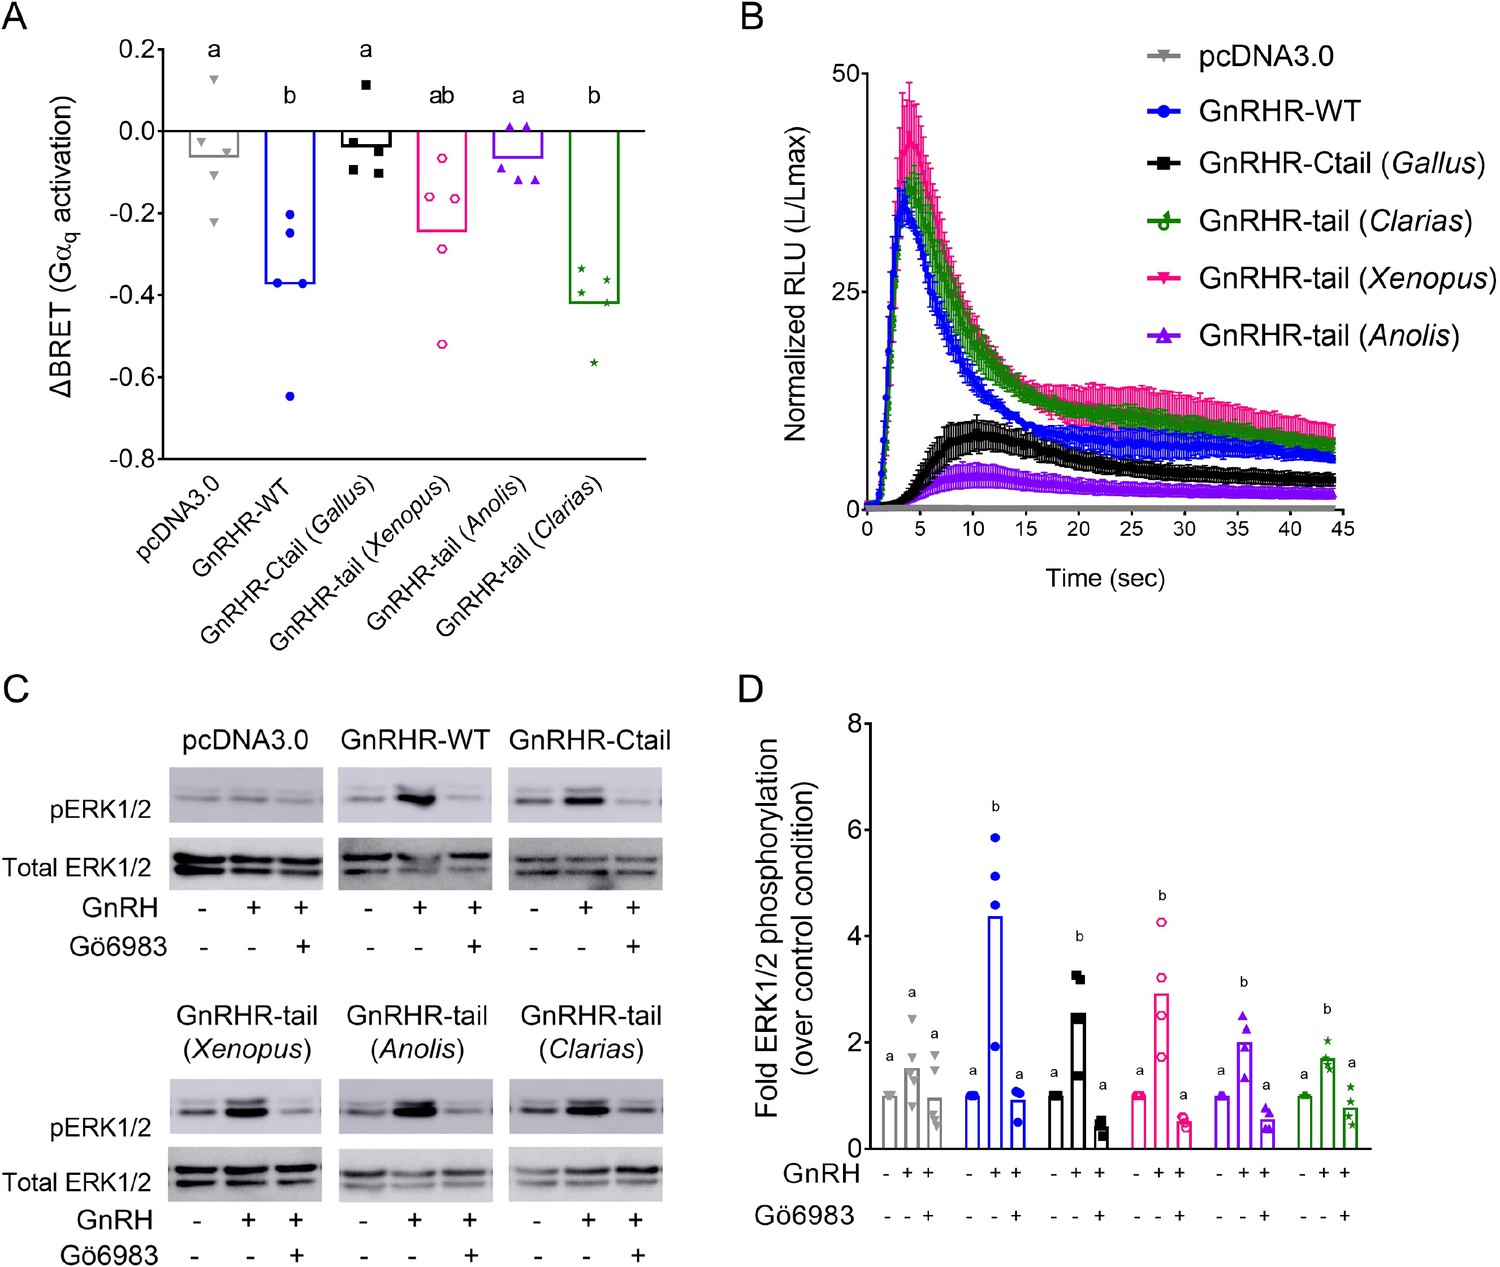
Disruption of gonadotropin-releasing hormone (GnRH) signaling via chimeric GnRHRs depends on the sequence of the Ctail.
(A) HEK 293 cells were transfected with the Gq biosensor and expression vectors for the indicated chimeric GnRHRs. Cells were treated with GnRH as in Figure 6A. BRET signals were read three times before and after GnRH stimulation. ΔBRET values are as described in Figure 6. Data are shown from five independent experiments. Bars heights reflect the group means. Data were analyzed with one-way analyses of variance (ANOVAs), followed by post hoc Tukey test for multiple comparisons. Different letters differed significantly. pcDNA3.0 vs. GnRHR-WT p = 0.0086; pcDNA3.0 vs. GnRHR-Ctail p = 0.9995; pcDNA3.0 vs. GnRHR-tail (Xenopus) p = 0.2477; pcDNA3.0 vs. GnRHR-tail (Anolis) p > 0.9999; pcDNA3.0 vs. GnRHR-tail (Clarias) p = 0.0021. (B) HEK 293 cells were transfected with the luminescence Obelin biosensor and expression vectors for the indicated chimeric GnRHRs. Cells were treated with GnRH and analyzed as in Figure 7E. The mean ± standard error of the mean (SEM) of four independent experiments is shown. (C) HEK 293 cells were transfected with the expression vectors for the indicated chimeric GnRHRs and treated and analyzed as in Figure 7C. The western blot shown is representative of four independent experiments. (D) The data exemplified in panel C were quantified and analyzed as in Figure 7B. Bar heights reflect group means. Data were analyzed with one-way ANOVA, for each receptor, followed by post hoc Tukey test for multiple comparisons. Bars with different letters differed significantly. pcDNA3.0: control (vehicle) vs. GnRH (vehicle) p = 0.4955; GnRH (vehicle) vs. GnRH (Gö6983) p = 0.1373. GnRHR-WT: control (vehicle) vs. GnRH (vehicle) p = 0.0027; GnRH (vehicle) vs. GnRH (Gö6983) p = 0.0023. GnRHR-Ctail: control (vehicle) vs. GnRH (vehicle) p = 0.0050; GnRH (vehicle) vs. GnRH (Gö6983) p = 0.0006. GnRHR-tail (Xenopus): control (vehicle) vs. GnRH (vehicle) p = 0.0046; GnRH (vehicle) vs. GnRH (Gö6983) p = 0.0010. GnRHR-tail (Anolis): control (vehicle) vs. GnRH (vehicle) p = 0.0036; GnRH (vehicle) vs. GnRH (Gö6983) p = 0.0003. GnRHR-tail (Clarias): control (vehicle) vs. GnRH (vehicle) p = 0.0043; GnRH (vehicle) vs. GnRH (Gö6983) p = 0.0007.
-
Figure 10—source data 1
Source data for Figure 10.
- https://cdn.elifesciences.org/articles/72937/elife-72937-fig10-data1-v2.zip
Figure 10—figure supplement 1

Alignment of the Ctails from the GnRHRs in chicken, frog, lizard, and catfish.
The amino acid sequences of the GnRHR Ctails from Gallus gallus (NM_204653.1), Xenopus laevis (NM_001085707), Anolis carolinensis (XM_003226565.3) and Clarias garepinus (derived from closely related Tachysaurus fulvidraco, XM_027175679.1) were aligned using ClustalW. Different colors indicate different amino acid types: Red: small and hydrophobic; blue: acidic; magenta: basic; green: hydroxyl, sulfhydryl, and amine. An asterisk (*) indicates conservation of the amino acid at that position. A colon (:) indicates similarity of amino acids at that position. Underlined amino acids were replaced by the ClaI restriction site in Gallus and Xenopus (translated to Ile-Asp) to clone the different Ctails downstream of the murine GnRHR. For Clarias and Anolis, the ClaI restriction site was added upstream of the sequences shown.
Tables
Table 1
Primers.
All primers are listed in 5′ to 3′ orientation.
| Expression vectors | ||||||
|---|---|---|---|---|---|---|
| Gnrhr ORF (for) | CGGAATCGCTCACAATGCATCTCTTGAG | |||||
| Gnrhr ORF (rev) | ACTCTAGATCTCCAAAGAGAAATACCCATATA | |||||
| pcDNA3.0-GnRHR Stop to ClaI (for) | GACCCACTCATATATGGGTATTTCTCTTTGATCGATTAGAGGGCCCTATTCTA TAGTGTCACCTA | |||||
| pcDNA3.0-GnRHR Stop to ClaI (rev) | TAGGTGACACTATAGAATAGGGCCCTCTAATCGATCAAAGAAAATACCCATAT ATGAGTGGGTC | |||||
| Chicken Ctail (for) | CGGATCGATCGTTTCGGGAGGACGTGCAA | |||||
| Chicken Ctail (rev) | CGGATCGATTCAGCACACCGTGTTAACGG | |||||
| Gnrhr STOP to ClaI (for) | TGCACCCACTCATATATGGGTATTTCTCTTGATCGATGGAGAACTACACAAGA ACTCAGATAGAAATAAG | |||||
| Gnrhr STOP to ClaI (rev) | CTTATTTCTATCTGAGTTCTTGTGTAGTCTCCATCGATCAAAGAGAAATCACC ATATATGAGTGGGTCGA | |||||
| Xenopus tail (for) | TTAAATCGATAAAGAGGACCTGCGATCATGGATCA | |||||
| Xenopus tail (rev) | AATTATCGATTCAGAAGACTGATTGCATGGT | |||||
| Adaptor primer (for) | GAAGTGCCATTCCGCCTGAC | |||||
| Adaptor primer (rev) | ACTGAGCCTCCACCTAGCCT | |||||
| Targeting vector | ||||||
| Gnrhr UCA (for) | CGGGGTACCTATAACTCATTAGCTGATTCAAACTT | |||||
| Gnrhr UCA (rev) | CGGCCCGGGCAGTTCTGACAGACTAGCCCCC | |||||
| Gnrhr floxed region (for) | CGGCCCGGGCGATAACTTCGTATAATGTATGCTAAAGTTATCAGGATTCACCT CACCATGG | |||||
| Gnrhr floxed region (rev) | CGGGTTTAAACCTACAAAGAGAAATACCCAT | |||||
| Gnrhr DCA (for) | CGGCCCGGGCAGGATTCACCTCACCATGG | |||||
| Gnrhr DCA (rev) | CGGGCGGCCGCAATTGAAGATCACAGTGTTT | |||||
| BGH PolyATail (for) | TAAGTTTAAACCGCTGATCAGC | |||||
| BGH PolyATail (rev) | CGGCTCGAGCCATAGAGCCCACCGCATC | |||||
| Southern blot probes | ||||||
| 5′ Southern probe (for) | CTTCAACCCGCCCTCTAGT | |||||
| 5′ Southern probe (rev) | AGCCGGTCTAAGAATCCTCTC | |||||
| 3′ Southern probe (for) | CAAAGTGCCCACAGATTTTG | |||||
| 3′ Southern probe (rev) | GCCTGGTGTTCTGAGAGACTG | |||||
| Genotyping | ||||||
| Gnrhr WT exon 3 (for) | CTCGGCTGAGAACGATAAAG | |||||
| Gnrhr WT exon 3 (rev) | CCCATATATGAGTGGGTCGAA | |||||
| Gnrhr Ctail exon 3 (Ctail for) | TTCGCTACCTCCTTTGTCGT | |||||
| Gnrhr Ctail Ctail (Ctail rev) | TGTTAACGGTTGTCCCATT | |||||
| gDNA Gnrhr (for) | CATGGAGATCCTTGCTGACA | |||||
| gDNA Gnrhr (rev) | CACCTGGGGGCTAGTCTGT | |||||
| qPCR | ||||||
| Cga (for) | TCCCTCAAAAAGTCCAQGAGC | |||||
| Cga (rev) | GAAGAGAATGAAGAATATGCAG | |||||
| Fshb (for) | GTGCGGGCTACTGCTACACT | |||||
| Fshb (rev) | CAGGCAATCTTACGGTCTCG | |||||
| Gnrhr (for) | CACGGGTTTAGGAAAGCAAA | |||||
| Gnrhr (rev) | TTCGCTACCTCCTTTGTCGT | |||||
| Lhb (for) | AGCAGCCGGCAGTACTCGGA | |||||
| Lhb (rev) | ACTGTGCCGGCCTGTCAACG | |||||
| Rpl19 (for) | CGGGAATCCAAGAAGATTGA | |||||
| Rpl19 (rev) | TTCAGCTTGTGGATGTGCTC |
Additional files
Download links
A two-part list of links to download the article, or parts of the article, in various formats.
Downloads (link to download the article as PDF)
Open citations (links to open the citations from this article in various online reference manager services)
Cite this article (links to download the citations from this article in formats compatible with various reference manager tools)
Addition of a carboxy-terminal tail to the normally tailless gonadotropin-releasing hormone receptor impairs fertility in female mice
eLife 10:e72937.
https://doi.org/10.7554/eLife.72937


