Impact of a human gut microbe on Vibrio cholerae host colonization through biofilm enhancement
- Department of Molecular Biology and Microbiology, Tufts University School of Medicine, United States
- Program of Molecular Microbiology, Graduate School of Biomedical Sciences, Tufts University School of Medicine, United States
- Department of Medicine, University of Washington, United States
- Division of Infectious Diseases, Massachusetts General Hospital, United States
- Department of Molecular, Cellular and Developmental Biology, Yale University, United States
- Department of Pediatrics, Harvard Medical School, United States
- Department of Molecular Virology and Microbiology at Baylor College of Medicine, United States
- International Center for Diarrheal Disease Research, Bangladesh, Bangladesh
- Quantitative Biology Institute, Yale University, United States
Figures
Figure 1
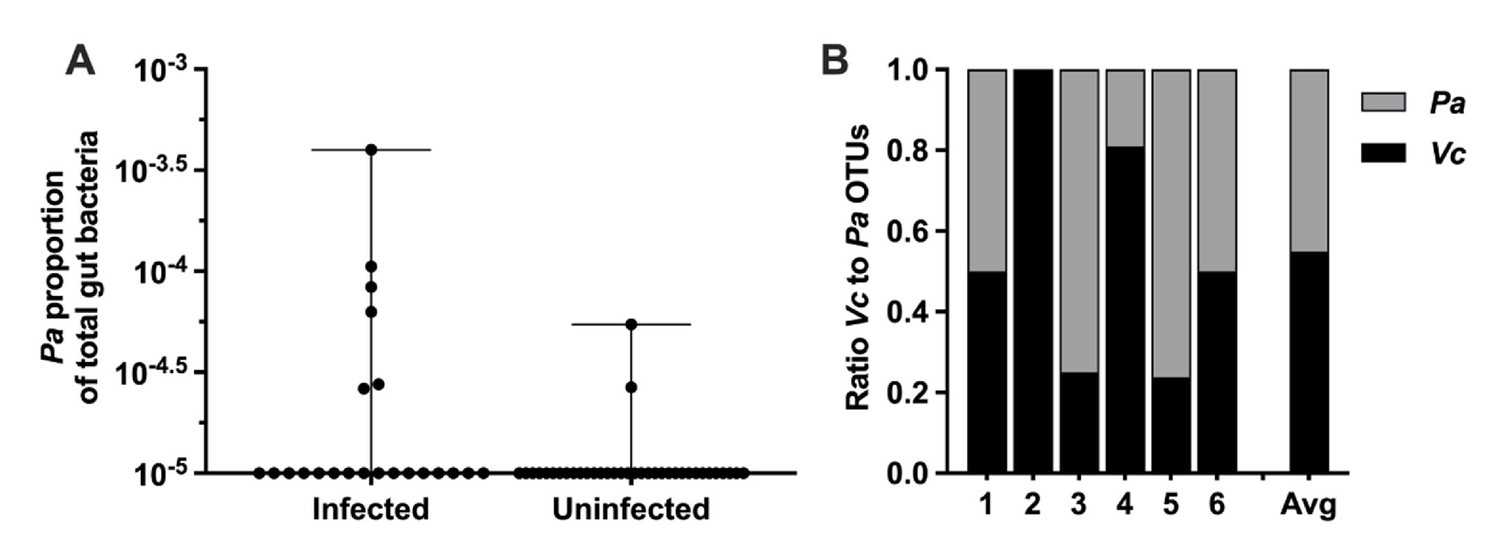
Paracoccus aminovorans (Pa) is more abundant in persons with Vibrio cholerae (Vc) infection compared to uninfected persons.
In a prior study of household contacts of cholera patients in Bangladesh (Midani et al., 2018), Pa was identified as differentially abundant using a support vector machine model with recursive feature elimination in order to discriminate patterns of microbial taxa relative abundance that distinguished infected from uninfected persons. The microbiota was assessed using 16S rRNA in rectal swabs collected from individuals with Vc infection (n = 22) compared to uninfected individuals (n = 36). In this study, total sum normalization was applied to operational taxonomic unit (OTU) counts from each sample, and a median of 37,958 mapped reads per sample was generated (Midani et al., 2018). Based on this sequencing data, the estimated limit of detection for a Pa OTU is 2.0 × 10⁻⁵. Raw and normalized counts of Pa and Vc are shown in Supplementary file 1. (A) Normalized relative abundance of Pa in infected and uninfected individuals, comparison between infected and uninfected p=0.009 (Mann–Whitney nonparametric U-test). All data points are shown, and bars mark the maximum and minimum values. (B) Ratio of Vc to Pa in six Vc-infected persons.
-
Figure 1—source data 1
Paracoccus aminovorans (Pa) abundance in persons with and without Vibrio cholerae (Vc) infection.
- https://cdn.elifesciences.org/articles/73010/elife-73010-fig1-data1-v3.xlsx
-
Figure 1—source data 2
Ratio of Paracoccus aminovorans (Pa) to Vibrio cholerae (Vc) in infected persons.
- https://cdn.elifesciences.org/articles/73010/elife-73010-fig1-data2-v3.xlsx
Figure 2 with 2 supplements
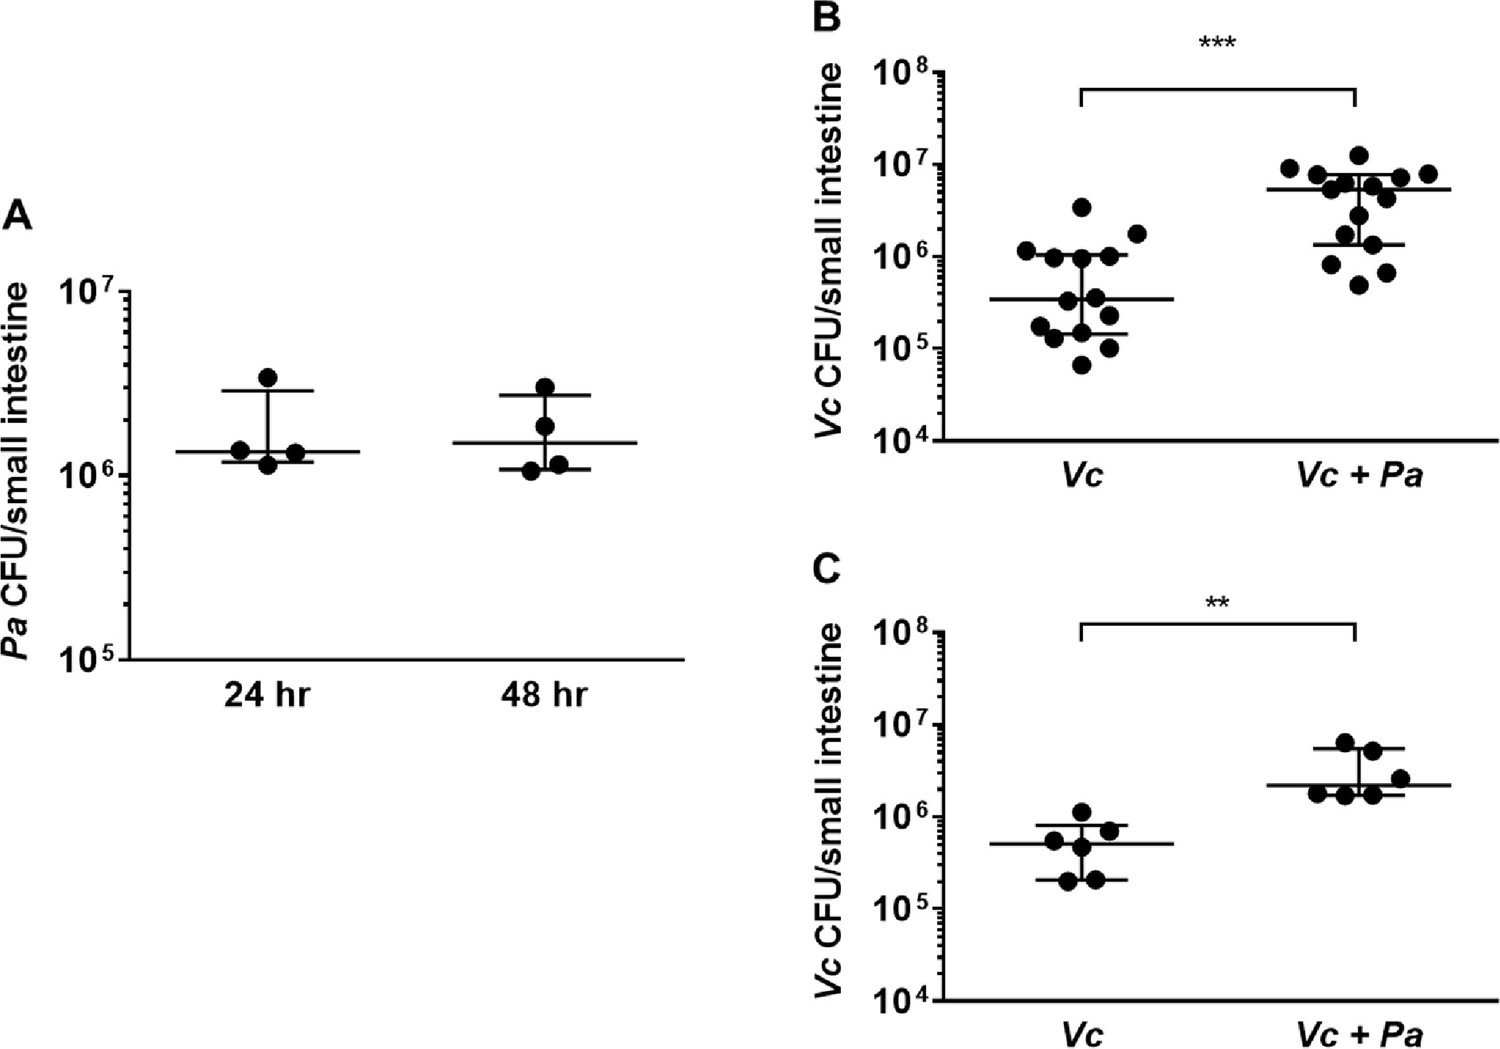
The presence of Paracoccus aminovorans (Pa) enhances Vibrio cholerae (Vc) colonization in the infant mouse intestine.
(A) 3-day-old infant mice were intragastrically inoculated with 107 colony-forming unit (CFU) of Pa every 12 hr twice or four times. 12 hr after the second or fourth dose of Pa inoculation (i.e., at 24 hr and 48 hr, respectively), mice were sacrificed and CFUs were enumerated by plating serial dilutions of small intestine samples on selective media. (B) 3-day-old infant mice were intragastrically inoculated four times with LB or 107 CFU of Pa for every 12 hr, and 12 hr after the last Pa inoculation, the animals were infected with 106 CFU of WT Vc. Mice were sacrificed 20–24 hr post infection, and the small intestine samples were taken to enumerate Vc. Bars on graphs depict median value with 95% confidence interval (CI) and individual data points plotted. Unpaired nonparametric U-test (Mann–Whitney); ***p≤0.001. (C) Vc was inoculated intragastrically into the animals alone or together with Pa in a 1:1 ratio. After 24 hr, enumeration of Vc was performed as described above. Unpaired nonparametric U-test (Mann–Whitney); **p≤0.01.
-
Figure 2—source data 1
Viable cell count of Paracoccus aminovorans (Pa) in infant mouse intestine.
- https://cdn.elifesciences.org/articles/73010/elife-73010-fig2-data1-v3.xlsx
-
Figure 2—source data 2
Viable cell count of Vibrio cholerae (Vc) in the infant mouse intestine with and without Pa pre-colonization.
- https://cdn.elifesciences.org/articles/73010/elife-73010-fig2-data2-v3.xlsx
-
Figure 2—source data 3
Viable cell count of Vibrio cholerae (Vc) in the infant mouse intestine with and without Pa co-infection.
- https://cdn.elifesciences.org/articles/73010/elife-73010-fig2-data3-v3.xlsx
Figure 2—figure supplement 1
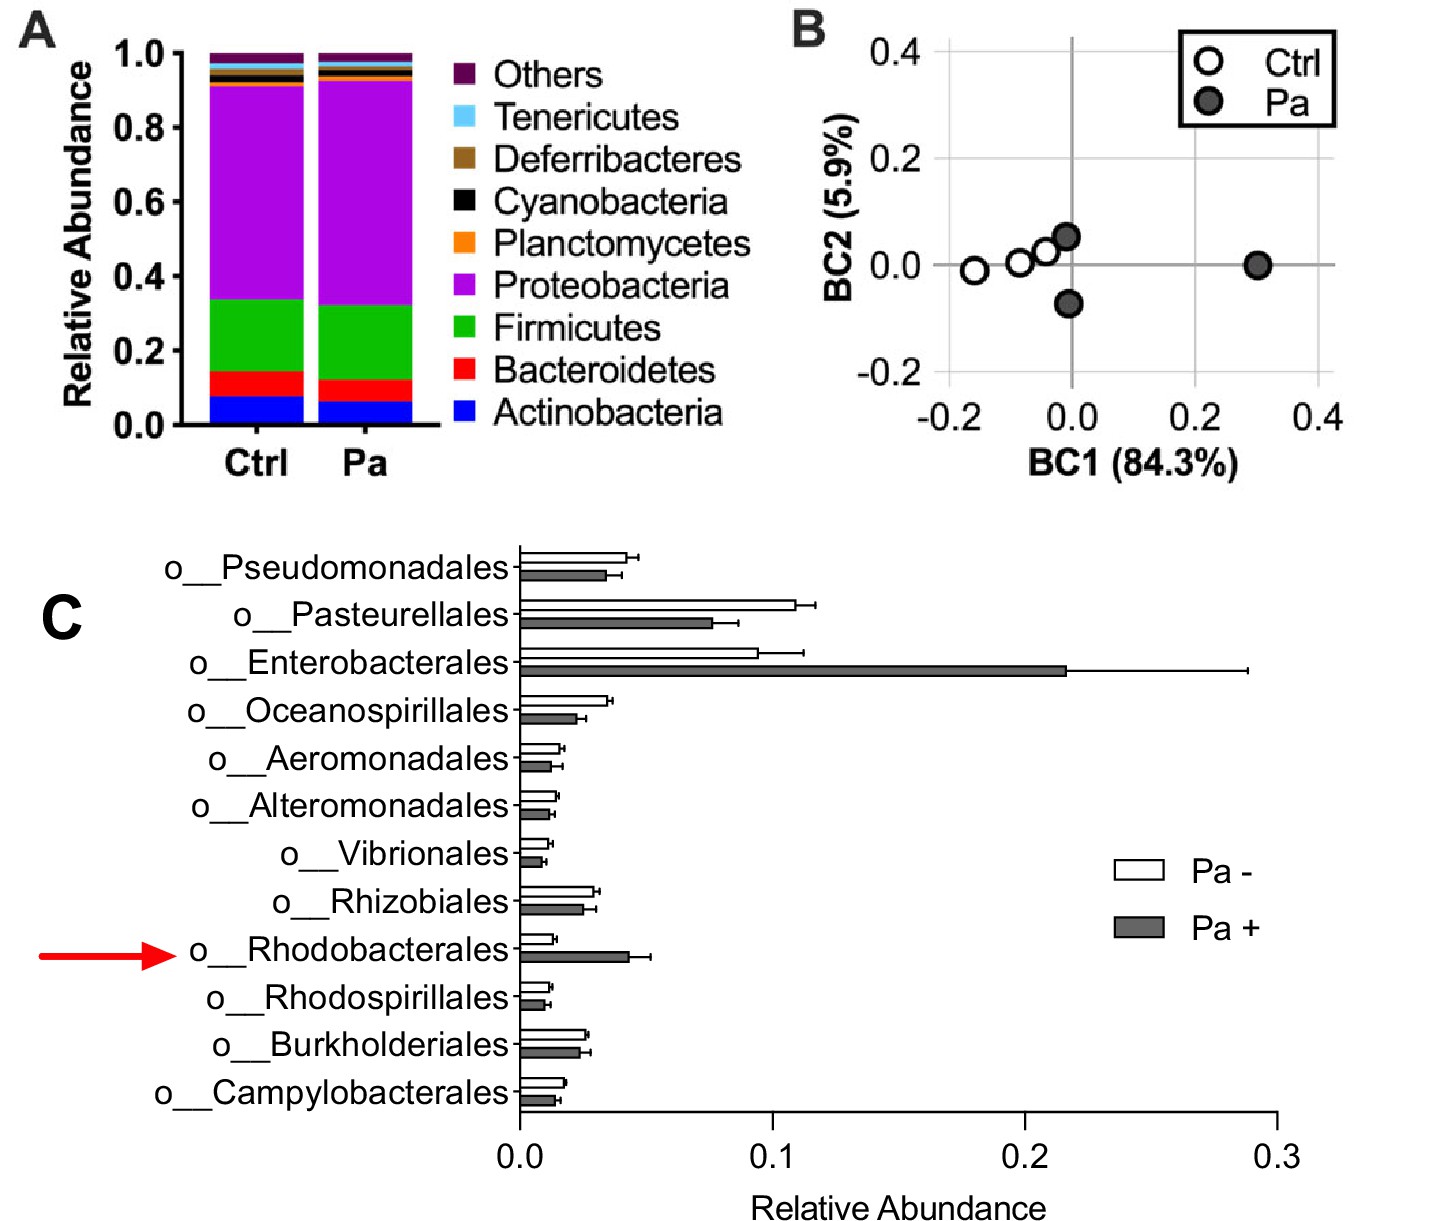
Paracoccus aminovorans (Pa) colonization does not significantly alter the mouse gut microbial diversity.
3-day-old infant mice were intragastrically inoculated with 107 colony-forming unit (CFU) of Pa or sterile LB medium as control (Ctrl) for a period of 12 hr to mimic the length of time between the final Pa inoculation and Vibrio cholerae (Vc) infection in mouse experiments. Small intestines were removed, homogenized, and DNA was extracted using QIAGEN DNeasy PowerSoil Kit and sequenced using shallow shotgun sequencing on an Illumina HiSeq (Vantage, Vanderbilt University). Analysis was performed using DRAGEN Metagenomics Pipeline (v2) on BaseSpace (Illumina). Reads mapped to human DNA, no hits, or known environmental bacteria contaminants, including Curtobacterium and Xanthomonas, were excluded (Salter et al., 2014; Singer et al., 2019; Kim et al., 2017). An average of 36,873 mapped reads was obtained. (A) Relative abundance of phylum-level microbes in the small intestines of mice and (B) principal component of analysis using Bray–Curtis dissimilarity. Pa is in the Proteobacteria phylum. Two-way ANOVA testing of phylum-level abundance was performed, and all comparisons were not significantly different (p>0.05). (C) Proteobacteria abundance in mice colonized with Pa and controls shown by order. Red arrow indicates the order containing Pa. Orders with more than 1% abundance in the population are shown. Bars represent mean relative abundance and horizontal lines represent mean values and lines represent standard error of the mean. Mann–Whitney U-test showed no significant differences between groups after false discovery rate (FDR) adjustment. N = 3 mice in each group.
-
Figure 2—figure supplement 1—source data 1
Abundance of microbes in the mouse intestine with and without Pa colonization.
- https://cdn.elifesciences.org/articles/73010/elife-73010-fig2-figsupp1-data1-v3.xlsx
-
Figure 2—figure supplement 1—source data 2
Principal Component Analysis of microbial abundance in mouse intestine with and without Pa colonization.
- https://cdn.elifesciences.org/articles/73010/elife-73010-fig2-figsupp1-data2-v3.xlsx
Figure 2—figure supplement 2
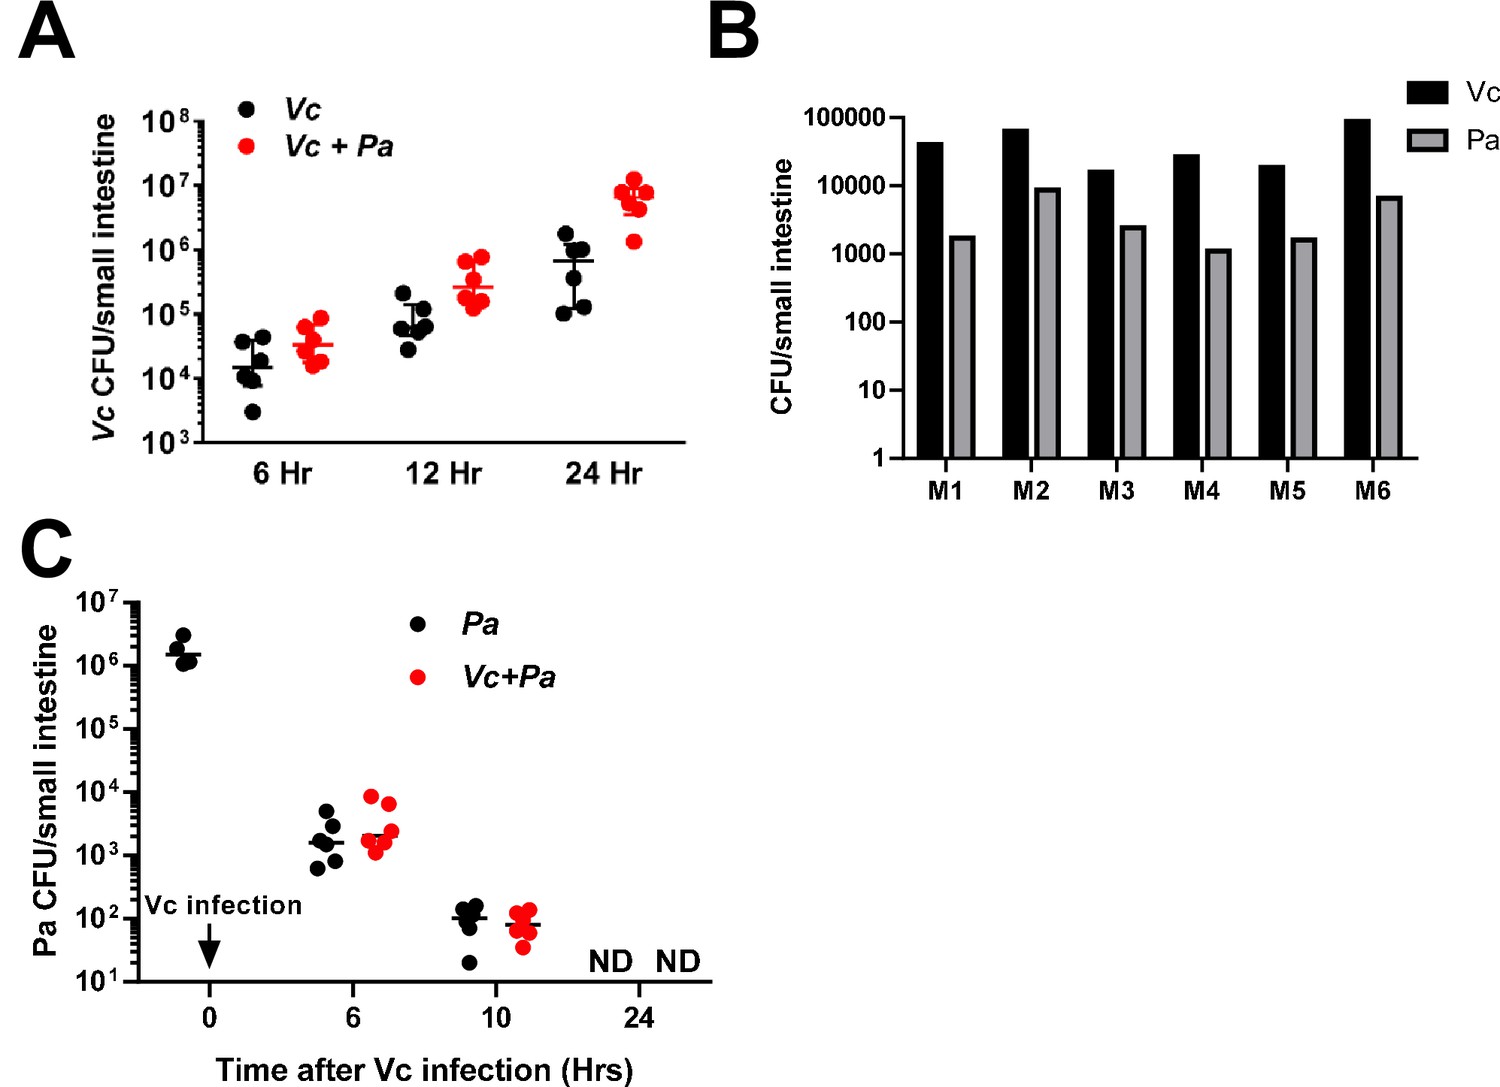
Paracoccus aminovorans (Pa) colonization significantly increases Vibrio cholerae (Vc) small intestine colonization.
(A, B) 3-day-old infant mice were intragastrically inoculated with 107 colony-forming unit (CFU) of Pa or sterile LB medium as control for a period of 36 hr. These animals were then infected with Vc 48 hr after the first inoculation (i.e., 12 hr after the last Pa inoculation). At different time points (6, 12, and 24 hr after Vc infection), small intestines were removed, homogenized, and Vc were enumerated. p-Values are 0.14, 0.035, and 0.004 at 6, 12, and 24 hr, respectively (unpaired nonparametric Mann–Whitney U-test). The CFU counts of Vc and Pa 6 hr after Vc infection are shown in (B). (C) 3-day-old infant mice were intragastrically inoculated with 107 CFU of Pa for four times every 12 hr. 12 hr after the last inoculation, four animals were sacrificed and their small intestines were removed, homogenized, and Pa inside the small intestine was enumerated by plating. Half of the remaining animals were infected with Vc, and the Pa count inside the small intestine was enumerated at different time points (6, 10, and 24 hr after Vc infection). For panel A and C: Bars on graphs depict median value with 95% confidence interval . ND: not detected.
-
Figure 2—figure supplement 2—source data 1
Viable cell count of Vibrio cholerae (Vc) in the mouse small intestine with and without Pa pre-colonization.
- https://cdn.elifesciences.org/articles/73010/elife-73010-fig2-figsupp2-data1-v3.xlsx
-
Figure 2—figure supplement 2—source data 2
Viable cell count of Paracoccus aminovorans (Pa) and Vibrio cholerae (Vc) in the mouse small intestine 6 hours after Vc infection.
- https://cdn.elifesciences.org/articles/73010/elife-73010-fig2-figsupp2-data2-v3.xlsx
-
Figure 2—figure supplement 2—source data 3
Viable cell count of Paracoccus aminovorans (Pa) in the mouse intestine with and without Vibrio cholerae (Vc) infection.
- https://cdn.elifesciences.org/articles/73010/elife-73010-fig2-figsupp2-data3-v3.xlsx
Figure 3 with 1 supplement
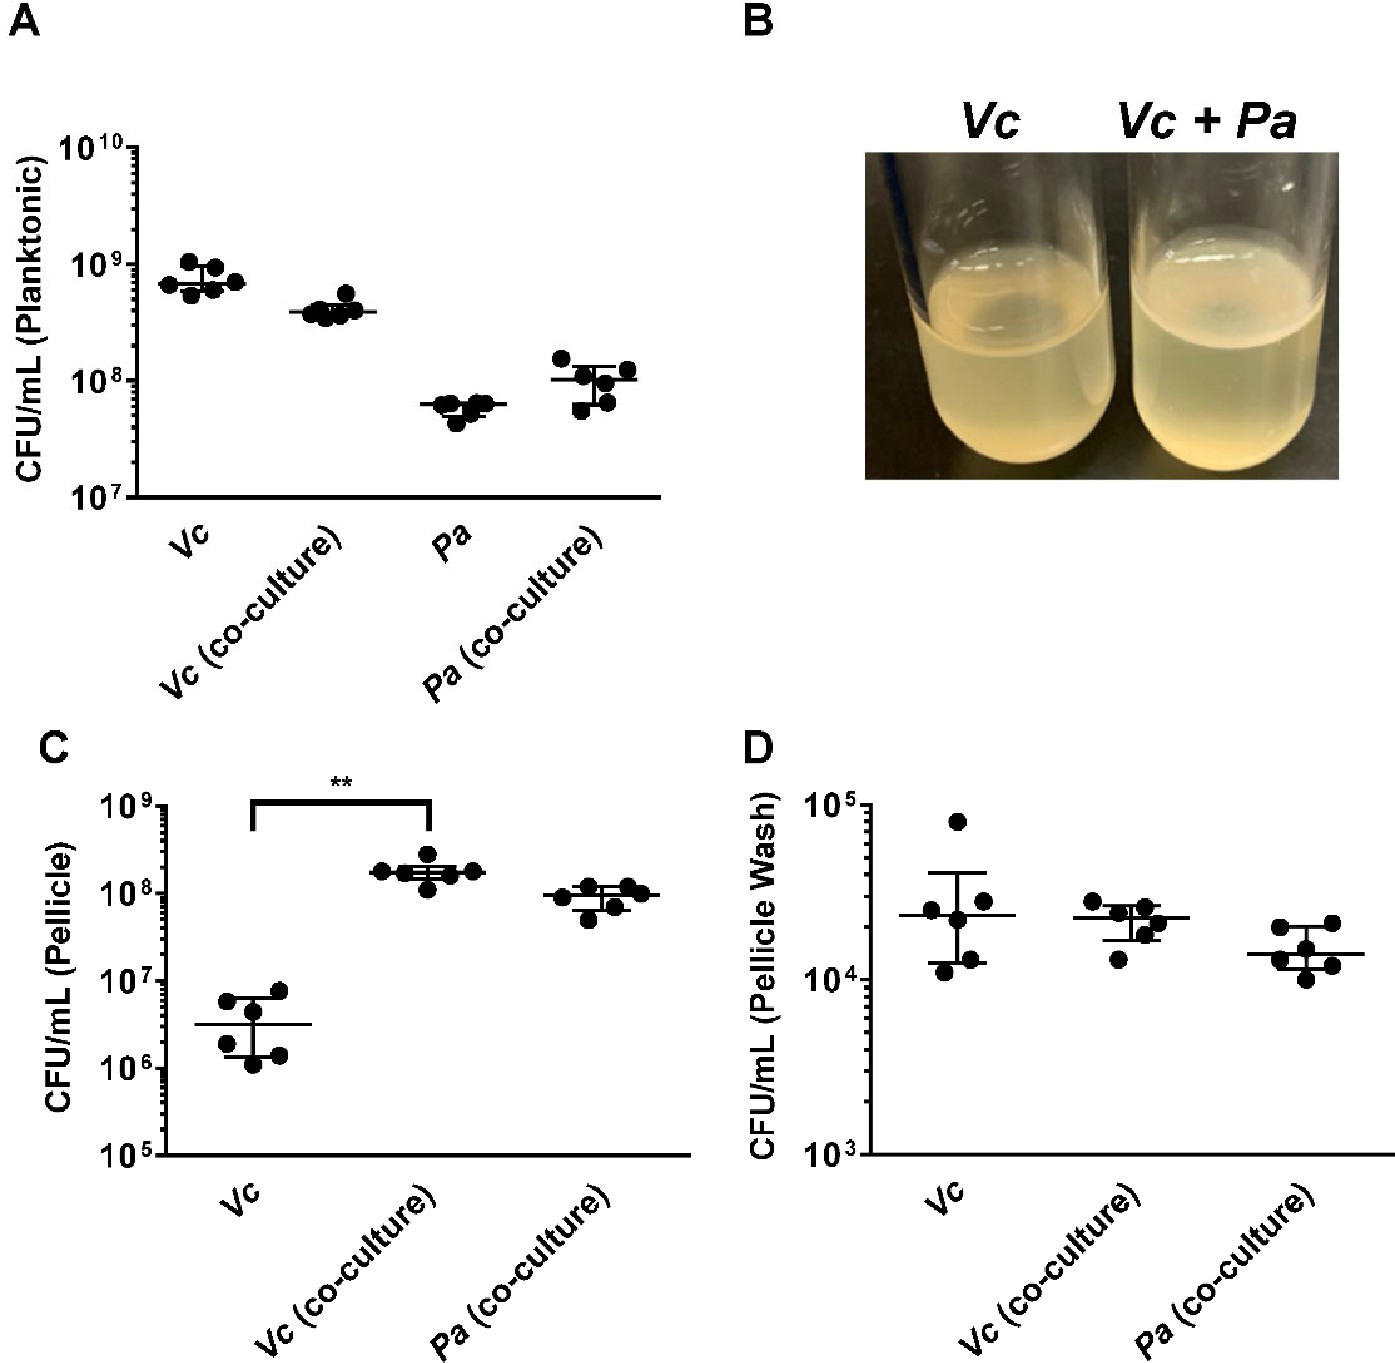
Paracoccus aminovorans (Pa) promotes biofilm formation of Vibrio cholerae (Vc).
(A) Planktonic cell counts from cultures used for pellicle analysis of Vc and Pa grown together or in monoculture. (B) Representative images of pellicles formed by Vc grown in monoculture and co-culture with Pa. Colony-forming unit (CFU) counts of each strain in (C) pellicle samples and (D) spent medium used to wash the pellicle. Bars on graphs depict median value with 95% confidence interval (CI) and individual data points plotted. Unpaired nonparametric U-test (Mann–Whitney): **p≤0.01.
-
Figure 3—source data 1
Viable cell count in for Paracoccus aminovorans (Pa) and Vibrio cholerae (Vc) in the planktonic phase in mono- and co-cultures.
- https://cdn.elifesciences.org/articles/73010/elife-73010-fig3-data1-v3.xlsx
-
Figure 3—source data 2
Pellicle formation in Vc mono- and Vc/Pa coculture.
- https://cdn.elifesciences.org/articles/73010/elife-73010-fig3-data2-v3.pdf
-
Figure 3—source data 3
Viable cell count in for Paracoccus aminovorans (Pa) and Vibrio cholerae (Vc) in the pellicle formed by mono- and co-cultures.
- https://cdn.elifesciences.org/articles/73010/elife-73010-fig3-data3-v3.xlsx
-
Figure 3—source data 4
Viable cell count in for Paracoccus aminovorans (Pa) and Vibrio cholerae (Vc) released by washing of the pellicle formed by mono- and co-cultures.
- https://cdn.elifesciences.org/articles/73010/elife-73010-fig3-data4-v3.xlsx
Figure 3—figure supplement 1
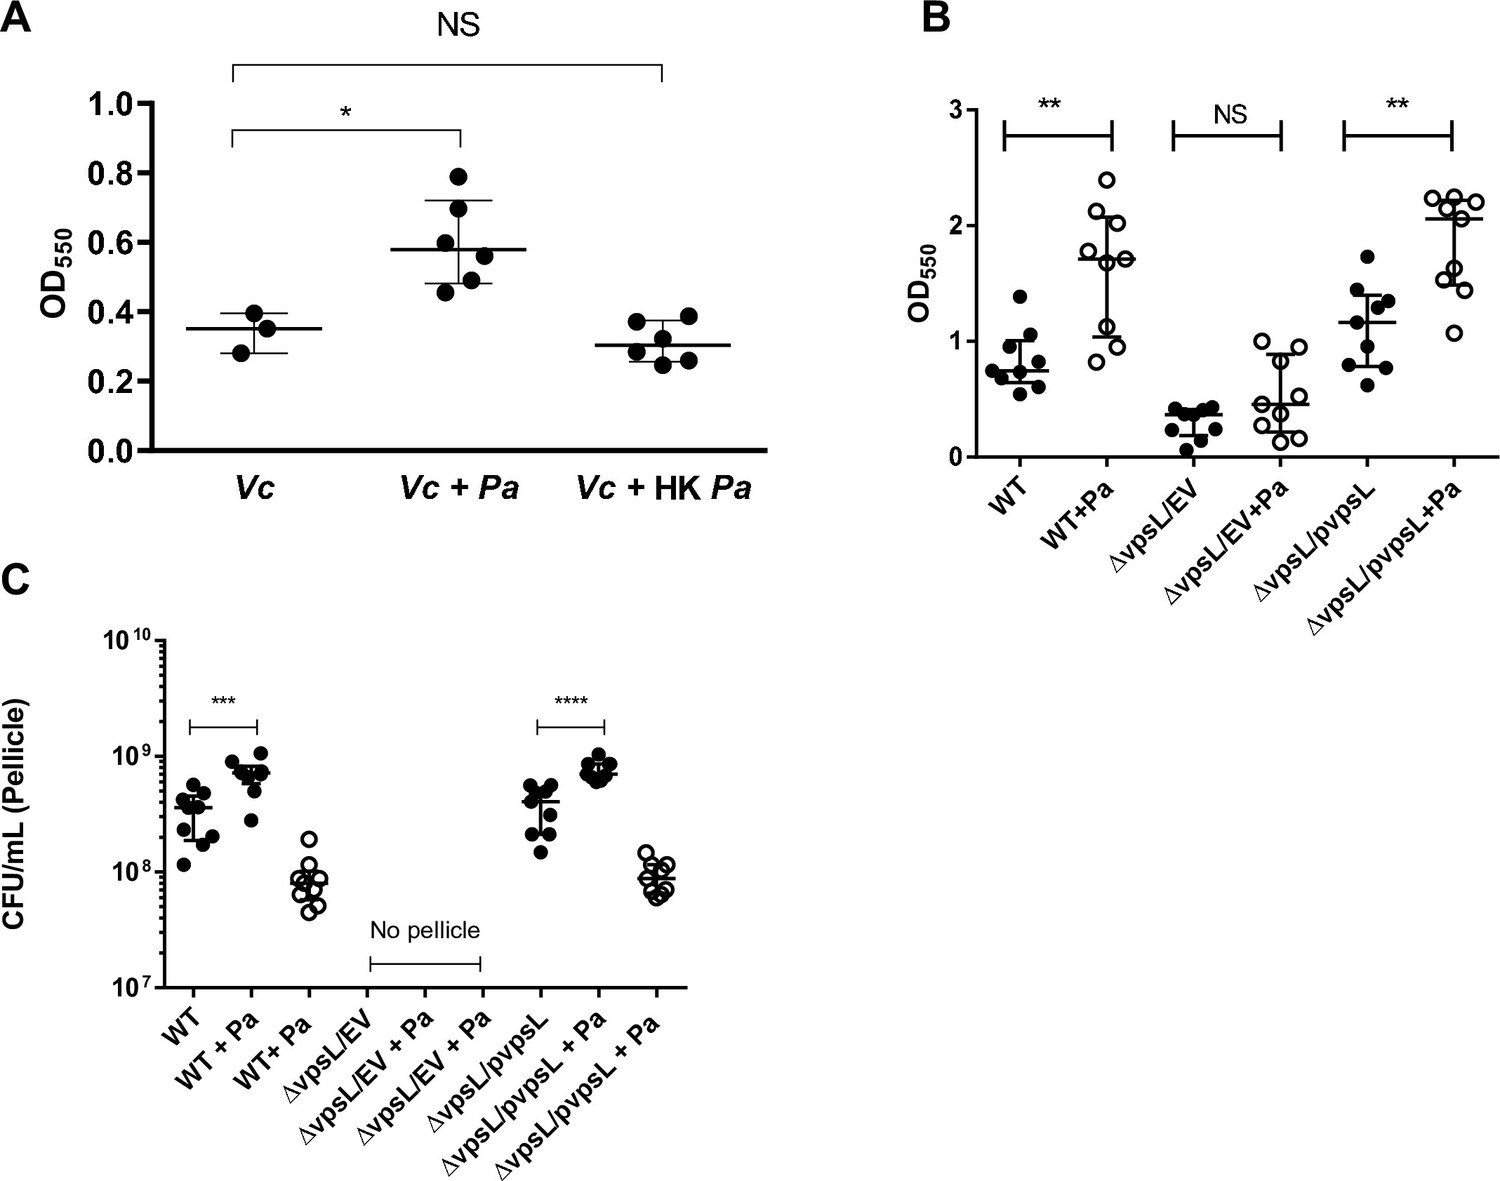
Paracoccus aminovorans (Pa) cultures increase biofilm production in Vibrio cholerae (Vc).
(A) Biofilm formation assays were performed in 96-well microtiter plates. Pa was diluted in LB to a concentration of 107 colony-forming unit (CFU) and grown for 24 hr before the addition of WT Vc. WT Vc was then diluted in LB to a concentration of 106 CFU and added to wells. Plates were incubated for an additional 24 hr before crystal violet (CV) staining to quantify biofilm biomass. CV staining and ethanol solubilization were performed as previously described (O’Toole, 2011). Absorbance of the CV stain was measured at 550 nm using a BioTek Synergy HTX plate reader. Data are represented with horizontal lines indicating the median with 95% confidence interval. (B, C) The defects of the ∆vpsL mutant on biofilm formation and its response to the presence of Pa can be restored by a plasmid constitutively expressing vpsL (pvpsL) but not with an empty vector (EV). (B) shows the response of different strains using the CV assay as described above. (C) shows the CFU counts in co-culture pellicle in different strains. Solid circles are Vc CFU counts, and open circles are Pa counts. For panel A-C, Unpaired Mann–Whitney U-test; ****p≤0.0001, ***p≤0.001, **p≤0.01, *p≤0.05, NS p>0.05.
-
Figure 3—figure supplement 1—source data 1
Crystal violet assays of biofilm formed by Vc mono- and Vc/Pa co-cultures.
- https://cdn.elifesciences.org/articles/73010/elife-73010-fig3-figsupp1-data1-v3.xlsx
-
Figure 3—figure supplement 1—source data 2
Crystal violet assays of biofilm formed by Vc mono- and Vc/Pa co-cultures using vpsL mutants with and without complementation plasmids.
- https://cdn.elifesciences.org/articles/73010/elife-73010-fig3-figsupp1-data2-v3.xlsx
-
Figure 3—figure supplement 1—source data 3
Viable cell count of of pellicles formed by Vc mono- and Vc/Pa co-cultures using vpsL mutants with and without complementation plasmids.
- https://cdn.elifesciences.org/articles/73010/elife-73010-fig3-figsupp1-data3-v3.xlsx
Figure 4 with 1 supplement
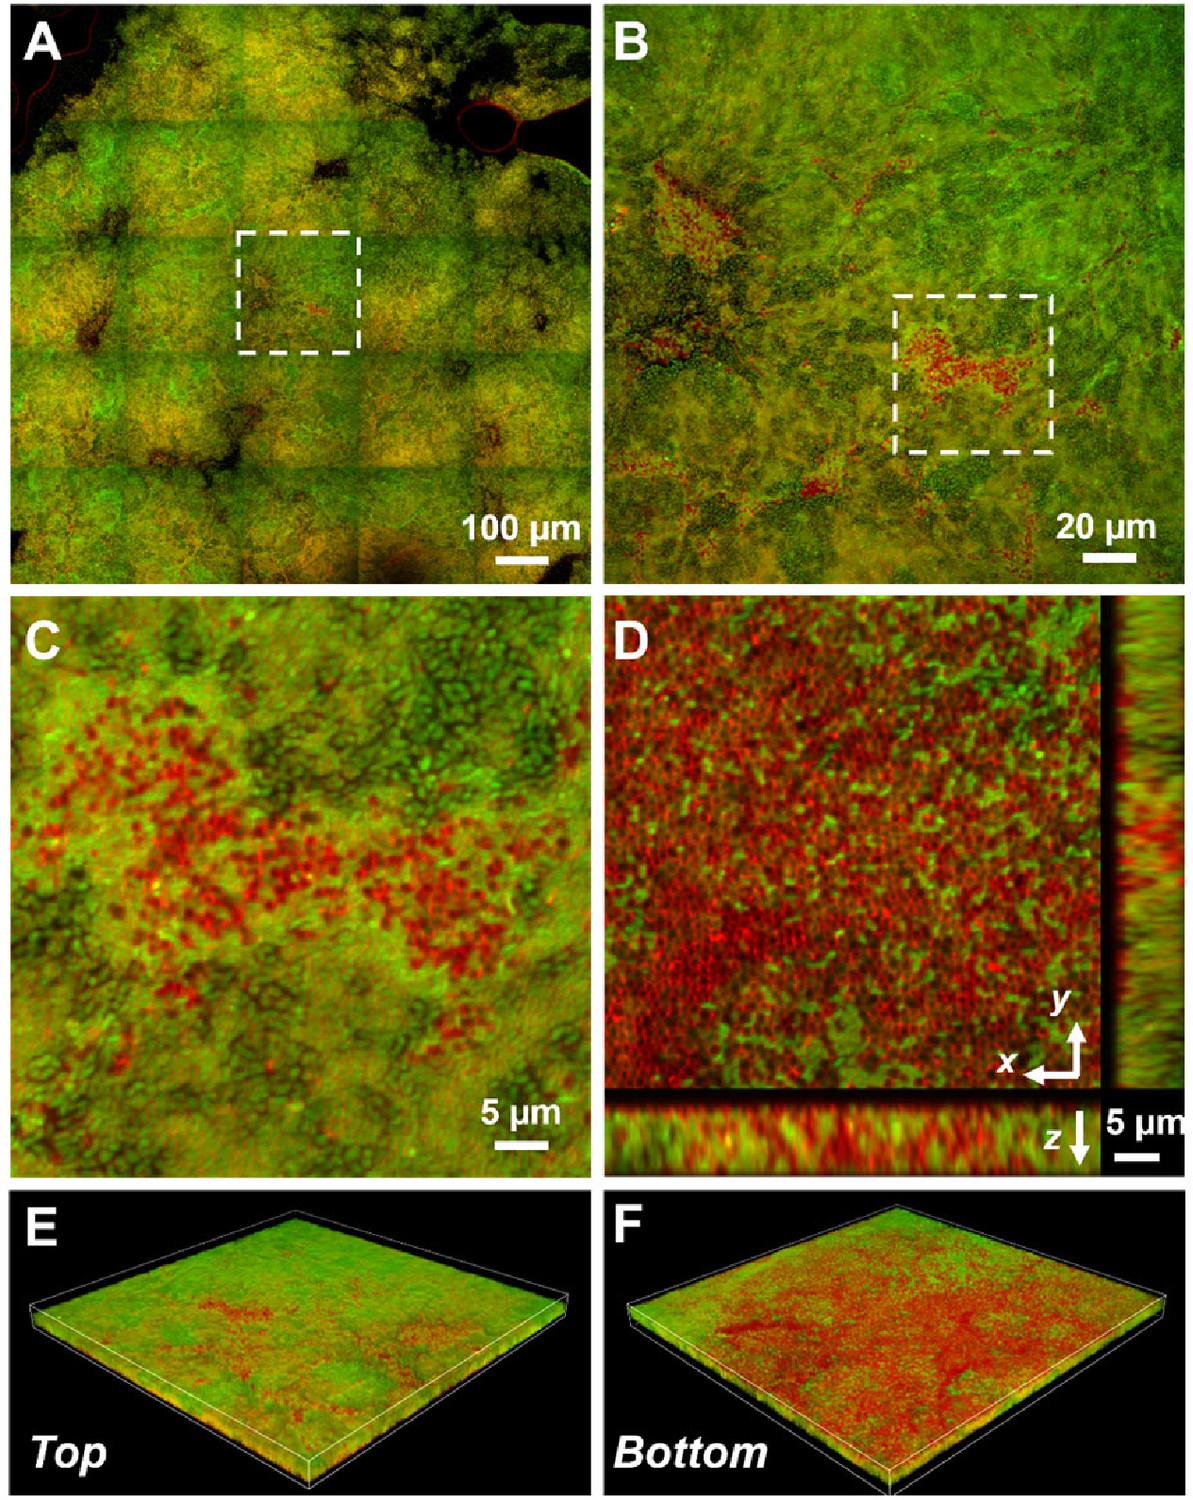
Representative microscopy images of Vibrio cholerae (Vc) and Paracoccus aminovorans (Pa) dual-species pellicles.
(A) Large-scale cross-sectional image of the internal structure in a co-culture pellicle. All cells are stained with FM 4-64 and Vc cells constitutively express mNeonGreen. Therefore, the red signal in the overlay image corresponds primarily to Pa cells. The Pa cells can also be distinguished from Vc cells by their characteristic cocci shape. (B) Zoom-in view of the region highlighted in (A). (C) Zoom-in view of the region highlighted in (B). (D) Cross-sectional views of the region shown in (C), at the bottom of the pellicle. Pa cells exist mainly at the pellicle–liquid interface, with clusters of Pa cells penetrating into the interior of the pellicle. (E, F) Top (E) and bottom (F) views of the co-culture structure shown in (B), rendered in 3D.
Figure 4—figure supplement 1
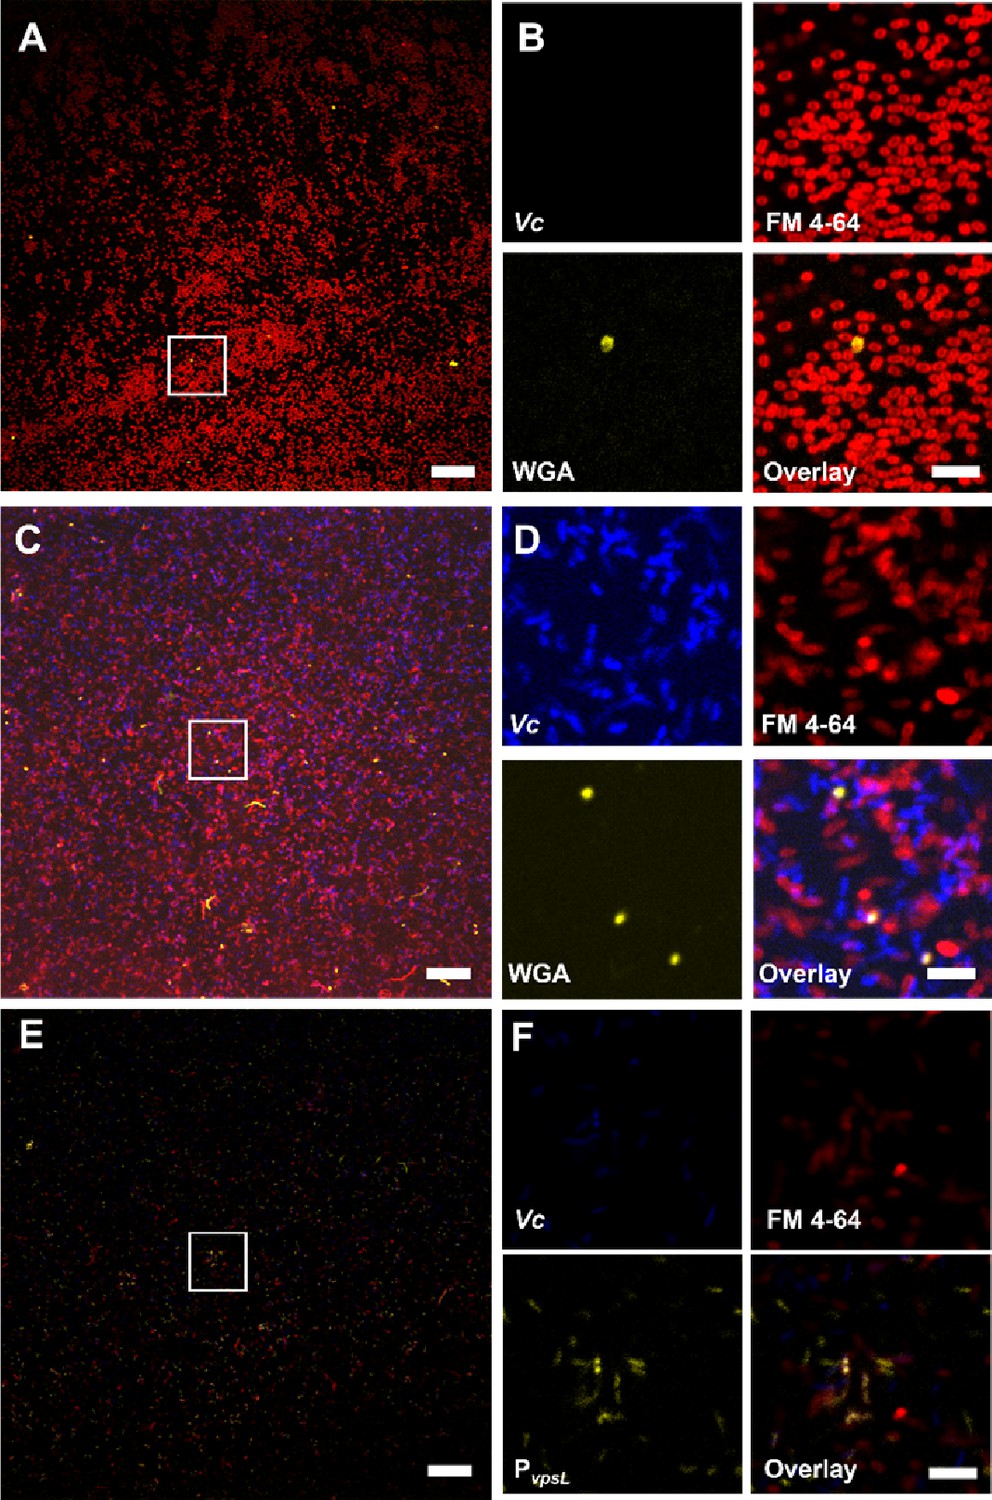
Negative controls for wheat germ agglutinin (WGA) staining and the reporter strain.
(A) Representative view of Paracoccus aminovorans (Pa) cell monoculture imaged under identical conditions as in Figure 6A and B. Scale bar: 20 µm. (B) Zoom-in view of the region highlighted by the white box in (A). Scale bar: 5 µm. (C) Representative image of Vibrio cholerae (Vc) ΔvpsL cell monoculture. Scale bar: 20 µm. (D) Zoom-in view of the region highlighted by the white box in (C). Scale bar: 5 µm. Note that in both cases no pellicle has formed; the images simply show Pa cells or Vc ΔvpsL cells in the liquid culture. The bright dots in the 488 nm (WGA) channel correspond to cells with impaired outer membrane structure, whose GlcNAC moieties in the peptidoglycan layer are exposed and stained by WGA. However, healthy cells do not show WGA staining. (E) Representative view of Vc cell monoculture, imaged under the same conditions as in Figure 6C and D. Scale bar: 20 µm. The intensity scale is identical for viewing the comparison. (F) Zoom-in view of the region highlighted by the white box in (E). Scale bar: 5 µm.
Figure 5
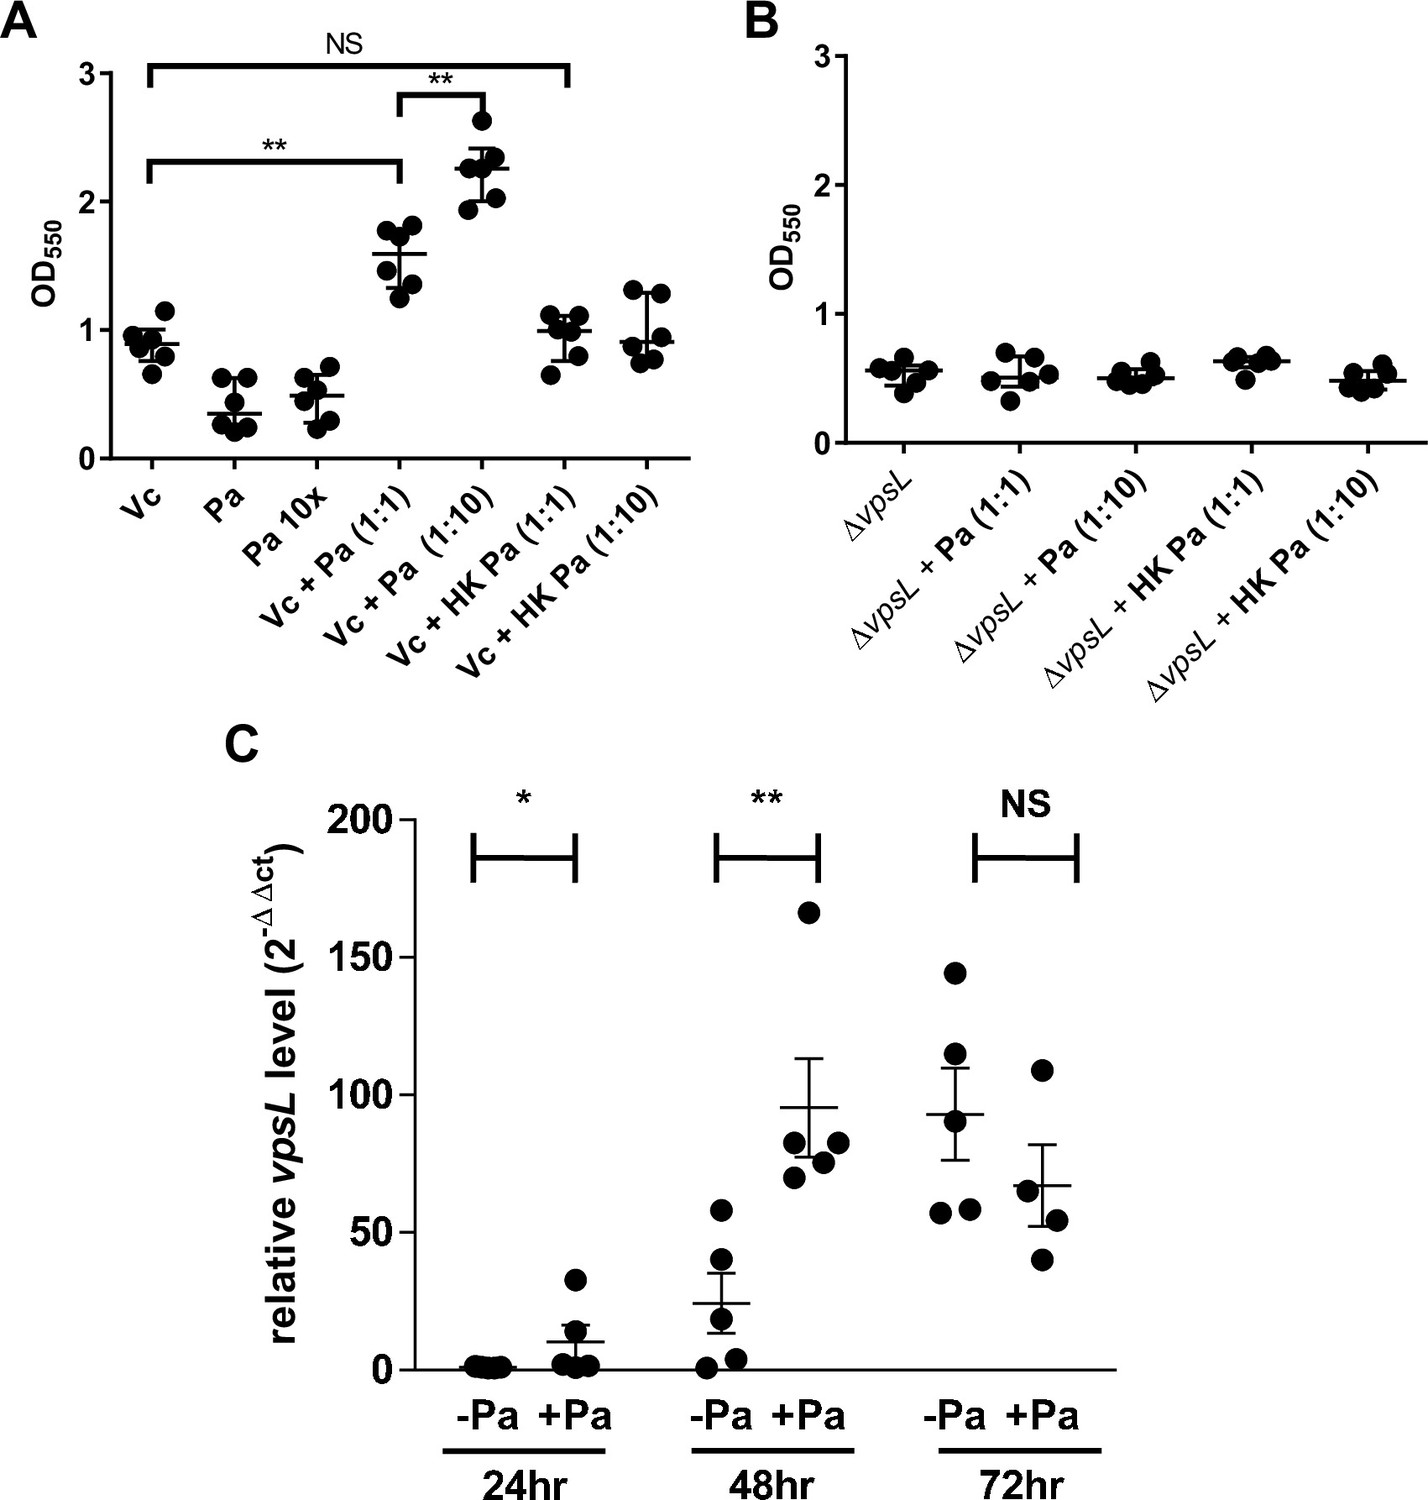
Paracoccus aminovorans (Pa) increases biofilm production in Vibrio cholerae (Vc).
Crystal violet assays were performed in 96-well microtiter plates to quantify biofilm formation. Overnight-grown (A) wild-type Vc or (B) ∆vpsL mutant and Pa cultures were diluted to a final concentration of 106 colony-forming unit (CFU) in a total volume of 200 µL/well. In samples containing a 1:10 ratio of Vc/Pa, Pa was diluted to a final concentration of 107 CFU. Samples with heat-killed (HK) Pa are specified on the x-axis. Microtiter plates were incubated at 37°C for 24 hr. Crystal violet staining and ethanol solubilization were performed as previously described (O’Toole, 2011). Absorbance of the crystal violet stain was measured at 550 nm using a BioTek Synergy HTX plate reader. Data are represented with horizontal lines indicating the mean with standard deviation. Unpaired U-test (Mann–Whitney); **p≤0.01. (C) Vc and Pa were co-cultured at a 1:10 ratio statically for 72 hr at 30°C. At the specified time points, culture from the air–liquid interface was sampled and the RNA extracted. Relative vpsL transcript levels were determined by qRT-PCR using housekeeping gene groEL and the ΔΔCT analytic method. Bars on graphs depict mean with standard error of mean (SEM). Mann–Whitney U-test was performed, **p<0.01, *p<0.05, NS p>0.05.
-
Figure 5—source data 1
Crystal violet assays of biofilm formed by Vc mono- and Vc/Pa co-cultures using WT with live or heat-killed Pa.
- https://cdn.elifesciences.org/articles/73010/elife-73010-fig5-data1-v3.xlsx
-
Figure 5—source data 2
Crystal violet staining of biofilm formed by Vc mono- and Vc/Pa co-cultures using vpsL mutants with live and heat-killed Pa.
- https://cdn.elifesciences.org/articles/73010/elife-73010-fig5-data2-v3.xlsx
-
Figure 5—source data 3
qRT-PCR analysis of vpsL gene in cells in biofilm formed by Vc mono- and Vc/Pa co-cultures.
- https://cdn.elifesciences.org/articles/73010/elife-73010-fig5-data3-v3.xlsx
Figure 6
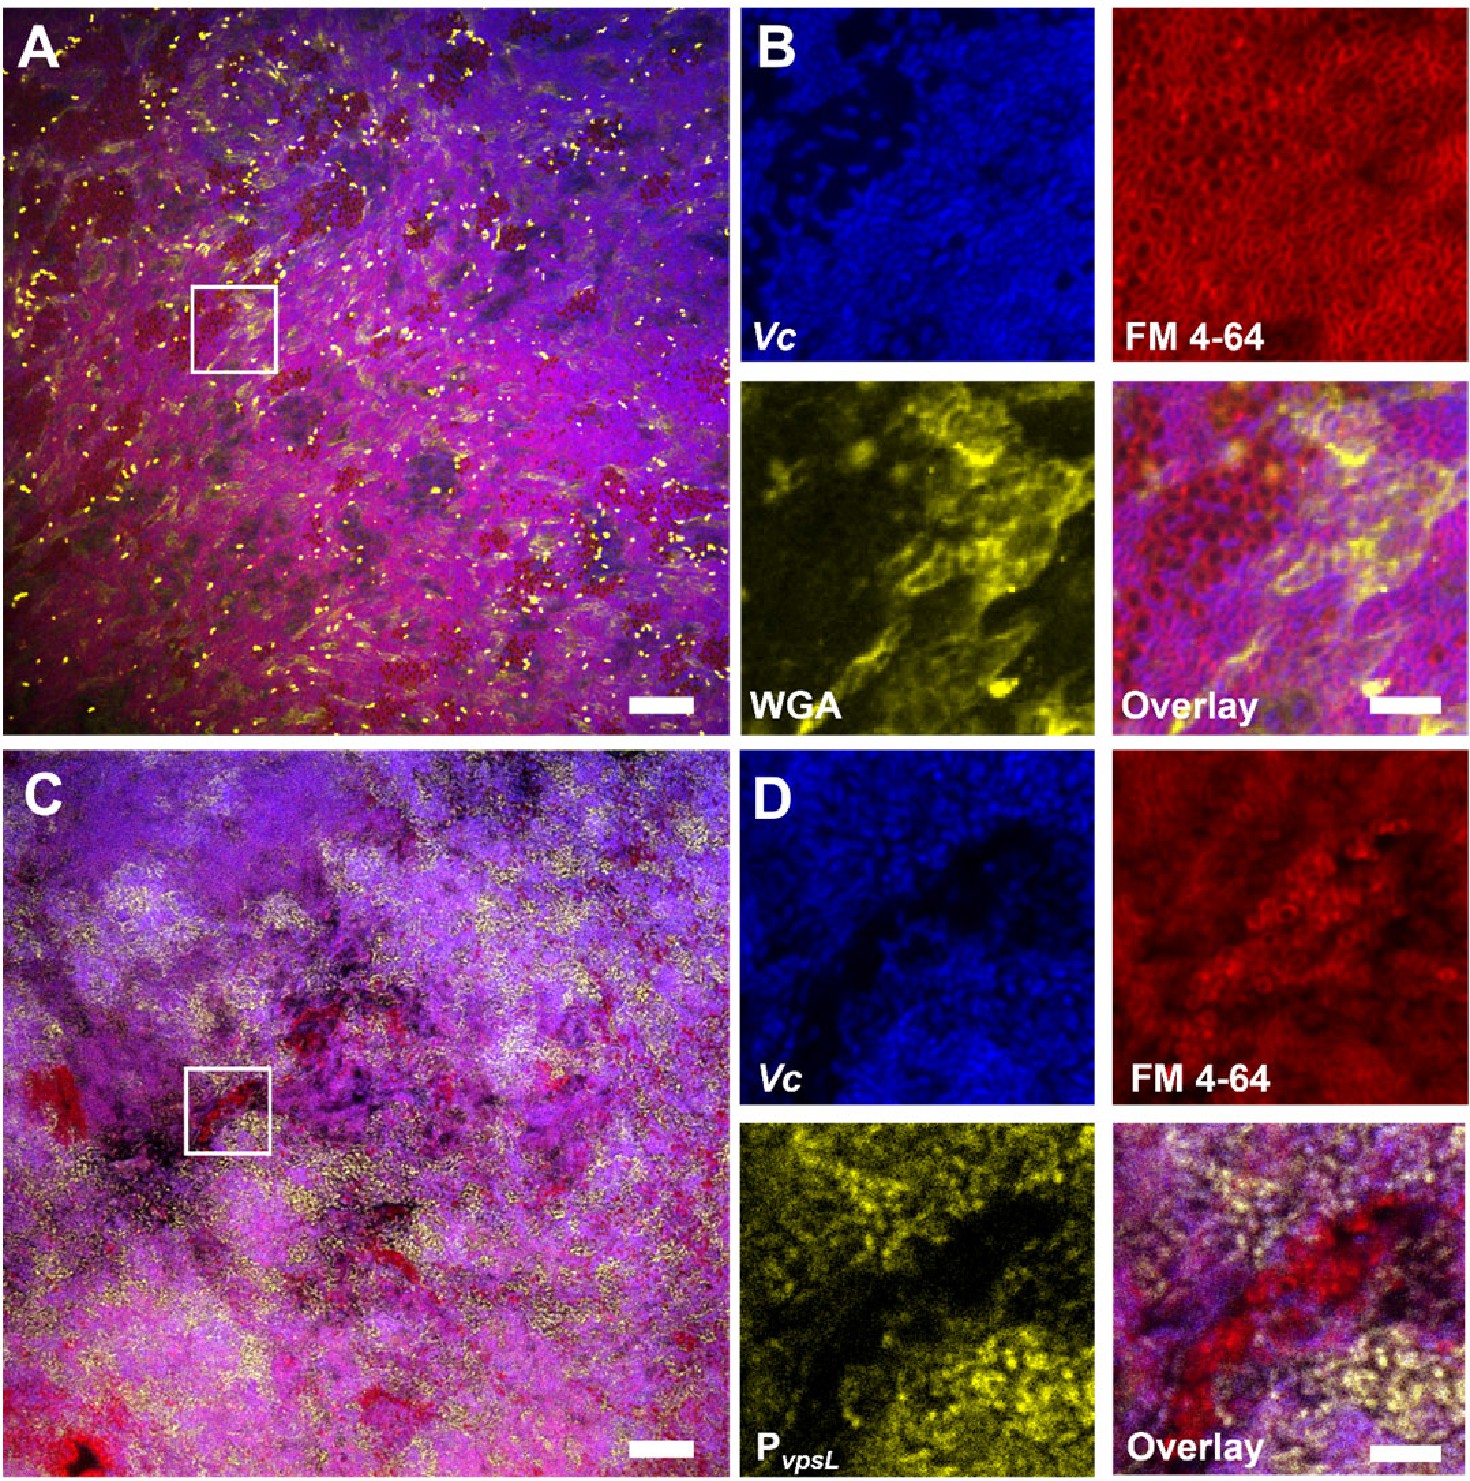
Vibrio cholerae/Paracoccus aminovorans (Vc/Pa) co-culture biofilms depend on Vibrio exopolysaccharide (VPS).
(A) Representative cross-sectional view of the bottom layer of a co-culture pellicle with wheat germ agglutinin (WGA) staining. Vc cells constitutively express SCFP3A cytosolically; all cells were stained with FM 4-64 membrane stain; WGA is conjugated to Oregon Green and shown in yellow. Note that WGA also stained dead cells with an exposed peptidoglycan layer, corresponding to the bright spots in the image. Scale bar: 20 µm. (B) Zoom-in view of the region highlighted by the white box in (A). Shown are separate channels from Vc cell fluorescence (SCFP3A, blue), membrane staining (FM 4-64, red), WGA staining (Oregon Green, yellow), and the overlay of the three channels. Pa cells can be distinguished from Vc cells by both the absence of SCFP3A fluorescence and the distinct cell shape. Scale bar: 5 µm. (C) Representative cross-sectional view of a co-culture pellicle in which the Vc cells harbor a PvpsL-mNeonGreen reporter. Scale bar: 20 µm. (D) Zoom-in view of the region highlighted by the white box in (C). Shown are separate channels from Vc cell fluorescence (SCFP3A, blue), membrane staining (FM 4-64, red), vpsL reporter (mNeonGreen, yellow), and the overlay of the three channels. Scale bar: 5 µm.
Figure 7 with 2 supplements
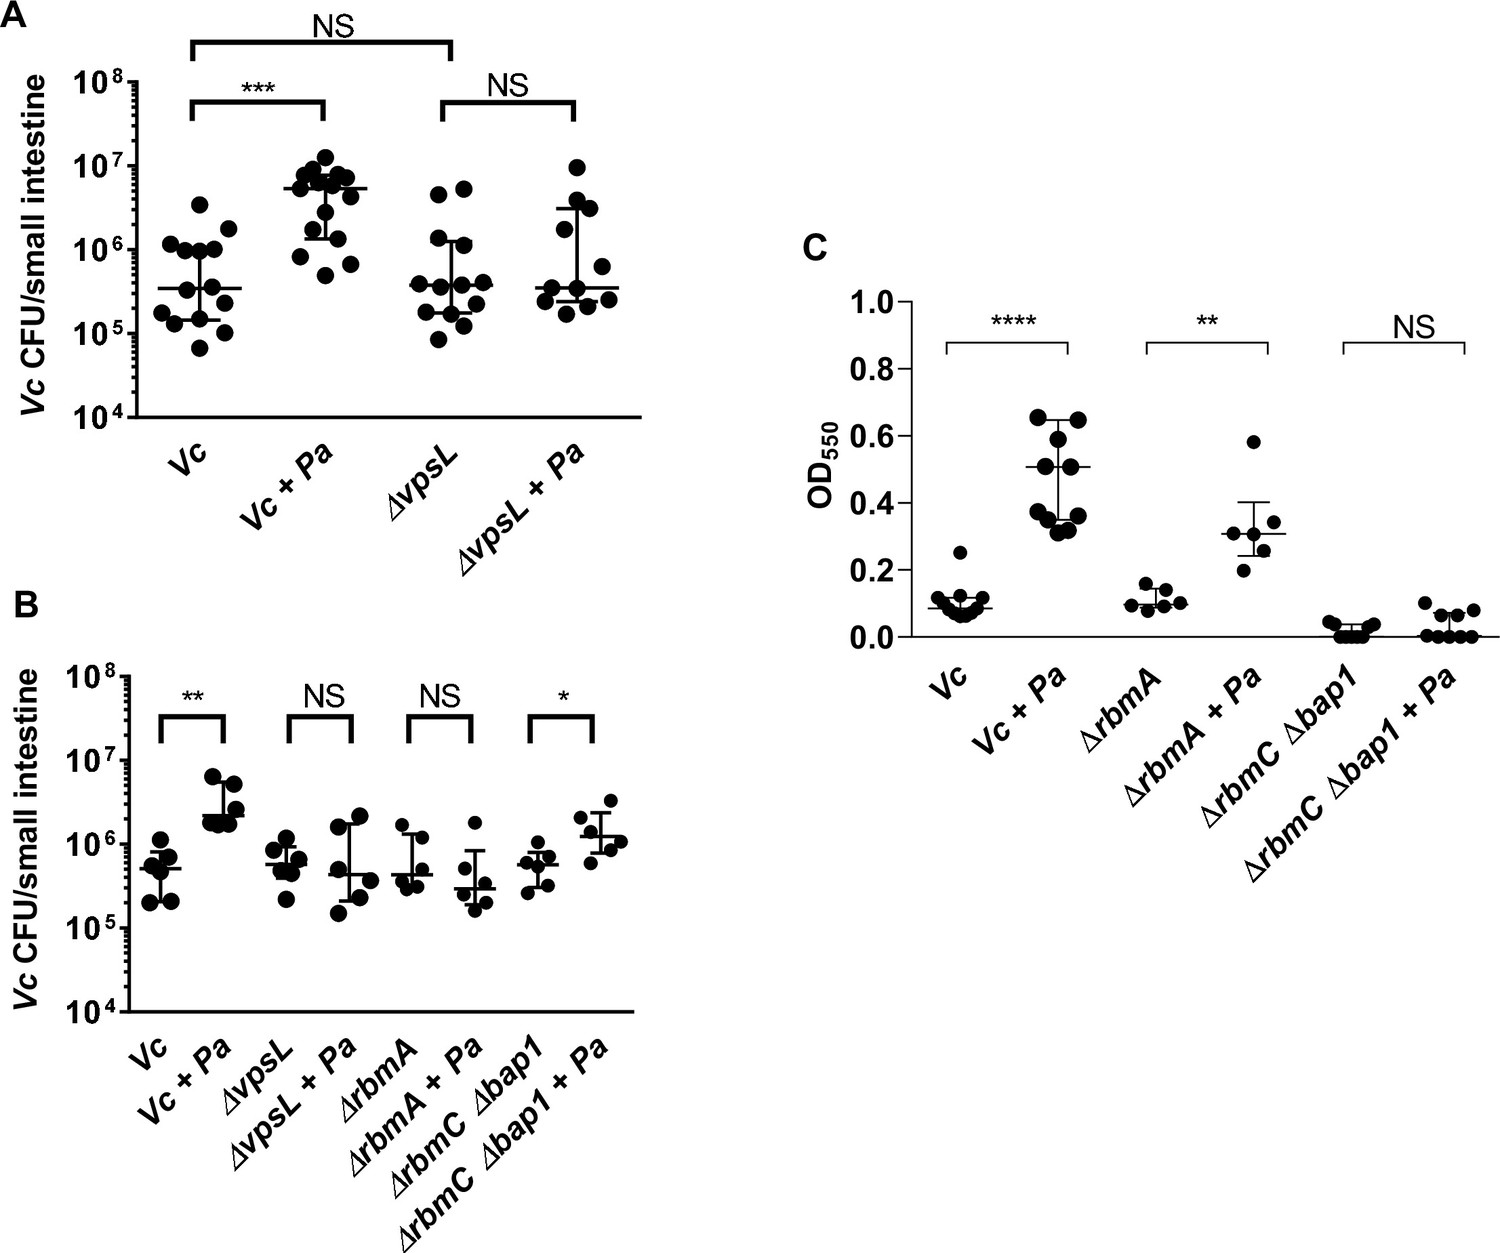
Enhanced Vibrio cholerae (Vc) intestinal colonization in the presence of Paracoccus aminovorans (Pa) is dependent on Vibrio exopolysaccharide (VPS) and accessory matrix proteins.
(A) 3-day-old infant mice were intragastrically inoculated with LB or 107 colony-forming unit (CFU) of Pa every 12 hr for a period of 48 hr, and subsequently infected with 106 CFU of a Vc strain defective for extracellular matrix production (∆vpsL). Mice were sacrificed 20–24 hr post infection, and small intestine samples were taken to enumerate Vc CFU. Data from infection with the wild-type Vc strain (Figure 2B) are shown again here for comparison purposes. (B) Vc WT or different biofilm mutants were mixed with Pa in 1:1 ratio, and the mixture was used immediately for animal infection. Mice were sacrificed 20–24 hr post infection, and small intestine samples were taken to enumerate Vc CFU. Each symbol represents an individual mouse. Data from infection with the WT Vc strain (Figure 2C) are shown again here for comparison purposes. (C) Crystal violet assays performed in 96-well plates to quantify pellicle formation. Overnight cultures of Vc ΔrbmA, ΔrbmC Δbap1, and Pa were diluted in fresh LB and plated as 200 µL/well. Samples were co-cultured in 1:10 ratios of Vc/Pa and incubated at 37°C for 24 hr. Crystal violet staining was then performed as previously described. For all panels, horizontal lines indicating medianwith standard deviation are shown. Unpaired Mann–Whitney U-test; ****p≤0.0001, ***p≤0.001, **p≤0.01, *p≤0.05, NS p>0.05.
-
Figure 7—source data 1
Viable cell count of Vc in the mouse intestine with and without Pa pre-colonization using Vc WT and vpsL mutants.
- https://cdn.elifesciences.org/articles/73010/elife-73010-fig7-data1-v3.xlsx
-
Figure 7—source data 2
Viable cell count of Vc in the mouse intestine with and without Pa pre-colonization using Vc WT and different biofilm matrix protein mutants.
- https://cdn.elifesciences.org/articles/73010/elife-73010-fig7-data2-v3.xlsx
-
Figure 7—source data 3
Crystal violet staining of biofilm formed by different biofilm matrix protein mutants with and without Pa.
- https://cdn.elifesciences.org/articles/73010/elife-73010-fig7-data3-v3.xlsx
Figure 7—figure supplement 1
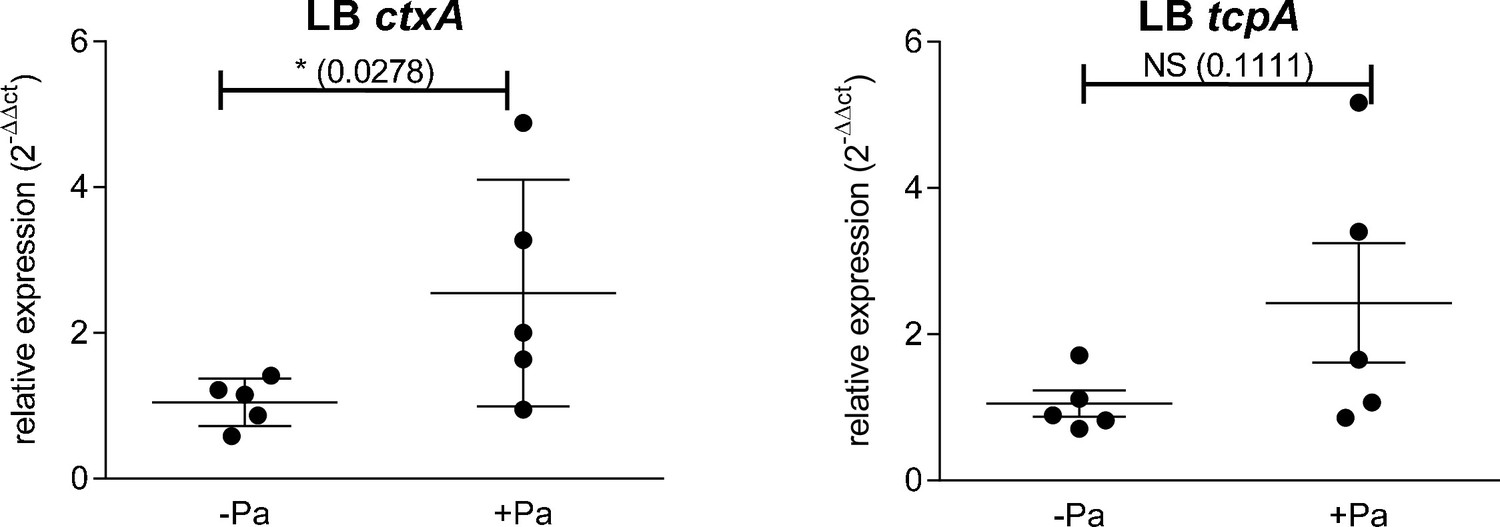
ctxA and tcpA gene expression in Vibrio cholerae (Vc) monoculture and Vibrio cholerae-Paracoccus aminovorans (Vc-Pa) co-culture.
Vc and Pa were co-cultured (1:10) statically for 24 hr, and bacteria in the air–liquid interface were sampled and RNA extracted. The relative ctxA and tcpA transcript levels were determined by qRT-PCR using housekeeping gene groEL and the ΔΔCT method. Bars on graphs depict mean with standard error of mean (SEM). Mann–Whitney U-test was performed, and p-values are shown.
-
Figure 7—figure supplement 1—source data 1
qRT-PCR analysis of virulence genes in Vc with and without Pa.
- https://cdn.elifesciences.org/articles/73010/elife-73010-fig7-figsupp1-data1-v3.xlsx
Figure 7—figure supplement 2
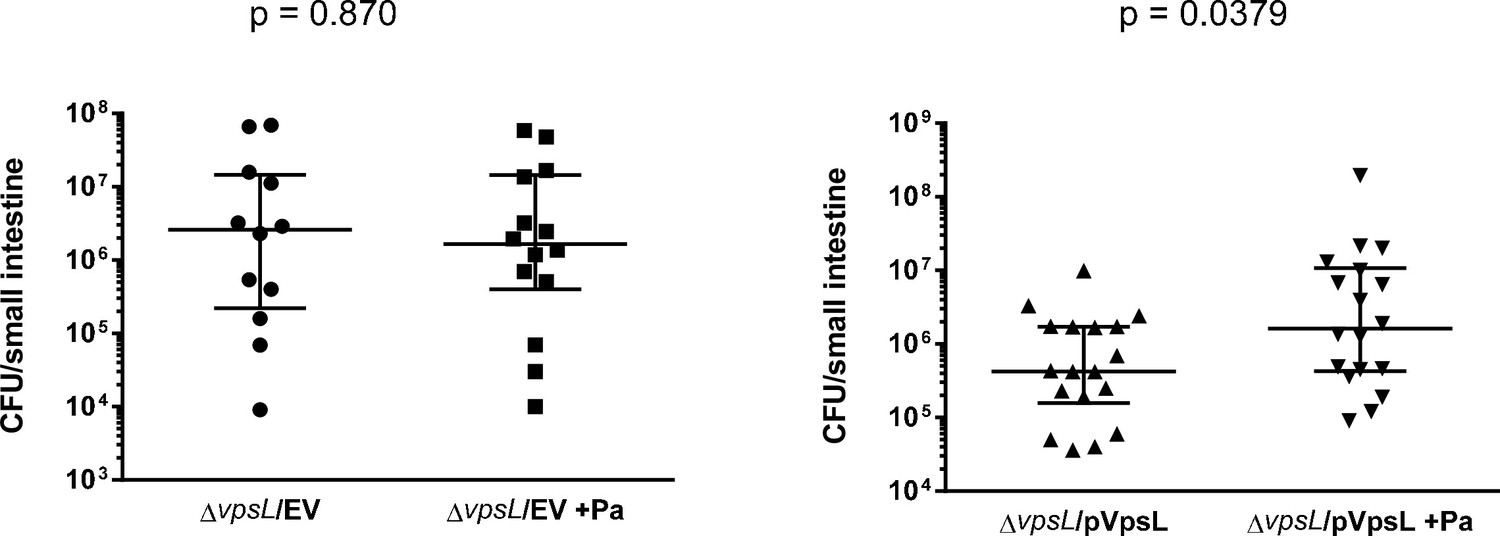
Complementation of vpsL mutant in vivo.
The loss of colonization enhancement of ∆vpsL mutants in the presence of Paracoccus aminovorans (Pa) is restored by the introduction of a plasmid constitutively expressed vpsL. Mann–Whitney U-test, specific p-values are shown.
-
Figure 7—figure supplement 2—source data 1
Viable cell count of Vc in mouse intestine with and without Pa pre-colonization using vpsL mutant with and without vpsL complementation plasmid.
- https://cdn.elifesciences.org/articles/73010/elife-73010-fig7-figsupp2-data1-v3.xlsx
Additional files
-
Supplementary file 1
Raw and normalised counts of Pa and Vc.
(a) Operational taxonomic unit raw and normalized abundance of Vibrio cholerae (Vc) in Paracoccus aminovorans (Pa) colonized and Pa noncolonized study participants with Vc infection. (b) Raw and normalized abundance of total, Pa, and Vc operational taxonomic units in all study participants.
- https://cdn.elifesciences.org/articles/73010/elife-73010-supp1-v3.xlsx
-
Transparent reporting form
- https://cdn.elifesciences.org/articles/73010/elife-73010-transrepform1-v3.pdf
Download links
A two-part list of links to download the article, or parts of the article, in various formats.
Downloads (link to download the article as PDF)
Open citations (links to open the citations from this article in various online reference manager services)
Cite this article (links to download the citations from this article in formats compatible with various reference manager tools)
Impact of a human gut microbe on Vibrio cholerae host colonization through biofilm enhancement
eLife 11:e73010.
https://doi.org/10.7554/eLife.73010


