Toxoplasma bradyzoites exhibit physiological plasticity of calcium and energy stores controlling motility and egress
- Department of Molecular Microbiology, Washington University in St. Louis, School of Medicine, United States
- Center for Tropical and Emerging Global Diseases and Department of Cellular Biology, University of Georgia, United States
Figures
Figure 1 with 2 supplements
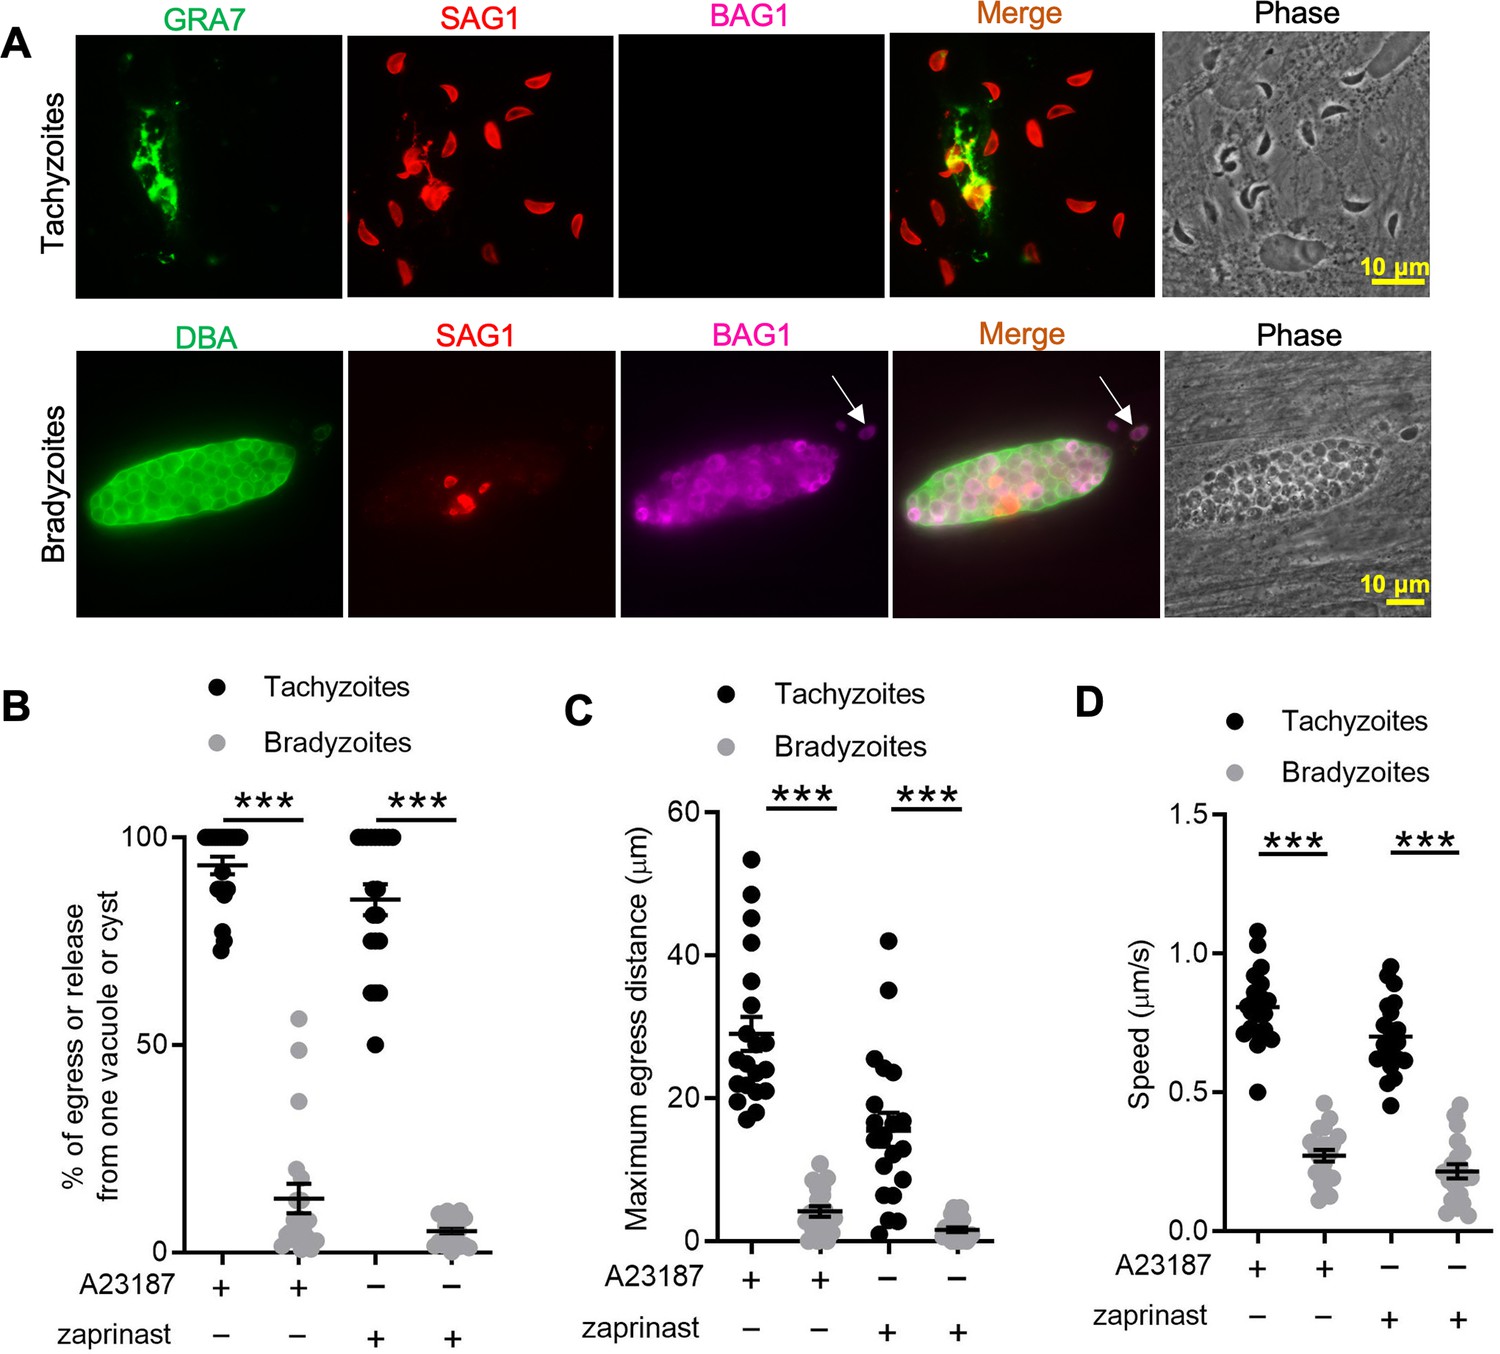
In vitro-induced bradyzoites show limited egress in response to Ca2+ agonists.
(A) Egress of tachyzoites and bradyzoites in response to A23187 (2 μM) for 15 min. Anti-GRA7, anti-SAG1, and anti-BAG1 antibodies followed by secondary antibodies to Alexa conjugated fluorochromes were used to detect the parasitophorous vacuole (PV) membrane, tachyzoites, and bradyzoites, respectively. Dolichos biflorus agglutinin (DBA) conjugated to FITC was used to stain the cyst wall. Arrow indicates released bradyzoites. Scale bar = 10 μm. (B) Quantitative analysis of egress in response to A23187 (2 μM) or zaprinast (500 μM) in extracellular buffer (EC) with Ca2+ for 15 min. Each data point represents the percentage of egressed or released parasites from one PV or cyst (n = 20). Means ± SD of two independent experiments with 20 replicates. Two-tailed Mann–Whitney test, ***p<0.001. (C) Quantitative analysis of maximum distance egressed or released parasites moved away from the vacuole/cyst in response to A23187 (2 μM) or zaprinast (500 μM) in EC buffer with Ca2+ for 15 min. Each data point represents distance traveled of one egressed tachyzoite or released bradyzoite from the original PV or cyst (n = 20). Means ± SD of two independent experiments with 20 replicates. Two-tailed Mann–Whitney test, ***p<0.001. (D) Quantitative analysis of speed (μm/s) of egressed or released parasites in response to A23187 (2 μM) or zaprinast (500 μM) in EC buffer with Ca2+ for 15 min by time-lapse microscopy. Mean speed was determined by time-lapse recording during the first 1 min after egress or release. Each data point represents migration speed of a single egressed tachyzoites or released bradyzoites from original PV or cyst (n = 20). Means ± SD of two independent experiments with 20 replicates. Two-tailed unpaired Student’s t-test, ***p<0.001.
-
Figure 1—source data 1
Percentage of egress or release from one vacuole or cyst (related to Figure 1B).
- https://cdn.elifesciences.org/articles/73011/elife-73011-fig1-data1-v3.xlsx
-
Figure 1—source data 2
Maximum egress distance of egressed or released parasites (related to Figure 1C).
- https://cdn.elifesciences.org/articles/73011/elife-73011-fig1-data2-v3.xlsx
-
Figure 1—source data 3
Speed of egressed or released parasites (related to Figure 1D).
- https://cdn.elifesciences.org/articles/73011/elife-73011-fig1-data3-v3.xlsx
Figure 1—video 1
Egress by ME49 BAG1-mCherry tachyzoites in response to A23187.
Time-lapse video microscopy showing A23187 (2 μM)-induced egress of ME49 BAG1-mCherry strain tachyzoites grown in vitro in human foreskin fibroblast (HFF) cells for 24 hr. Videos for intracellular tachyzoites in extracellular (EC) buffer were recorded for 10 min, and A23187 (2 μM) was added 30 s after the recording was initiated. Display frame rate is 8 frames per second while the acquisition frame rate is 3 frames per second. Bar = 10 μm.
Figure 1—video 2
Egress by ME49 BAG1-mCherry bradyzoites in response to A23187.
Time-lapse video microscopy showing A23187 (2 μM)-induced egress of ME49 BAG1-mCherry strain bradyzoites induced by in vitro culture on human foreskin fibroblast (HFF) cells for 7 days at pH 8.2. Videos for intracellular bradyzoites in extracellular (EC) buffer were recorded for 10 min, and A23187 (2 μM) was added 30 s after the recording was initiated. Display frame rate is 4 frames per second while the acquisition frame rate is 10 frames per second. Bar = 10 μm.
Figure 2 with 4 supplements
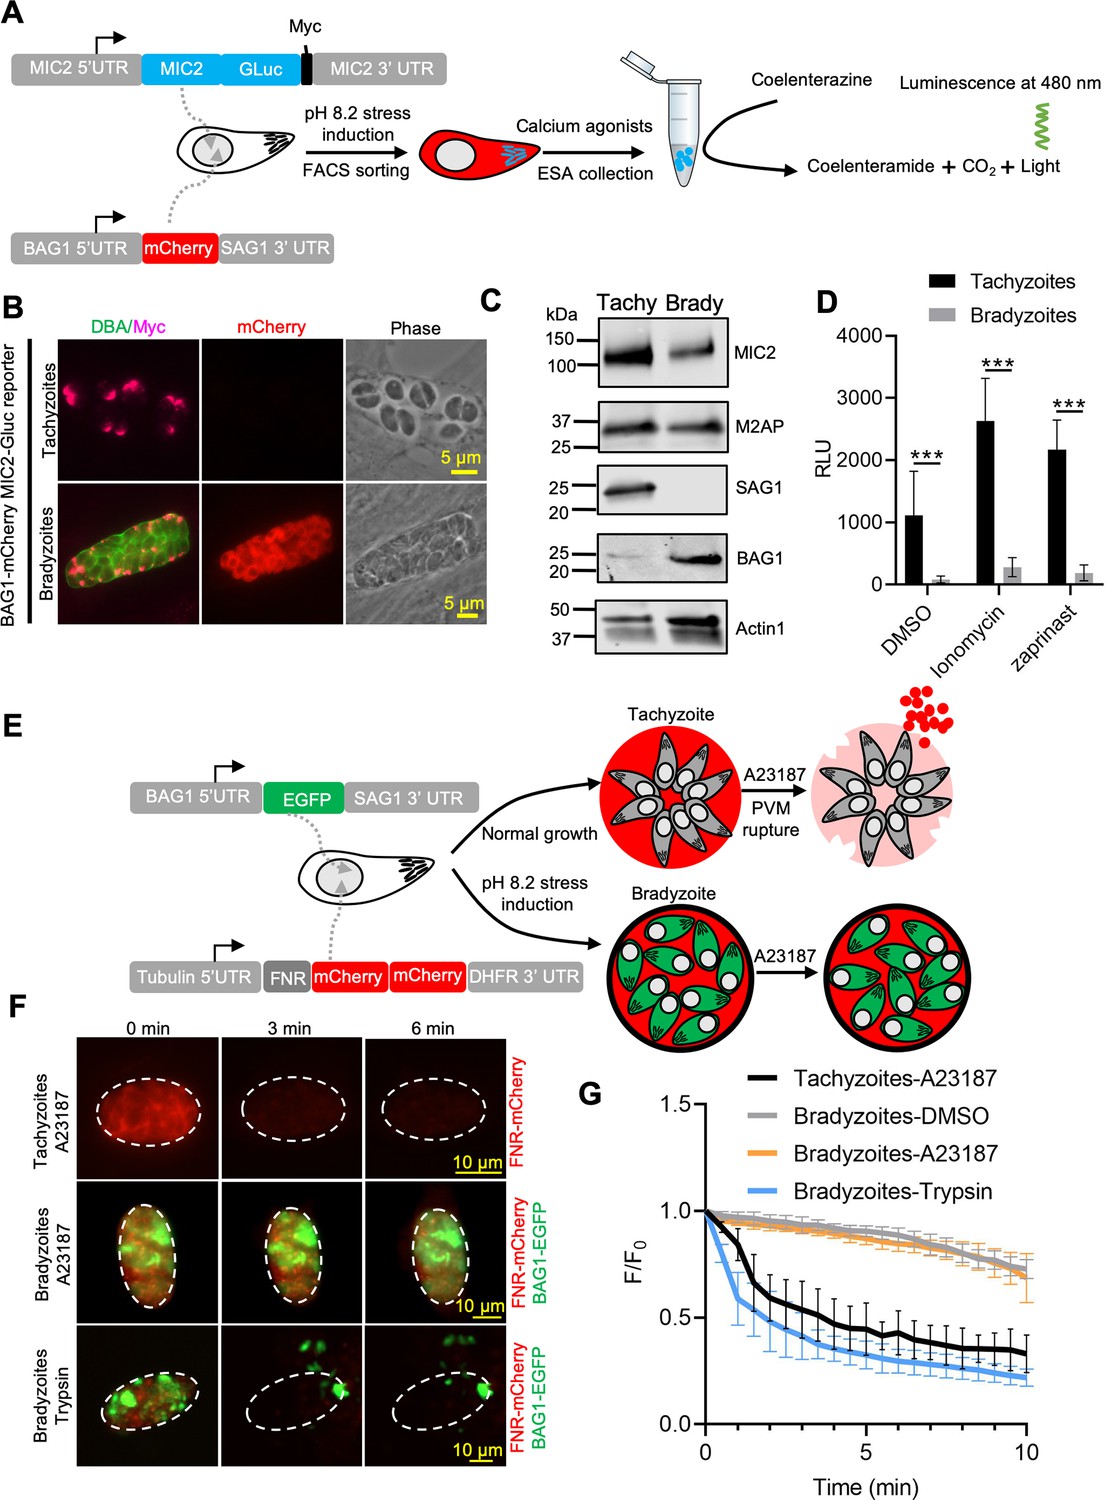
Ca2+-dependent microneme secretion is significantly dampened in bradyzoites.
(A) Schematic of bradyzoites MIC2 secretion assay using ME49 BAG1-mCherry MIC2-GLuc bradyzoites, differentiated in vitro by cultivation at pH 8.2 for 7 days, based on fluorescence-activated cell sorting (FACS). (B) Immunofluorescence assay (IFA) analysis showing localization of MIC2-Gluc in bradyzoites induced for 7 days at pH 8.2. MIC2-Gluc was stained with anti-Myc antibody, bradyzoites were detected with anti-mCherry, followed by secondary antibodies conjugated with Alexa Fluor dyes, and the cyst wall was stained with DBA-FITC. Bar = 5 μm. (C) Western blots showing the expression of MIC2-Gluc and M2AP in tachyzoites and bradyzoites (induced for 7 days at pH 8.2, purified by magnetic beads and released from in vitro cysts by 0.25 mg/ml trypsin) of ME49 BAG1-mCherry MIC2-GLuc reporter. αMyc and αM2AP antibodies were used to probe the expression of MIC2-GLuc and M2AP, respectively. SAG1 and BAG1 serve as the stage-specific markers of tachyzoites and bradyzoites, respectively. Actin was used as a loading control. (D) ME49 BAG1-mCherry MIC2-Gluc tachyzoites or bradyzoites sorted by FACS and resuspended in extracellular (EC) buffer with Ca2+ were stimulated by 0.1% DMSO, ionomycin (1 μM), or zaprinast (500 μM) for 10 min at 37°C. Release of MIC2-GLuc in excretory-secretory antigens (ESA) was determined using a Gaussia luciferase assay. RLU indicates relative light units. Means ± SEM of three independent experiments each with three replicates. Multiple Student’s t-tests, ***p<0.001. (E) Schematic illustration of the FNR-mCherry BAG1-EGFP dual fluorescence reporter and leakage of FNR-mCherry from the parasitophorous vacuole (PV) (top) or cyst matrix (bottom) following A23187-induced membrane permeabilization. (F) FNR-mCherry leakage was monitored by time-lapse imaging of FNR-mCherry after A23187 (2 μM) treatment. FNR-mCherry BAG1-EGFP tachyzoites cultured under normal condition for 24 hr or bradyzoites induced for 7 days at pH 8.2 were treated with A23187 (2 μM) or 0.25 mg/ml trypsin in EC buffer with Ca2+ for 10 min at 37℃. Dash circle indicates the region of interest (ROI) for measurement of fluorescence intensity. Bar = 10 μm. (G) FNR-mCherry fluorescence (F) over the initial signal (F0) vs. time from cells treated as in (F). Curves are made of data from five independent vacuoles or cysts and shown as means ± SD. Bradyzoites treated with the DMSO group were used to assess photobleaching of mCherry (gray line). DBA, Dolichos biflorus agglutinin.
-
Figure 2—source data 1
Western blotting analysis of ME49 BAG1-mCherry MIC2-GLuc reporter parasites (related to Figure 2C).
- https://cdn.elifesciences.org/articles/73011/elife-73011-fig2-data1-v3.xlsx
-
Figure 2—source data 2
Determining MIC2-Gluc secretion by parasites using Gaussia luciferase assay (related to Figure 2D).
- https://cdn.elifesciences.org/articles/73011/elife-73011-fig2-data2-v3.xlsx
-
Figure 2—source data 3
Monitoring leakage of FNR-mCherry from the parasitophorous vacuole (PV) or cyst matrix following A23187-induced membrane permeabilization (related to Figure 2G).
- https://cdn.elifesciences.org/articles/73011/elife-73011-fig2-data3-v3.xlsx
Figure 2—figure supplement 1

Validation of ME49 BAG1-mCherry MIC2-GLuc reporter.
(A) Immunofluorescence assay (IFA) analysis showing co-localization of MIC2-Gluc with M2AP in bradyzoites induced for 7 days at pH 8.2. MIC2-Gluc was stained with anti-Myc antibody, M2AP was detected with anti-M2AP, followed by secondary antibodies conjugated with Alexa Fluor dyes, and the cyst wall was stained with biotinylated Dolichos biflorus agglutinin (DBA), followed by Alexa Fluor 647 conjugated streptavidin. Bar = 5 μm. (B) Bradyzoites expressing BAG1-mCherry were induced for 7 days at pH 8.2, mechanically liberated from cysts by 0.25 mg/ml trypsin for 5 min in intracellular buffer (IC buffer), and collected by fluorescence-activated cell sorting (FACS) after gating with parental ME49 ∆hxgprt::Fluc parasites.
Figure 2—video 1
A23187-induced permeabilization of the parasitophorous vacuole membrane (PVM) detected by vacuolar leakage of FNR-mCherry secreted by tachyzoites.
Time-lapse video microscopy showing A23187 (2 μM)-induced FNR-mCherry leakage from the PV surrounding FNR-mCherry BAG1-EGFP expressing tachyzoites. FNR-mCherry BAG1-EGFP tachyzoites cultured under normal condition in human foreskin fibroblast (HFF) cells for 24 hr were treated with A23187 (2 μM) in extracellular (EC) buffer for 10 min at 37℃. Videos were recorded for 10 min, and A23187 (2 μM) was added 30 s after the recording was initiated. Display frame rate is 6 frames per second while the acquisition frame rate is 5 frames per second. Bar = 5 μm.
Figure 2—video 2
Trypsin-induced disruption of in vitro-differentiated tissue cysts expressing ME49 FNR-mCherry BAG1-EGFP.
Time-lapse video microscopy showing A23187-induced FNR-mCherry leakage in vitro-differentiated tissue cysts of FNR-mCherry BAG1-EGFP bradyzoites. FNR-mCherry BAG1-EGFP bradyzoites induced by cultivation in human foreskin fibroblast (HFF) cells in vitro for 7 days at pH 8.2 were treated with 0.25 mg/ml trypsin in extracellular (EC) buffer for 6 min at 37℃. Videos were recorded for 6 min, and 0.25 mg/ml trypsin was added 30 s after the recording was initiated. Display frame rate is 3 frames per second while the acquisition frame rate is 15 frames per second. Bar = 5 μm.
Figure 2—video 3
A23187-induced permeabilization of in vitro-differentiated tissue cysts detected by vacuolar FNR-mCherry leakage from ME49 FNR-mCherry BAG1-EGFP bradyzoites.
Time-lapse video microscopy showing A23187 (2 μM)-induced FNR-mCherry leakage from in vitro-differentiated cysts of FNR-mCherry BAG1-EGFP. FNR-mCherry BAG1-EGFP bradyzoites induced by cultivation in human foreskin fibroblast (HFF) cells in vitro for 7 days at pH 8.2 were treated with A23187 (2 μM) in extracellular (EC) buffer for 10 min at 37℃. Videos were recorded for 10 min, and A23187 (2 μM) was added 30 s after the recording was initiated. Display frame rate is 3 frames per second while the acquisition frame rate is 15 frames per second. Bar = 5 μm.
Figure 3 with 3 supplements

Ca2+ signaling is dampened during in vitro bradyzoite development induced by alkaline pH.
(A) Schematic of generation of BAG1-mCherry and GCaMP6f dual fluorescent reporter to monitor Ca2+ responses in bradyzoites. (B) Time-lapse images of BAG1-mCherry GCaMP6f tachyzoites cultured for 24 hr vs. bradyzoites induced for 7 days at pH 8.2 in response to A23187 (2 μM) in extracellular (EC) buffer with Ca2+ for 10 min. Bar = 20 μm. (C) Time for reaching Ca2+ peak level in response to A23187 (2 μM) for BAG1-mCherry GCaMP6f-expressing tachyzoites and bradyzoites induced at pH 8.2. Data points of each group represent 10 cysts or vacuoles. Means ± SD of two independent experiments (n = 10). One-way ANOVA with Dunn’s multiple comparison correction test **p<0.01, ***p<0.001. (D) Monitoring the relative intensity of GCaMP6f fluorescence fold change (F/F0) vs. time for intracellular tachyzoites and in vitro-induced bradyzoites induced at pH 8.2. Cells were treated with A23187 (2 μM) in EC buffer without Ca2+ for 10 min. Curves are the mean fluorescence intensity of five vacuoles or cysts and shown as means ± SD. Arrow indicates time of addition of A23187. (E) Monitoring the relative intensity of GCaMP6f fluorescence vs. time for intracellular tachyzoites and in vitro-induced bradyzoites (5 days at pH 8.2). Cells were treated with A23187 (2 μM) or zaprinast (500 μM) in EC buffer with Ca2+. Arrow indicates time of addition of agonists. Curves represent the mean data of five independent cysts or vacuoles and are shown as means ± SD. (F) Live time-lapse imaging of BAG1-mCherry GCaMP6f bradyzoites induced for 7 days at pH 8.2 in response to A23187 (2 μM) in EC buffer with Ca2+. Cells were imaged by spinning disc confocal microscopy after reaching Ca2+ peak levels (left panel). Right panel shows its corresponding zoomed-in images. The interval between two continuous images is 10 s, white asterisks in the latter image (4′06″) indicate motile bradyzoites by comparison with the former image (3′56″). Bar = 10 μm. (G) Motility of parasites within parasitophorous vacuoles (PVs) or cysts was analyzed by time-lapse spinning disc confocal microscopy and tracking of individual parasites for 5 min after reaching Ca2+ peak levels in response to A23187 (2 μM) or zaprinast (500 μM) in EC buffer with Ca2+. Each data point represents parasites from one vacuole or cyst (n = 10). Data come from two independent experiments. Two-tailed Mann–Whitney test, ***p<0.001. Lines and error bars represent means ± SD of two independent experiments (n = 10).
-
Figure 3—source data 1
Time of Ca2+ dual reporter tachyzoites and bradyzoites with different ages to Ca2+ peak level in response to A23187 (related to Figure 3C).
- https://cdn.elifesciences.org/articles/73011/elife-73011-fig3-data1-v3.xlsx
-
Figure 3—source data 2
GCaMP6f fluorescence intensity changes vs. time of GCaMP6f BAG1-mCherry tachyzoites and bradyzoites (related to Figure 3D).
- https://cdn.elifesciences.org/articles/73011/elife-73011-fig3-data2-v3.xlsx
-
Figure 3—source data 3
Zaprinast-induced Ca2+ responses in GCaMP6f BAG1-mCherry tachyzoites and bradyzoites (related to Figure 3E).
- https://cdn.elifesciences.org/articles/73011/elife-73011-fig3-data3-v3.xlsx
-
Figure 3—source data 4
Percentage of motile parasites within parasitophorous vacuole or cyst in response to Ca2+ agonists (related to Figure 3G).
- https://cdn.elifesciences.org/articles/73011/elife-73011-fig3-data4-v3.xlsx
Figure 3—figure supplement 1
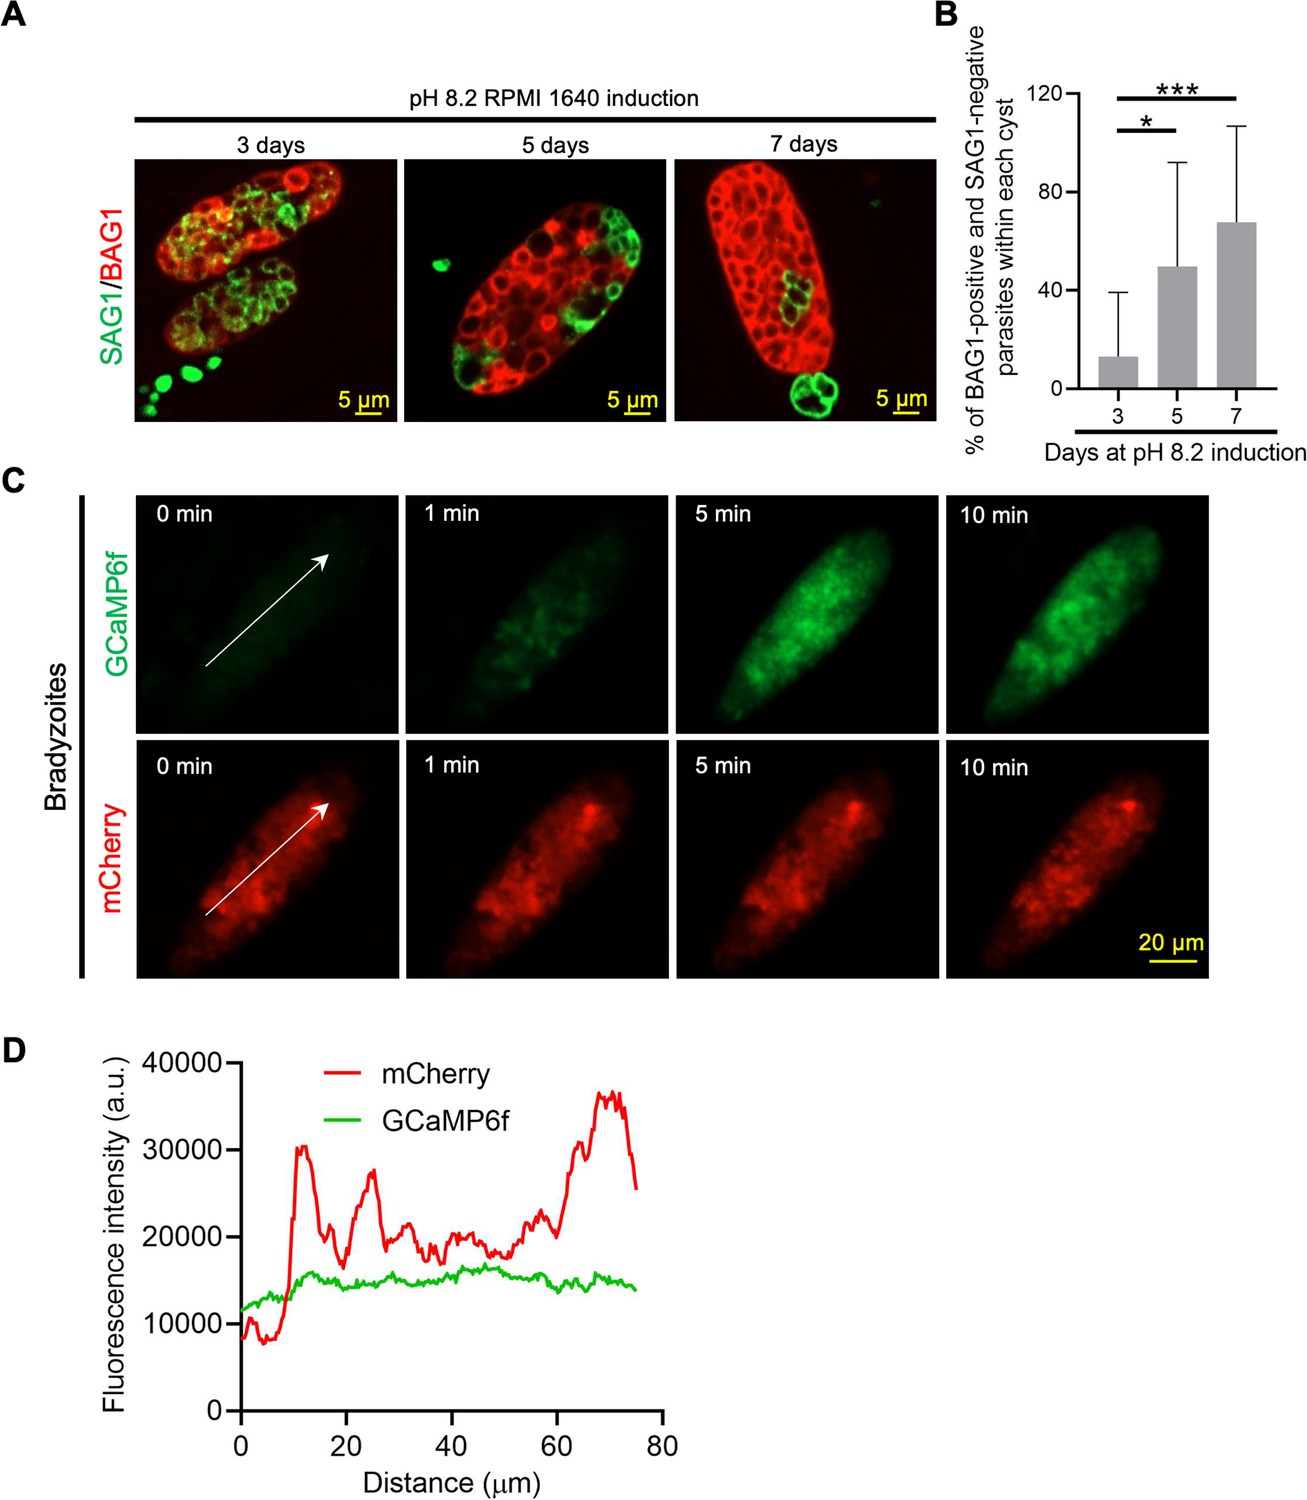
Effect of developmental heterology of bradyzoites on GCaMP6f basal signals.
(A) Immunofluorescence assay (IFA) analysis of differentiation of bradyzoites within single cyst induced at pH 8.2 for 3, 5, and 7 days using spinning disc confocal microscopy. BAG1 and SAG1 were detected with rabbit anti-BAG1 and DG52 monoclonal antibodies, respectively, followed by secondary antibodies conjugated with Alexa Fluor dyes. Bar = 5 μm. (B) Fractions of BAG1-positive and SAG1-negative parasites within single cyst were quantified using bradyzoites induced for 3, 5, and 7 days at alkaline pH based on spinning disc confocal microscopy imaging from (A). Data are represented as means ± SD of two independent experiments (n = 20). Kruskal–Wallis test with Dunn’s multiple comparison correction, *p<0.05, ***p<0.001. (C) Separated GCaMP6f and BAG1-mCherry channels of time-lapse images of BAG1-mCherry GCaMP6f reporter bradyzoites in response to A23187 in Figure 3B. Bradyzoites were induced for 7 days at pH 8.2 and then treated with A23187 (2 μM) in extracellular (EC) buffer with Ca2+ for 10 min. White arrow transects several parasites with different expression of BAG1-mCherry. Bar = 20 μm. (D) BAG1-mCherry and GCaMP6f fluorescent intensities of parasites indicated by the white arrow in (C) at starting time point (0 min).
-
Figure 3—figure supplement 1—source data 1
Developmental heterology of bradyzoites within cyst induced in vitro (related to Figure 3—figure supplement 1B).
- https://cdn.elifesciences.org/articles/73011/elife-73011-fig3-figsupp1-data1-v3.xlsx
-
Figure 3—figure supplement 1—source data 2
Fluorescent intensities of BAG1-mCherry and GCaMP6f of bradyzoites within the same cyst (related to Figure 3—figure supplement 1D).
- https://cdn.elifesciences.org/articles/73011/elife-73011-fig3-figsupp1-data2-v3.xlsx
Figure 3—video 1
Ca2+ response of ME49 BAG1-Cherry GCaMP6f-expressing tachyzoites stimulated by A23187.
Time-lapse video microscopy showing GCaMP6f fluorescence changes of intracellular ME49 BAG1-mCherry GCaMP6f tachyzoites grown in human foreskin fibroblast (HFF) cells in vitro for 24 hr in response to A23187 (2 μM) in extracellular (EC) buffer. Videos were recorded for 10 min, and A23187 (2 μM) was added 30 s after the recording was initiated. Display frame rate is 10 frames per second while the acquisition frame rate is 3 frames per second. Bar = 10 μm.
Figure 3—video 2
Ca2+ response of ME49 BAG1-Cherry GCaMP6f-expressing bradyzoites stimulated by A23187.
Time-lapse video microscopy showing GCaMP6f fluorescence changes of intracellular ME49 BAG1-mCherry GCaMP6f bradyzoites induced by cultivation in human foreskin fibroblast (HFF) cells in vitro for 7 days at pH 8.2 in response to A23187 (2 μM) in extracellular (EC) buffer. Videos were recorded for 14 min, and A23187 (2 μM) was added 30 s after the recording was initiated. Display frame rate is 6 frames per second while the acquisition frame rate is 10 frames per second. Bar = 10 μm.
Figure 4 with 3 supplements

Ca2+ signaling is dampened in in vitro bradyzoites from spontaneously formed cysts in C2C12 muscle cells and cysts isolated from chronically infected mice.
(A) Microscopy-based assay for detection of bradyzoites naturally formed after 7 days of culture of the BAG1-mCherry GCaMP6f-expressing dual reporter strain in differentiated C2C12 muscle cells. Anti-myosin antibody was used to confirm the differentiation of C2C12 cells while BAG1 was used to detect bradyzoites followed by secondary antibodies conjugated with Alexa Fluor dyes. Bar = 20 μm. (B) Time-lapse recording of GCaMP6f fluorescence intensity from cysts of the BAG1-mCherry GCaMP6f strain naturally formed after 7 days culture in C2C12 cells. Cells were treated with A23187 (2 μM) in extracellular (EC) buffer with Ca2+. Bar = 10 μm. (C) GCaMP6f fluorescence intensity changes vs. time from tachyzoites cultured in undifferentiated myoblasts or cysts naturally formed after 10 days in differentiated C2C12 cells in response to A23187 (2 μM) or zaprinast (500 μM) in EC buffer with Ca2+. Curves represent mean data of five independent cysts or vacuoles and are shown as means ± SD. (D) Time for reaching Ca2+ peak levels in tachyzoites cultured in undifferentiated myoblasts and bradyzoites formed after 10 days culturing in C2C12 cells. Cells were treated with A23187 (2 μM) or zaprinast (500 μM) in EC buffer with Ca2+ for 10 min. Data points of each group come from 10 cysts or vacuoles of two independent experiments. Two-tailed unpaired Student’s t-test, ***p<0.001. Lines represent means ± SD of two independent experiments (n = 10). (E) Motility of parasites analyzed by time-lapse spinning disc confocal microscopy and tracking of individual parasites for 5 min after reaching Ca2+ peak levels in response to A23187 (2 μM) or zaprinast (500 μM) in EC buffer with Ca2+. Lines represent means ± SD of two independent experiments (n = 10). Two-tailed Mann–Whitney t-test, ***p<0.001. (F) Monitoring of GCaMP6f fluorescence in response to 0.1% DMSO, A23187 (2 μM), or zaprinast (500 μM) in EC buffer with Ca2+ in ex vivo cysts isolated from the brains of mice infected with BAG1-mCherry GCaMP6f reporter parasites. Cysts were harvested at 30 days post infection. Bar = 5 μm. (G) GCaMP6f fluorescence intensity changes vs. time within BAG1-mCherry GCaMP6f ex vivo cysts in response to A23187 (2 μM) or zaprinast (500 μM) in EC buffer with Ca2+. Curves are the mean data of five independent cysts and are shown as means ± SD. (H) Quantitative analysis of motility and egress by bradyzoites from ex vivo cysts isolated from CD-1 mice brain tissues at 30 days post infection. Motility was analyzed by time-lapse microscopy and tracking of individual parasites using time points similar to (D, E). Each data point represents percentage of motile or egressed parasites from one cyst (n = 5). Significance was determined by two-tailed Student’s t-test, n.s., not significant.
-
Figure 4—source data 1
GCaMP6f fluorescence intensity changes vs. time of GCaMP6f BAG1-mCherry tachyzoites and bradyzoites cultured in C2C12 muscle cells in response to Ca2+ agonists (related to Figure 4C).
- https://cdn.elifesciences.org/articles/73011/elife-73011-fig4-data1-v3.xlsx
-
Figure 4—source data 2
Time of tachyzoites and bradyzoites cultured in C2C12 muscle cells to reach GCaMP6f fluorescence peak in response to Ca2+ agonists (related to Figure 4D).
- https://cdn.elifesciences.org/articles/73011/elife-73011-fig4-data2-v3.xlsx
-
Figure 4—source data 3
Percentage of motile parasites within parasitophorous vacuole or cyst cultured in C2C12 muscle cells (related to Figure 4E).
- https://cdn.elifesciences.org/articles/73011/elife-73011-fig4-data3-v3.xlsx
-
Figure 4—source data 4
Calcium responses of ex vivo cysts in response to Ca2+ agonists (related to Figure 4G).
- https://cdn.elifesciences.org/articles/73011/elife-73011-fig4-data4-v3.xlsx
-
Figure 4—source data 5
Motility and egress of bradyzoites within ex vivo cysts isolated from chronically infected mice in response to A23187 (related to Figure 4H).
- https://cdn.elifesciences.org/articles/73011/elife-73011-fig4-data5-v3.xlsx
Figure 4—figure supplement 1
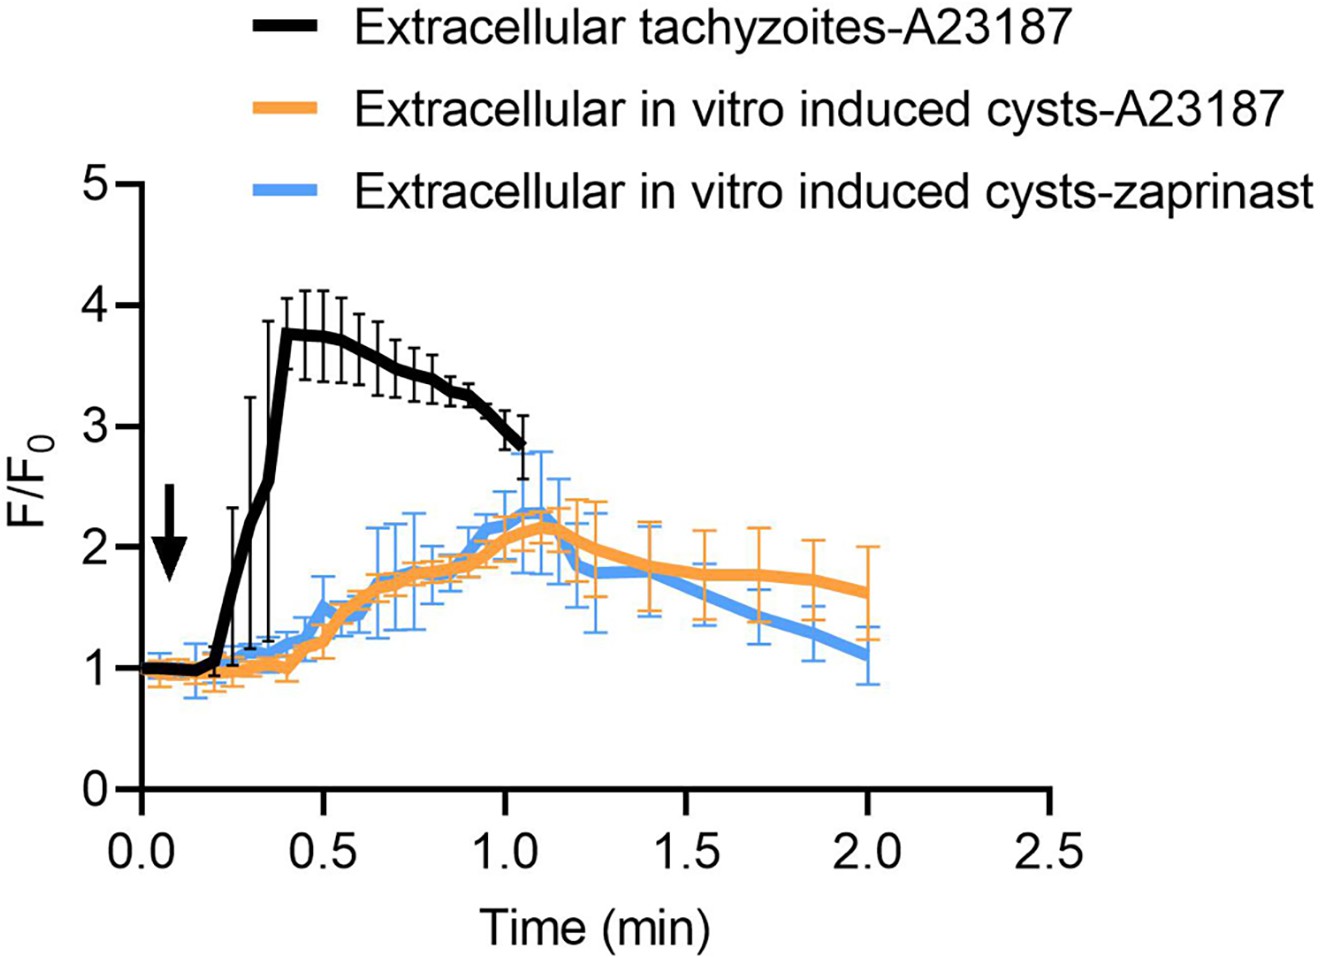
Calcium responses by extracellular tachyzoites and in vitro-produced tissue cysts.
Fluorescence recording of ME49 strain parasites expressing GCaMP6f in response to A23187 (2 μM) or zaprinast (500 μM). Freshly harvested extracellular tachyzoites were compared to cysts induced in vitro in pH 8.2 RPMI 1640 medium for 7 days. Arrow indicates time of addition of Ca2+ agonists. Each kinetic curve represents the mean of five independent samples and is shown as means ± SD.
-
Figure 4—figure supplement 1—source data 1
Calcium responses by extracellular tachyzoites and in vitro-produced tissue cysts (related to Figure 4—figure supplement 1A).
- https://cdn.elifesciences.org/articles/73011/elife-73011-fig4-figsupp1-data1-v3.xlsx
Figure 4—video 1
Ca2+ response of ME49 BAG1-mCherry GCaMP6f cysts isolated from chronically infected mouse brains and treated in vitro with DMSO.
Time-lapse video microscopy showing GCaMP6f fluorescence changes of ME49 BAG1-mCherry GCaMP6f cysts isolated 30 days post infection from the brains of chronically infected mice in response to DMSO (0.1%) in extracellular (EC) buffer. Videos were recorded for 5 min, and DMSO (0.1%) was added 15 s after the recording was initiated. Display frame rate is 6 frames per second while the acquisition frame rate is 3 frames per second. Bar = 2 μm.
Figure 4—video 2
Calcium response of ME49 BAG1-mCherry GCaMP6f cysts isolated from chronically infected mouse brains and treated in vitro with A23187.
Time-lapse video microscopy showing GCaMP6f fluorescence changes of ME49 BAG1-mCherry GCaMP6f cysts isolated 30 days post infection from chronically infected mice in response to A23187 (2 μM) in extracellular (EC) buffer. Videos were recorded for 5 min, and A23187 (2 μM) was added 15 s after the recording was initiated. Display frame rate is 6 frames per second while the acquisition frame rate is 5 frames per second. Bar = 2 μm.
Figure 5 with 2 supplements
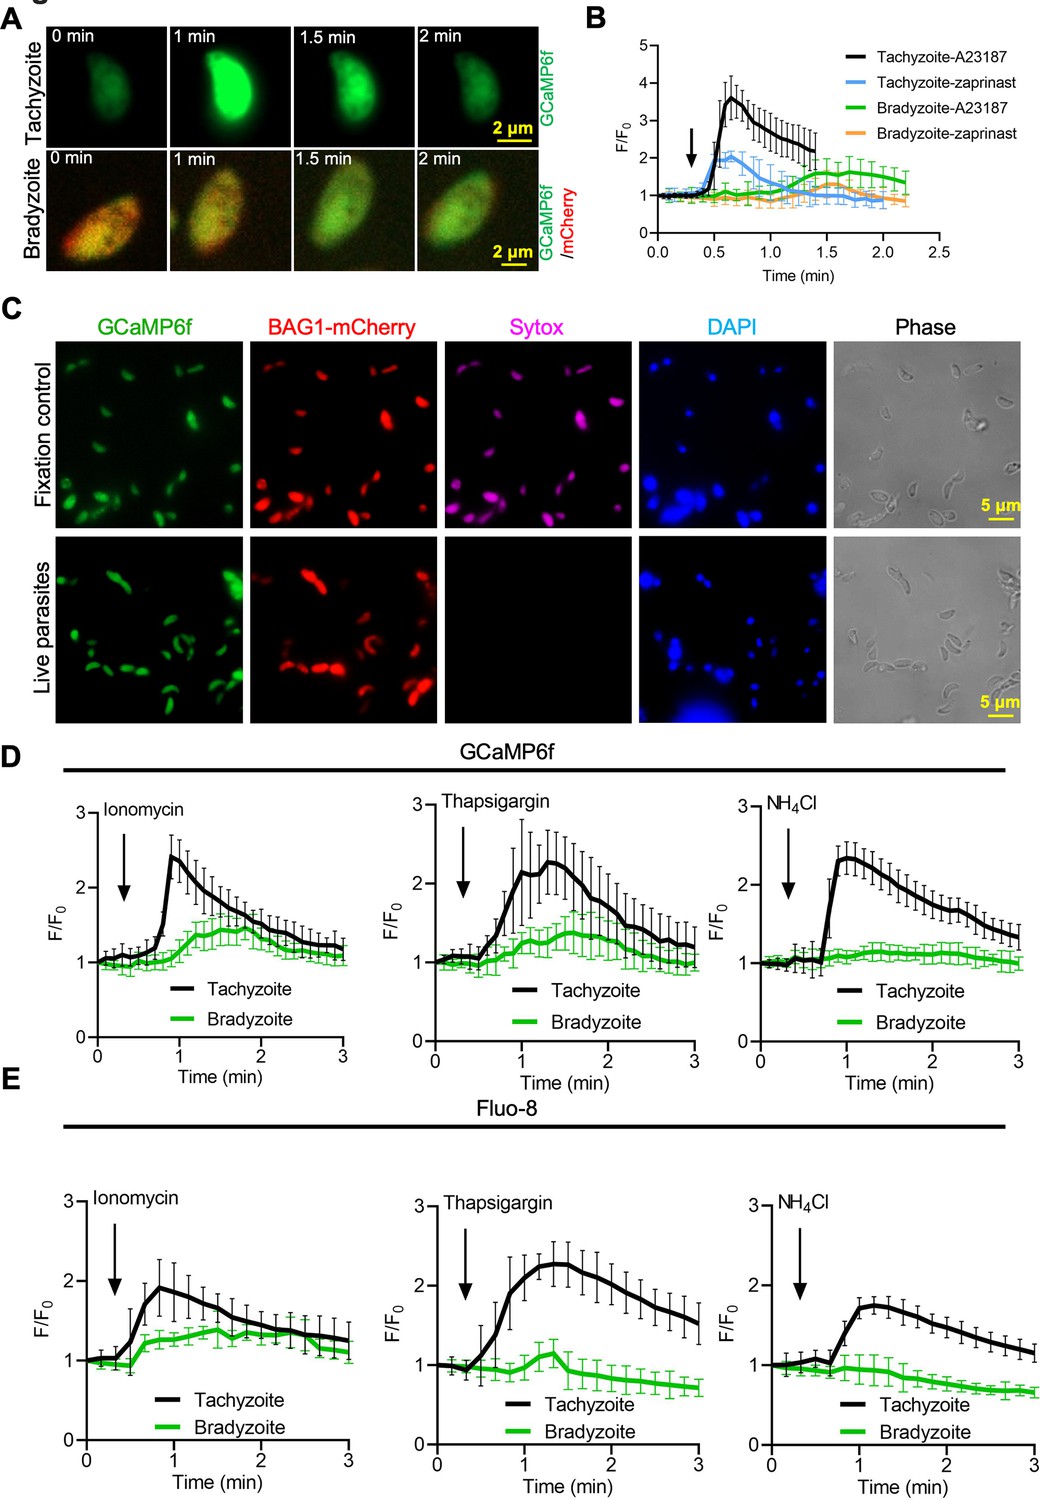
Bradyzoites have lower Ca2+ stores and reduced responses to agonists compared to tachyzoites.
(A) Live imaging of extracellular BAG1-mCherry GCaMP6f dual fluorescent reporter tachyzoites and bradyzoites induced for 7 days at pH 8.2 in response to A23187 (2 μM) in extracellular (EC) buffer with Ca2+. Bar = 2 μm. (B) Fluorescence recording of increased GCaMP6f fluorescence with Ca2+ increase in response to A23187 (2 μM) or zaprinast (500 μM) in EC buffer with Ca2+ for extracellular tachyzoites and bradyzoites. Arrow indicates the addition of Ca2+ agonists. Each curve is the mean of 10 individual parasites and shown as means ± SD. (C) BAG1-mCherry GCaMP6f reporter live bradyzoites were stained by SYTOX far red to detect dead cells and DAPI 30 min after liberation from cysts. Formaldehyde-fixed bradyzoites serve as positive control. Bar = 5 μm. (D) GCaMP6f fluorescence intensity vs. time for extracellular BAG1-mCherry GCaMP6f dual reporter parasites in response to 1 μM ionomycin, 1 μM thapsigargin, or 10 mM NH4Cl in EC buffer without Ca2+. Arrow indicates the addition of agonist. Each curve is the mean of 10 individual parasites and shown as means ± SD. (E) Fluorescence intensities change fold vs. time of extracellular BAG1-mCherry expressing bradyzoites loaded with 500 nM Fluo-8 AM after addition of 1 μM ionomycin, 1 μM thapsigargin, or 10 mM NH4Cl in EC buffer without Ca2+. Arrow indicates the addition of agonist. Each curve is the mean of 10 individual parasites and shown as means ± SD.
-
Figure 5—source data 1
Calcium responses of extracellular single tachyzoite and bradyzoite stimulated by Ca2+ agonists (related to Figure 5B).
- https://cdn.elifesciences.org/articles/73011/elife-73011-fig5-data1-v3.xlsx
-
Figure 5—source data 2
Calcium responses of extracellular GCaMP6f BAG1-mCherry tachyzoites and bradyzoites treated with ionomycin, thapsigargin, and NH4Cl (related to Figure 5D).
- https://cdn.elifesciences.org/articles/73011/elife-73011-fig5-data2-v3.xlsx
-
Figure 5—source data 3
Calcium responses of extracellular Fluo-8-loaded BAG1-mCherry tachyzoites and bradyzoites treated with ionomycin, thapsigargin, and NH4Cl (related to Figure 5E).
- https://cdn.elifesciences.org/articles/73011/elife-73011-fig5-data3-v3.xlsx
Figure 5—video 1
Ca2+ response of extracellular ME49 BAG1-mCherry GCaMP6f tachyzoite in response to A23187.
Time-lapse video microscopy showing GCaMP6f fluorescence changes of extracellular ME49 BAG1-mCherry GCaMP6f tachyzoite in response to A23187 (2 μM) in extracellular (EC) buffer. Videos were recorded for 3 min, and A23187 (2 μM) was added 15 s after the recording was initiated. Display frame rate is 4 frames per second while the acquisition frame rate is 3 frames per second. Bar = 2 μm.
Figure 5—video 2
Ca2+ response of extracellular ME49 BAG1-mCherry GCaMP6f bradyzoite in response to A23187.
Time-lapse video microscopy showing GCaMP6f fluorescence changes of extracellular ME49 BAG1-mCherry GCaMP6f bradyzoite in response to A23187 (2 μM) in extracellular (EC) buffer. Bradyzoites were liberated by 0.25 mg/ml trypsin for 5 min from in vitro cysts induced for cultivation in human foreskin fibroblast (HFF) cells for 7 days at pH 8.2. Videos were recorded for 3 min, and A23187 (2 μM) was added 15 s after the recording was initiated. Display frame rate is 2 frames per second while the acquisition frame rate is 5 frames per second. Bar = 2 μm.
Figure 6 with 1 supplement
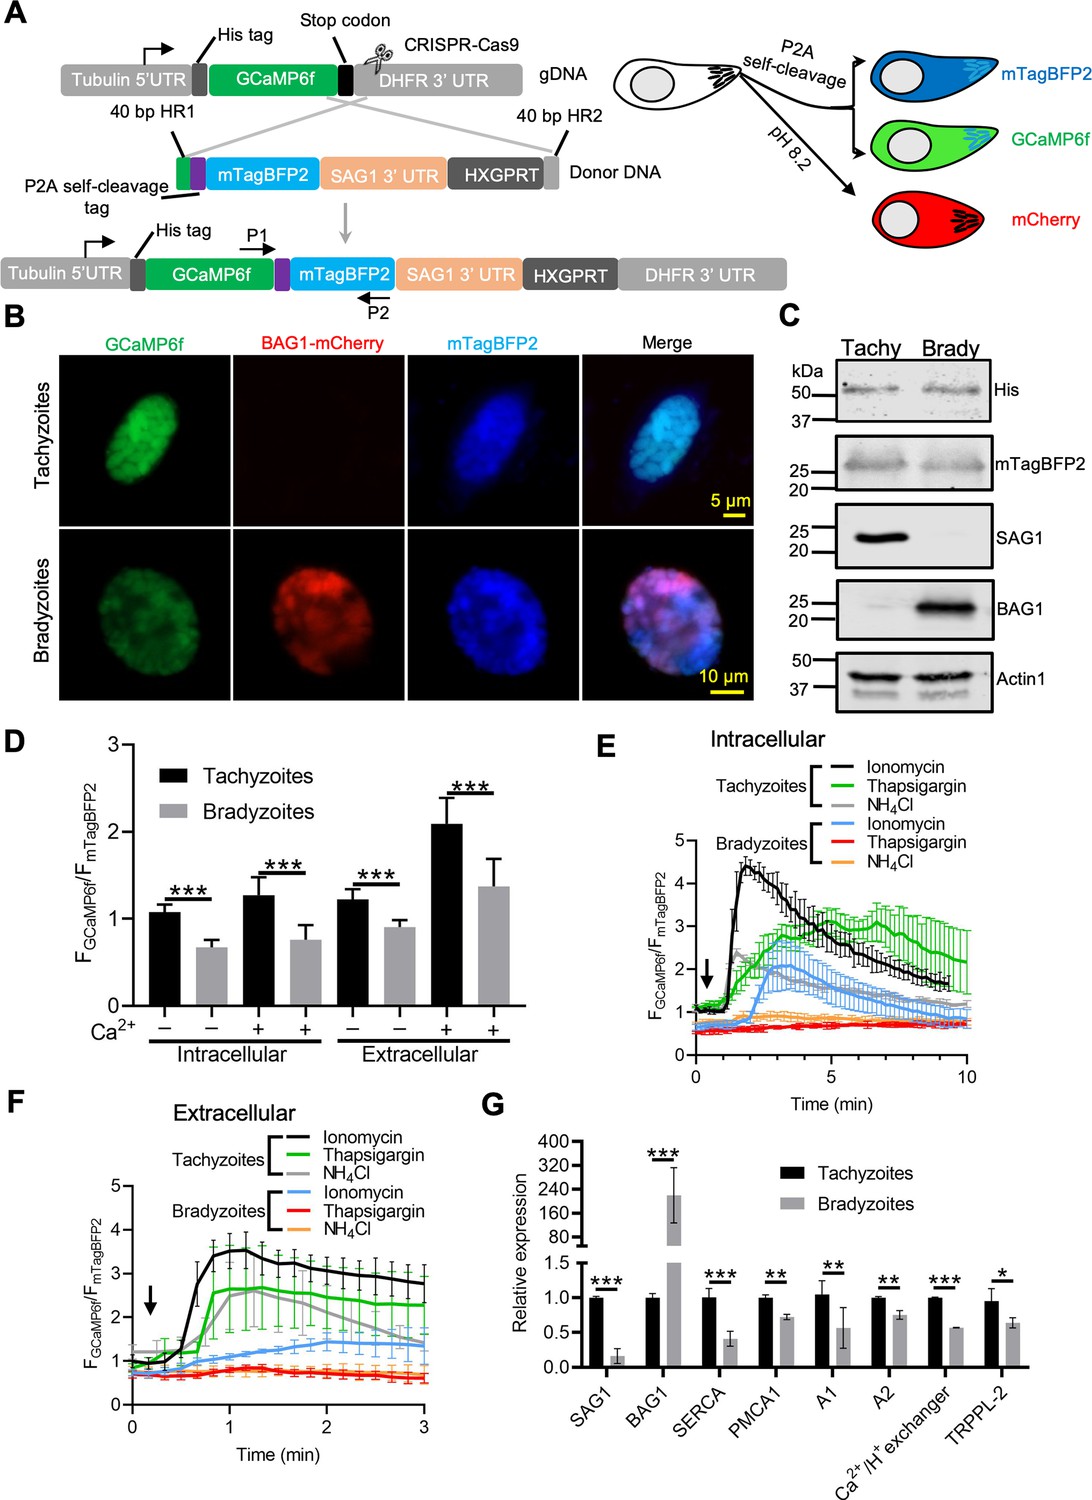
Ratiometric Ca2+ imaging of bradyzoites reveals lower levels of resting Ca2+ and reduced response to Ca2+ ionophores compared to tachyzoites.
(A) Schematic diagram of generation of a ratiometric Ca2+ reporter containing GCaMP6f fused with by a peptide P2A and blue fluorescence indicator mTagBFP2 in the background of BAG1-mCherry reporter strain. P1 and P2 are primes used for the diagnostic PCR to confirm the integration of P2A-mTagBFP2 into the C-terminal of GCaMP6f. (B) Fluorescence microscopy imaging of the intracellular ratiometric indicator expressed by tachyzoites cultured for 24 hr vs. bradyzoites induced for 7 days at pH 8.2 culture in extracellular (EC) buffer without Ca2+. Bar = 10 μm. (C) Western blots showing GCaMP6f and mTagBFP2 produced from the ratiometric reporter expressed by tachyzoites and bradyzoites. αHis and αtRFP antibodies were used to probe the expression of GCaMP6f and mTagBFP2, respectively. SAG1 and BAG1 serve as the stage-specific marker of tachyzoites and bradyzoites, respectively. Actin functions as loading control. (D) Quantification of basal Ca2+ levels normalized by comparison of GCaMP6f to mTagBFP2 fluorescence intensity ratios of intracellular and extracellular tachyzoites or bradyzoites that were induced by culture for 7 days at pH 8.2. For extracellular parasites, tachyzoites were liberated mechanically and bradyzoites were liberated by trypsin treatment. Parasites within intact cells or extracellular parasites were incubated in EC buffer with or without Ca2+ for 10 min before imaging. Data represent mean values from two independent experiments with 10 total vacuoles or cysts for each treatment. Two-tailed unpaired Student’s t-test, ***p<0.001. (E) Monitoring of GCaMP6f/ mTagBFP2 fluorescence intensity ratio vs. time for intracellular tachyzoites and in vitro-induced bradyzoites that were induced by culture for 7 days at pH 8.2. Each kinetic curve represents mean data of five individual vacuoles or cysts and is shown as means ± SD. (F) For extracellular parasites, tachyzoites were liberated mechanically and bradyzoites were liberated by trypsin treatment. Parasites were incubated in EC buffer without Ca2+ for 10 min, and responses were measured to ionomycin (1 μM), thapsigargin (1 μM), or 10 mM NH4Cl. Arrow indicates time of addition of agonists. Each kinetic curve represents mean data of 10 individual parasites and is shown as means ± SD. (G) Gene expression levels in tachyzoites and bradyzoites induced for 7 days at pH 8.2. mRNA levels were measured using RT-PCR and expressed relative to the housekeeping transcript for actin. SAG1 and BAG1 were used to monitor tachyzoites and bradyzoites, respectively. Data represent the means ± SD of two independent assays containing triplicate samples each. Multiple Student’s t-tests, **p<0.01, ***p<0.001.
-
Figure 6—source data 1
Western blotting analysis of ME49 GCaMP6f-P2A-mTagBFP2 BAG1-mCherry ratiometric reporter parasites (related to Figure 6C).
- https://cdn.elifesciences.org/articles/73011/elife-73011-fig6-data1-v3.xlsx
-
Figure 6—source data 2
Comparison of Ca2+ calcium basal levels between tachyzoites and bradyzoites using ratiometric reporter (related to Figure 6D).
- https://cdn.elifesciences.org/articles/73011/elife-73011-fig6-data2-v3.xlsx
-
Figure 6—source data 3
Calcium responses of intracellular GCaMP6f ratiometric reporter tachyzoites and bradyzoites treated with different Ca2+ agonists (related to Figure 6E).
- https://cdn.elifesciences.org/articles/73011/elife-73011-fig6-data3-v3.xlsx
-
Figure 6—source data 4
Calcium responses of extracellular GCaMP6f ratiometric reporter tachyzoites and bradyzoites treated with different Ca2+ agonists (related to Figure 6F).
- https://cdn.elifesciences.org/articles/73011/elife-73011-fig6-data4-v3.xlsx
-
Figure 6—source data 5
Comparison of mRNA expression levels of genes encoding calcium-associated channels and pumps in tachyzoites and bradyzoites by qPCR (related to Figure 6G).
- https://cdn.elifesciences.org/articles/73011/elife-73011-fig6-data5-v3.xlsx
Figure 6—figure supplement 1
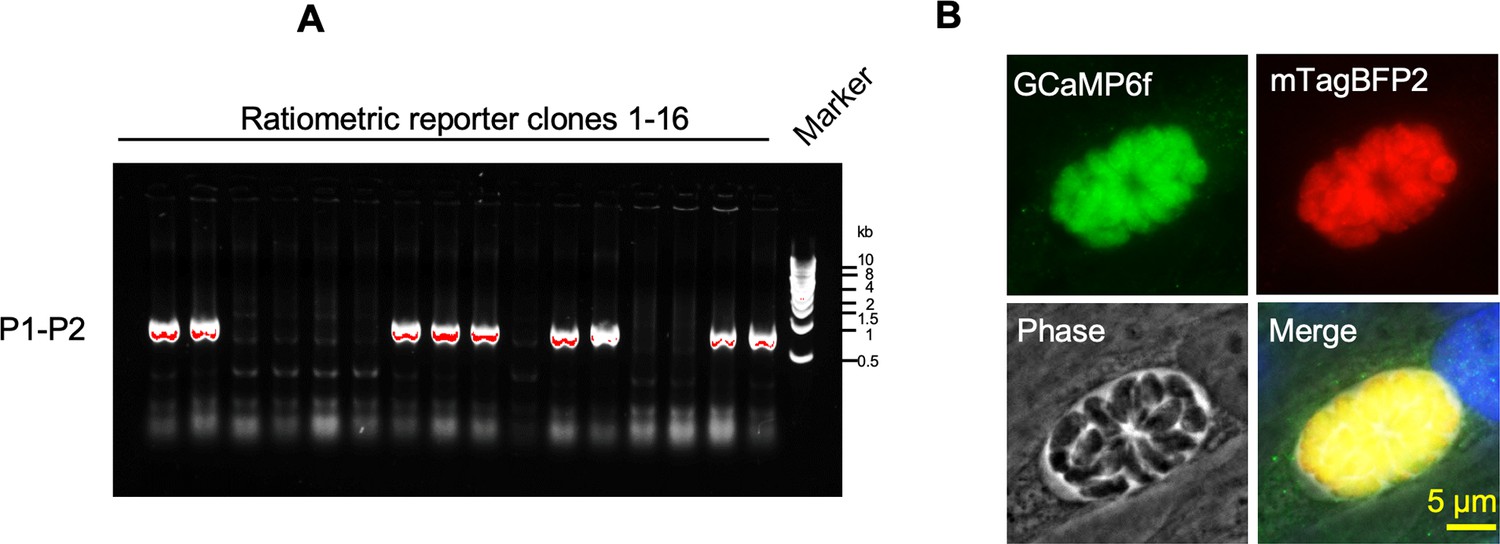
Identification of ME49 GCaMP6f-P2A-mTagBFP2 BAG1-mCherry ratiometric reporter by PCR and immunofluorescence assay (IFA).
(A) Transgenic screening of clones of ME49 GCaMP6f BAG1-mCherry parasites expressing P2A-mTagBFP2 at the C-terminal of GCaMP6f using PCR amplification with primer set P1-P2 shown in diagram in Figure 6A. (B) IFA analysis showing co-localization of GCaMP6f and mTagBFP2 in tachyzoites of the dual reporter strain grown in human foreskin fibroblast (HFF) cells for 24 hr. Monoclonal anti-His antibody was used to stain GCaMP6f while rabbit anti-tRFP antibody was used to stain mTagBFP2 followed by goat anti-mouse IgG conjugated to Alexa Fluor-488 and goat anti-rabbit IgG conjugated to Alexa Fluor-568 secondary antibodies. Scale bar = 5 μm.
-
Figure 6—figure supplement 1—source data 1
Uncropped DNA gel for PCR identification of ratiometric reporter clones (related to Figure 6—figure supplement 1).
- https://cdn.elifesciences.org/articles/73011/elife-73011-fig6-figsupp1-data1-v3.xlsx
Figure 7 with 3 supplements
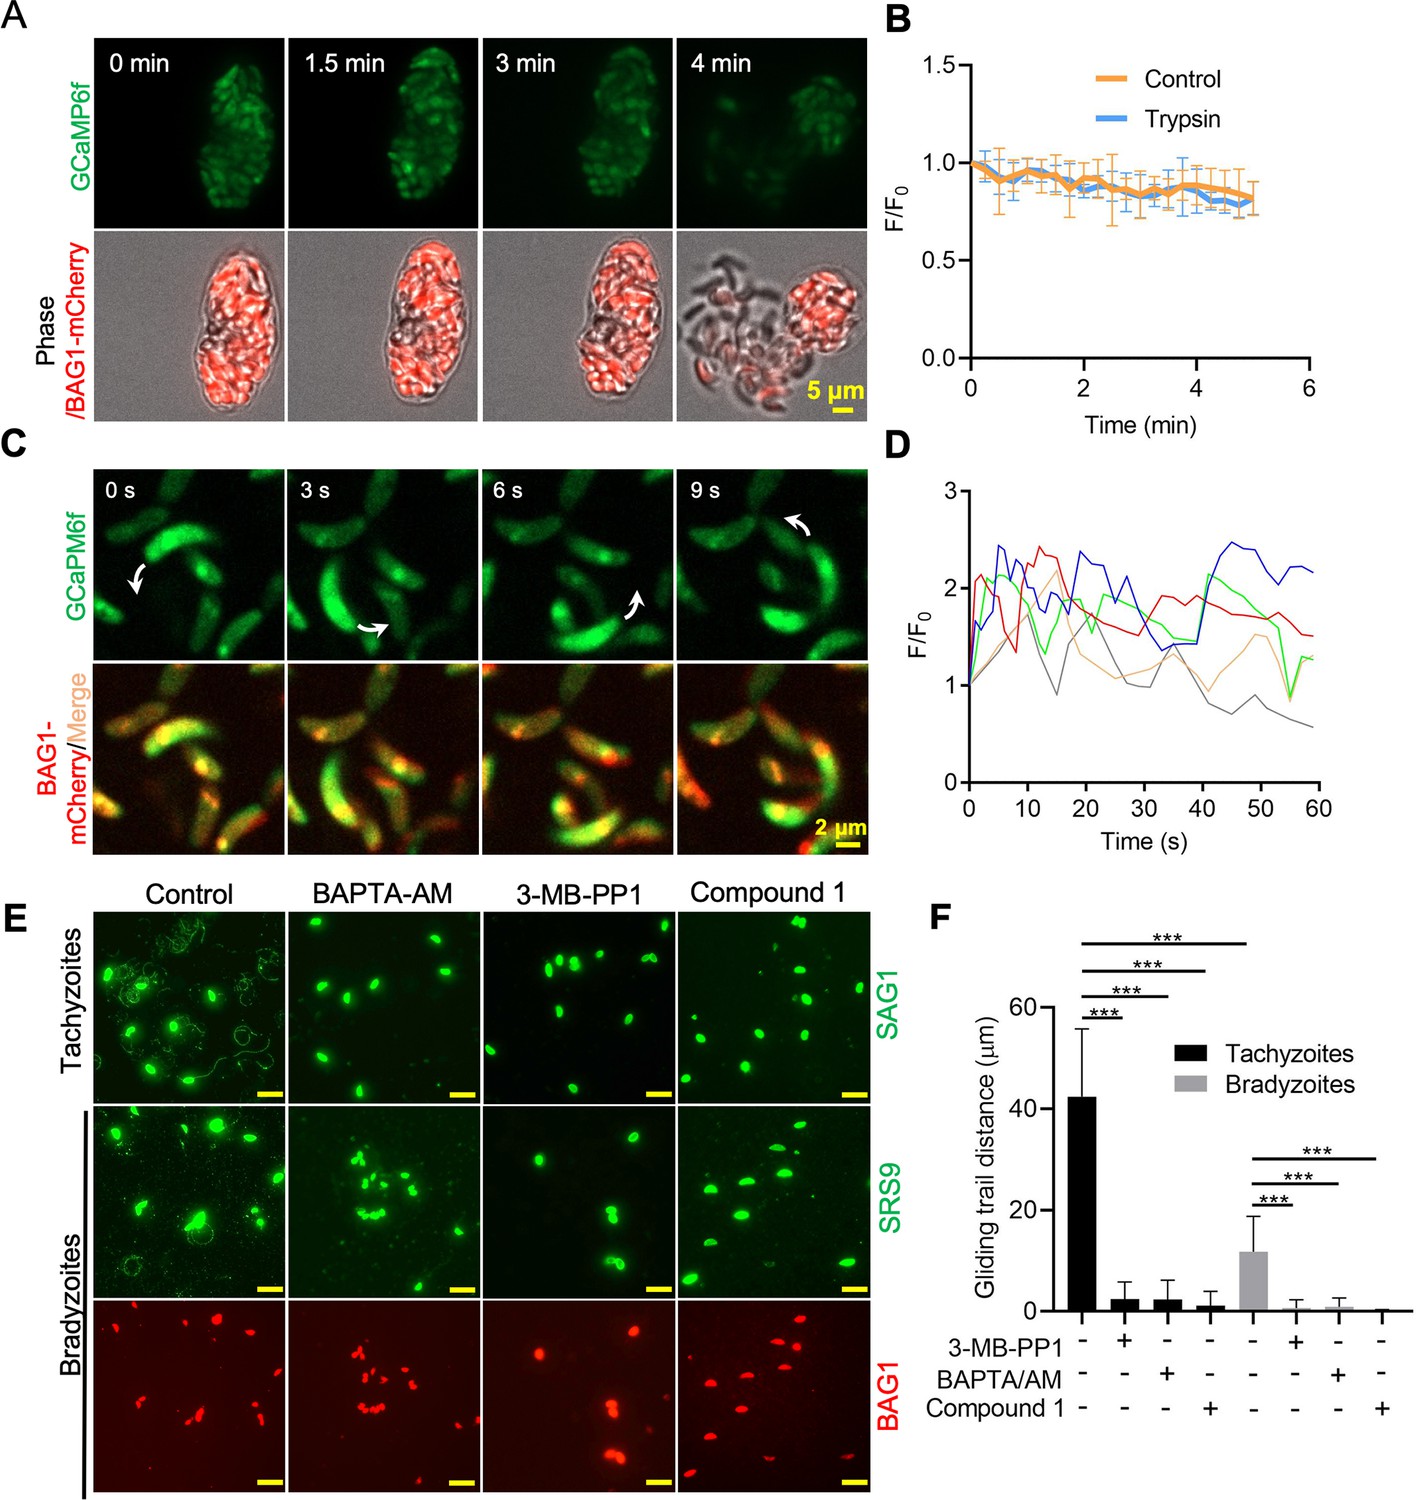
Ca2+ signaling governs gliding motility of bradyzoites.
(A) Time-lapse microscopy recording of GCaMP6f BAG1-mCherry bradyzoites induced for 7 days at pH 8.2. Cells were imaged during the digestion by 0.25 mg/ml trypsin for 5 min in extracellular (EC) buffer with 1.8 mM Ca2+. Bar = 5 μm. (B) GCaMP6f fluorescence change ratio vs. time of BAG1-mCherry GCaMP6f bradyzoites induced for 7 days at pH 8.2 treated with or without trypsin. Curves represent mean data from five independent cysts. (C) Spinning disc confocal microscopy monitoring circular gliding motility of bradyzoites liberated by 0.25 mg/ml trypsin for 10 min from cysts induced for 7 days at pH 8.2. Arrow shows the direction of gliding motility by one bradyzoite. Bar = 5 μm. (D) Ca2+ kinetics of bradyzoites undergoing gliding motility after liberation from cysts induced for 7 days at pH 8.2. The graph shows fluctuated Ca2+ kinetics of five independent single bradyzoites. (E) Indirect immunofluorescence microscopy showing the trails of parasites during gliding motility. Parasites were treated with DMSO (control), 5 μM 3-MB-PP1, 25 μM BAPTA-AM, and 4 μM compound 1. Anti-SAG1 mAb DG52 and rabbit polyclonal anti-SRS9 antibodies followed by secondary antibodies conjugated to goat anti-mouse IgG Alexa 488 were used to stain the gliding trails of tachyzoites and bradyzoites, respectively. Anti-BAG1 followed by goat anti-rabbit IgG conjugated of Alexa 568 served as marker of bradyzoites. Bar = 10 μm. (F) Quantification of trails from gliding motility of tachyzoites and bradyzoites treated with DMSO (control), 5 μM 3-MB-PP1, 25 μM BAPTA-AM, and 4 μM compound 1. Data represented as means ± SEM (n = 20 replicates combined from n = 3 independent experiments). Kruskal–Wallis test with Dun’s multiple comparison correction ***p<0.001.
-
Figure 7—source data 1
Calcium responses of GCaMP6f BAG1-mCherry reporter bradyzoites during liberation from in vitro-induced cyst by trypsin (related to Figure 7B).
- https://cdn.elifesciences.org/articles/73011/elife-73011-fig7-data1-v3.xlsx
-
Figure 7—source data 2
Calcium fluctuation of extracellular single bradyzoites (related to Figure 7D).
- https://cdn.elifesciences.org/articles/73011/elife-73011-fig7-data2-v3.xlsx
-
Figure 7—source data 3
Effects of inhibition of calcium signaling pathway on the gliding motility of tachyzoites and bradyzoites (related to Figure 7F).
- https://cdn.elifesciences.org/articles/73011/elife-73011-fig7-data3-v3.xlsx
Figure 7—figure supplement 1
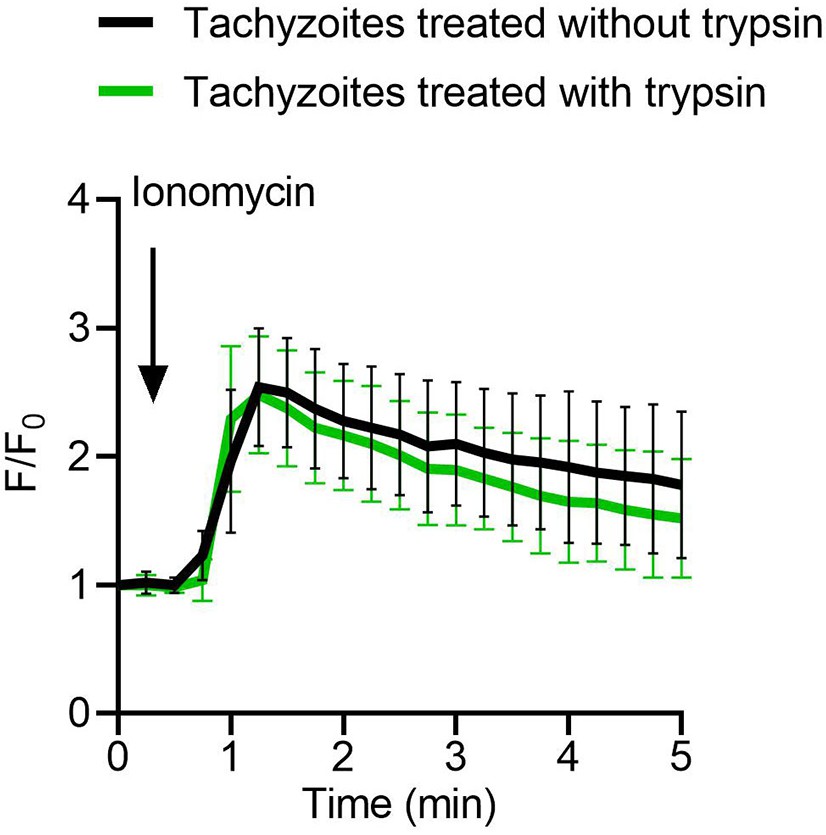
Effects of trypsin treatment on tachyzoites Ca2+ pools.
Fluorescence recording of ME49 strain tachyzoites expressing GCaMP6f in response to ionomycin (1 μM). Freshly harvested extracellular tachyzoites were treated with 0.25 mg/ml trypsin for 10 min in extracellular (EC) buffer without Ca2+, followed by stimulation with ionomycin and fluorescence recording. Arrow indicates time of addition of Ca2+ agonist ionomycin. Each kinetic curve represents the mean of 10 independent tachyzoites and is shown as means ± SD (n = 10).
-
Figure 7—figure supplement 1—source data 1
Effects of trypsin treatment on tachyzoites Ca2+ pools (related to Figure 7—figure supplement 1A).
- https://cdn.elifesciences.org/articles/73011/elife-73011-fig7-figsupp1-data1-v3.xlsx
Figure 7—video 1
Trypsin-induced liberation of ME49 BAG1-mCherry GCaMP6f bradyzoites from in vitro-cultured cysts.
Time-lapse video microscopy recording GCaMP6f fluorescence changes from BAG1-mCherry GCaMP6f bradyzoites induced by cultivation in human foreskin fibroblast (HFF) cells for 7 days at pH 8.2 during digestion by 0.25 mg/ml trypsin in extracellular (EC) buffer. Videos were recorded for 6 min, and 0.25 mg/ml trypsin was added 30 s after the recording was initiated. Display frame rate is 16 frames per second while the acquisition frame rate is 5 frames per second. Bar = 5 μm.
Figure 7—video 2
Gliding motility of ME49 BAG1-mCherry GCaMP6f bradyzoites released from in vitro cysts.
Time-lapse video microscopy of gliding motility of bradyzoites liberated by 0.25 mg/ml trypsin for 5 min from in vitro cyst induced by cultivation in human foreskin fibroblast (HFF) cells for 7 days at pH 8.2. Images were collected using spinning disc confocal microscopy. The arrow shows the gliding motility of bradyzoite in extracellular (EC) buffer. Videos were recorded for 2 min. Display frame rate is 6 frames per second while the acquisition frame rate is 1 frame per second. Bar = 2 μm.
Figure 8 with 1 supplement
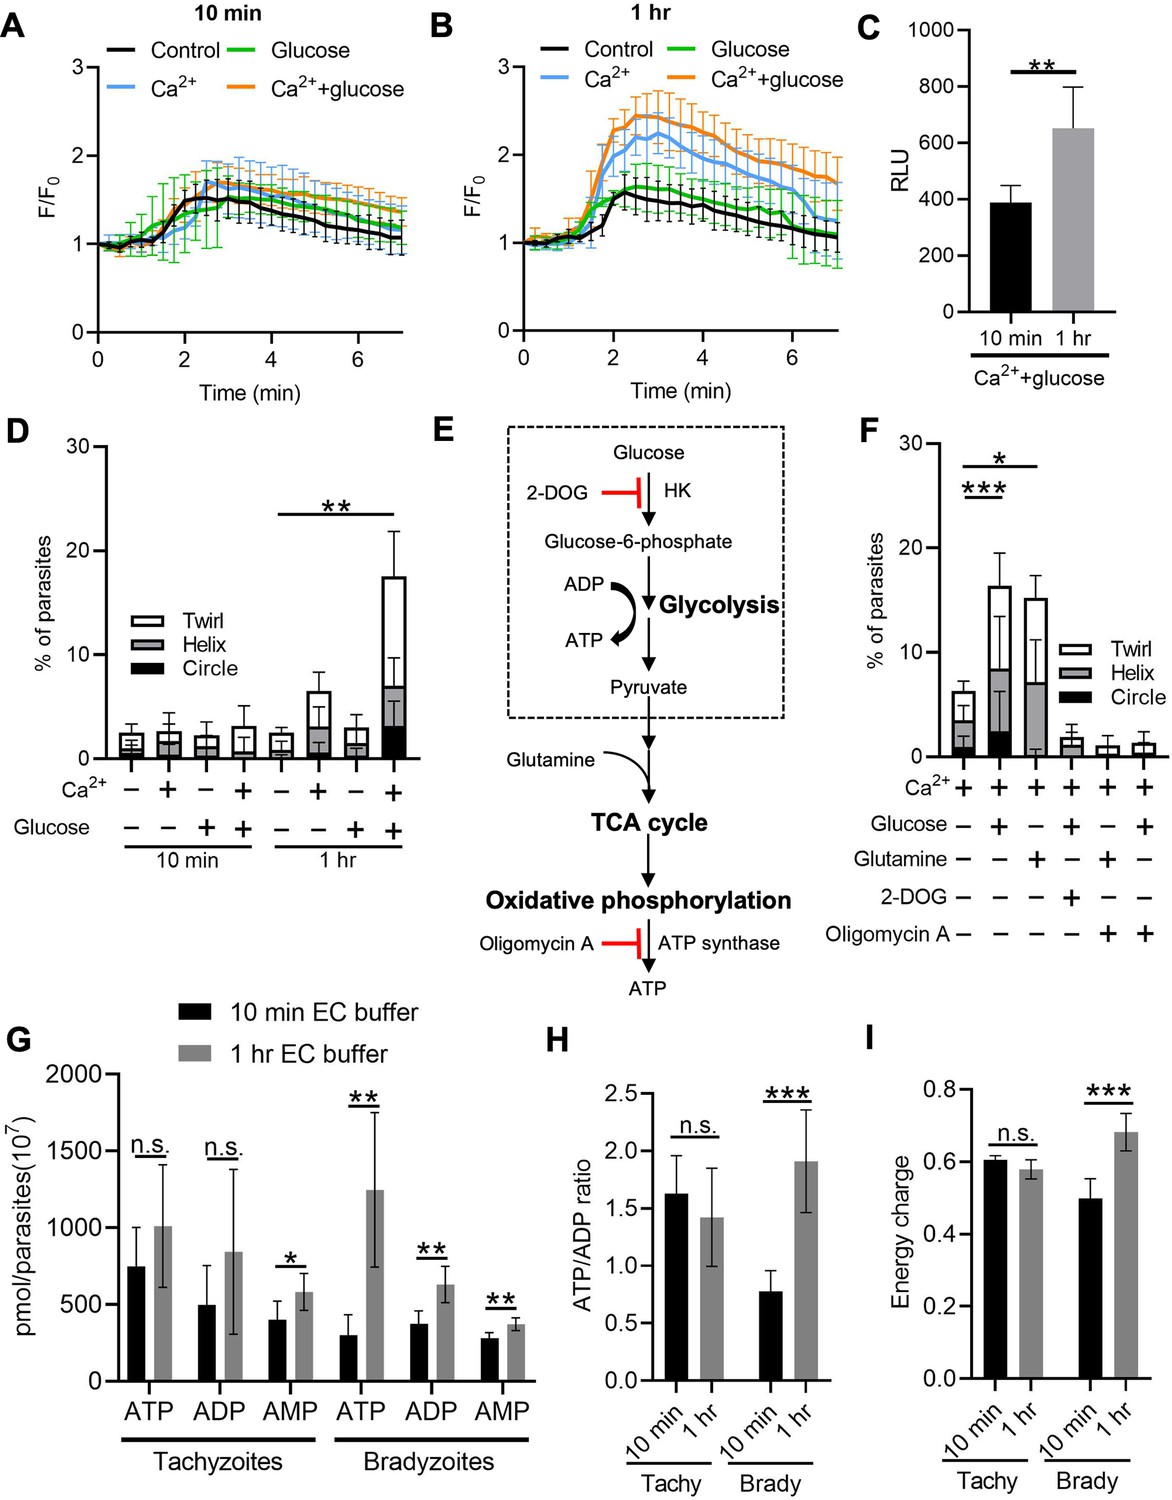
Exogenous Ca2+ and glucose collectively contributes to bradyzoites gliding motility via refilling Ca2+ pools and increasing ATP production.
(A, B) Monitoring the relative intensity of GCaMP6f fluorescence fold change (F/F0) vs. time from extracellular bradyzoites treated with 1 µM ionomycin. Bradyzoites induced for 7 days at pH 8.2 were released from in vitro cysts by 0.25 mg/ml trypsin and pre-incubated in extracellular (EC) buffer ±1.8 mM Ca2+ and/or ± 5.6 mM glucose for 10 min (A) or 1 hr (B) before measurements. Each kinetic curve represents mean data of 10 individual extracellular parasites and is shown as means ± SD. Arrow indicates the addition of 1 µM ionomycin. Control refers to the absence of Ca2+ and glucose. (C) ME49 BAG1-mCherry MIC2-Gluc bradyzoites were induced for 7 days at pH 8.2, purified by magnetic beads, released from in vitro cysts by 0.25 mg/ml trypsin and incubated in EC buffer containing 1.8 mM Ca2+ and 5.6 mM glucose for 10 min or 1 hr, followed by stimulation with ionomycin (1 μM) for 10 min. Release of MIC2-GLuc in ESA was determined using a Gaussia luciferase assay. RLU indicates relative light units. Means ± SD of two independent experiments (n = 6). Two-tailed Mann–Whitney test, **p<0.01. (D) Percentage of extracellular parasites undergoing different forms of gliding motility as determined from time-lapse video microscopy. Bradyzoites induced for 7 days at pH 8.2 were treated in EC buffer ± 1.8 mM Ca2+ and/or ±5.6 mM glucose for 10 min or 1 hr before measurements. Means ± SD of two independent experiments with six replicates each. Kruskal–Wallis test with Dunn’s multiple comparison correction test **p<0.01 for comparison between –Ca2+/– glucose and +Ca2+/+ glucose. All other groups were not significantly different from the negative control. (E) Schematic illustration of the mechanism of 2-deoxyglucose (2-DOG) and oligomycin A in inhibiting ATP production. (F) Percentage of bradyzoites with different forms of gliding motility determined by time-lapse video microscopy. Bradyzoites induced for 7 days at pH 8.2 were treated in EC buffer (1.8 mM Ca2+) ± 5.6 mM glucose, 5.6 mM glutamine, 50 mM 2-DOG, or 20 µM oligomycin A for 1 hr before measurements. Means ± SD of two independent experiments with six replicates each. Kruskal–Wallis test with Dunn’s multiple comparison correction test *p<0.05, ***p<0.001. (G–I) High-performance liquid chromatography UV (HPLC-UV) analysis of adenosine triphosphate (ATP), adenosine diphosphate (ADP), and adenosine monophosphate (AMP) levels in extracellular tachyzoites and bradyzoites incubated with EC buffer containing 1.8 mM Ca2+ and 5.6 mM glucose for 10 min or 1 hr. Bradyzoites induced for 7 days at pH 8.2 were purified by magnetic beads and released from in vitro cysts by 0.25 mg/ml trypsin. Data from two independent experiments with six technical replicates. (G) Concentrations of ATP, ADP, and AMP in extracellular tachyzoites and bradyzoites represented as means ± SD. Multiple Student’s t-tests, n.s., not significant, *p<0.05, **p<0.01. (H) ATP/ADP ratios in extracellular tachyzoites and bradyzoites represented as means ± SD. Multiple Student’s t-tests, n.s., not significant, ***p<0.001. (I) Energy charge of extracellular bradyzoites calculated as [ATP] + 0.5 × [ADP]/[ATP] + [ADP] + [AMP] represented as means ± SD. Multiple Student’s t-tests, n.s., not significant, ***p<0.001.
-
Figure 8—source data 1
Calcium fluorescence fold change of extracellular BAG1-mCherry GCaMP6f dual reporter bradyzoites treated with or without Ca2+ or glucose for 10 min in response to ionomycin (related to Figure 8A).
- https://cdn.elifesciences.org/articles/73011/elife-73011-fig8-data1-v3.xlsx
-
Figure 8—source data 2
Calcium fluorescence fold change of extracellular BAG1-mCherry GCaMP6f dual reporter bradyzoites treated with or without Ca2+ or glucose for 1 hr in response to ionomycin (related to Figure 8B).
- https://cdn.elifesciences.org/articles/73011/elife-73011-fig8-data2-v3.xlsx
-
Figure 8—source data 3
Recovery of microneme secretion by bradyzoites in extracellular (EC) buffer containing Ca2+ and glucose (related to Figure 8C).
- https://cdn.elifesciences.org/articles/73011/elife-73011-fig8-data3-v3.xlsx
-
Figure 8—source data 4
Percentage of gliding motility of bradyzoites treated with or without glucose or Ca2+ for 10 min or 1 hr (related to Figure 8D).
- https://cdn.elifesciences.org/articles/73011/elife-73011-fig8-data4-v3.xlsx
-
Figure 8—source data 5
Effects of inhibition of adenosine triphosphate (ATP) production pathways on the gliding motility of bradyzoites (related to Figure 8F).
- https://cdn.elifesciences.org/articles/73011/elife-73011-fig8-data5-v3.xlsx
-
Figure 8—source data 6
High-performance liquid chromatography (HPLC) analysis of adenosine triphosphate (ATP), adenosine diphosphate (ADP), and adenosine monophosphate (AMP) levels in bradyzoites treated with glucose and calcium containing extracellular (EC) buffer for 10 min or 1 hr (related to Figure 8G).
- https://cdn.elifesciences.org/articles/73011/elife-73011-fig8-data6-v3.xlsx
-
Figure 8—source data 7
Adenosine triphosphate (ATP)/adenosine diphosphate (ADP) ratio of bradyzoites treated with glucose and Ca2+ containing extracellular (EC) buffer for 10 min or 1 hr (related to Figure 8H).
- https://cdn.elifesciences.org/articles/73011/elife-73011-fig8-data7-v3.xlsx
-
Figure 8—source data 8
Energy charge of bradyzoites treated with glucose and Ca2+ containing extracellular (EC) buffer for 10 min or 1 hr (related to Figure 8I).
- https://cdn.elifesciences.org/articles/73011/elife-73011-fig8-data8-v3.xlsx
Figure 8—figure supplement 1
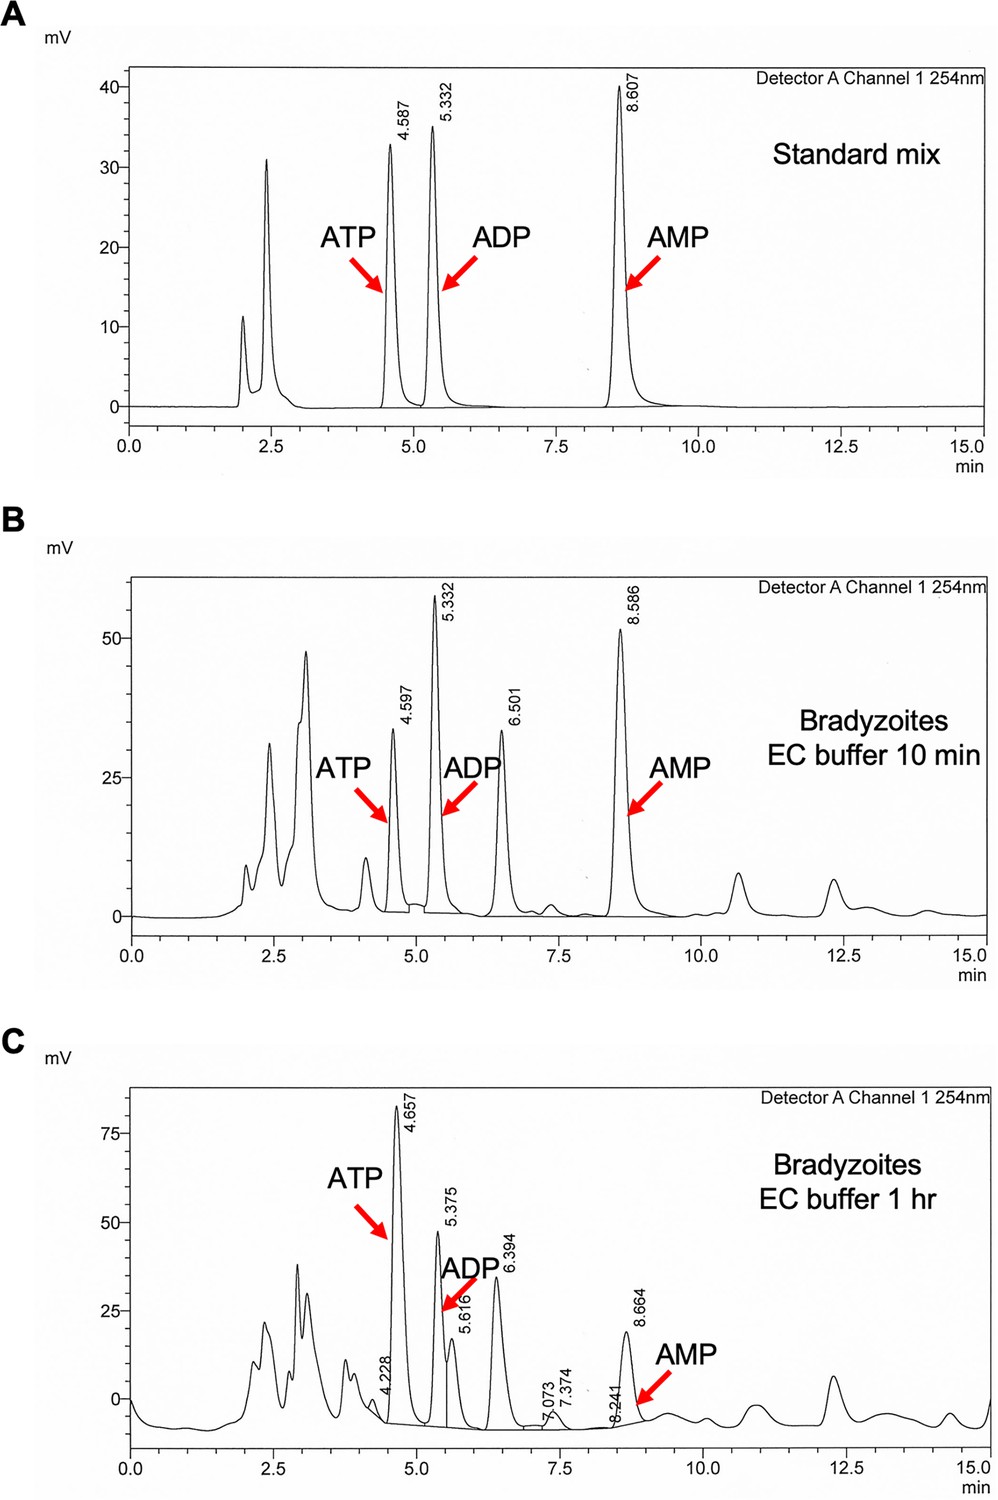
Establishment of high-performance liquid chromatography UV (HPLC-UV) analysis of adenosine triphosphate (ATP), adenosine diphosphate (ADP), and adenosine monophosphate (AMP) levels in parasites.
(A) HPLC-UV chromatograms of standard mix containing 12.5 µM ATP, 12.5 µM ADP, and 12.5 µM AMP. Arrows indicate the peaks of ATP, ADP, and AMP. (B) HPLC-UV chromatograms of ATP, ADP, and AMP extracts from bradyzoites (2 × 10⁷) incubated with extracellular (EC) buffer containing 1.8 mM Ca2+ and 5.6 mM glucose for 10 min. Arrows indicate the peaks of ATP, ADP, and AMP. (C) HPLC-UV chromatograms of ATP, ADP, and AMP extracts from bradyzoites (1.2 × 10⁷) incubated with EC buffer containing 1.8 mM Ca2+ and 5.6 mM glucose for 1 hr. Arrows indicate the peaks of ATP, ADP, and AMP.
-
Figure 8—figure supplement 1—source data 1
Chromatograms from high-performance liquid chromatography (HPLC) analysis of adenosine triphosphate (ATP), adenosine diphosphate (ADP), and adenosine monophosphate (AMP) contents in parasites (related to Figure 8—figure supplement 1A–C ).
- https://cdn.elifesciences.org/articles/73011/elife-73011-fig8-figsupp1-data1-v3.xlsx
Tables
Key resources table
| Reagent type (species) or resource | Designation | Source or reference | Identifiers | Additional information |
|---|---|---|---|---|
| Recombinant DNA reagent | pBAG1:mCherry, SAG1:CAT, TUB1:GCaM6f (pNJ-26) | This paper | Generation of BAG1-mCherry GCaMP6f reporter | |
| Recombinant DNA reagent | pSAG1:CAS9-EGFP, U6:sgUPRT | Addgene | Addgene_54467 | Template for construction of pSAG1:CAS9-GFP, U6:sgDHFR 3’UTR |
| Recombinant DNA reagent | pSAG1:CAS9-EGFP, U6:sgDHFR 3’UTR | This paper | Generation of ratiometric reporter | |
| Recombinant DNA reagent | p2A-mTagBFP2, DHFR-TS:HXGPRT | This paper | Generation of ratiometric reporter | |
| Recombinant DNA reagent | pBAG1:EGFP, DHFFR-TS::HXGPRT | This paper | Generation of BAG1-EGFP reporter | |
| Recombinant DNA reagent | pBAG1:mCherry, DHFFR-TS::HXGPRT | This paper | Generation of BAG1-mCherry reporter | |
| Recombinant DNA reagent | pMIC2:GLuc-myc, DHFR-TS | Brown et al., 2016 | Generation of MIC2 secretion reporter | |
| Recombinant DNA reagent | pTUB1:FNR-mCherry, CAT | Other | Vernon Carruthers Lab in University of Michigan | |
| Recombinant DNA reagent | pTUB1:YFP-mAID-3HA, DHFR-TS:HXGPRT | Other, Brown et al., 2017 | Template for construction of plasmids in this paper | |
| Transfected construct (Toxoplasma gondii) | ME49 Δhxgprt::FLUC | Other, Tobin et al., 2012 | Parental stain for generation of reporters in this paper | |
| Transfected construct (T. gondii) | BAG1-mCherry GCaMP6f | This paper | Genotypes are indicated as ME49 Δhxgprt::TUB1:FLUC; BAG1:mCherry, SAG1:CAT, TUB1:GCaMP6f | |
| Transfected construct (T. gondii) | BAG1-mCherry | This paper | Genotypes are indicated as ME49 Δhxgprt::TUB1:FLUC; BAG1:mCherry, DHFR-TS:HXGPRT | |
| Transfected construct (T. gondii) | BAG1-EGFP | This paper | Genotypes are indicated as ME49 Δhxgprt::TUB1:FLUC; BAG1:EGFP, DHFR-TS:HXGPRT | |
| Transfected construct (T. gondii) | BAG1-mCherry MIC2-GLuc | This paper | Genotypes are indicated as ME49 Δhxgprt::TUB1:FLUC; BAG1:mCherry, DHFR-TS:HXGPRT; MIC2:MIC2-GLuc, DHFR-TS | |
| Transfected construct (T. gondii) | BAG1-EGFP FNR-mCherry | This paper | Genotypes are indicated as ME49 Δhxgprt::TUB1:FLUC; BAG1:EGFP, DHFR-TS:HXGPRT; SAG1:CAT, TUB1:FNR-mCherry | |
| Transfected construct (T. gondii) | BAG1-mCherry GCaMP6f-P2A-mTagBFP2 | This paper | Genotypes are indicated as ME49 Δhxgprt::TUB1:FLUC; BAG1:mCherry, SAG1:CAT, TUB1:GCaMP6f-P2A-mTagBFP2, DHFR-TS:HXGPRT |
Additional files
-
Supplementary file 1
Primers used in this study.
- https://cdn.elifesciences.org/articles/73011/elife-73011-supp1-v3.xlsx
-
Transparent reporting form
- https://cdn.elifesciences.org/articles/73011/elife-73011-transrepform1-v3.docx
Download links
A two-part list of links to download the article, or parts of the article, in various formats.
Downloads (link to download the article as PDF)
Open citations (links to open the citations from this article in various online reference manager services)
Cite this article (links to download the citations from this article in formats compatible with various reference manager tools)
Toxoplasma bradyzoites exhibit physiological plasticity of calcium and energy stores controlling motility and egress
eLife 10:e73011.
https://doi.org/10.7554/eLife.73011


