Task-related hemodynamic responses in human early visual cortex are modulated by task difficulty and behavioral performance
- Department of Psychology, New York University, United States
- Laboratory of Brain and Cognition, National Institute of Mental Health, National Institutes of Health, United States
- Graduate Program in Neuroscience, University of Washington, United States
- Department of Psychology and Center for Neural Science, New York University, United States
Figures
Figure 1
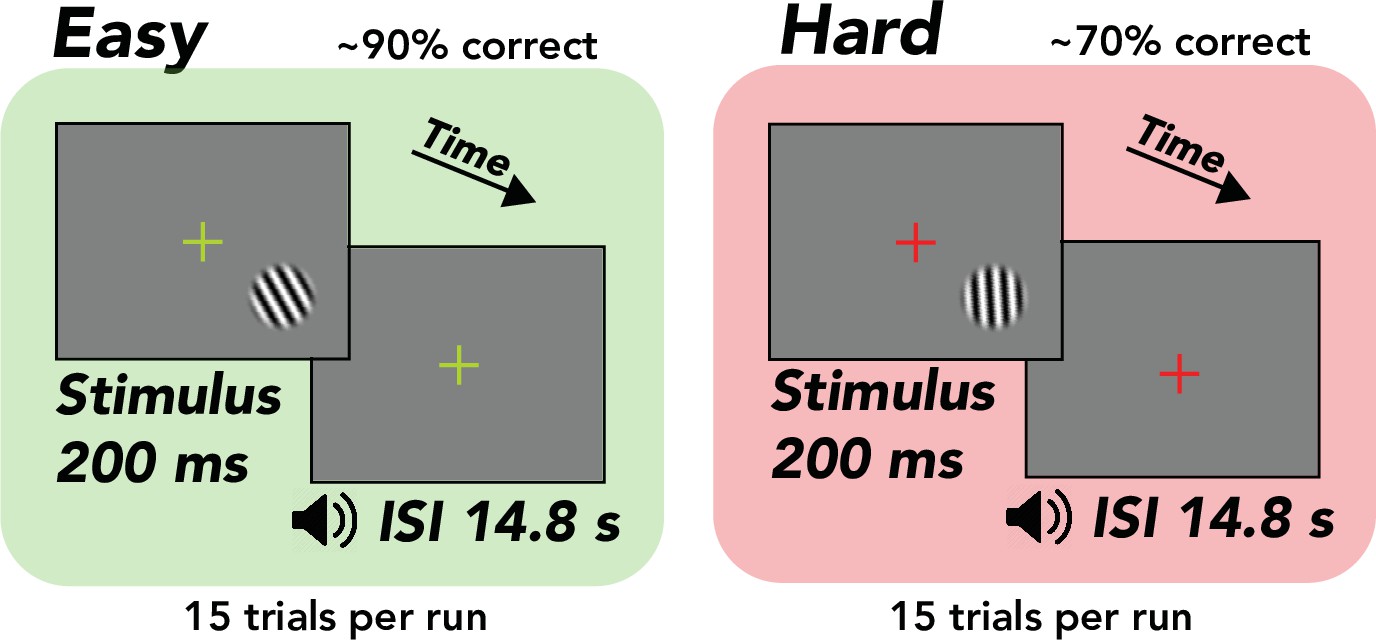
Task, orientation discrimination around vertical.
Trial structure, 200 ms stimulus presentation, followed by a 14.8 s interstimulus interval (ISI), during which the observer made a button press response and immediately received tone feedback. Design, alternation between separate easy (~90% correct) and hard (~70% correct) runs comprising 15 trials each. Stimulus, tilted grating in a raised cosine aperture (diameter of 1.5°, but enlarged for illustrative purposes). Fixation cross, changed colors from green to red, indicating easy and hard runs, respectively.
Figure 2
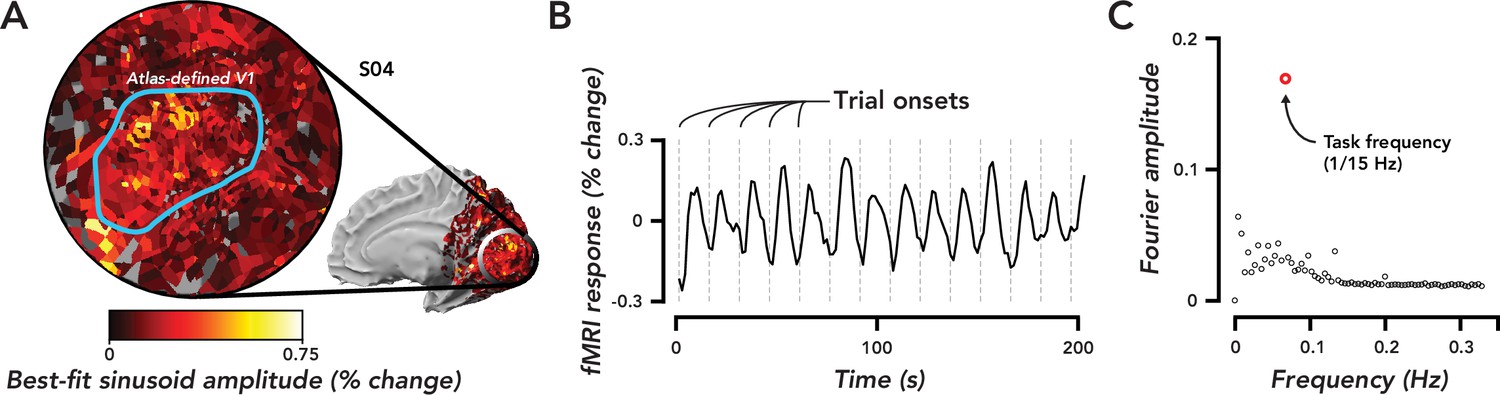
Widespread task-related fMRI responses in ipsilateral V1 were entrained to task timing.
(A) Flat map centered on occipital pole showing fMRI responses. Inset, medial view of right hemisphere, indicated the region of cortex displayed in the flat map. Color map, amplitude of best-fitting sinusoid at the task frequency (1/15 Hz) in units of percent signal change for a single observer (O4). Blue Region of interest (ROI), atlas-defined V1, based on observer’s anatomy. (B) Time course of fMRI responses averaged over all voxels in the V1 ROI defined in (A). Dotted gray lines, trial onsets. fMRI data are not artifact corrected in this figure. (C). Fourier transform of time course in (B). Open red circle, amplitude of the frequency response at the task frequency. Open black circles, the rest of the frequency response. The largest frequency component of the task-related response was at the task frequency.
Figure 3 with 3 supplements
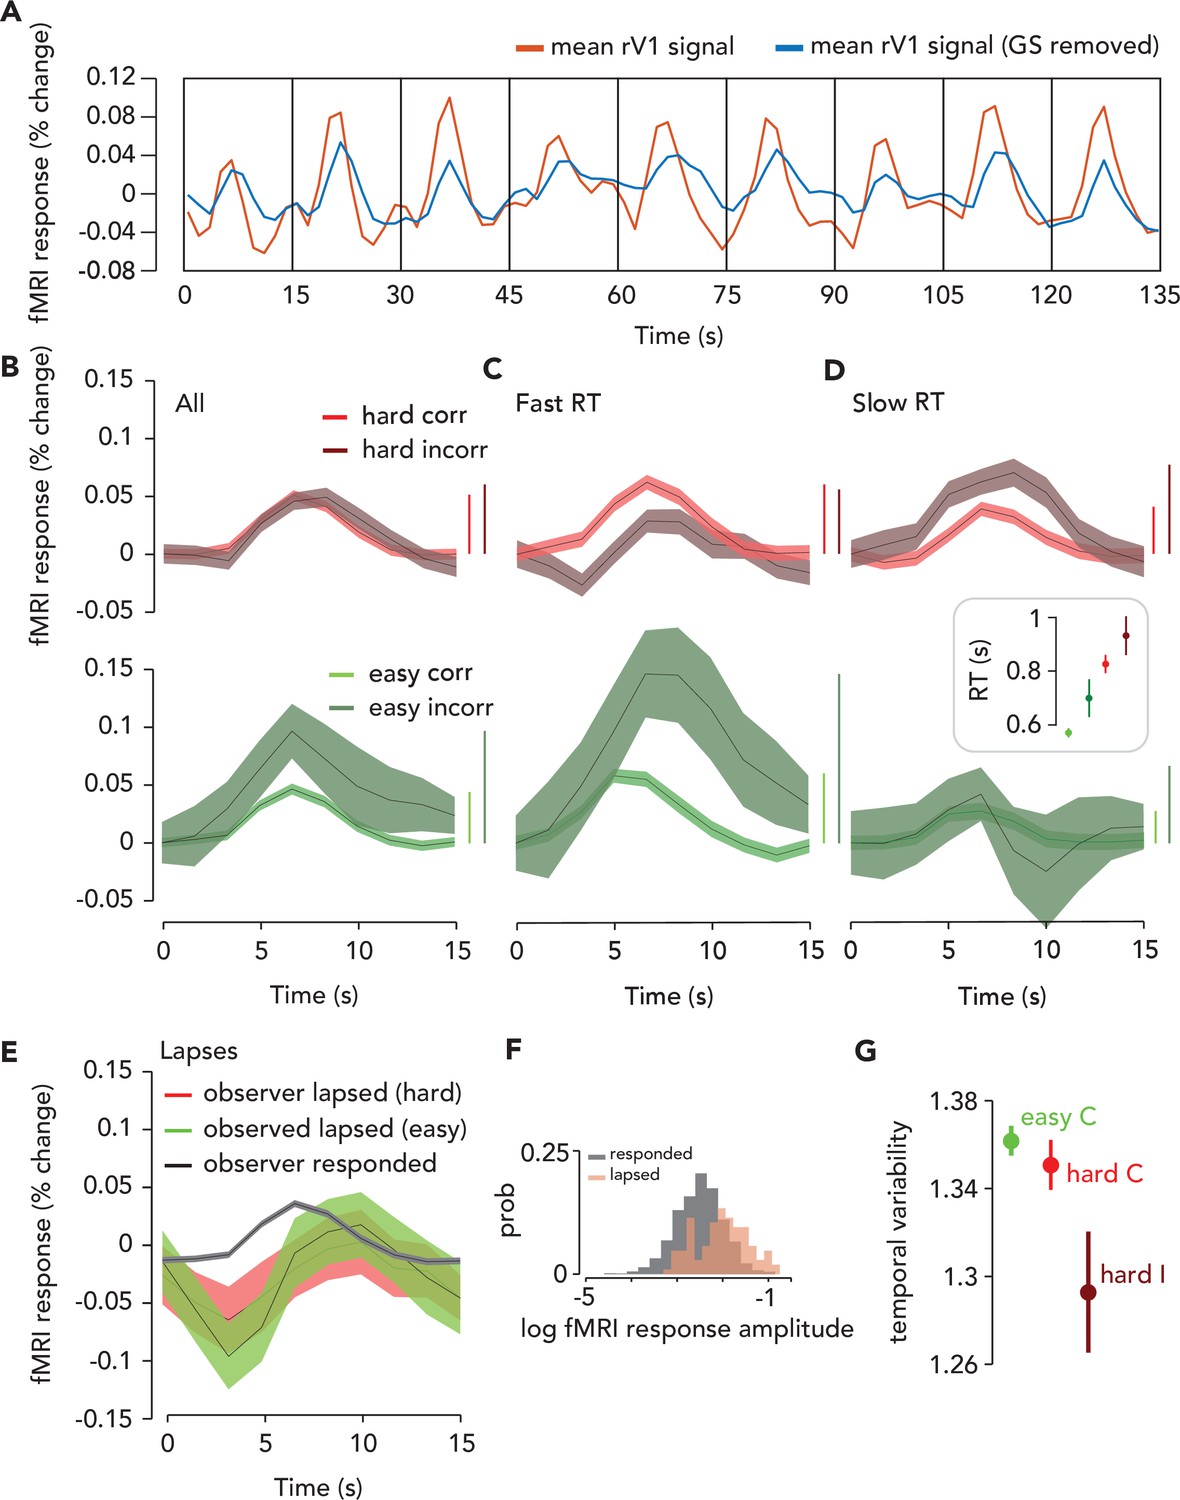
Task-related response (TRR) was modulated by task difficulty and behavioral performance.
(A) To estimate the TRR, we projected the global signal (“GS,” mean fMRI signal across all voxels in the brain) out of each voxel’s fMRI response in ipsilateral (right) V1 (red, average across V1 voxels before correction). We then averaged over all voxels in ipsilateral V1 (blue). (B) TRR was modulated by task difficulty and behavioral accuracy. Average TRRs across trials and participants (N = 9) for hard and easy runs (red vs. green) and correct vs. incorrect trials (dark vs. light shades). Error surface, two SEM across observers. Vertical bars indicate response amplitude (max-min). (C,D) TRR was modulated by both accuracy and reaction time (RT). Same color scheme as (B), but (C and D) show only trials with either fast or slow RTs (i.e. below or above median of the RT distribution). Inset, mean RT for each trial type (errorbar, SEM). (E) TRR amplitude was modulated by lapses (missed response trials). Black curve, average TRR across all trials on which the observer made a button press response, irrespective of type. Red, lapsed trials on hard runs. Green, lapsed trials on easy runs. (F) Distribution of (log) fMRI amplitude (measured as std of the signal on each trial), across trials for lapse vs. response trials (orange vs. black). (G) Temporal variability of the TRR is modulated by difficulty and behavioral accuracy. Circle, mean temporal variability (measured as the circular std of the Fourier phase at the task frequency of 1/15 Hz) across observers (N = 9). Error bar, two SEM. Green, easy correct trials. Light red, hard correct trials. Dark red, hard incorrect trials. Easy incorrect not shown because it is far below the y-limit of the plot; extending the axes to include this data point would obscure differences between the other conditions (easy incorrect temporal variability: mean, 0.55; SEM, 0.22).
Figure 3—figure supplement 1
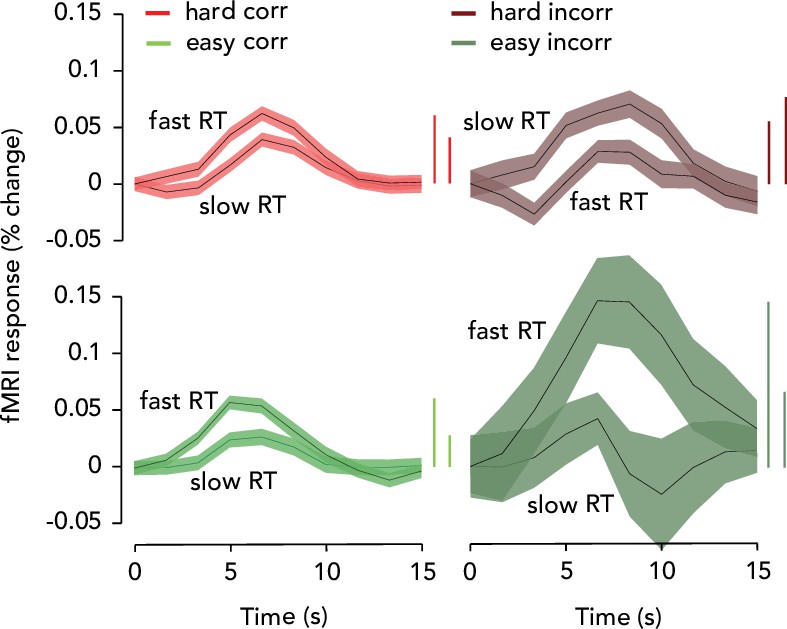
Task-related responses (TRRs) were modulated by reaction time (RT).
Same data as Figure 3C, D , but replotted with curves grouped by difficulty/accuracy, for ease of comparison of trials with slow and fast RTs. Vertical bars showing amplitude are ordered so that fast RT is first in each pair. Thus, TRRs were higher in amplitude on trials with fast RTs for all trial types except hard/incorrect. Note that in our model, the TRR signal was represented as the sum of three arousal-related inputs (convolved with an hemodynamic response function (HRF)). This means that, according to our model, RT-linked modulations of TRR amplitude (such as those seen in this figure) can arise from different combinations of these three arousal-related inputs, meaning that one must exercise caution in interpreting the results shown here and in Figure 3C, D. They should not be interpreted in the same way as Figure 3B, i.e., a simple linear relationship with arousal (‘arousal is higher on easy incorrect trials and therefore fMRI amplitude is higher’). Instead, see the simulations visualized in Figure 3—figure supplement 2 and Figure 3—figure supplement 3 for a better intuition of how RT and fMRI amplitude are related in our model.
Figure 3—figure supplement 2
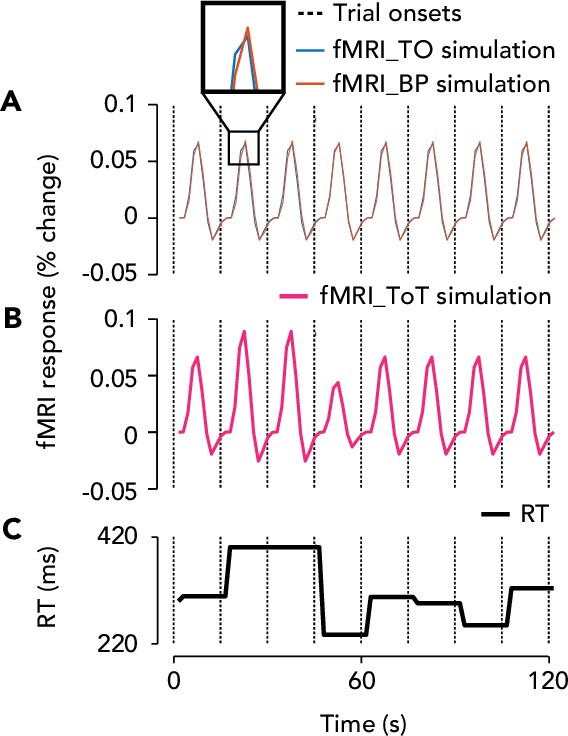
Trial onset, button press, and time-on-task fMRI predictors in the general linear mixed model (GLMM), and their dependence on reaction time (RT).
(A) Blue curve, trial onset (‘fMRI_TO’) locked fMRI response over eight trials. Red curve, button press (‘fMRI_BP’) locked fMRI response. Dashed vertical lines, trial onsets. Inset, shows delay between the two responses, which varies from trial to trial depending on the RT. This delay will affect the amplitude of their sum, such that a longer delay will cause a lower amplitude summed response. (B) Pink curve, time-on-task (‘fMRI_ToT’) evoked fMRI response. Note that the time-on-task boxcar is longer in duration when the RT is slower, leading to a higher amplitude ToT-evoked fMRI response. (C) RT on each trial in milliseconds, taken from one observer’s data.
Figure 3—figure supplement 3
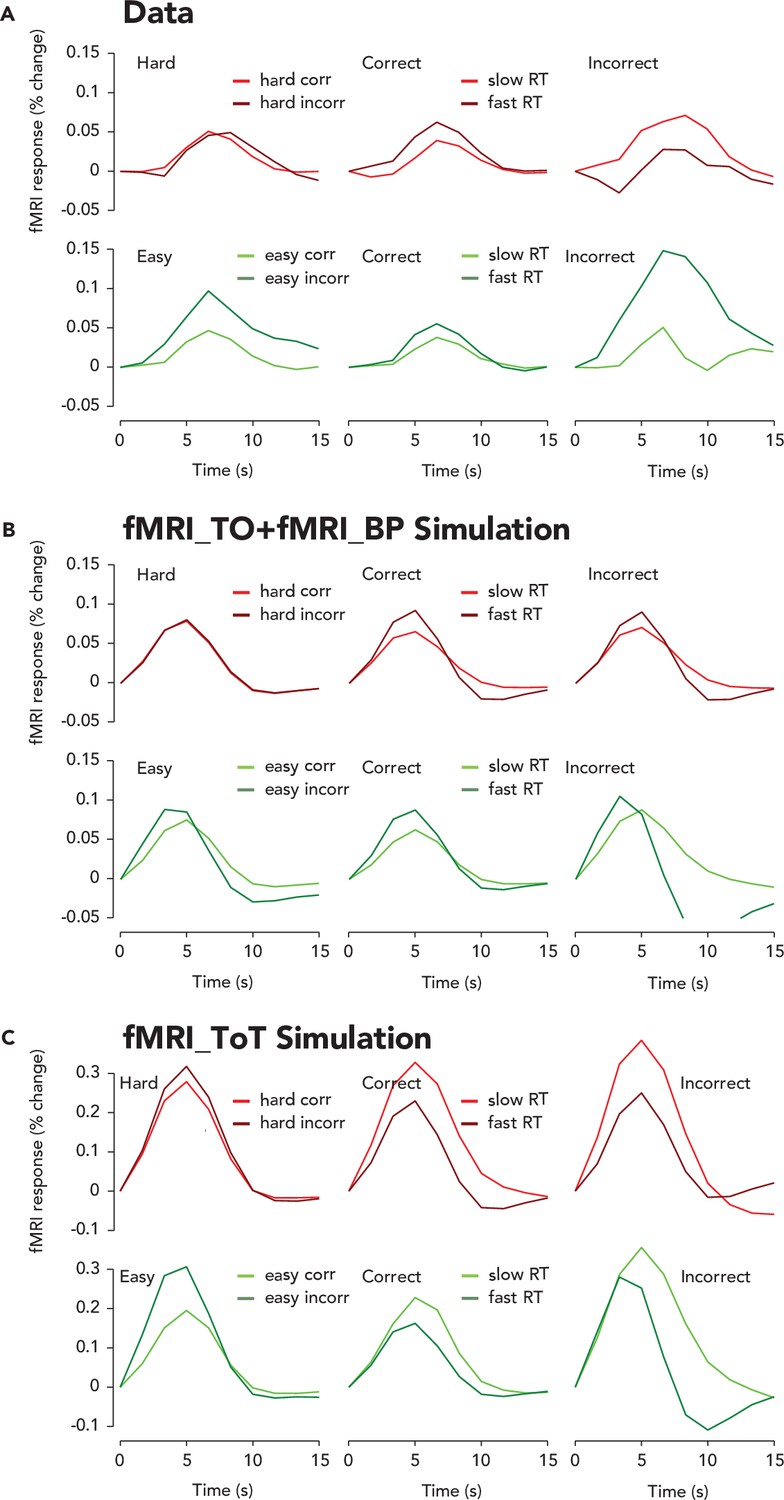
Amplitude modulation of the trial-averaged task-related response (TRR) with reaction time (RT) lies between two hypothetical extremes revealed by simulations.
(A) Trial-averaged TRRs for easy, hard, correct, incorrect, and fast and slow RT trials. Same format and color scheme as Figure 3B–D, but without error bars for ease of comparison between data and simulation. (B). Trial-averaged sum of the trial onset and button press locked fMRI responses, as plotted in Figure 3—figure supplement 2A. Same format as (A). Notice that the trial-averaged response is higher amplitude for fast than slow RTs, consistent with shorter delays between the fMRI_TO and fMRI_BP inputs leading to a higher amplitude of the summed response. (C) Trial-averaged time-on-task evoked fMRI response, as plotted in Figure 3—figure supplement 2B. Notice that the trial-averaged response is higher amplitude for slow RTs, consistent with a longer duration time-on-task input and greater temporal summation.
Figure 4

Physiological responses were similarly modulated by difficulty and behavioral accuracy.
(A) Task-evoked pupil responses. Solid black lines, average task-evoked pupil response across trials and observers. Error surfaces, two SEM, across observers (N = 5). Green, easy runs of trials. Red, hard runs. Light colors, trials with a correct behavioral report. Dark colors, incorrect. All aspects of the pupil and fMRI protocols were identical, except the ISI was 3.8 s in the former and 14.8 s in the latter. (B) Amplitude of pupil dilation, measured as the standard deviation of the task-evoked pupil response time course. Error bar, two SEM. Asterisks, *p<0.05, **p<0.01, ***p<0.001 (permutation tests; one-tailed). Test statistic, the difference in the mean response amplitude for easy incorrect vs. correct trials, hard incorrect vs. correct trials, or hard correct vs. easy correct trials. (C–H) Physiological measurements collected during fMRI scanning were modulated by task difficulty and behavioral accuracy. Circle, average of physiological measure across time, trials, and participants. Error bar, two SEM (N = 9). Same format as (B), with asterisks indicating result of permutation test.
Figure 5 with 2 supplements
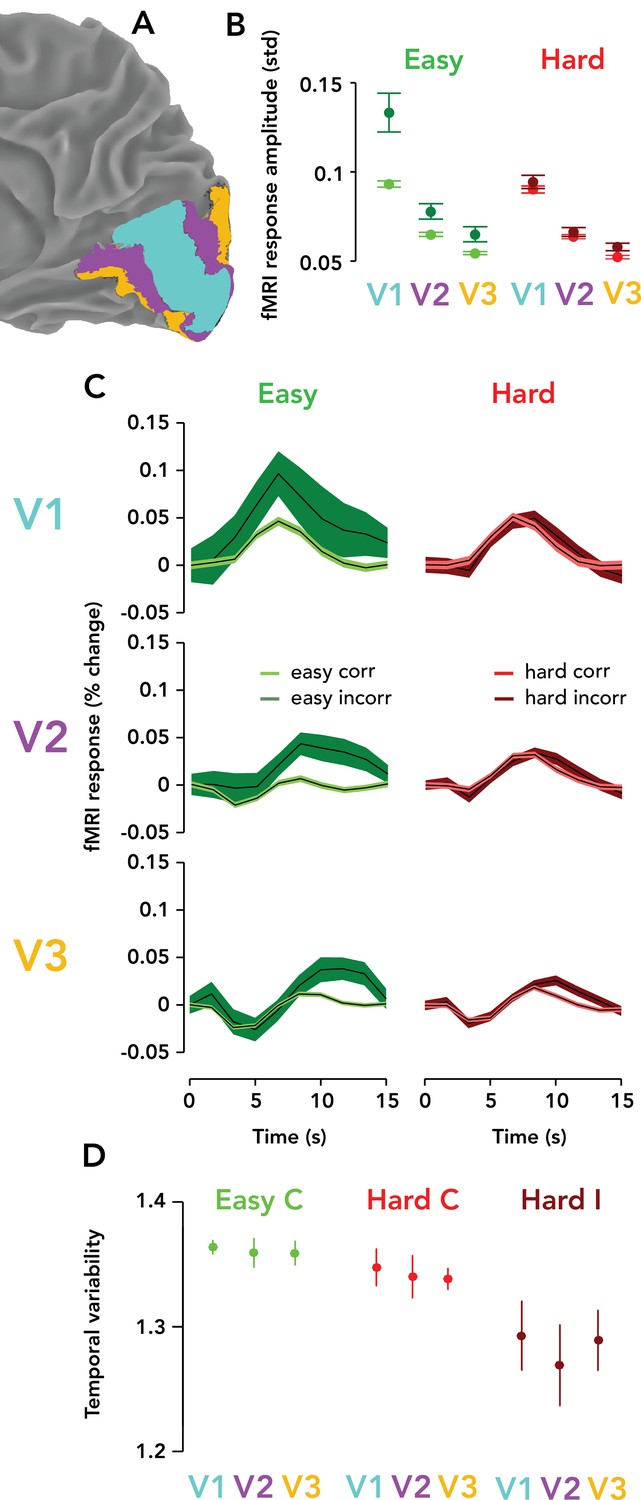
Task-related responses were progressively weaker ascending the visual cortical hierarchy.
(A) Posterior third of the right hemisphere (ipsilateral to stimulus), Observer 8, with atlas-defined V1, V2, and V3 highlighted in three different colors (cyan, purple, orange, respectively). (B) fMRI response amplitude, measured as the standard deviation of the time course on each trial, scaled with task difficulty and behavioral accuracy in V1–V3. Weaker responses and modulations were observed in V3 than V2, and in V2 than V1. Circle, mean fMRI response amplitude across observers (N = 9). Error bar, two SEM. Green, easy runs. Red, hard runs. Light colors, correct trials. Dark colors, incorrect trials. (C) Mean TRRs across observers for different trial types and ROIs. Same format as Figure 3B. (D) Temporal variability is similar across V1, V2, and V3. Same format as Figure 3G. Easy incorrect not shown because it is far below the y-limit of the graph, and scaling the y-axis to show this datapoint would render the differences between the other conditions invisible (easy incorrect temporal variability, V1: mean, 0.55; SEM, 0.22; V2: mean, 0.56; SEM: 0.21; V3: mean, 0.53; SEM, 0.21).
Figure 5—figure supplement 1
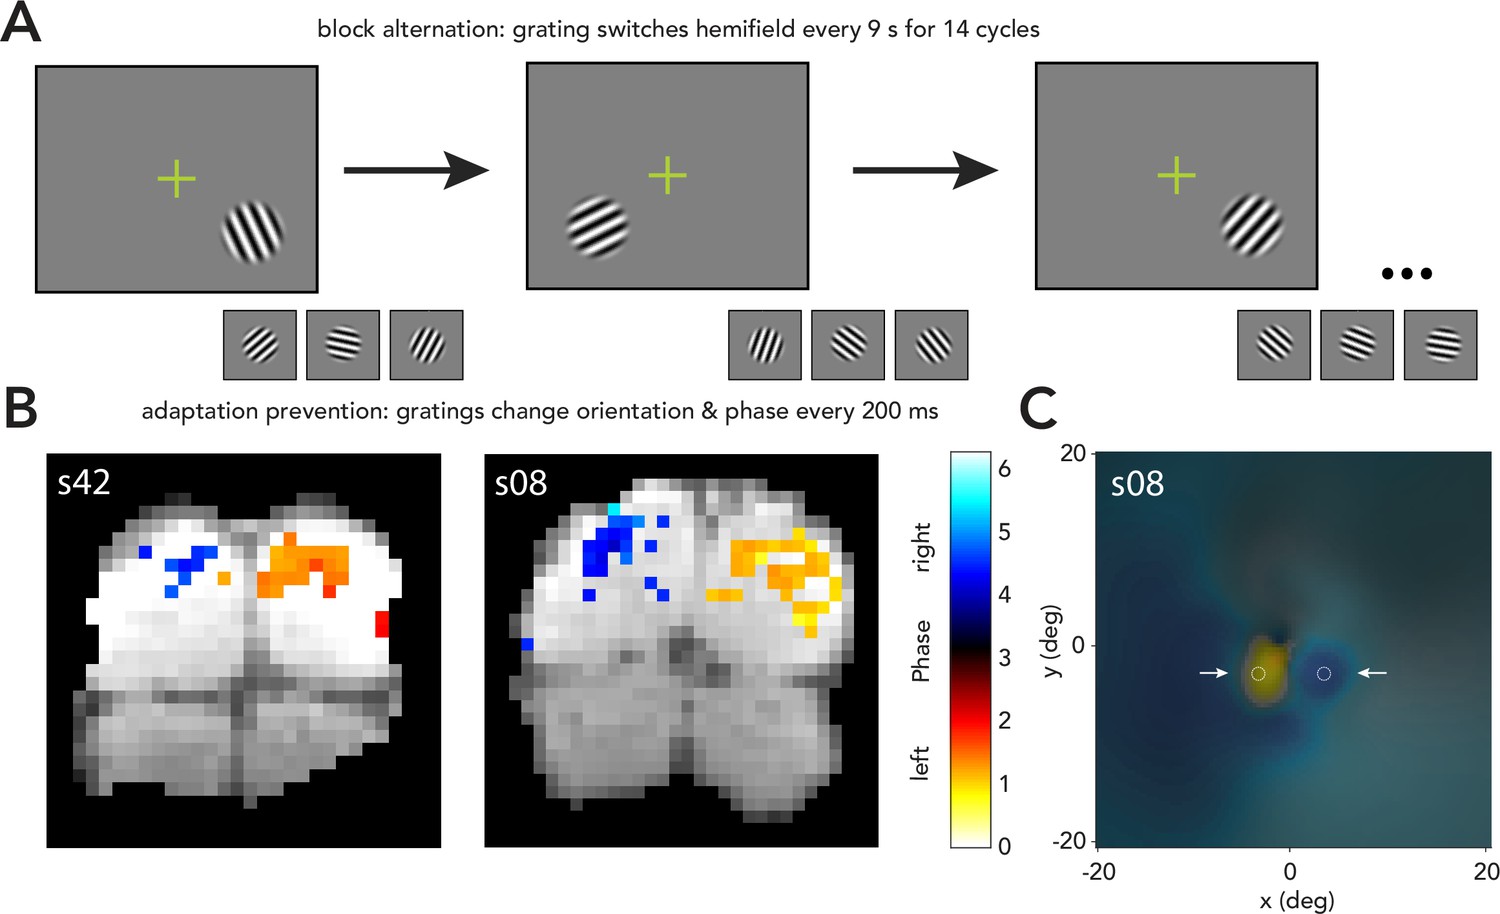
Localizer and stimulus-evoked activity.
(A) Stimulus localizer used a block alternation design, in which a grating (same eccentricity, polar angle, and size as during task) was swapped between the left and right hemifield every 9 s for 14 cycles (around 4 min). The grating’s orientation and phase were changed every 200 ms to prevent neural adaptation. (B) fMRI responses during localizer for two observers. Colorbar shows phase of best fitting sinusoid at block-alternation frequency, from 0 to 2*pi. ‘Left’ and ‘right’ labels show phases corresponding to left and right field stimuli. Coherence was thresholded for each observer to show voxels with highest coherence. Antiphase responses were observed in the two hemispheres. (C) pRF-based visual field map during the localizer for one example observer with clearly demarcated stimulus-evoked activity. Colorbar is the same as in (B), and alpha (transparency) at each location indicates coherence for voxels in V1/2/3 representing that part of the visual field. Dashed circles, stimulus locations. Arrows, pointing to two distinct regions of fMRI activity with opposite phase, centered around stimuli.
Figure 5—figure supplement 2
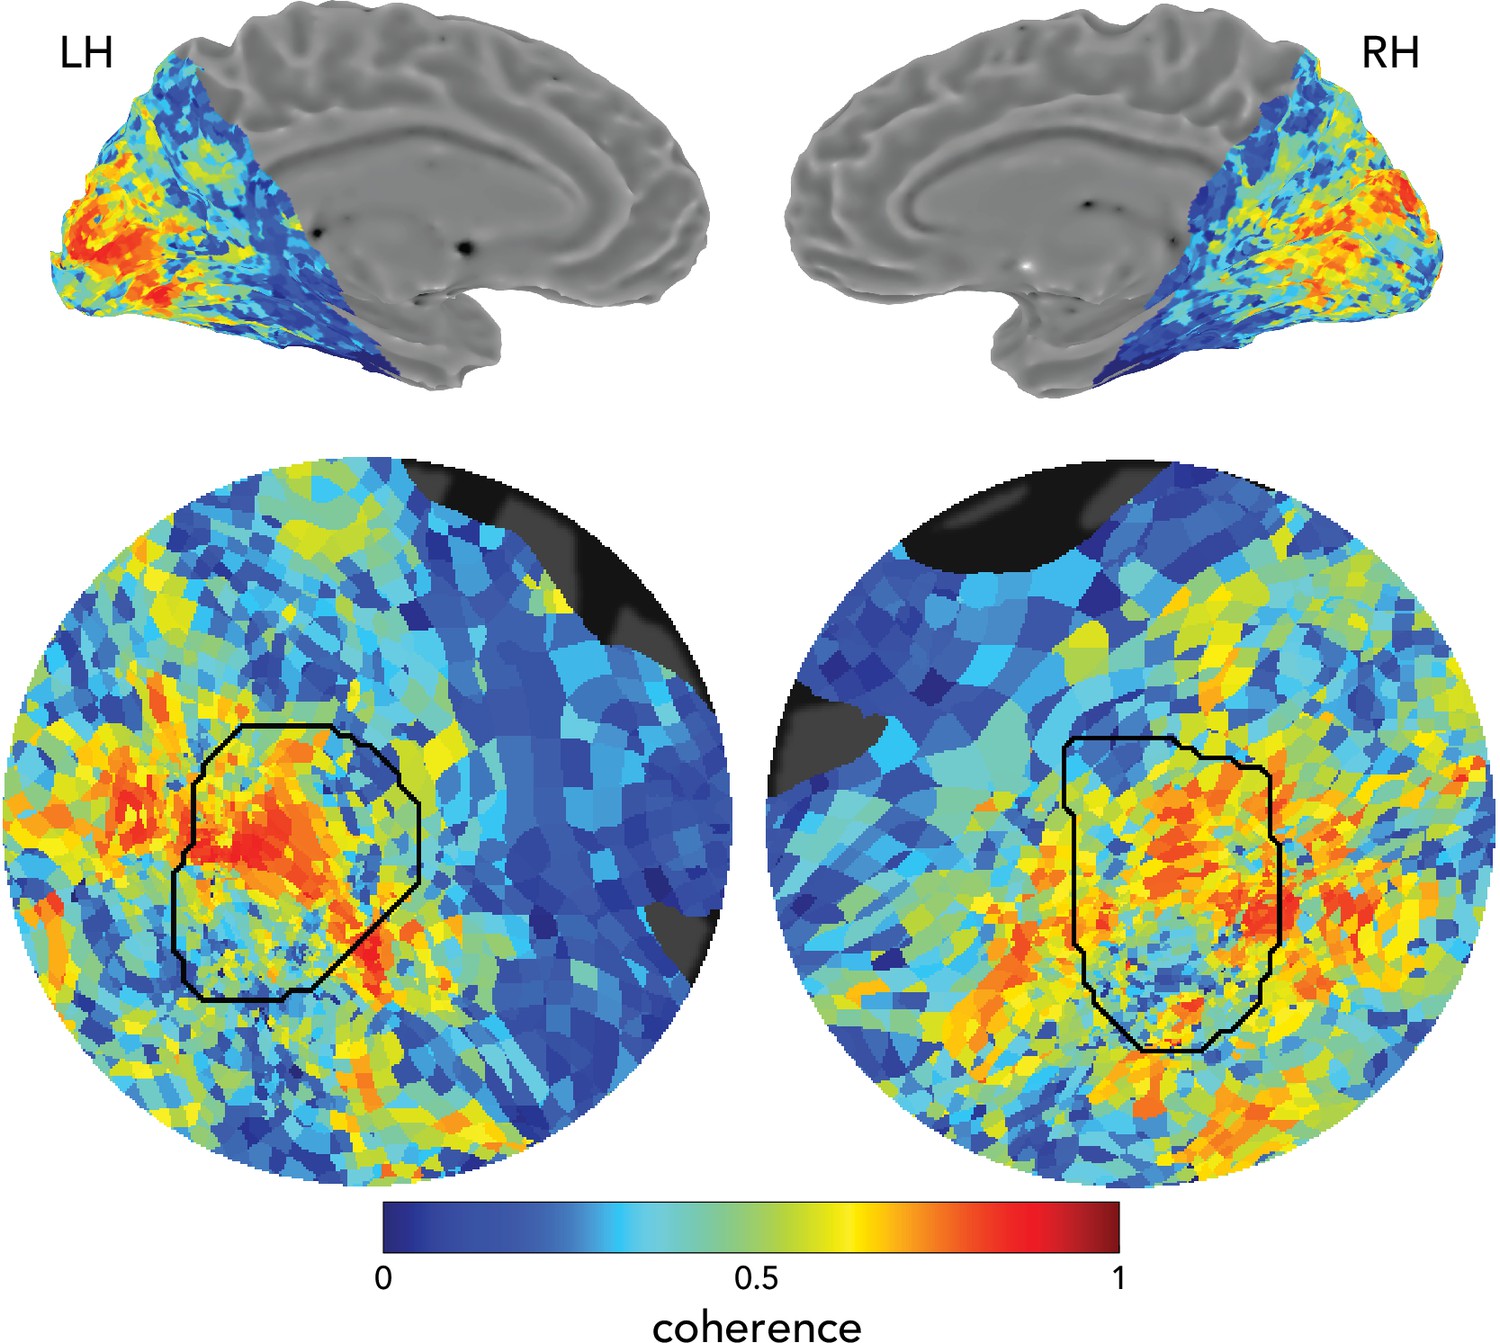
fMRI responses in the left and right hemispheres.
Data from observer O9 (average over all easy runs of task). Top panels, medial views of left and right hemisphere. Bottom panels, flat maps centered on V1 showing fMRI responses. Color map, coherence of best fitting sinusoid at the task frequency (1/15 Hz). Black ROIs, atlas-defined left and right V1 , based on observer’s anatomy. We observed a similar degree of task-entrained activity in both hemispheres.
Additional files
-
Transparent reporting form
- https://cdn.elifesciences.org/articles/73018/elife-73018-transrepform1-v2.docx
-
Source code 1
GLMM coefficients and p-values.
See attached fileS1.txt file for full output from Matlab’s lme function.
- https://cdn.elifesciences.org/articles/73018/elife-73018-code1-v2.zip
Download links
A two-part list of links to download the article, or parts of the article, in various formats.
Downloads (link to download the article as PDF)
Open citations (links to open the citations from this article in various online reference manager services)
Cite this article (links to download the citations from this article in formats compatible with various reference manager tools)
Task-related hemodynamic responses in human early visual cortex are modulated by task difficulty and behavioral performance
eLife 11:e73018.
https://doi.org/10.7554/eLife.73018


