TREM2 regulates purinergic receptor-mediated calcium signaling and motility in human iPSC-derived microglia
- Department of Physiology and Biophysics, University of California, Irvine, United States
- Department of Neurobiology and Behavior, University of California, Irvine, United States
- Sue and Bill Gross Stem Cell Research Center, University of California, Irvine, United States
- UCI Institute for Memory Impairments and Neurological Disorders, University of California, United States
- Institute for Neurodegenerative Diseases, University of California, San Francisco, United States
- Center for Advanced Sciences and Technology (CAST), University "G. d'Annunzio" of Chieti-Pescara, Italy
- Department of Neuroscience, Imaging and Clinical Sciences, University G d'Annunzio of Chieti-Pescara, Italy
- Department of Mechanical Engineering and Engineering Science, University of North Carolina, United States
- Institute of Quantum Biophysics, Department of Biophysics, Dept of Intelligent Precision Healthcare Convergence, Sungkyunkwan University, Republic of Korea
- Institute for Immunology, University of California, Irvine, United States
Figures
Figure 1 with 2 supplements
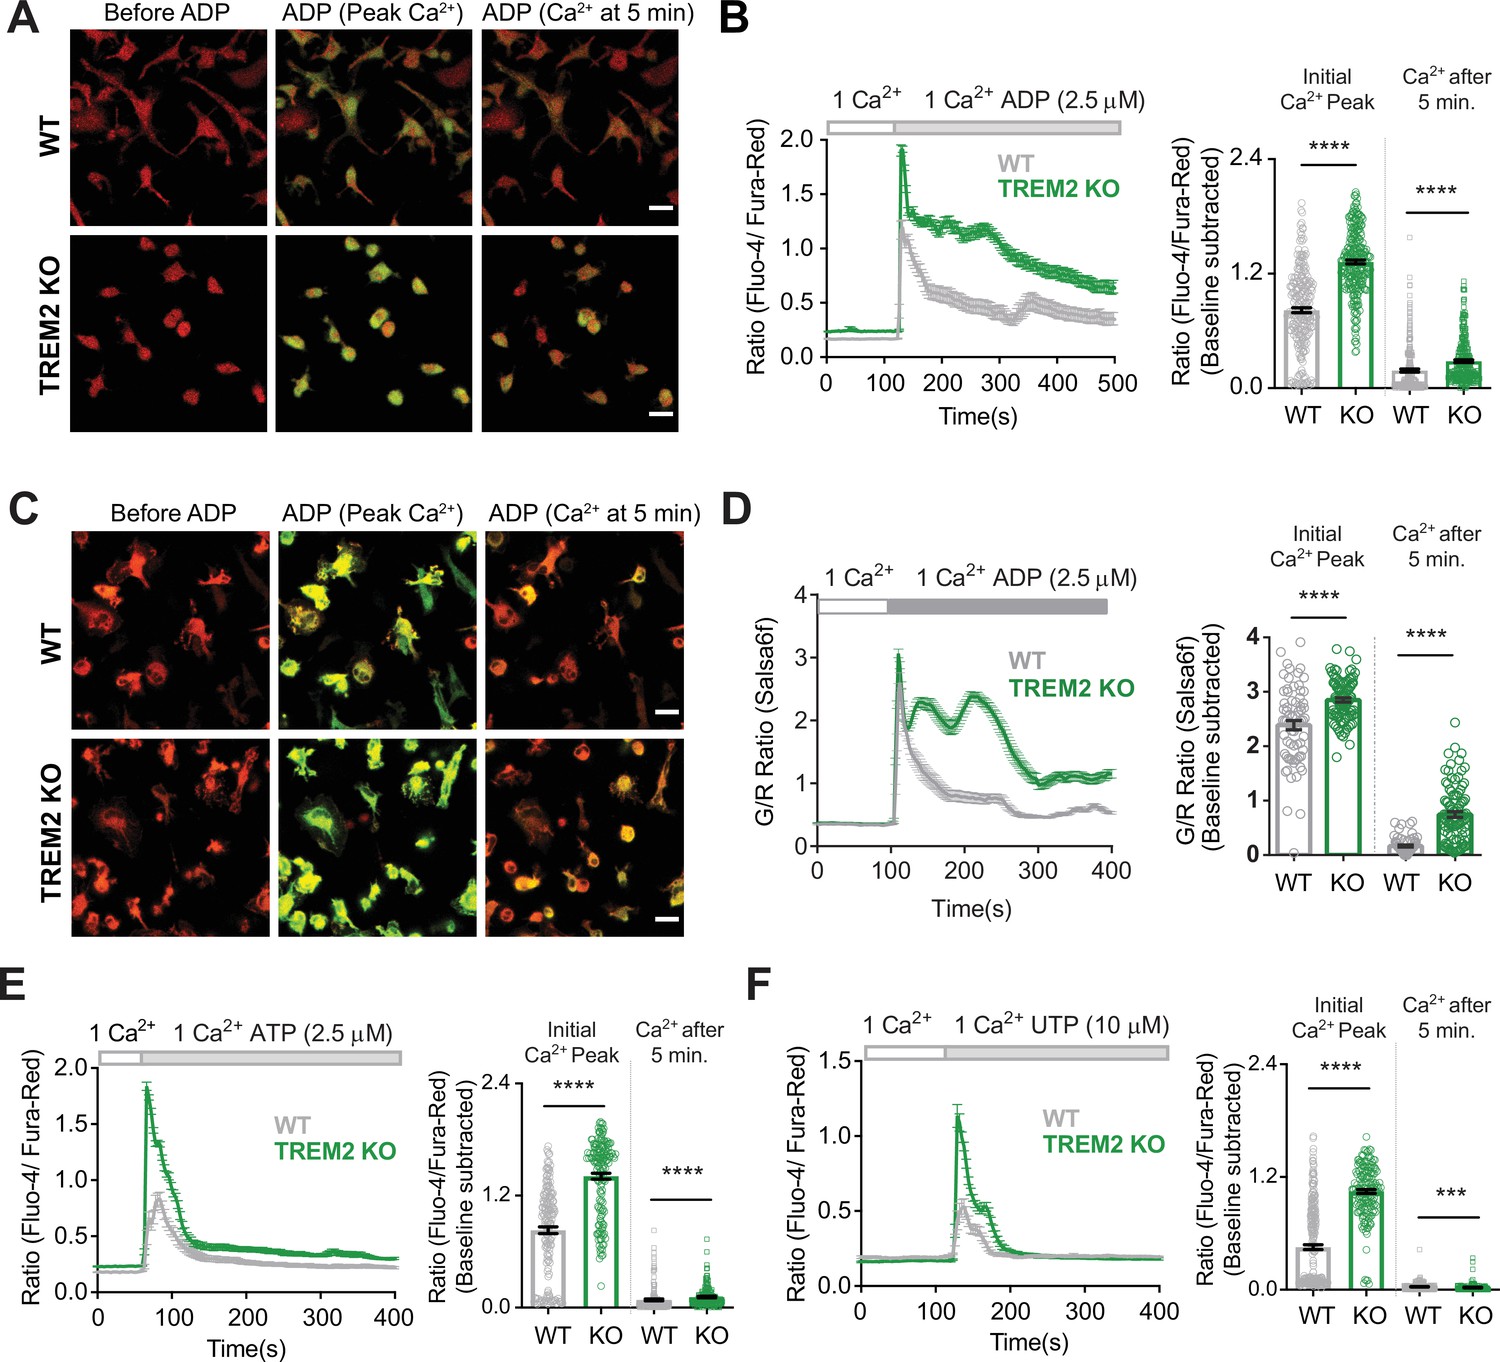
Microglia lacking TREM2 show exaggerated Ca2+ responses to purinergic stimulation.
(A) Representative red-green channel overlay images of wild type (WT) (top) and TREM2 knockout (KO) (bottom) induced pluripotent stem cell (iPSC)-microglia loaded with Fluo-4 (green) and Fura-red (red) showing resting cytosolic Ca2+ before ADP, and Ca2+ levels 15 s and 5 min after ADP addition. Scale bar = 20 μm. (B) Average traces (left panels) showing changes in cytosolic Ca2+ in response to 2.5 μM ADP in 1 mM Ca2+ buffer (n = 39–44 cells). Baseline-subtracted peak Ca2+ response and cytosolic Ca2+ levels 5 min after ADP shown on the right (n = 250–274 cells, five experiments, Mann–Whitney test). (C, D) Cytosolic Ca2+ response to ADP as in (A) and (B) but in iPSC-microglia expressing the GCaMP6f-tdTomato fusion Ca2+ probe Salsa6f (n = 41–53 cells, two independent experiments, Mann–Whitney test). Images in (C) are overlay of GCaMP6f (green) and tdTomato (red) channel images. Scale bar = 20 μm. (E) Ca2+ responses to 2.5 μM ATP in WT and TREM2 KO iPSC-microglia. Average traces (left panel, n = 63–71 cells) and bar graph summary of peak cytosolic Ca2+ and Ca2+ after 5 min (right panel, 165–179 cells, three experiments, Mann–Whitney test). (F) Ca2+ responses to 10 μM UTP. Average traces (45–55 cells) and summary of peak cytosolic Ca2+ and Ca2+ after 5 min (175–269 cells, three experiments, Mann–Whitney test). Data shown as mean ± SEM for traces and bar graphs. p-Values indicated by *** for p<0.001, ****p<0.0001.
-
Figure 1—source data 1
Microglia lacking TREM2 show exaggerated Ca2+ responses to purinergic stimulation.
In this dataset, the results of microglial stimulation with purinergic agonists and validation of Salsa6f isogenic microglia are included.
- https://cdn.elifesciences.org/articles/73021/elife-73021-fig1-data1-v2.xlsx
Figure 1—figure supplement 1
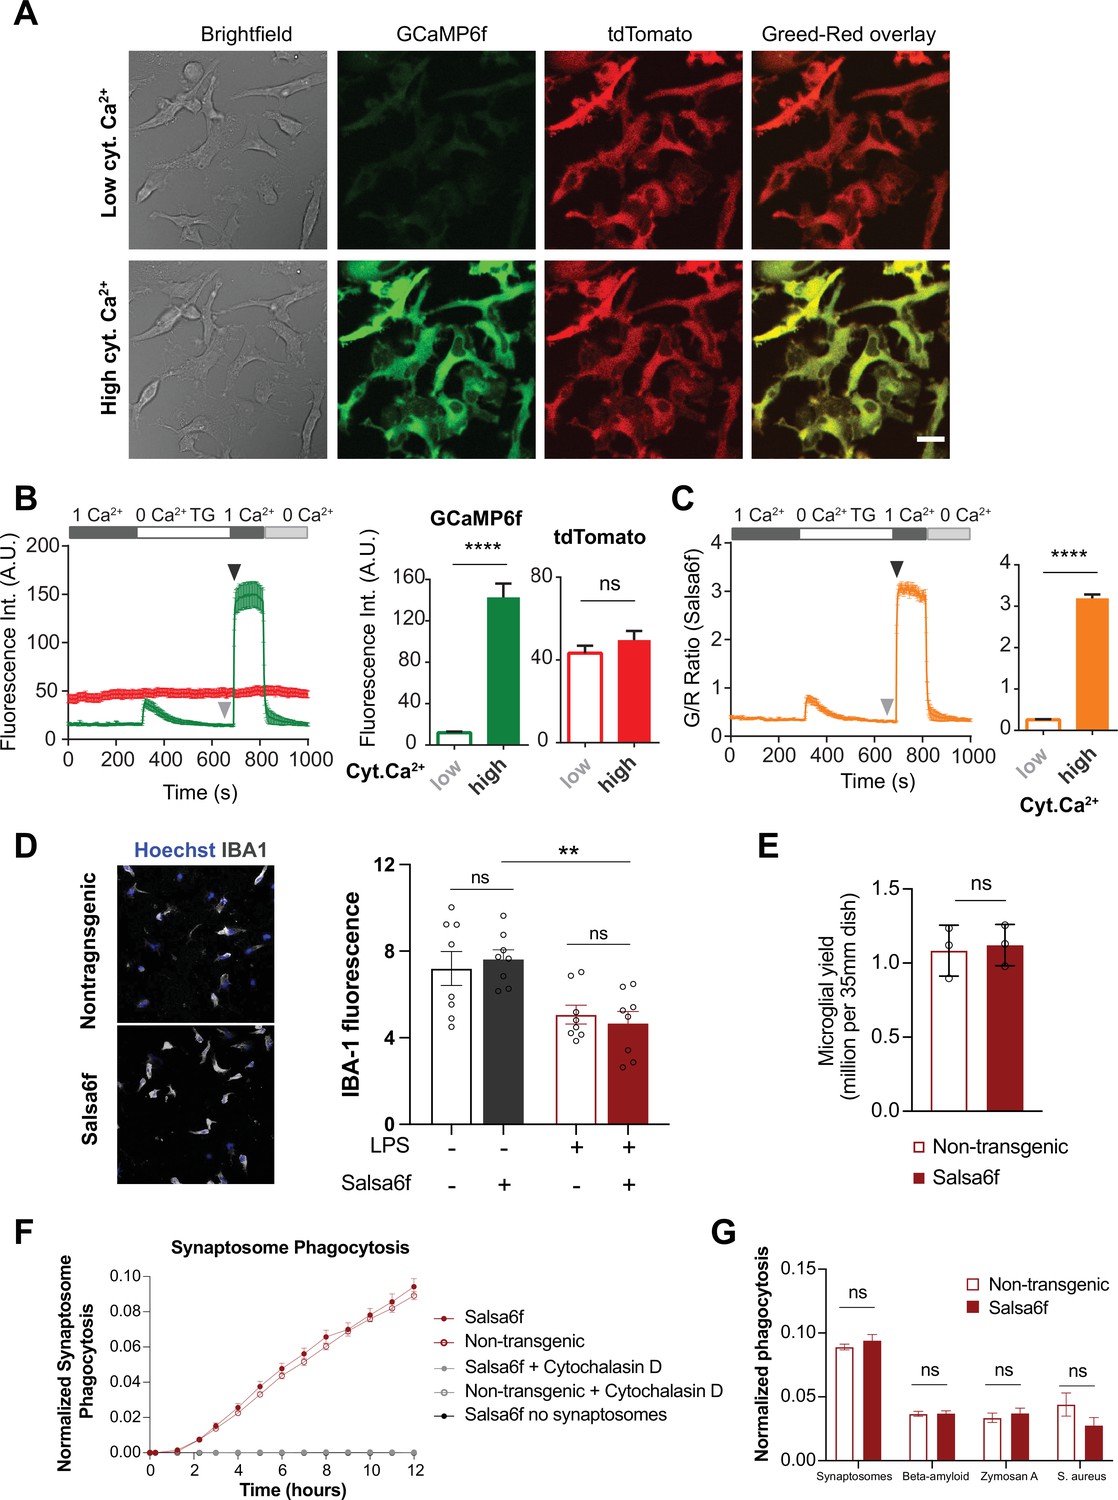
Validation of Salsa6f transgenic induced pluripotent stem cell (iPSC)-microglia.
(A) Representative bright field, green (GCaMP6f), red (tdTomato), and green/red channel overlay images of transgenic Salsa6f expressing iPSC-microglia at low (top row) and high (bottom row) cytosolic Ca2+ levels. Cells were treated with 2 μM thapsigargin (TG) to deplete stores and evoke store-operated Ca2+ entry (SOCE). Images are shown at the end of TG treatment for low Ca2+ and at the peak of SOCE for high Ca2+. Scale bar = 20 μm. (B) Trace of average change in fluorescence intensity of tdTomato (red) and GCamp6f (green) over time. Summary of GCaMP6f and tdTomato intensities before and after invoking SOCE is shown on the right. (C) Ratiometric GCaMP6f/ tdTomato signal (green/red or G/R ratio) over time calculated from (B). Summary of G/R ratio at low and high cytosolic Ca2+ (B, C, n = 19 cells, Mann–Whitney test). (D) Immunofluorescence images showing staining for the microglia-specific marker IBA1 in either resting or activated wild type (WT) or Salsa6f-transgenic iPSC-microglia (left). Right panel shows quantification of IBA1 protein expression (n = 4 wells, two independent images per well, t-test). Cells were activated with 100 ng/mL lipopolysaccharide (LPS for 24 hr). (E) Microglia cell counts at final day of differentiation (n = 3 wells, t-test). (F) Phagocytosis of synaptosomes in WT non-transgenic (open circle) and Salsa6f-expressing (closed circle) iPSC-microglia. Cytochalasin D (gray, 10 µM) used as negative control to inhibit phagocytosis. Live cultures imaged on IncuCyte S3 (n = 4 wells; four images per well). (G) Phagocytic load at 24 hr for synaptosomes, beta-amyloid, zymosan A, and S. aureus (n = 4 wells; four images per well; one-way ANOVA with Tukey post-hoc test). Data shown as mean ± SEM for traces and bar graphs. p-Values indicated by ns for nonsignificant, ****P<0.0001.
Figure 1—figure supplement 2
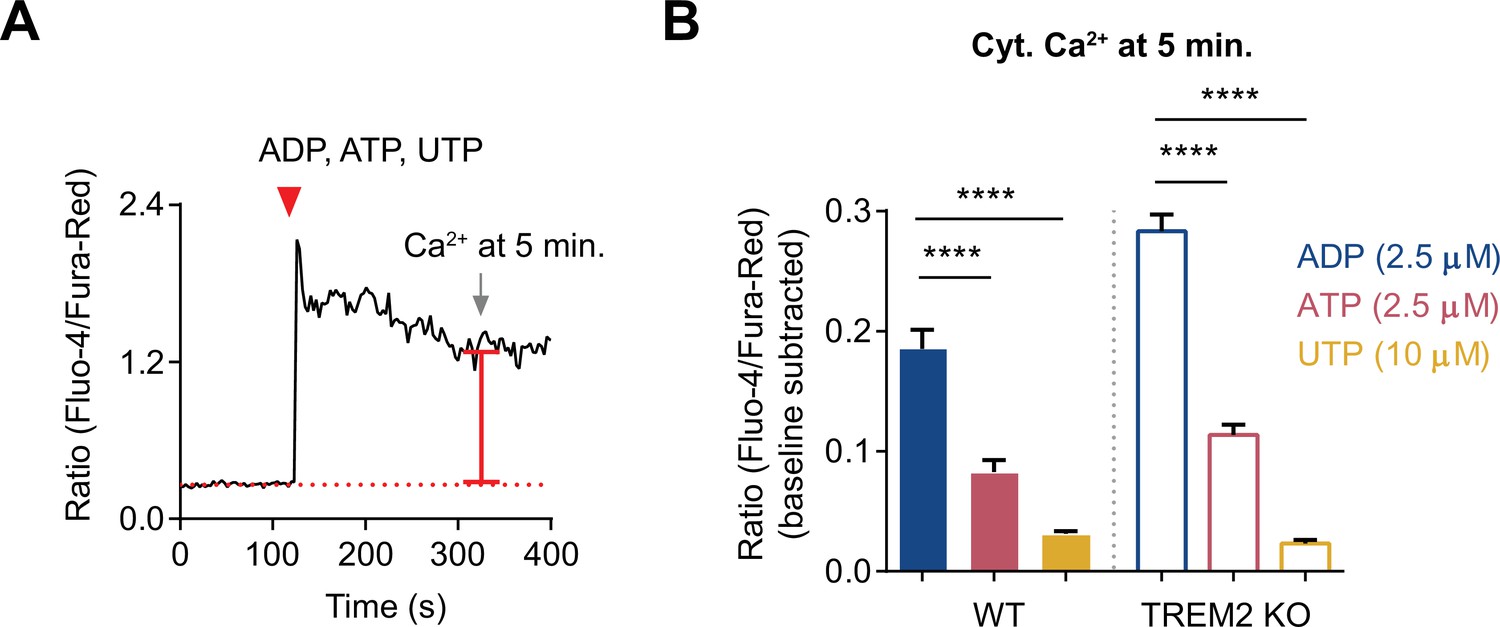
Comparison of cytosolic Ca2+ signal over time triggered by various purinergic agonists.
(A) Representative trace showing changes in cytosolic Ca2+ in a single cell to illustrate the scheme for measuring cytosolic Ca2+ level 5 min after agonist application. (B) Bar graph summary of cytosolic Ca2+ levels in wild type (WT) and TREM2 knockout (KO) induced pluripotent stem cell (iPSC)-microglia 5 min after application of 2.5 μM ADP (blue), 2.5 μM ATP (red), and 10 μM UTP (yellow). N = 165–274 cells pooled from 2 to 3 experiments. One-way ANOVA with multiple comparisons. Data shown as mean ± SEM for the bar graph. p-Values indicated by ****p<0.0001.
Figure 2 with 1 supplement

Higher sensitivity of TREM2 knockout (KO) microglia to ADP is driven by increased purinergic receptor expression.
(A) Schematic highlighting key downstream Ca2+ signaling events triggered by ADP. Cytosolic Ca2+ response to ADP is determined by functional expression and activity of P2Y12 and P2Y13 receptors, IP3 receptors, endoplasmic reticulum (ER) store Ca2+ content, and store-operated Ca2+ entry (SOCE) regulated by STIM and Orai proteins. (B) Representative images (left panel) showing overlay of Fluo-4 (green) and Fura-red (red) channels in wild type (WT) (top) and TREM2 KO (bottom) induced pluripotent stem cell (iPSC)-microglia before and peak Ca2+ response after ADP addition in Ca2+-free buffer. Scale bar = 20 μm. Average trace showing Ca2+ response to ADP in Ca2+-free buffer (middle panel, 64–83 cells). Quantification of peak signal (right panel, n = 264–289 cells, four experiments, Mann–Whitney test). (C–E) Dose–response curves showing baseline-subtracted peak Ca2+ responses to ADP in Ca2+-free buffer (C), percent of ‘responding’ cells (D), and peak Ca2+ responses only in ‘responding’ cells (E). N = 84–474 WT cells and 70–468 TREM2 KO cells, 2–5 experiments. (F) RNA normalized read counts of P2Y12 and P2Y13 receptor expression from bulk RNA-sequencing of WT and TREM2 KO iPSC-microglia (n = 4, adjusted p-values from DESeq2). (G) Representative histogram (left panel) showing plasma membrane (PM) expression of P2Y12 receptor in WT and TREM2 KO microglia. Cells were stained with BV421-labeled anti-human P2Y12 receptor antibody. Isotype control is shown as dashed line. Right panel shows summary of median fluorescence intensity (MFI) of P2Y12 receptor-labeled cells (n = 10 samples each, Student’s t-test). (H) Ca2+ traces (left panel) showing response to 1 μM ADP in Ca2+-free buffer after 30 min pretreatment with a combination of P2Y12 receptor antagonist PSB 0739 (10 μM) and P2Y13 receptor antagonist MRS 2211 (10 μM). Summary of the peak Ca2+ response (right panel, n = 40–79 cells, two experiments, Mann–Whitney test). Data are mean ± SEM. p-Values indicated by ****p<0.0001.
-
Figure 2—source data 1
Higher sensitivity of TREM2 knockout (KO) microglia to ADP is driven by increased purinergic receptor expression.
In this dataset, the results of ADP stimulation in 0 Ca2+, dose curve of ADP in wild type (WT) and TREM2 KO, P2Y receptor expression, expression of key calcium signaling proteins, and inhibition of P2Y receptors are included.
- https://cdn.elifesciences.org/articles/73021/elife-73021-fig2-data1-v2.xlsx
Figure 2—figure supplement 1
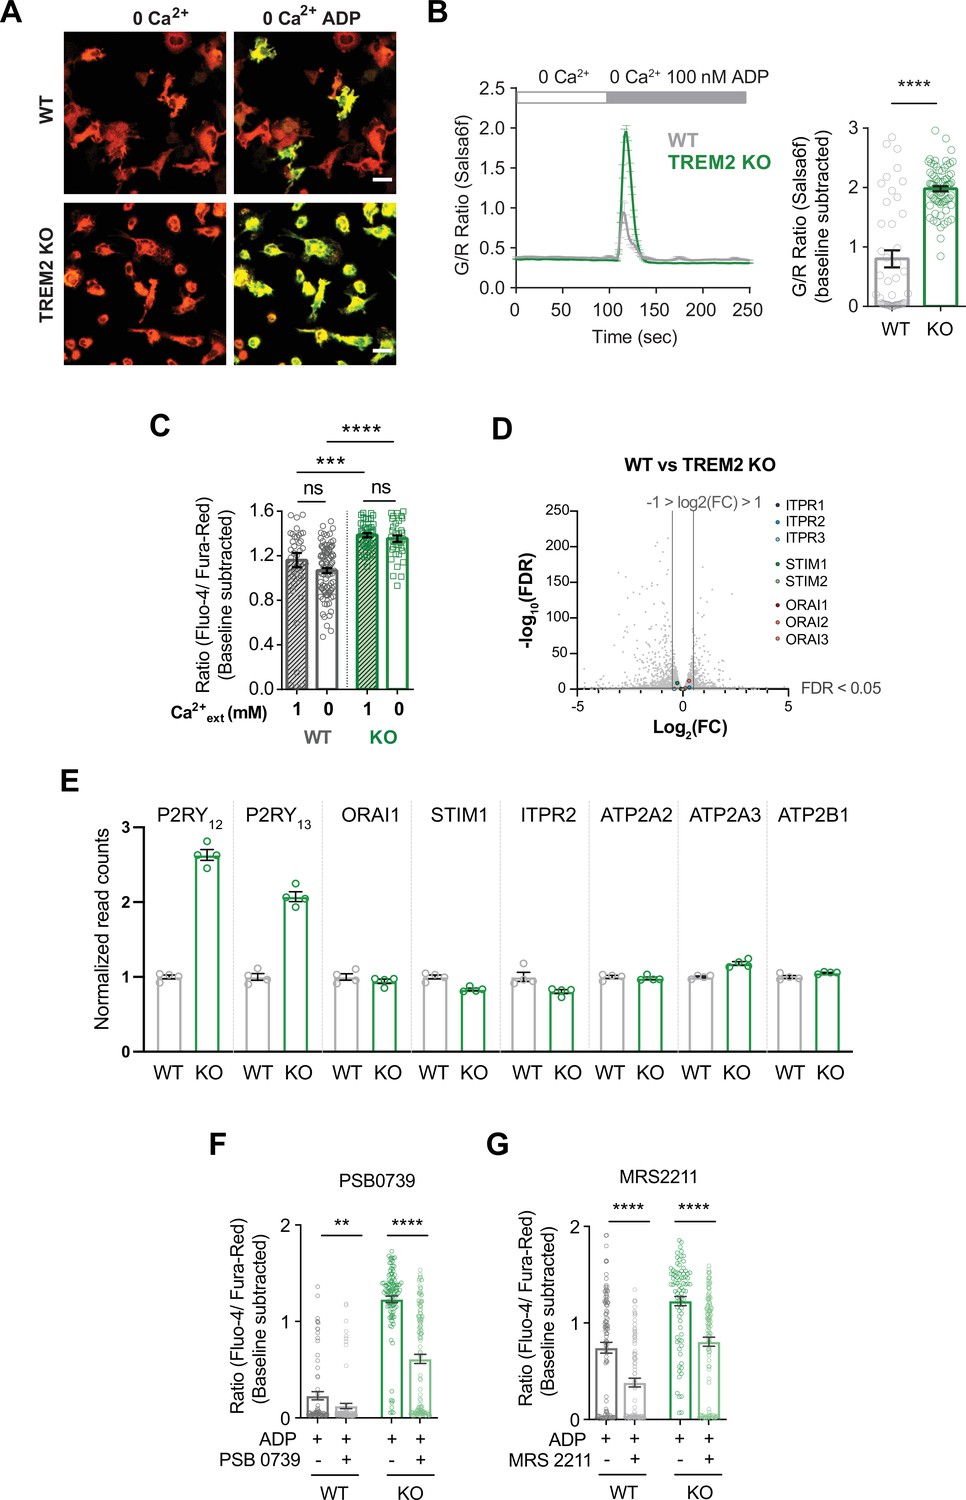
Role of P2Y12 and P2Y13 receptors in ADP-mediated augmentation of store release in TREM2 knockout (KO) microglia.
(A) Representative green (GCaMP6f) and red (tdTomato) channel overlay images of wild type (WT) (top) and TREM2 KO (bottom) induced pluripotent stem cell (iPSC)-microglia before and peak Ca2+ response after ADP addition in Ca2+-free buffer. Scale bar = 20 μm. (B) Average trace (left panel) showing Ca2+ response to 100 nM ADP in Ca2+-free buffer. Quantification of peak signal (right panel, n = 46–75 cells, two experiments, Mann–Whitney test). (C) Comparison of peak cytosolic Ca2+ in response to ADP (2.5 μM ADP) in 1 mM Ca2+ or Ca2+-free buffer (n = 38–96 cells, ordinary one-way ANOVA with multiple comparisons). (D) Volcano plot of differentially expressed genes from bulk RNA-sequencing of WT and TREM2 KO iPSC-microglia (n = 4). Genes for IP3R, STIM1, and ORAI1 are highlighted. (E) RNA normalized read counts for IP3 receptor type 2 (ITPR2), PMCA1 (ATP2B1), SERCA2 (ATP2A2), SERCA3 (ATP2A3), STIM1, and ORAI1 in WT and TREM2 KO iPSC-microglia. Isoforms expressed lower than 10 reads in any sample are not considered expressed and are not shown. Relative expression of P2Y12 and P2Y13 receptors is shown for comparison of the relative fold change between WT and TREM2 KO cells. (F, G) Peak Ca2+ response in Ca2+-free buffer after treatment with 1 or 10 μM ADP in the presence of P2Y12 receptor antagonist PSB 0739 (F) or P2Y13 receptor antagonist MRS 2211 (G), respectively. Cells were pretreated with 10 μM of PSB 0739 or 10 μM MRS 2211 for 30 min before imaging. (72–128 cells, F; 83–117 cells, G; representative of three experiments, Mann–Whitney test). Data shown as mean ± SEM for traces and bar graphs. Data shown as mean ± SEM for traces and bar graphs. p-Values indicated by ns, nonsignificant, **p<0.01, ***p<0.001, ****p<0.0001.
Figure 3 with 2 supplements
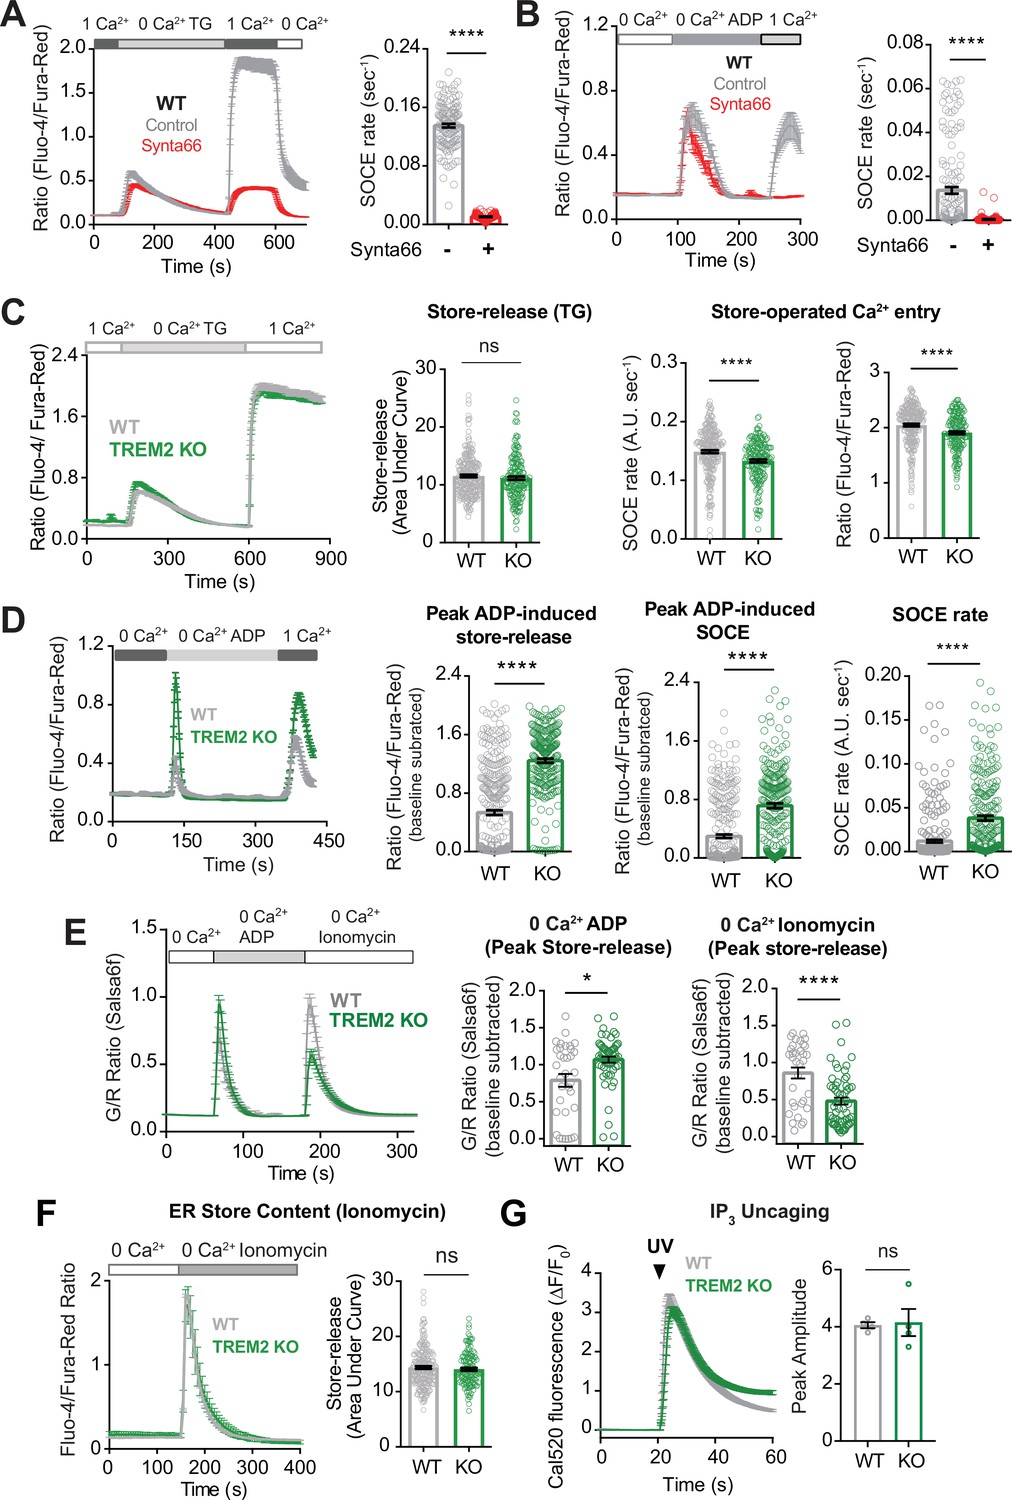
Regulation of ADP-evoked store-operated Ca2+ entry (SOCE) in wild type (WT) and TREM2 knockout (KO) microglia.
(A) SOCE in WT microglia triggered with thapsigargin (TG, 2 μM) in Ca2+-free buffer followed by readdition of 1 mM Ca2+ in the absence (control, gray trace) or presence (red trace) of the Orai channel inhibitor Synta66 (n = 34–48 cells). Cells were pretreated with Synta66 (10 μM) for 30 min before imaging. Bar graph summary of the rate of Ca2+ influx (n = 80–137 cells, two experiments, Mann–Whitney test). (B) SOCE evoked by ADP (2.5 μM) in WT microglia (gray trace) using a similar Ca2+ addback protocol as in (A). Red trace shows the effect of Synta66 on ADP-evoked SOCE. Right panel shows bar graph summary of the rate of ADP-triggered Ca2+ influx after readdition of 1 mM Ca2+ (n = 148–155 cells, two experiments, Mann–Whitney test). (C) Comparison of SOCE evoked with TG (2 μM) in WT and TREM2 KO cells (n = 90–129 cells). Bar graph summaries of endoplasmic reticulum (ER) store release quantified as area under the curve, rate of SOCE, and peak SOCE (n = 187–266 cells, two experiments, Mann–Whitney test). (D) Traces showing ADP-evoked SOCE in WT and TREM2 KO microglia after depleting stores with 100 nM ADP in Ca2+-free buffer and readdition of 1 mM Ca2+ (left panel, n = 97–114 cells). Comparison of ADP-evoked cytosolic Ca2+ peak, peak SOCE and SOCE rate (right panel, n = 234–313 cells, three experiments, Mann–Whitney test). (E) Ionomycin pulse experiment to measure residual ER Ca2+ pool in cells after initial treatment with ADP. WT and TREM2 KO cells were pulsed sequentially with ADP first (200 nM) and subsequently treated with ionomycin (1 μM) to empty and measure the residual pool of ER Ca2+. Imaging was done entirely in Ca2+-free buffer to prevent Ca2+ influx across the plasma membrane (PM). Average trace (left panel), peak ADP Ca2+ response (middle panel), and peak ionomycin-induced Ca2+ response (right panel) (n = 38–60 cells, 3–4 experiments, Mann–Whitney test). (F) Average trace (left, 71–117 cells) and summary of ER store release after 2 μM ionomycin treatment in Ca2+-free buffer (right, 146–234 cells, two experiments; nd, nonsignificant p>0.05, Mann–Whitney test). (G) Same as (H) but in response to UV IP3 uncaging (167–200 cells, ns, nonsignificant p>0.05, nonparametric t-test). Data shown as mean ± SEM for traces and bar graphs. Data are mean ± SEM. p-Values indicated by ns, nonsignificant, *p<0.05, and ****p<0.0001.
-
Figure 3—source data 1
Regulation of ADP-evoked store-operated Ca2+ entry (SOCE) in wild type (WT) and TREM2 knockout (KO) microglia.
In this dataset, the results of blocking SOCE on ADP stimulation and investigation of store content as well as the correlation between original calcium store release and SOCE are included.
- https://cdn.elifesciences.org/articles/73021/elife-73021-fig3-data1-v2.xlsx
Figure 3—figure supplement 1
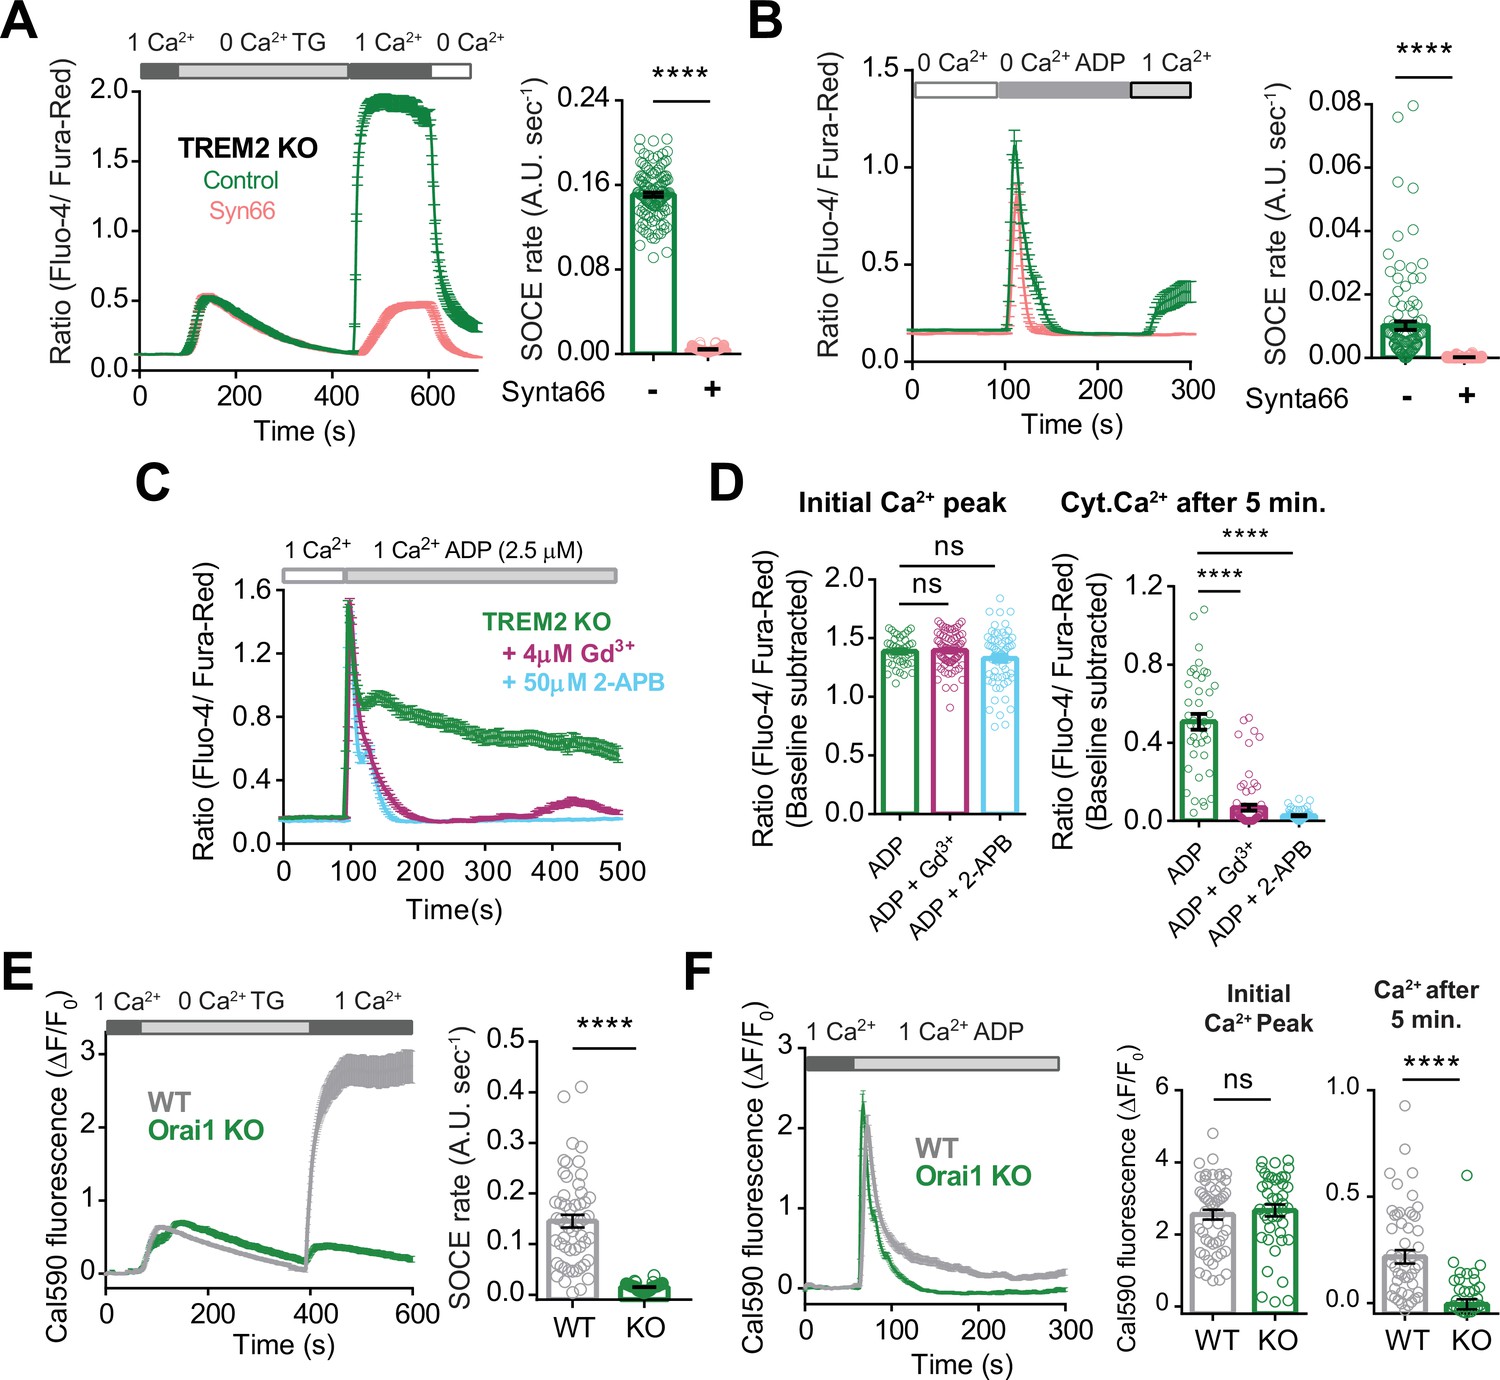
Regulation of store-operated Ca2+ entry (SOCE) in induced pluripotent stem cell (iPSC)-microglia.
(A) Average trace showing SOCE triggered in TREM2 knockout (KO) microglia via emptying endoplasmic reticulum (ER) Ca2+ stores with thapsigargin (TG, 2 μM) in Ca2+-free buffer followed by readdition of 1 mM Ca2+ in the absence (control, green trace) or presence (red trace) of the Orai channel inhibitor Synta66. Cells were pretreated with Synta66 (10 μM) for 30 min before experiment. Bar graph summary of the rate of Ca2+ influx after readdition of 1 mM Ca2+ (80–126 cells, Mann–Whitney test). (B) SOCE evoked by ADP (2.5 μM) in TREM2 KO microglia (green trace) using a similar Ca2+ addback protocol. Red trace shows the effect of Synta66 on ADP-evoked SOCE. Right panel summarizes the rate of ADP-triggered Ca2+ influx after readdition of 1 mM Ca2+ (n = 125–154 cells, two experiments, Mann–Whitney test). (C, D) Cytosolic Ca2+ response to ADP in TREM2 KO iPSC-microglia pretreated with 2-APB (50 μM) or Gd3+ (5 μM) to block SOCE. Average traces (C), baseline-subtracted initial peak Ca2+ responses to ADP (D, left panel), and baseline-subtracted Ca2+ after 5 min of ADP addition (D, right panel) are shown (n = 41–74 cells, ordinary one-way ANOVA with multiple comparisons). (E, F) Role of Orai1 in TG- and ADP-evoked SOCE in iPSC-microglia. (E) Comparison of TG-evoked SOCE in WT and Orai1 KO cell showing average traces (left panel) and summary of SOCE rate (right panel; n = 42–54 cells, 3–4 experiments, Mann–Whitney test). (F) ADP-evoked SOCE in WT and Orai1 KO showing average traces (left panel) and summary of SOCE rate (right panel; n = 42–53 cells, 3–4 experiments, Mann–Whitney test). Data shown as mean ± SEM for traces and bar graphs. p-Values indicated by ns, nonsignificant, ****p<0.0001.
Figure 3—figure supplement 2
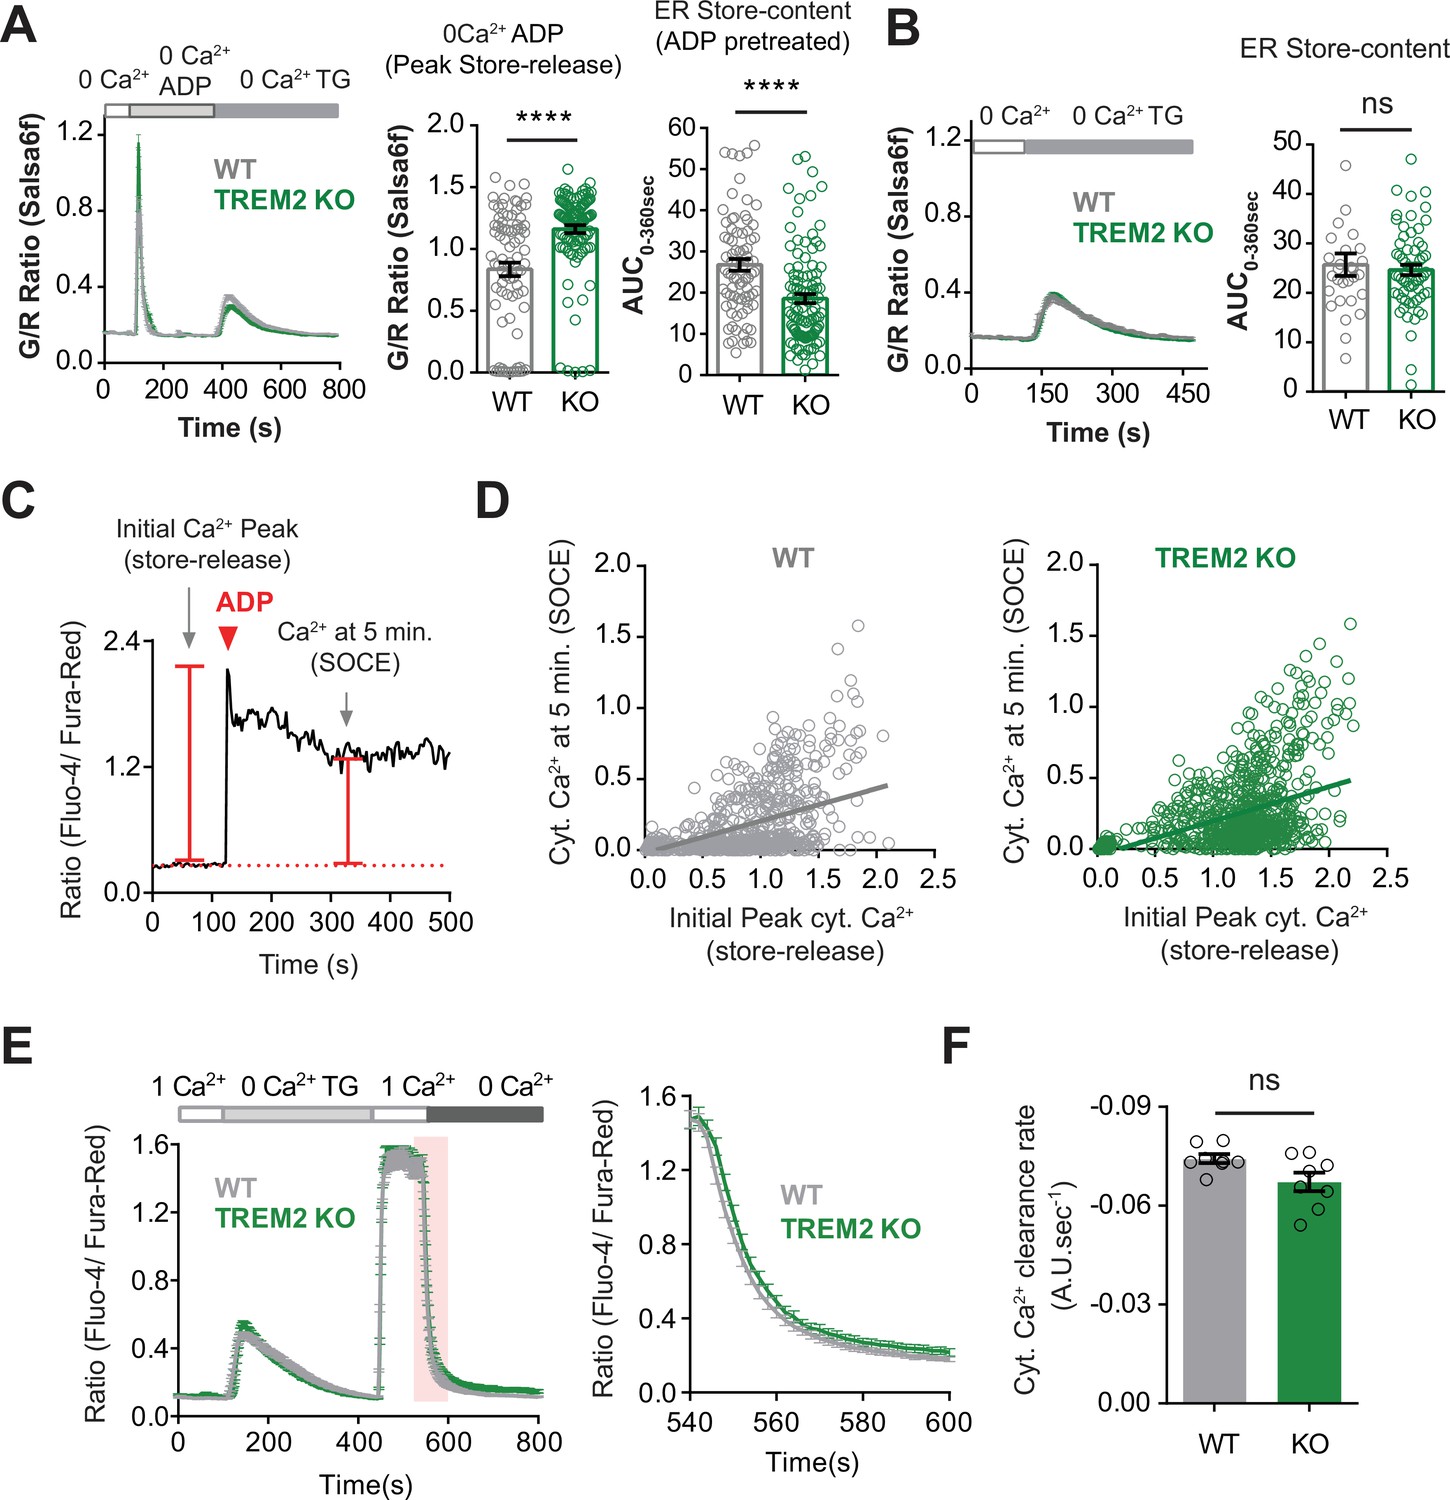
ADP depletes endoplasmic reticulum (ER) Ca2+ stores to a greater extent in TREM2 knockout (KO) microglia.
(A) Thapsigargin (TG) pulse experiment to measure residual ER Ca2+ pool in cells after initial treatment with ADP (1 μM) and subsequent treatment with TG (2 μM). Imaging was done in Ca2+-free buffer to prevent Ca2+ influx across the plasma membrane (PM). Average trace (left panel), peak ADP Ca2+ response (middle panel), and extent of TG-induced ER store release measured as area under the curve (AUC, right panel) (n = 81–108 cells, Mann–Whitney test). (B) Control experiment comparing the ER-Ca2+ pool in WT and TREM2 KO microglia after store depletion with TG and without any pretreatment with ADP (n = 29–63 cells, Mann–Whitney test). (C, D) Relationship between ADP-induced store release and store-operated Ca2+ entry (SOCE) in induced pluripotent stem cell (iPSC)-microglia. (C) Representative single-cell trace of Ca2+ signal in response to ADP in 1 mM extracellular Ca2+ buffer showing the scheme for measuring ER store release as the initial Ca2+ peak and SOCE as cytosolic Ca2+ level 5 min after ADP application. (D) Scatter plot showing correlation of initial ADP-induced Ca2+ response (store release) and cytoplasmic Ca2+ after 5 min (SOCE) in WT (gray) and KO (green) cells (n = 866–935 cells from multiple imaging runs with a range of ADP doses; in μM: 0.001, 0.1, 0.5, 1, 2, 2.5, 5, 10; comparison of slopes between WT and TREM2 KO: p=0.7631; extra sum of squares F-test). (E, F) Comparison of cytosolic Ca2+ clearance indicative of PMCA pump activity in WT and TREM2 KO microglia. SOCE was invoked and rate of Ca2+ decline was measured after addition of 0 mM Ca2+. (E) Average trace showing invoking SOCE with 2 μM TG (left panel). Right panel shows the drop in cytosolic Ca2+ following addition of Ca2+-free solution as highlighted (pink) in the SOCE trace. (F) Summary of rate of Ca2+ decline after addition of 0 mM Ca2+ (n = 8 imaging fields, 142–175 total cells, Mann–Whitney test). Data shown as mean ± SEM for traces and bar graphs. p-Values indicated by ns, nonsignificant, **p<0.01.
Figure 4 with 1 supplement
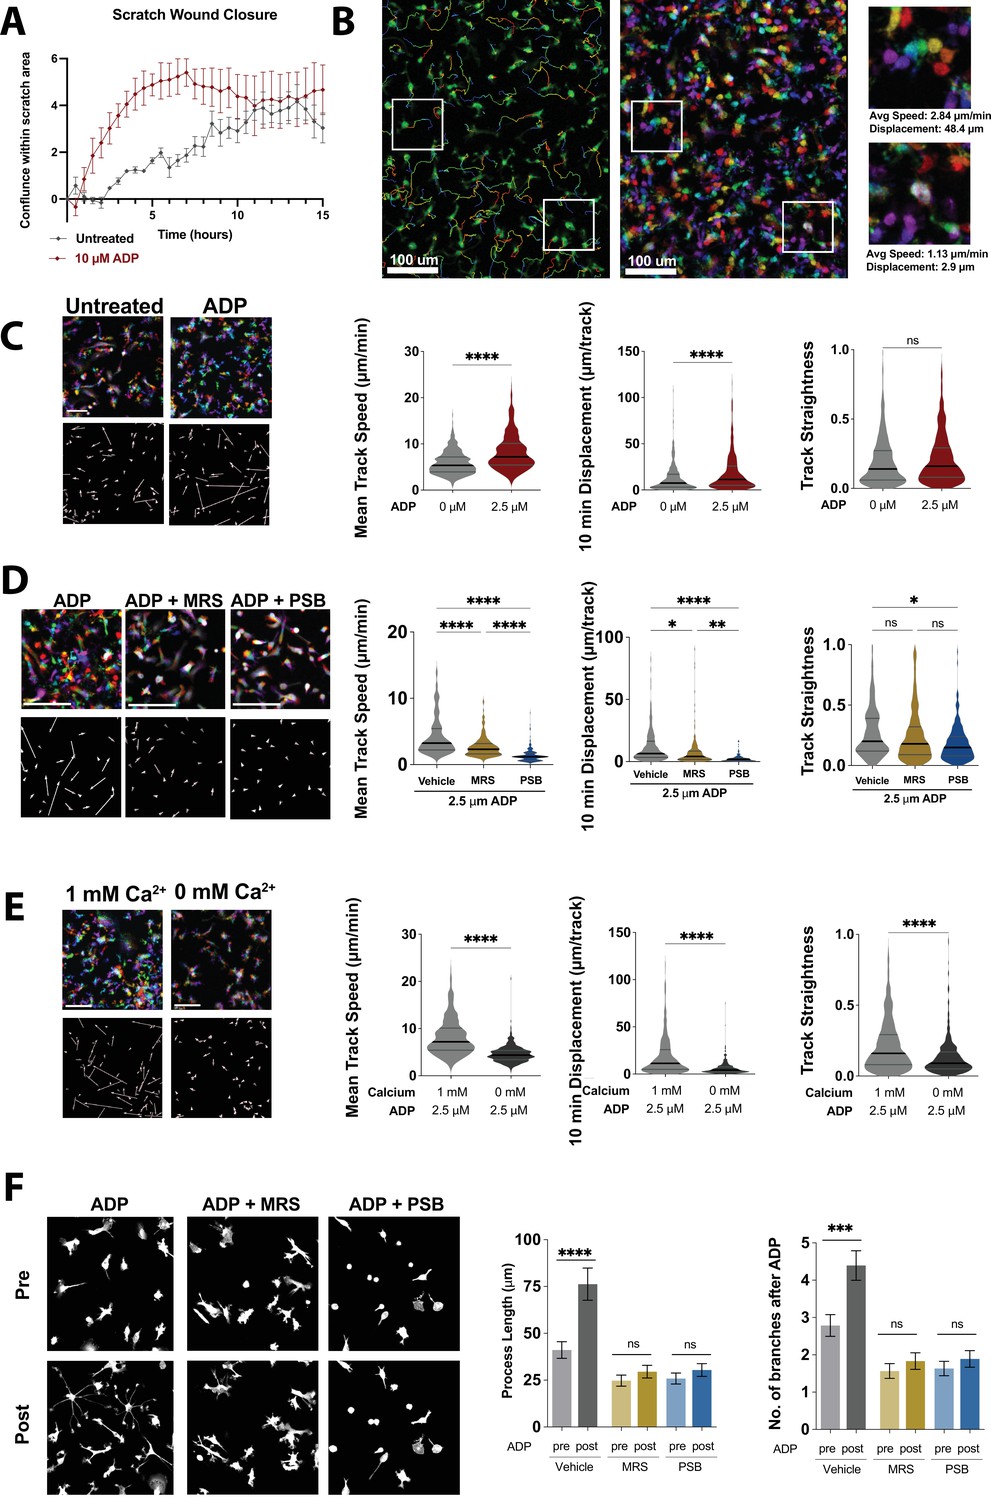
Nondirectional ADP exposure increases wild type (WT) microglial speed and process extension.
(A) Average trace showing closure of scratch wound produced with IncuCyte S3 WoundMaker. Induced pluripotent stem cell (iPSC)-microglia imaged every 30 min after scratch wound with or without ADP stimulation (n = 4 wells; two images per well). (B) Representative image of WT iPSC-microglia motility 30 min after ADP exposure with cell tracks overlain (left). Pseudocolored images (center) across time: 0 min (red), 4 min (orange), 8 min (yellow), 12 min (green), 16 min (cyan), 20 min (blue), 24 min (purple), and 28 min (magenta). Scale bar = 100 μm. White boxes zoomed in at right to demonstrate motile (top) and nonmotile (bottom) cells. (C) Representative color images (top left) and displacement vectors (bottom left) of WT iPSC-microglia at baseline (no ADP, gray) and 30 min after 2.5 μM ADP treatment (red). Summary of mean speed (µm/min), Displacement over 10 min (μm/10 min) and track straightness (track length/track displacement) (414–602 cells, two experiments). (D) Representative images, displacement vectors, and quantification of WT iPSC-microglia motility for 20 min following ADP addition. Cells were pretreated with vehicle (gray), MRS 2211 (10 μM, gold), or PBS 0739 (10 μM, blue) (180–187 cells, two experiments). (E) Representative images, displacement vectors, and quantification of WT iPSC-microglia motility after ADP in 1 mM Ca2+ (light gray) or Ca2+-free buffer (dark gray) (401–602 cells, three experiments). (F) Representative images (left) and process extension (right) of iPSC-microglia (cytoplasmic GFP, gray) before or 30 min after ADP addition. Cells were pretreated with vehicle (gray), MRS 2211 (10 μM, gold), or PBS 0739 (10 μM, blue) (52–163 cells, 3–4 experiments). (C–F) One-way ANOVA with Tukey post hoc test. Data shown as mean ± SEM (A, F) and as violin plots with mean, 25th and 75th percentile (C–E). p-Values indicated by ns, nonsignificant, *p<0.05, **p<0.01, ***p<0.001, and ****p<0.0001.
-
Figure 4—source data 1
Nondirectional ADP exposure increases wild type (WT) microglial speed and process extension.
In this dataset, the results of motility experiments and process extension in WT cells are included.
- https://cdn.elifesciences.org/articles/73021/elife-73021-fig4-data1-v2.xlsx
Figure 4—figure supplement 1
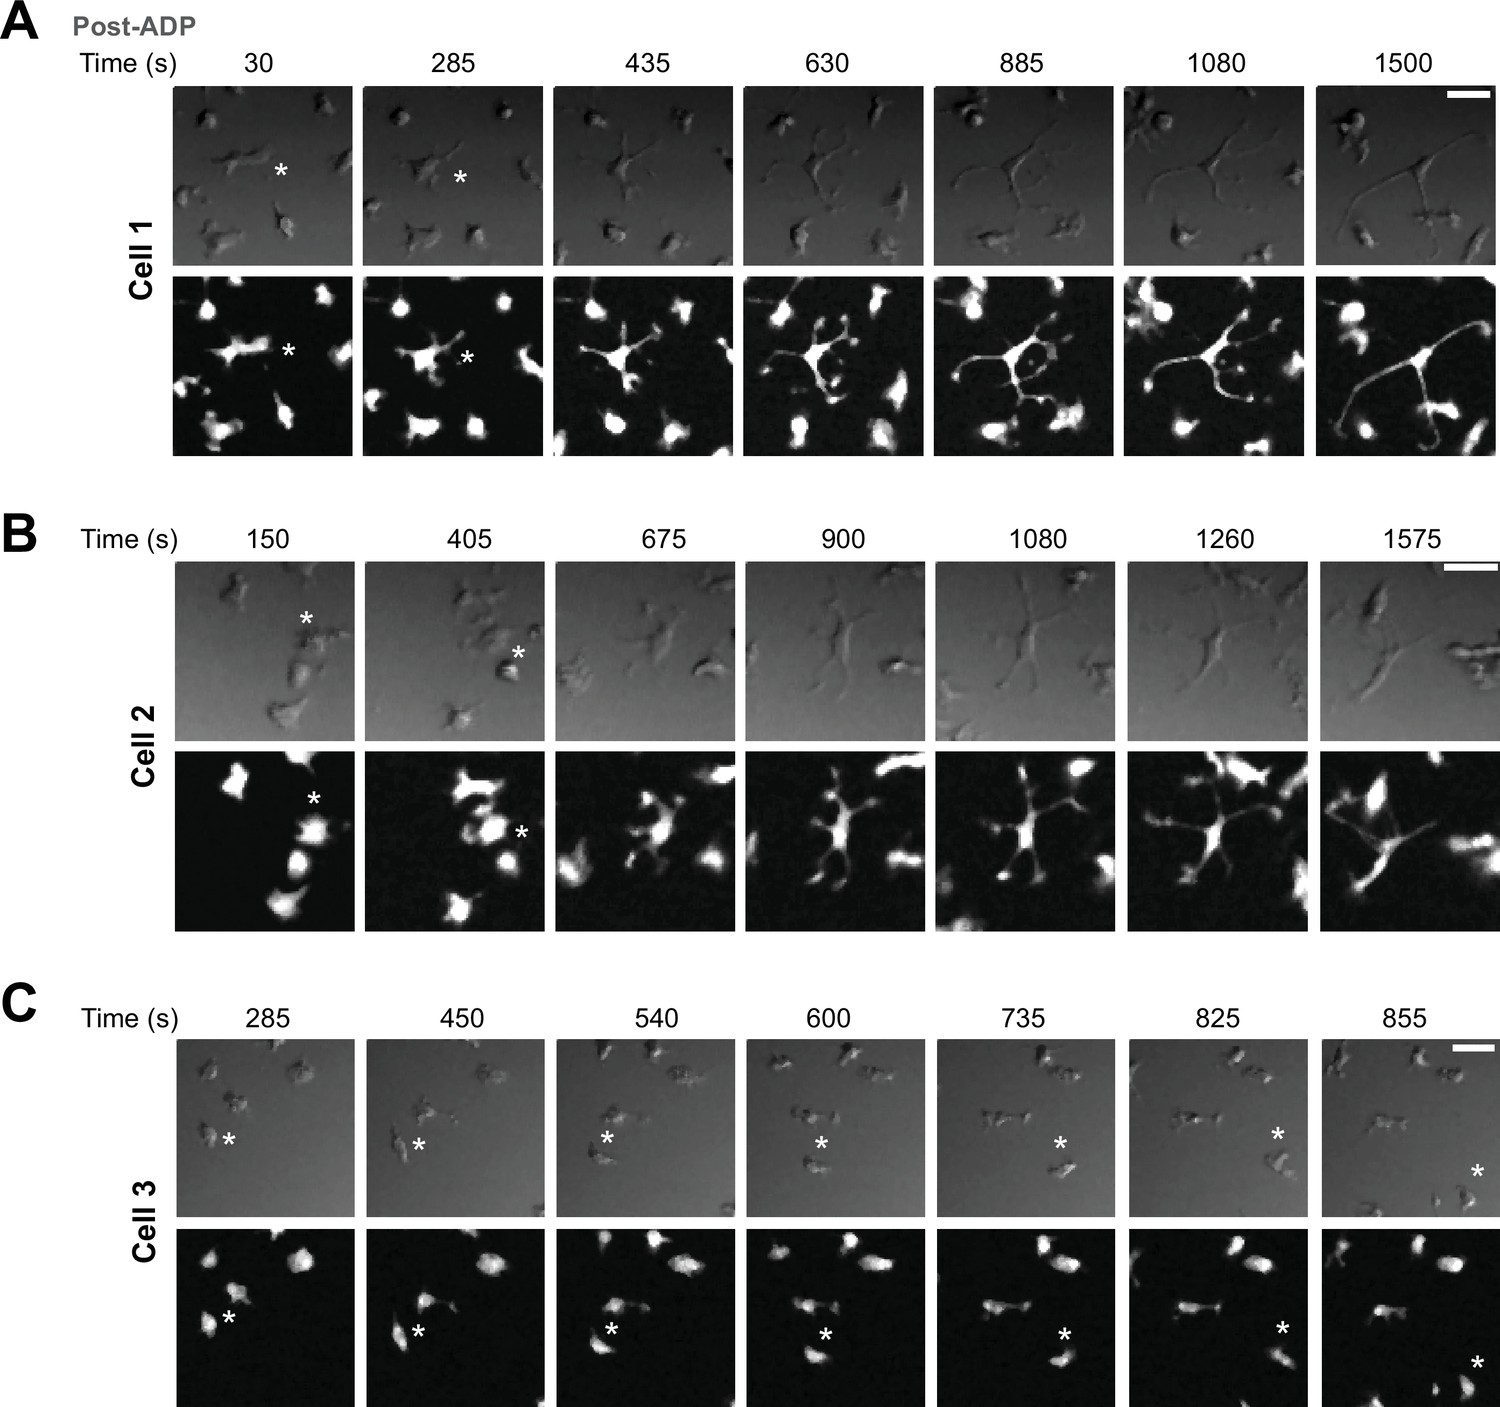
ADP-mediated process extension in wild type (WT) induced pluripotent stem cell (iPSC)-microglia.
(A) Representative images of a cell (Cell 1) from a time-lapse experiment showing increased branching and extension of processes in GFP-expressing WT iPSC-microglia, at times indicated following addition of 2.5 μM ADP. Bright-field DIC images (top row) and GFP images (bottom row) are shown. (B) Another example of a cell (Cell 2) showing process extension in the same imaging field. (C) A motile cell (Cell 3) in the same imaging field is shown for comparison. Note the lack of displacement in cells that extend their process and lack of significant process extension in a highly motile cell. Scale bar: 15 μM.
Figure 5 with 2 supplements

ADP-driven process extension and cell displacement are increased in TREM2 knockout (KO) induced pluripotent stem cell (iPSC)-microglia.
(A–E) Motility of wild type (WT) (gray) and TREM2 KO (green) iPSC-microglia over 20 min following ADP addition in 1 mM Ca2+-containing buffer. (A) Plots of track displacement in μm centered from point of origin at (0,0). (B) Mean squared displacement (MSD) vs. time. Mean cell track speeds (C), total track displacement in 10 min interval (D), and track straightness (E) for 130–327 cells, seven experiments, Student’s t-test. (F–J) Same as (A–F) but in Ca2+-free medium (125–279 cells, two experiments, Student’s t-test). (K) Representative images of GFP-expressing WT (top) and TREM2 KO (bottom) iPSC-microglia, before and 30 min after 2.5 μM ADP addition. (L) Quantification of total number of branches per cell before and after ADP treatment (left) and paired dot plots showing fold change in branch number from pre-ADP levels (right). Each data point represents an imaging field in the paired plots. (M) Total process length before and after ADP treatment displayed as raw values per cell (left) and as fold change from baseline conditions per imaging field (right). For (L) and (M). n = 151–158 cells, WT; 133–167 cells, KO; 9–10 imaging fields, 3–4 experiments. One-way ANOVA with multiple comparisons for single-cell data, two-tailed paired t-test for the paired plots. Data shown as mean ± SEM (B, G, L, M) and as violin plots with mean, 25th and 75th percentile (C– E, H–J). p-Values indicated by ns, nonsignificant, *p<0.05, **p<0.01, and ****p<0.0001.
-
Figure 5—source data 1
ADP-driven process extension and cell displacement are increased in TREM2 knockout (KO) induced pluripotent stem cell (iPSC)-microglia.
In this dataset, the results of motility experiments and process extension in wild type (WT) and TREM2 KO cells, as well as baseline motility and directional persistence, are included.
- https://cdn.elifesciences.org/articles/73021/elife-73021-fig5-data1-v2.xlsx
Figure 5—figure supplement 1
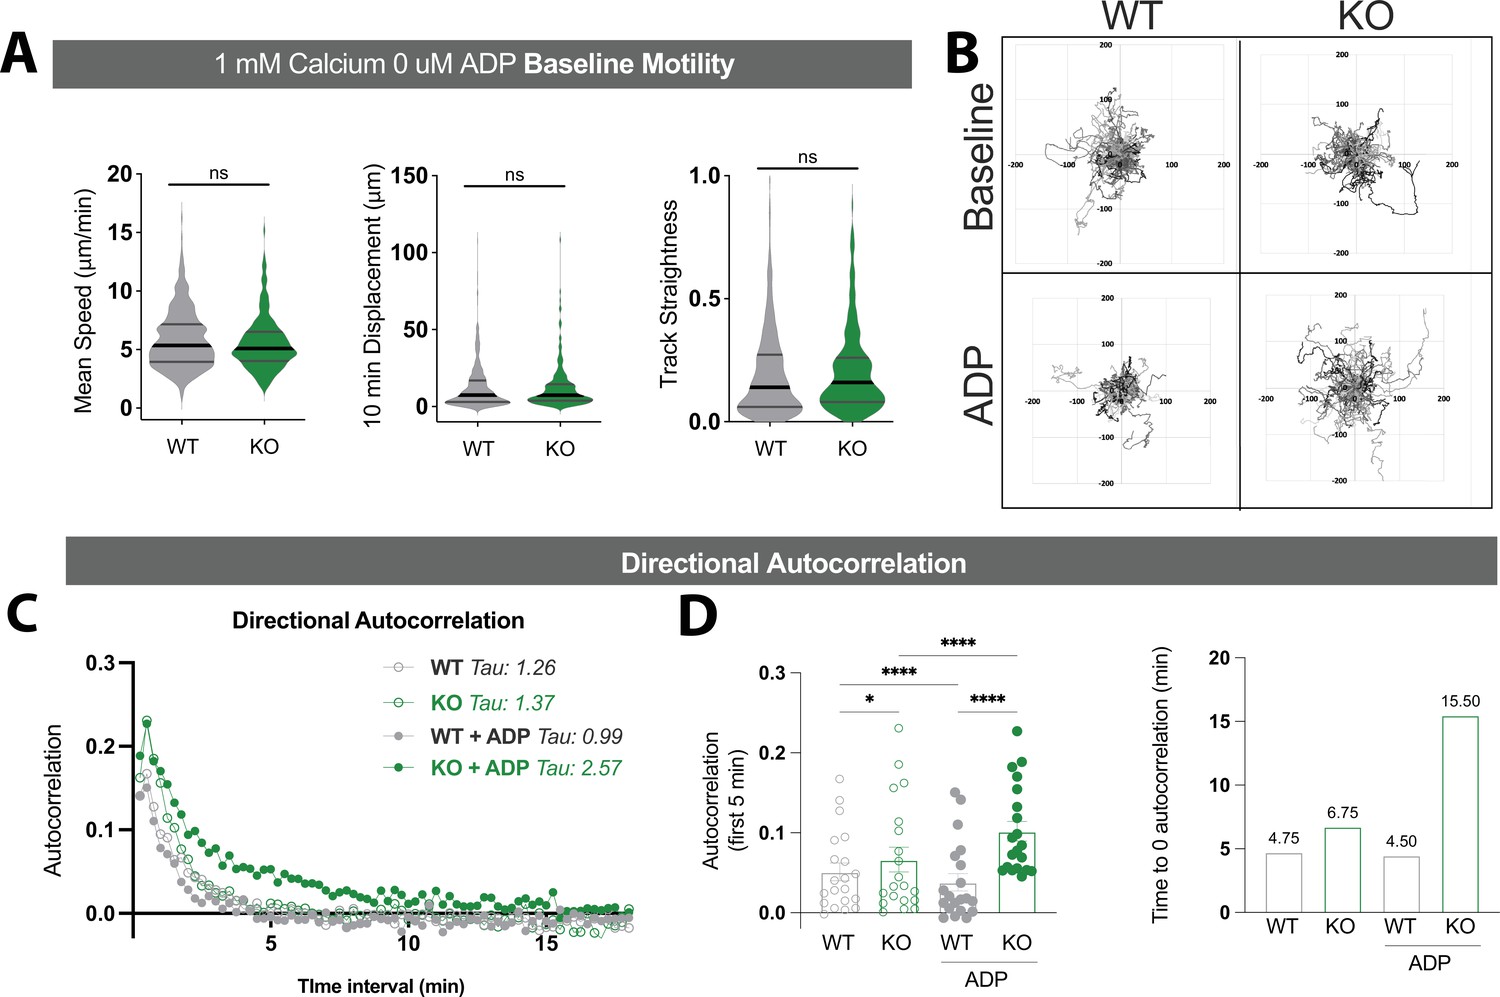
Motility analysis in wild type (WT) and TREM2 knockout (KO) induced pluripotent stem cell (iPSC)-microglia.
(A) Summary of microglial mean speeds, displacement over 10 min, and track straightness in open-field migration in the absence of any purinergic stimulation (Student’s t-test). (B) Flower plots show similar displacement from origin for WT (left) and TREM2 KO (right) cells. (C) Directional autocorrelation calculated via DiPer Excel Macro. Due to lack of directional gradient, directional autocorrelation of motility vectors is expected to drop quickly. Time constants for best-fit single-exponential curves are indicated, consistent with increased straightness for TREM2 KO cells treated with ADP. (D) Directional autocorrelation of WT (gray) and TREM2 KO (green) iPSC-microglia at baseline (open circles) or after ADP addition (filled circles). Mean autocorrelation values in the first 5 min (left panel, one-way ANOVA) and time (min) until autocorrelation reaches zero (right panel). Data shown as mean ± SEM for the bar graph in (D), and as violin plots with mean, 25th and 75th percentile in (A). p-Values indicated by ns, nonsignificant, *p<0.05, and ****p<0.0001.
Figure 5—figure supplement 2
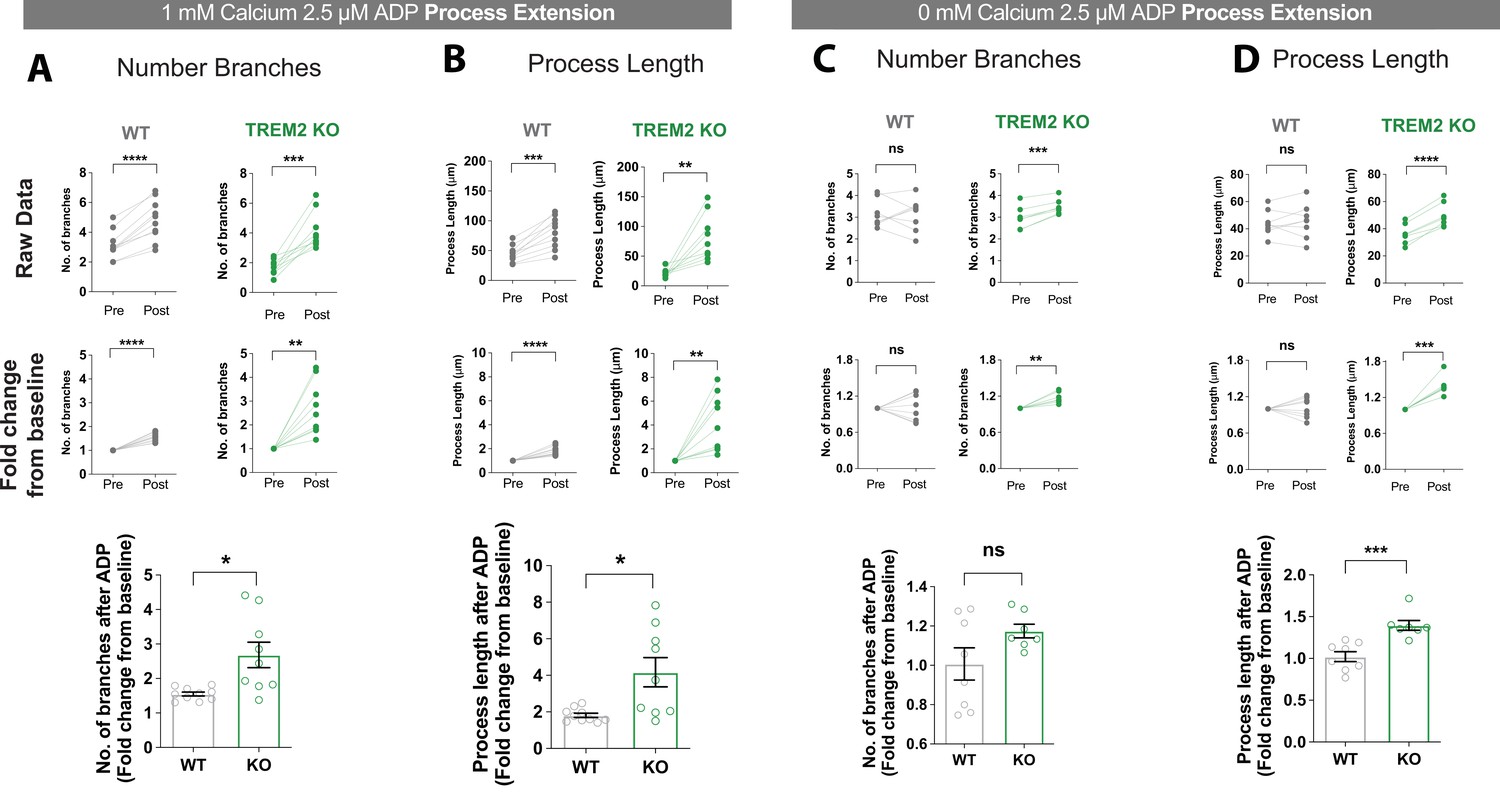
Comparison of process extension in wild type (WT) and TREM2 knockout (KO) microglia.
Branching and process extension in WT and TREM2 KO induced pluripotent stem cell (iPSC)-microglia 30 min after addition of ADP in 1 mM (A, B) or 0 mM extracellular Ca2+ buffer (C, D). (A) Data displayed as paired plots showing average branch number per cell in an imaging field (top row) and normalized to pre-ADP values for each imaging field (middle row). Bottom row shows fold change in branching after ADP treatment for WT (gray) and KO (green) iPSC-microglia. (B) Changes in process length in the same dataset as (A). n = 151–158 cells, WT; 133–167 cells, KO; 9–10 imaging fields, 3–4 experiments. (C, D) Same analysis as (A, B) but with ADP in Ca2+-free buffer. n = 137–143 cells, eight imaging fields, 2–3 experiments. (A–D) p-Values calculated by two-tailed paired Student’s t-test for the paired plots and unpaired t-test when comparing fold change in WT and KO cells. Data shown as paired plots and as mean ± SEM for the bar graphs. p-Values indicated by ns, nonsignificant, *p<0.05, **p<0.01, ***p<0.001, and ****p<0.0001.
Figure 6 with 2 supplements
Cytosolic Ca2+ levels tune microglial motility in TREM2 knockout (KO) cells.
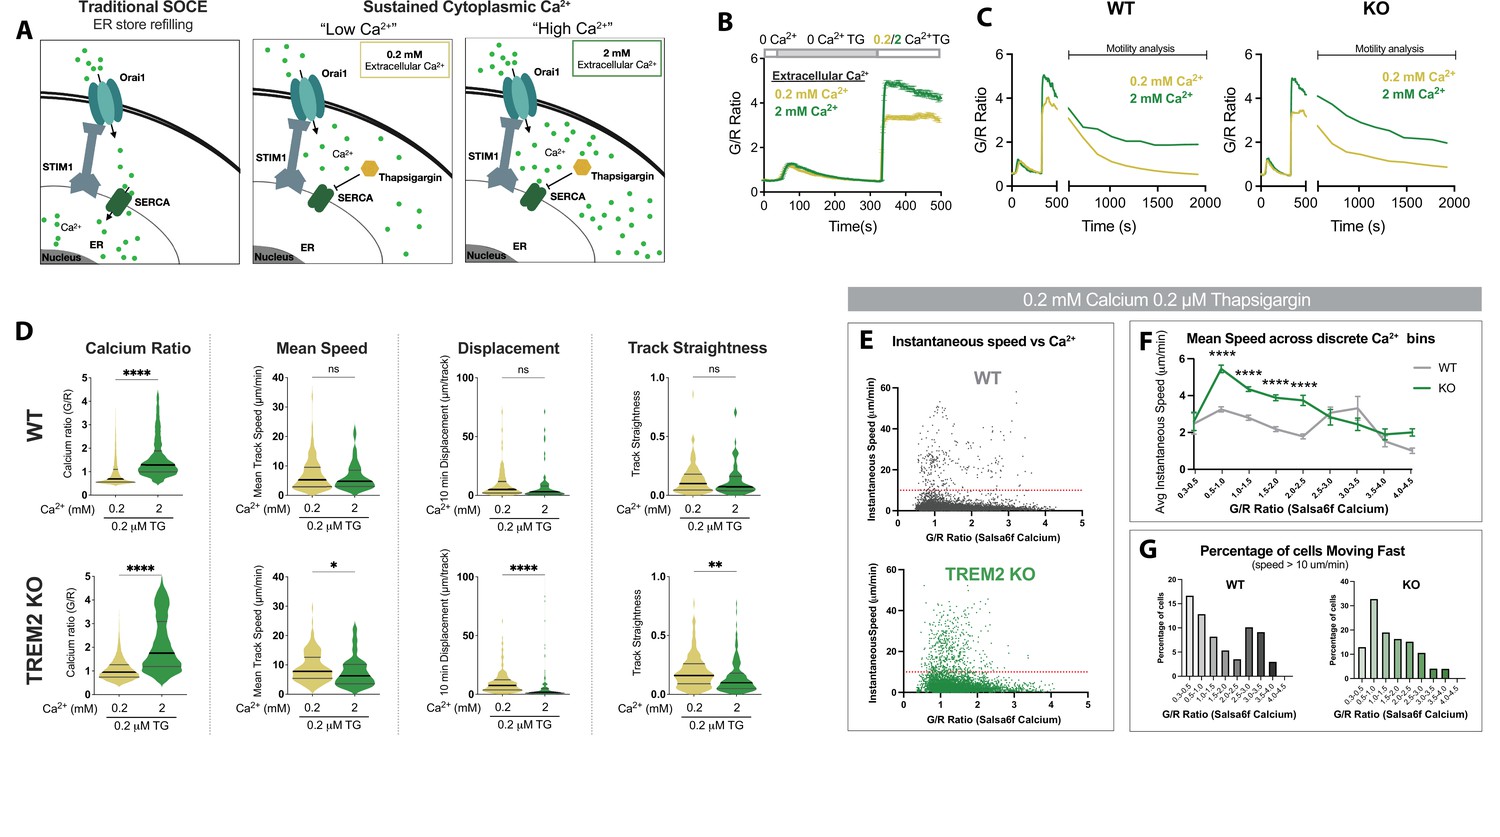
(A) Schematic of traditional store-operated Ca2+ entry (SOCE) pathway with store refilling (left) and protocol for sustaining cytoplasmic Ca2+ to ‘low’ and ‘high’ levels with 0.2 and 2 mM extracellular Ca2+ and using thapsigargin (TG) to inhibit store refilling (right). (B) Average SOCE traces in wild type (WT) Salsa6f induced pluripotent stem cell (iPSC)-microglia showing changes in cytoplasmic Ca2+ after addition of either 0.2 or 2 mM extracellular Ca2+ (n = 78–110 cells). (C) Average change in cytoplasmic Ca2+ levels in WT and TREM2 KO microglia over 25 min after SOCE activation. (D) Comparison of Ca2+ levels and microglia motility in WT (top) and TREM2 KO (bottom) microglia. Cytosolic Ca2+ levels indicated by instantaneous single-cell G/R ratio (n = 74–158 cells). Mean of instantaneous speeds, track displacement, and track straightness calculated as before in Figures 3 and 4. Yellow (0.2 mM Ca, TG), green (2 mM Ca, TG). Student’s t-test ****p<0.0001; **p=0.0062; *p=0.432; ns > 0.9999. (E) Correlation of instantaneous Ca2+ and instantaneous speed in WT and KO cells. Red line denotes 10 μm/s (cells above this threshold considered ‘fast moving’). For WT: p<0.0001; r = –0.1316; number pairs = 5850. For KO: p<0.0001; r = –0.1433; number pairs = 6,063 (Spearman’s correlation). (F) Mean speed of cells binned by instantaneous G/R Ca2+ ratio (one-way ANOVA ****p<0.0001). Each data point is calculated for a bin increment of 0.5 G/R ratio. (G) Percentage of fast-moving cells quantified as a function of G/R Ca2+ ratio. X-axis G/R ratios binned in increments of 0.5 as in (F). In (E–G), n = 78–100 cells. Data shown as mean ± SEM (B, F) and as violin plots with mean, 25th and 75th percentile (D). p-Values indicated by ns, nonsignificant, *p<0.05, **p<0.01, and ****p<0.0001.
-
Figure 6—source data 1
Cytosolic Ca2+ levels tune microglial motility in TREM2 knockout (KO) cells.
In this dataset, the results showing the effect of calcium levels on motility in TREM2 wild type (WT) and KO cells are included.
- https://cdn.elifesciences.org/articles/73021/elife-73021-fig6-data1-v2.xlsx
Figure 6—figure supplement 1
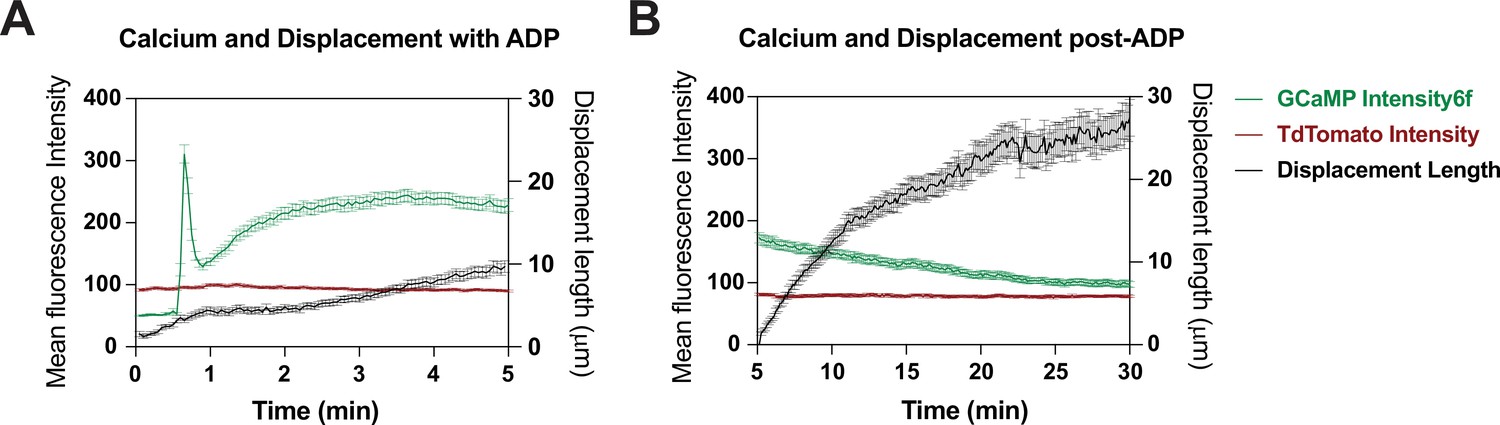
Tracking cell motility and cytosolic Ca2+ using Salsa6f-expressing induced pluripotent stem cell (iPSC) cell line.
(A) Average change in single-cell fluorescence intensity of tdTomato (red trace) and GCaMP6f (green trace) (left Y-axis) in wild type (WT) Salsa6f microglia over 5 min following ADP treatment, overlaid with corresponding change in cell displacement over time (black trace, right Y-axis) (n = 52–79 cells). (B) Same as (A) but for cells tracked over a period of 30 min. Data shown as mean ± SEM for average traces.
Figure 6—figure supplement 2
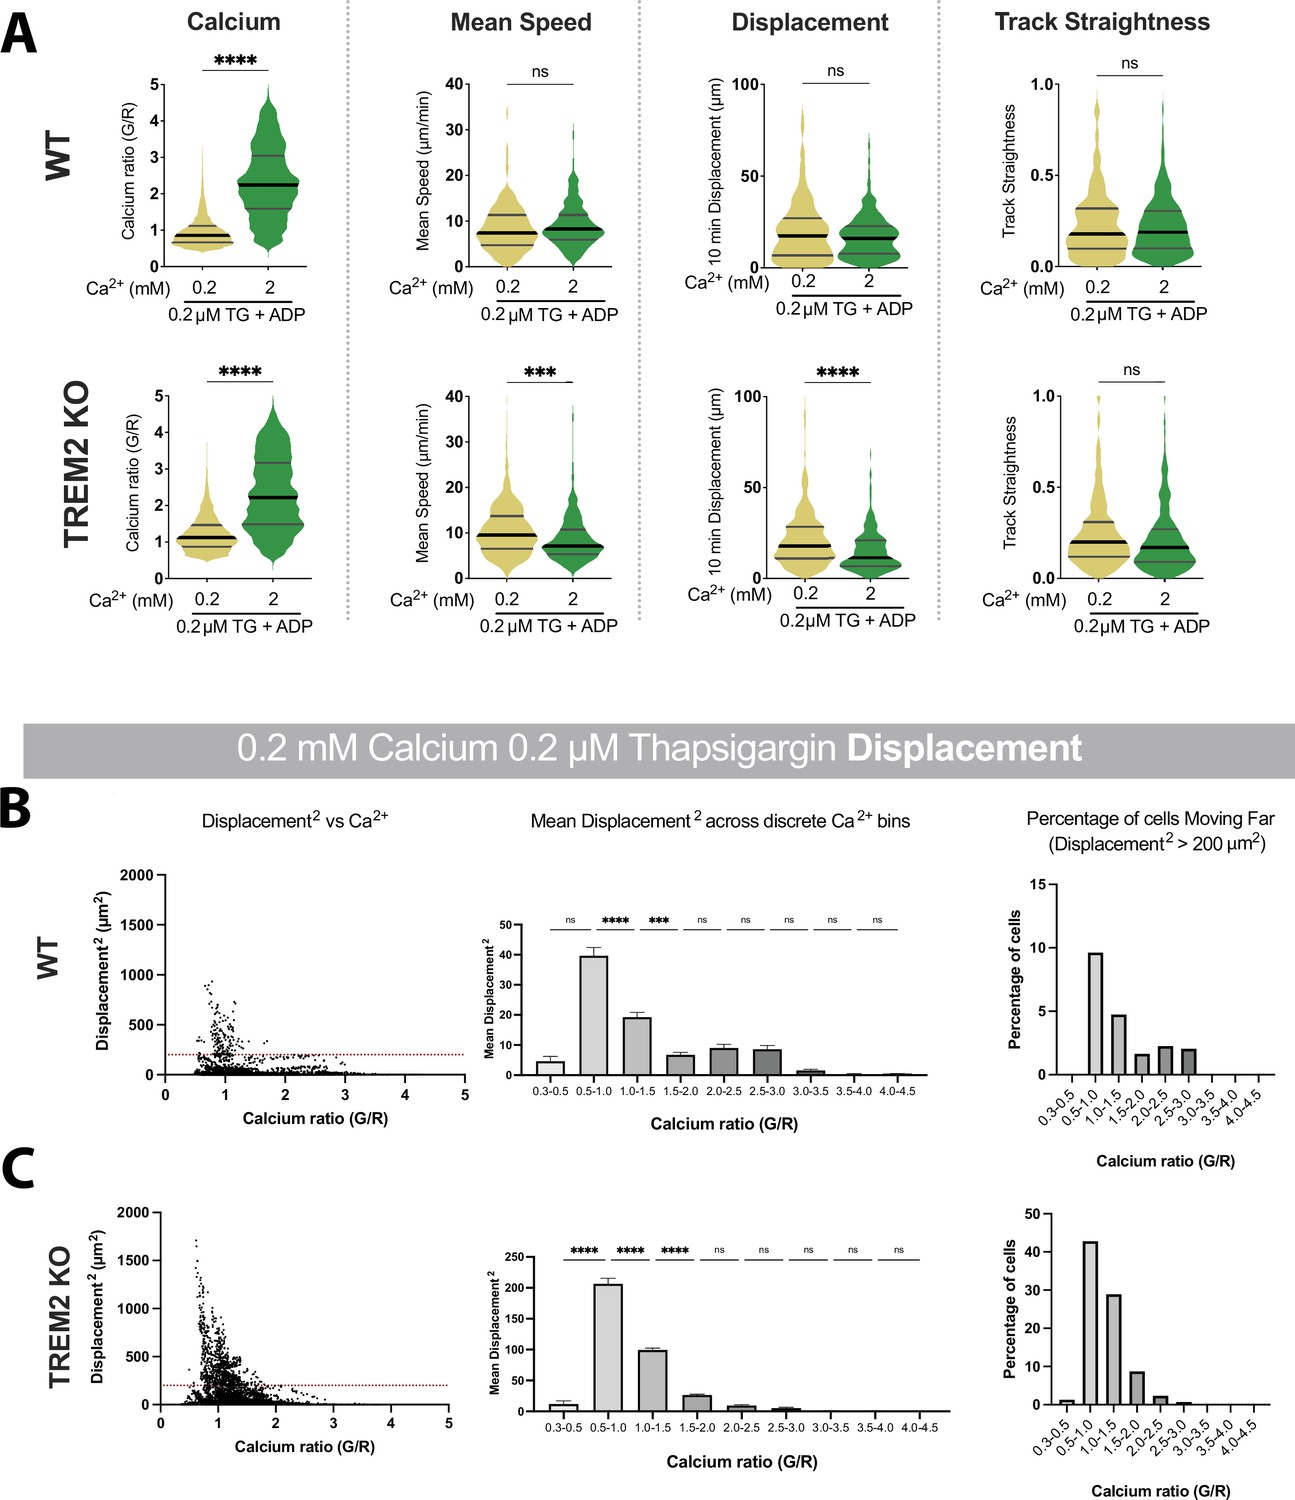
Motility analysis with varying Ca2+.
(A) Salsa6f Ca2+ ratios and microglia motility in wild type (WT) (top) and knockout (KO) (bottom) microglia, with ADP added: yellow (0.2 mM Ca2+, thapsigargin [TG] + ADP), green (2 mM Ca2+, TG + ADP). Cytosolic Ca2+ levels indicated by instantaneous single-cell G/R ratio. Mean of instantaneous speeds, 10 min track displacement and track straightness calculated as before. Student’s t-test ****p<0.0001; ***p=0.0001. n = 164–393 cells. (B, C) Ca2+ dependence of track displacement length in 0.2 mM Ca2+ in WT cells (B) and TREM2 KO cells (C). Correlation between instantaneous Ca2+ and frame-to-frame displacement (left panels). Each dot represents an individual cell for an individual frame. Dotted red line represents displacement of 200 μm2. Mean square of frame-to-frame displacement of cells binned by instantaneous G/R Ca2+ ratio (middle panels, one-way ANOVA ****p<0.0001). Each data point is calculated for a bin increment of 0.5 G/R ratio. Summary of cells with frame-to-frame square displacement >200 μm2 (right panels). WT cells (B) displace less than KO cells (C). For each cell type, larger displacements are correlated with lower G/R Ca2+ ratios. Cells that maintain elevated cytoplasmic Ca2+ do not displace as far. For WT: p<0.0001; r = –0.4778; number pairs = 5973. For KO: p<0.0001; r = –0.3699; number pairs = 5761 (Spearman’s correlation). Data shown as mean ± SEM for bar graphs (B, C) and as violin plots with mean, 25th and 75th percentile (A). p-Values indicated by ns, nonsignificant, ***p<0.001, and ****p<0.0001.
Figure 7 with 1 supplement
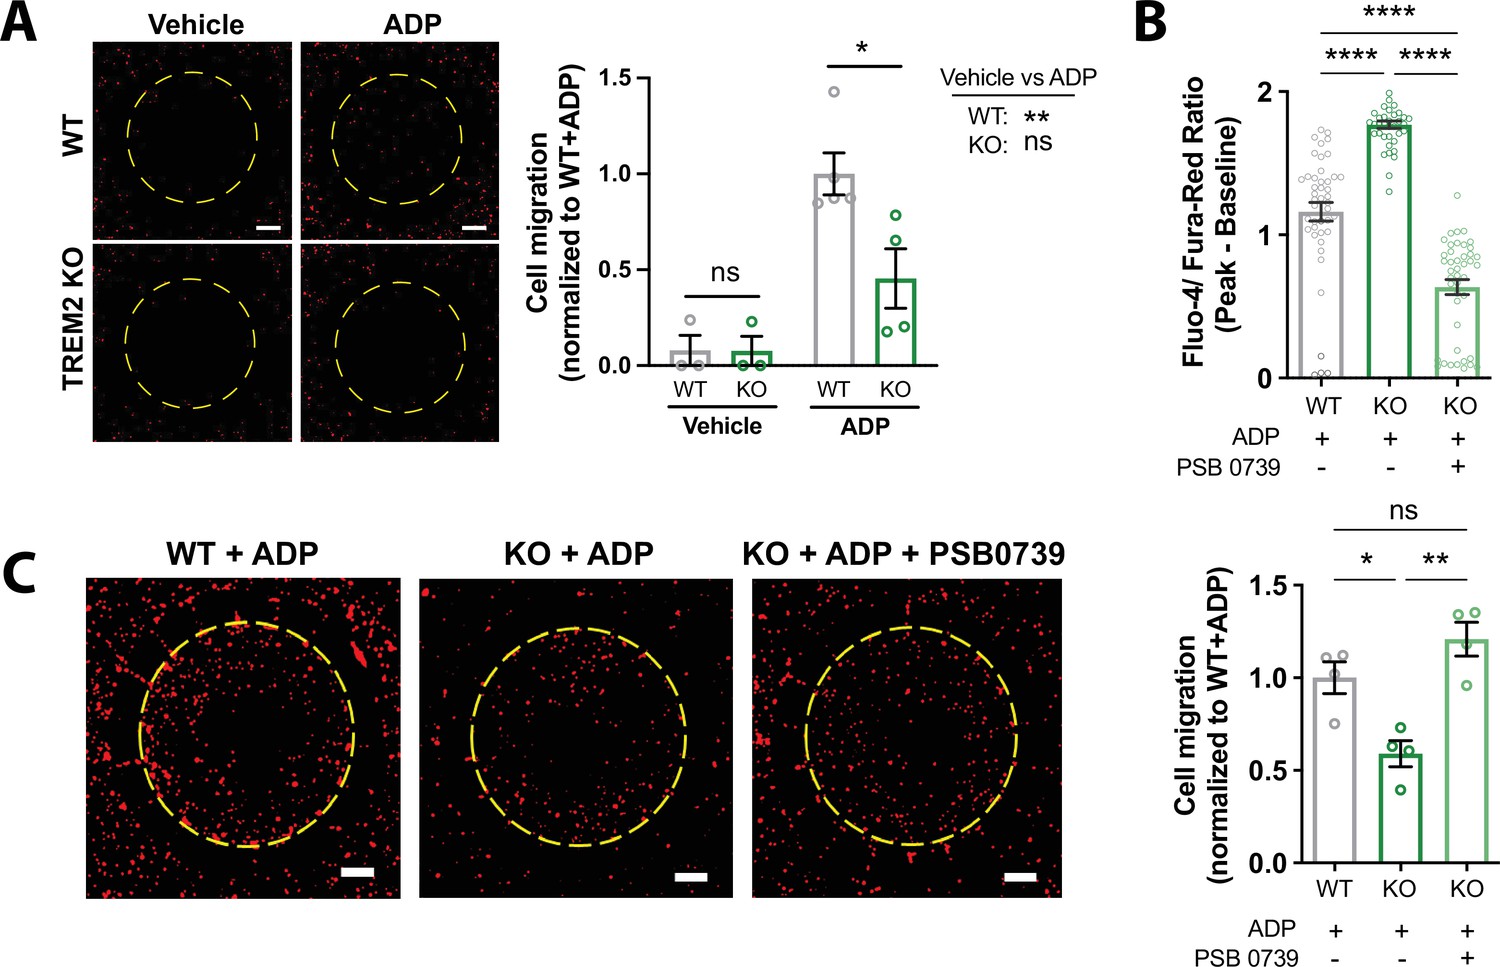
Migration deficits in TREM2 knockout (KO) microglia are rescued by inhibition of purinergic signaling.
(A) Migration toward ADP in a two-chamber microfluidic device. Representative images of RFP-expressing microglia that migrated into the central chamber 3 days after 100 ng/mL ADP addition. Dotted circle delineates separation of inner and outer chambers. Scale bar = 500 μm. Quantification of microglial migration (right panel). Migrated cell counts are normalized to wild type (WT) cells treated with ADP (n = 3–4 experiments; one-way ANOVA with multiple comparisons). (B) Baseline-subtracted peak ratiometric Ca2+ signal in response to 2.5 μM ADP in 1 mM extracellular Ca2+, and in the presence or absence of 10 μM PSB 0739 (44 cells, WT; 39–43 cells, KO; representative of three independent experiments; one-way ANOVA with multiple comparisons). (C) Two-chamber migration to 100 ng/mL ADP with or without 10 μM PSB 0739. Values are normalized to WT cells with ADP (n = 3–4 experiments; one-way ANOVA with multiple comparisons). Representative images shown on the left. Scale bar = 500 μm. Data shown as mean ± SEM. p-Values indicated by ns, nonsignificant, *p<0.05, **p<0.01, and ****p<0.0001.
-
Figure 7—source data 1
Migration deficits in TREM2 knockout (KO) microglia are rescued by inhibition of purinergic signaling.
In this dataset, the results of directional migration and inhibition of purinergic receptor activity are included.
- https://cdn.elifesciences.org/articles/73021/elife-73021-fig7-data1-v2.xlsx
Figure 7—figure supplement 1
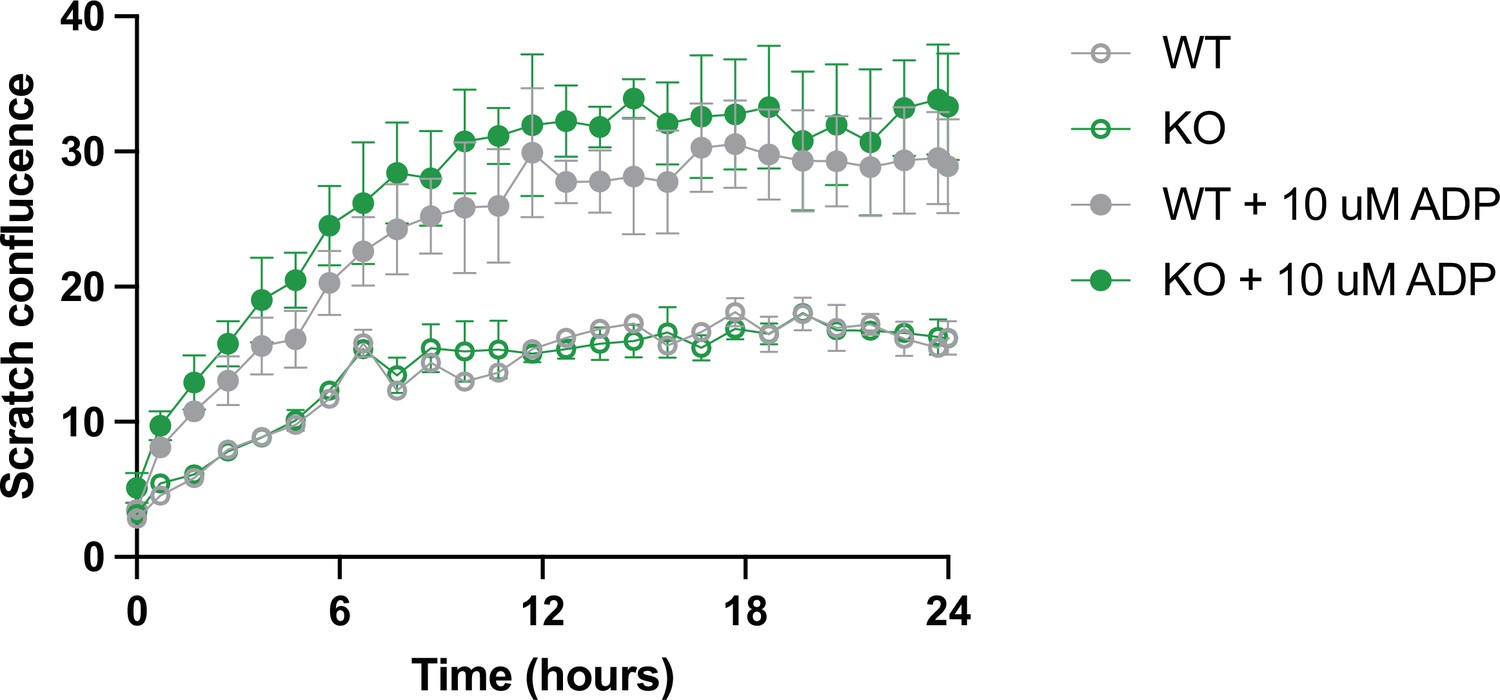
TREM2 wild type (WT) and knockout (KO) close scratch wound at similar rates.
Scratch closure over 24 hr in WT (gray) and TREM2 KO (green) induced pluripotent stem cell (iPSC)-microglia with (filled symbols) or without (empty symbols) pre-stimulation of iPSC-microglia with ADP (10 μM, 30 min). N = 2 wells, two images per well. Data shown as mean ± SEM.
Tables
Key resources table
| Reagent type (species) or resource | Designation | Source or reference | Identifiers | Additional information |
|---|---|---|---|---|
| Cell line (human) | WT iPSC-microglia | UCI ADRC iPSC Core | ADRC5;orgin: Blurton-Jones lab | iPSC-derived microglial line |
| Cell line (human) | TREM2 KO iPSC microglia | Blurton-Jones lab | ADRC5 Clone 28-18;orgin: Blurton-Jones lab | CRISPR-mediated knockout of TREM2 on the WT iPSC line |
| Cell line (human) | WT GFP-expressing iPSC-microglia | Coriell | AICS-0036;RRID:CVCL_JM19 | iPSC-line with GFP tagged to αtubulinOriginally developed by Dr. Bruce Conklin |
| Cell line (human) | TREM2 KO GFP-expressing iPSC-microglia | Blurton-Jones lab | GFP Clone 1from above RRID | CRISPR-mediated knockout of TREM2 on the WT GFP+ iPSC line |
| Cell line (human) | WT RFP-expressing iPSC-microglia | Coriell | AICS-0031-035;RRID:CVCL_LK44 | iPSC-line with RFP tagged to αtubulinOriginally developed by Dr. Bruce Conklin |
| Cell line (human) | TREM2 KO RFP-expressing iPSC-microglia | Blurton-Jones lab | RFP Clone 6from above RRID | CRISPR-mediated knockout of TREM2 on the WT RFP+ iPSC line |
| Cell line (human) | WT Salsa6f-expressing iPSC-microglia | UCI ADRC iPSC Core | ADRC76 Clone 8;orgin: Blurton-Jones lab | iPSC-line expressing a GCaMP6f-tdTomato fusion construct (Salsa6f) |
| Cell line (human) | TREM2 KO Salsa6f-expressing iPSC microglia | Blurton-Jones lab | ADRC76 Clone 8, Clone 98;orgin: Blurton-Jones lab | CRISPR-mediated knockout of TREM2 on the WT Salsa6f+ iPSC line |
| Cell line (human) | Orai1 KO iPSC microglia | Blurton-Jones lab | ADRC76;orgin: Blurton-Jones lab | CRISPR-mediated knockout of Orai1 on the WT ADRC76 iPSC line |
| Transfected construct (transgene) | Salsa6f | Addgene | Plasmid# 140188;RRID:Addgene_140188 | A genetically encoded calcium indicator with tdTomato linked to GCaMP6f by a V5 epitope tag. |
| Other | DMEM/F12, HEPES, no Phenol red | Thermo Fisher Scientific | 11038021 | Microglia differentiation cell culture medium |
| Other | TeSR-E8 | STEMCELL Technologies | 05990 | Stem cell culture medium |
| Other | StemDiff Hematopoietic kit | STEMCELL Technologies | 05310 | |
| Peptide, recombinant protein | Nonessential amino acids | Gibco | 11140035 | |
| Peptide, recombinant protein | GlutaMAX | Gibco | 35050061 | |
| Peptide, recombinant protein (human) | Insulin | Sigma | I2643 | |
| Peptide, recombinant protein | B27 | Gibco | 17504044 | |
| Peptide, recombinant protein | N2 | Gibco | A1370701 | |
| Peptide, recombinant protein | Insulin-transferrin-selenite | Gibco | 41400045 | |
| Peptide, recombinant protein | IL-34 | PeproTech | 200-34 | |
| Peptide, recombinant protein | TGFβ1 | PeproTech | 100-21 | |
| Peptide, recombinant protein | M-CSF | PeproTech | 300-25 | |
| Peptide, recombinant protein | CX3CL1 | PeproTech | 300-31 | |
| Peptide, recombinant protein | CD200 | Novoprotein | C311 | |
| Peptide, recombinant protein | Fibronectin | STEMCELL Technologies | 07159 | |
| Other | Matrigel | Corning | 356231 | |
| Other | ReLeSR | STEMCELL Technologies | 5872 | Human pluripotent stem cell selection and passing reagent |
| Other | Goat serum | Thermo Fisher Scientific | 10,000C | |
| Other | Fluorescent beta-amyloid 1–42 (647) | AnaSpec | AS64161 | |
| Other | pHrodo tagged zymosan A beads | Thermo Fisher Scientific | P35364 | |
| Other | pHrodo tagged S. aureus | Thermo Fisher Scientific | A10010 | |
| Other | Human Stem Cell Nucleofector kit 2 | Lonza | VPH-5022 | |
| Other | Alt-R CRISPR-Cas9 tracrRNA | IDTDNA | 107253 | |
| Other | Alt-R HiFi Cas9 Nuclease | IDTDNA | 1081061 | |
| Antibody | Anti-human IBA1(rabbit monoclonal) | Wako | 019-19741;RRID:AB_839504 | (1:200) |
| Antibody | Goat anti-rabbit 555(secondary antibody) | Thermo Fisher Scientific | A21429;RRID:AB_2535850 | (1:400) |
| Other | Human TruStain FcX | BioLegend | Cat# 422301 | Fc blocking solution5 μL per test |
| Antibody | Brilliant Violet 421 anti-human P2RY12Primary antibody(mouse monoclonal) | BioLegend | 392105;clone 16001E;RRID:AB_2783290 | (5 μL) per test |
| Antibody | Brilliant Violet 421 mouse IgG2aκ Isotype control mouse | BioLegend | 407117;clone MOPC-173;RRID:AB_2687343 | (5 μL) per test |
| Chemical compound, drug | Fluo-4 AM | Thermo Fisher Scientific | F14201 | |
| Chemical compound, drug | Fura-red AM | Thermo Fisher Scientific | F3021 | |
| Chemical compound, drug | Pluronic F-127 | Thermo Fisher Scientific | P3000MP | |
| Chemical compound, drug | Cal-520 AM | AAT Bioquest | 21130 | |
| Chemical compound, drug | Cal-590 AM | AAT Bioquest | 20510 | |
| Chemical compound, drug | ci-IP3/PM | SiChem | 6210 | Caged-inositol triphosphate analog |
| Chemical compound, drug | Hoeschst | Thermo Fisher Scientific | R37165 | |
| Chemical compound, drug | ADP | Sigma-Aldrich | A2754 | |
| Chemical compound, drug | ATP | Sigma-Aldrich | A9187 | |
| Chemical compound, drug | UTP | Sigma-Aldrich | U1006 | |
| Chemical compound, drug | PSB 0739 | Tocris | 3983 | |
| Chemical compound, drug | MRS 2211 | Tocris | 2402 | |
| Chemical compound, drug | Synta66 | Sigma-Aldrich | SML1949 | Orai channel inhibitor |
| Chemical compound, drug | 2-APB | Sigma-Aldrich | D9754 | |
| Chemical compound, drug | Gadolinium | Sigma-Aldrich | G7532 | |
| Chemical compound, drug | EGTA | Sigma-Aldrich | E8145 | |
| Chemical compound, drug | 1-Thioglycerol | Sigma-Aldrich | M6145 | |
| Chemical compound, drug | CloneR | STEMCELL Technologies | 05888 | Defined supplement for single-cell cloning of human iPS cells |
| Chemical compound, drug | Thiazovivin | STEMCELL Technologies | 72252 | ROCK inhibitor |
| Other | 35 mm glass-bottom dish | MatTek | P35G-1.5-14C | 1.5 coverslip, 14 mm glass diameter |
| Other | Incubation perfusion Lid for 35 mm dishes | Tokai Hit | LV200-D35FME | Perfusion lid with inlet and outlet |
| Other | Laser Scanning Confocal Microscope | Olympus | FV3000 | Equipped with Resonant Scanner, IX3-ZDC2 Z-drift compensator, 40× silicone oil objective, 20× air objective |
| Other | Stage Top Incubation System | Tokai Hit | STXG | Temperature and humidity control for FV3000 microscope stage |
| Other | Nikon Eclipse Ti microscope system | Nikon | Equipped with a 40× oil immersion objective (NA 1.3; Nikon) and an Orca Flash 4.0LT CMOS camera (Hamamatsu) | |
| Other | Chemotaxis Assay Chamber | Hansang Cho Lab | ||
| Other | IncuCyte S3 Live-Cell Analysis System | Sartorius | ||
| Other | Essen Incucyte WoundMaker | Sartorius | 4493 | |
| Software, algorithm | GraphPad Prism 9.1.0 | Data analysis, statistical analysis | ||
| Software, algorithm | Fiji (ImageJ) | Image analysis | ||
| Software, algorithm | Incucyte 2020C | Image acquisition and analysis | ||
| Software, algorithm | Imaris 9.7.0 | Cell tracking and image analysis | ||
| Software, algorithm | Flika | Image analysis | ||
| Software, algorithm | DiPer Excel Macros | PMID:25033209 | Data analysis, directional persistence |
Additional files
Download links
A two-part list of links to download the article, or parts of the article, in various formats.
Downloads (link to download the article as PDF)
Open citations (links to open the citations from this article in various online reference manager services)
Cite this article (links to download the citations from this article in formats compatible with various reference manager tools)
TREM2 regulates purinergic receptor-mediated calcium signaling and motility in human iPSC-derived microglia
eLife 11:e73021.
https://doi.org/10.7554/eLife.73021


