Computational modeling and quantitative physiology reveal central parameters for brassinosteroid-regulated early cell physiological processes linked to elongation growth of the Arabidopsis root
- Centre for Organismal Studies, Heidelberg University, Germany
- BioQuant, Heidelberg University, Germany
- Center for Molecular Biology of Plants, University of Tubingen, Germany
- Department of Ecological and biological Science, Tuscia University, Italy
- Tasmanian Institute for Agriculture, University of Tasmania, Australia
- International Research Centre for Environmental Membrane Biology, Foshan University, China
Figures
Figure 1
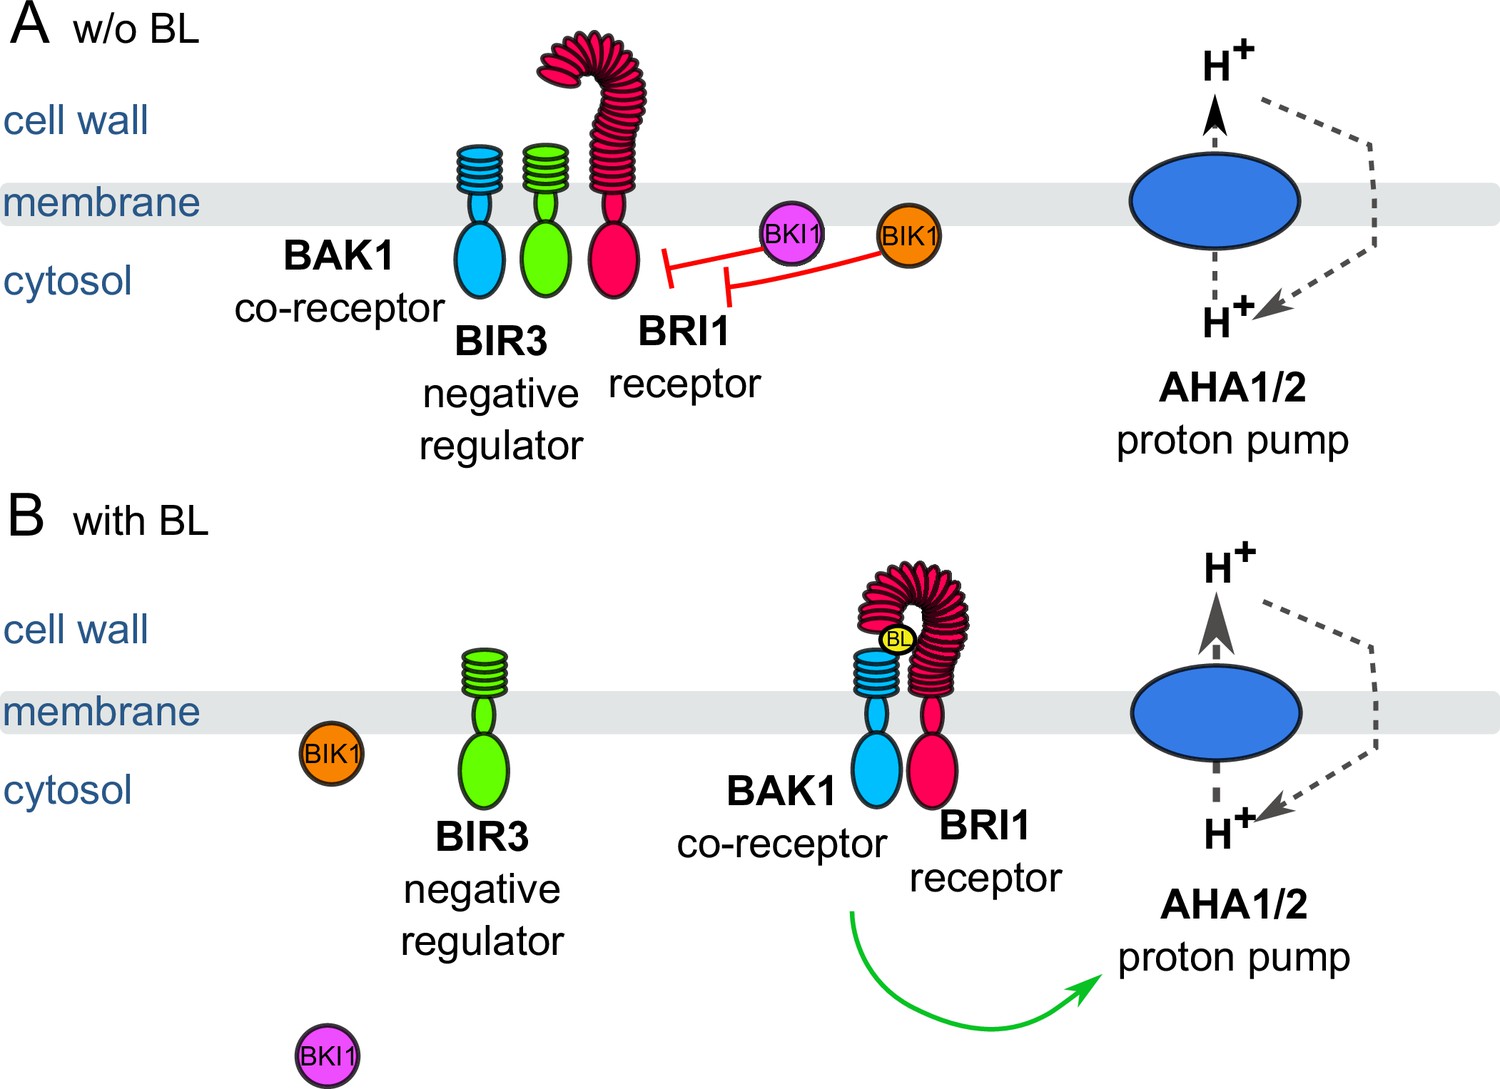
Schematic overview of the key constituents and processes of the plasma membrane-associated fast BR response pathway initiating early steps in cell elongation, here represented by brassinolide (BL).
(A) Inactive state: Co-localizing in a preformed nano-orgnaized complex, the inhibitors BKI1, BIK1 and BIR3 suppresses the activity of BRI1 in the absence of BL keeping the activity of H+-ATPases AHA1 and 2 at basic levels. By interaction with BAK1, BIR3 blocks the access of the co-receptor to BRI1. (B) Active state: Upon BL-binding to the receptor, the inhibitory mechanisms of BKI1, BIK1 and BIR3 on BRI1 and BAK1 are released causing the formation of the active BRI1/BAK1 complex. The complex enhances the AHA activity resulting in cell wall acidification, plasma membrane hyperpolarization and eventually onset of cell elongation. These key constituents and qualitatively described processes were used for the initial establishment of the computational model at cellular.
Figure 2
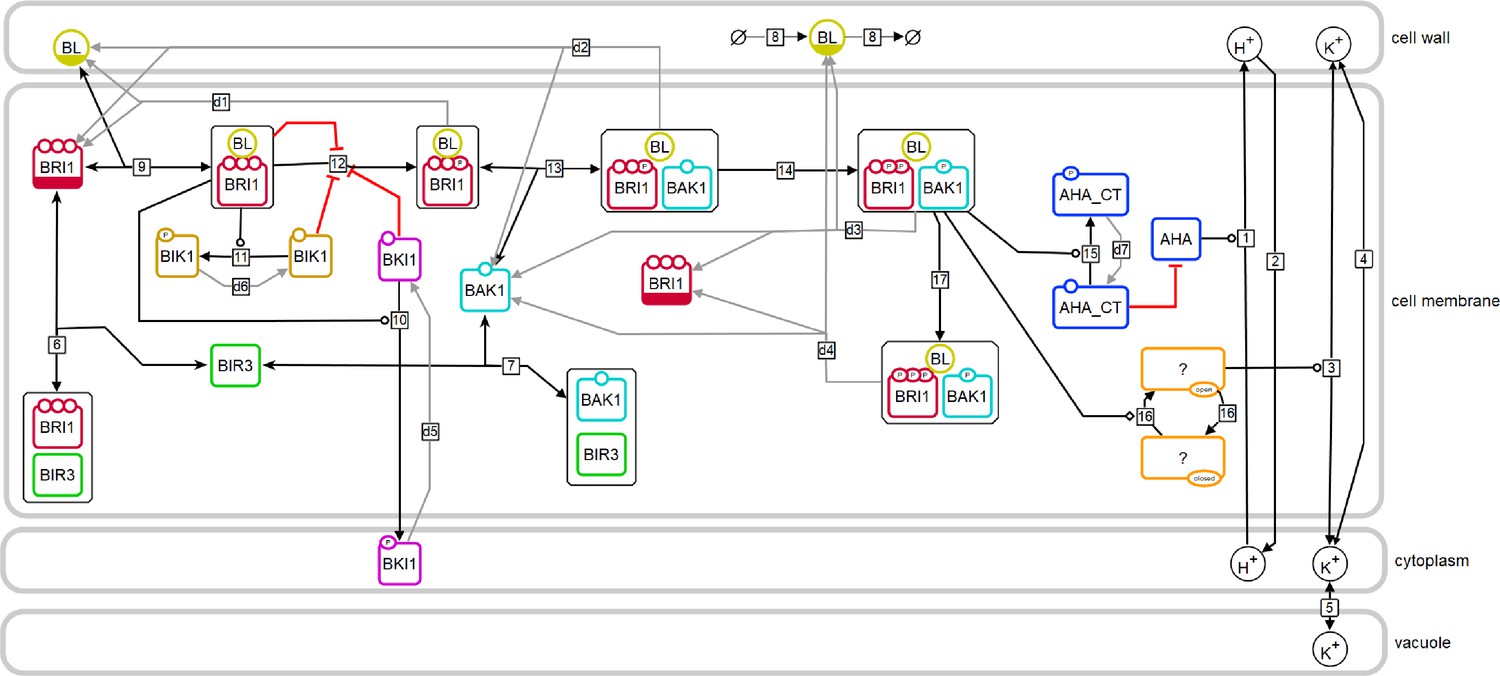
Model structure of the fast BR response pathway of Arabidopsis thaliana.
Compartments are indicated by grey boxes. Smaller molecules are indicated by circles, proteins by rectangles. Potential sites for protein modifications are indicated by the small circles on the boundaries of the rectangles. Reactions, including substrates and products, are indicated by the arrows, with the reaction numbers noted in the small box. Reactions, which are required for the model to return to the initial state, are drawn in grey. A bar at the bottom of the circle or rectangle indicates that this entity appears more than once in the scheme.
Figure 3
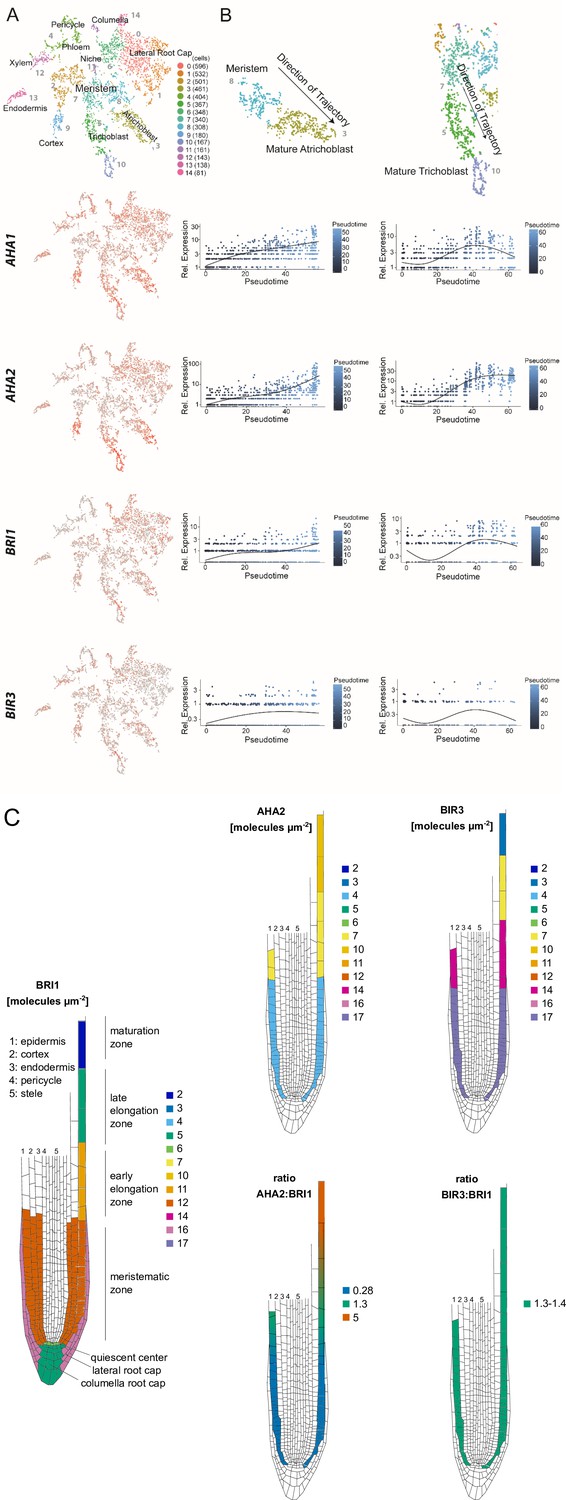
The constituents of the nano-scale organized BRI1 complex are spatio-temporally differentially expressed in the epidermal cells along the Arabidopsis root tip axis.
(A) AHA1, AHA2, BIR3 and BRI1 transcript levels in the different cell types of the Arabidopsis root tip derived from scRNA-Seq data (Ma et al., 2020). The atrichoblasts and trichoblasts together represent the epidermal cells. (B) Developmental trajectories of AHA1, AHA2, BIR3, and BRI1 transcript accumulation along the root tip (Ma et al., 2020). The transition from the MZ to the EZ is at a pseudotime value of around 30. (C) Upper panel. Number of the indicated GFP fusion proteins (molecules per µm2) in the plasma membrane of epidermal cells along the root tip axis. The values for BRI1-GFP and BAK1-GFP were taken from the literature (Wilma van Esse et al., 2011). Lower panel. The same but here the ratios of BRI1-GFP/AHA2-GFP and BRI1-GFP/BIR3-GFP molecules in the plasma membrane are given.
Figure 4
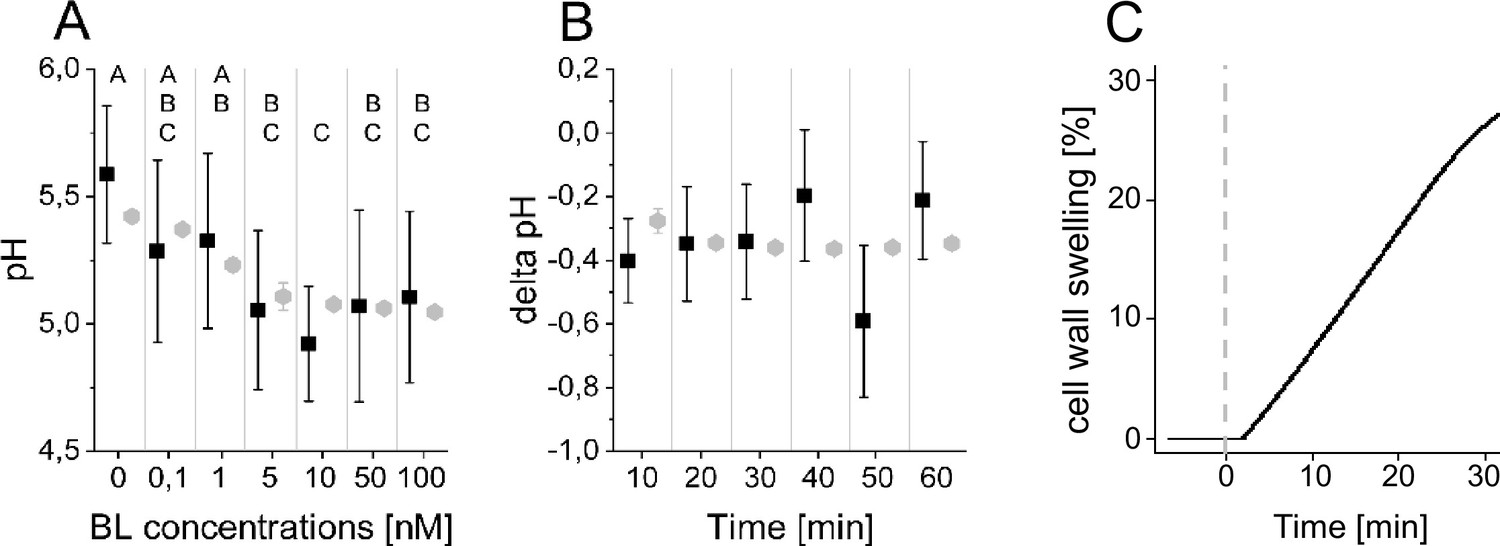
The computational model quantitatively and dynamically captures the sensitivity and kinetics of apoplastic acidification in Arabidopsis epidermal cells of the root EZ in response to BL.
(A) HPTS-staining visualized (black quadrats) and computationally simulated (grey diamonds) dose-response behavior of apoplastic pH. Real or virtual BL incubation was done for 60 min. Error bars represent SD for the experimental data (n≥11) and the simulations of different model parameterizations (n = 10). Statistical evaluations to compare the effect of BL concentrations on experimental data, were performed by an One-way ANOVA followed by a Tukey-HSD post hoc test. Levels not connected by same letter are significantly different. The exact p-values can be found in the corresponding RAW data file. (B) HPTS-staining visualized (black quadrats) and computationally simulated (grey diamonds) time-course of apoplastic pH change in response to 10 nM BL. Error bars represent a corrected SD for the experimental data (n≥16) (for calculations see the corresponding RAW data file) and SD for the simulations of different model parameterizations (n = 10). Statistical evaluations on experimental data were performed as described in A. (C) Computationally simulated time course of relative wall swelling in response to 10 nM BL. The addition of BL at time 0 is indicated by the vertical dashed line.
-
Figure 4—source data 1
Raw data underlying the representation of the experimental results of Figure 4.
- https://cdn.elifesciences.org/articles/73031/elife-73031-fig4-data1-v3.xlsx
Figure 5

Computational calculation of scaled sensitivities of the cell wall acidification predicts AHA2 activity and molecules in the PM as well as BRI1 expression and molecules in the PM to be the deciding factors for the competence of Arabidopsis epidermal root cells to elongate in response to 5 min BL application for all parameterizations of the model.
A positive influence is shown in green, a neutral in white and a negative in red, with the color saturation indicating the strength of the influence.
-
Figure 5—source data 1
Raw data underlying the representation of the results.
- https://cdn.elifesciences.org/articles/73031/elife-73031-fig5-data1-v3.xlsx
Figure 6
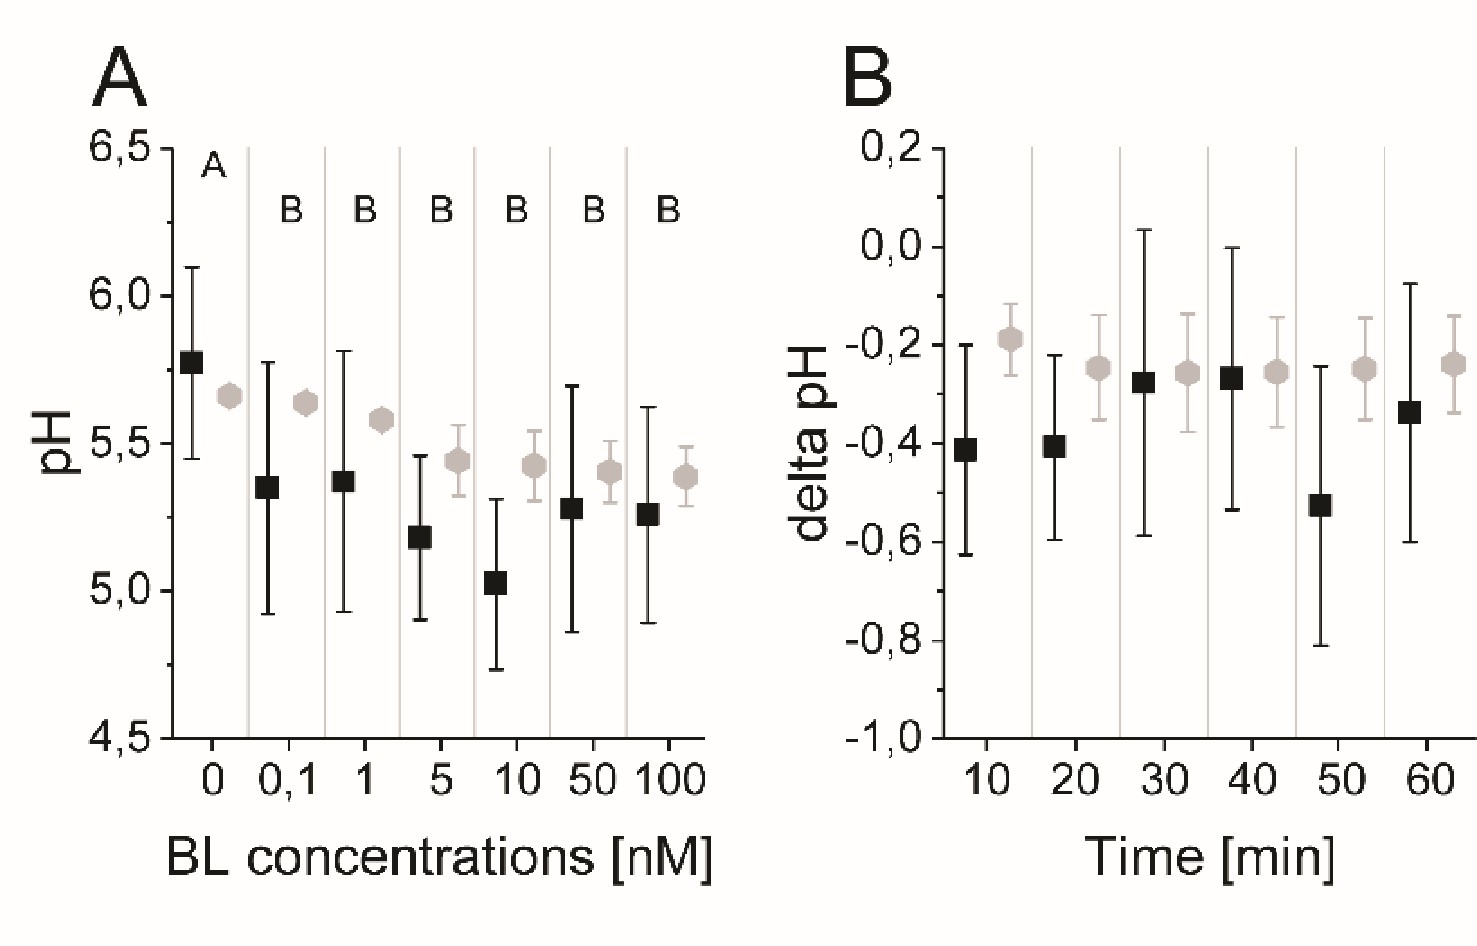
The model quantitatively and dynamically captures the sensitivity and kinetics of apoplastic acidification in Arabidopsis epidermal cells of the root MZ in response to BL.
(A) HPTS-staining visualized (black quadrats) and computationally simulated (grey diamonds) dose-response behavior of apoplastic pH. Real or virtual BL incubation was done for 60 min. Error bars represent SD for the experimental data (n≥11) and the simulations of different model parameterizations (n = 10). Statistical evaluations on experimental data were performed as described in Figure 4. Levels not connected by same letter are significantly different. The exact p-values can be found in the corresponding RAW data file (B) HPTS-staining visualized (black quadrats) and computationally simulated (grey diamonds) time-course of apoplastic pH change in response to 10 nM BL. Error bars represent a corrected SD for the experimental data (n≥16) (for calculation see the corresponding RAW data file) and SD for the simulations of different model parameterizations (n = 10). Statistical evaluations on experimental data were performed as described in Figure 4.
-
Figure 6—source data 1
Raw data underlying the representation of the results.
- https://cdn.elifesciences.org/articles/73031/elife-73031-fig6-data1-v3.xlsx
Figure 7
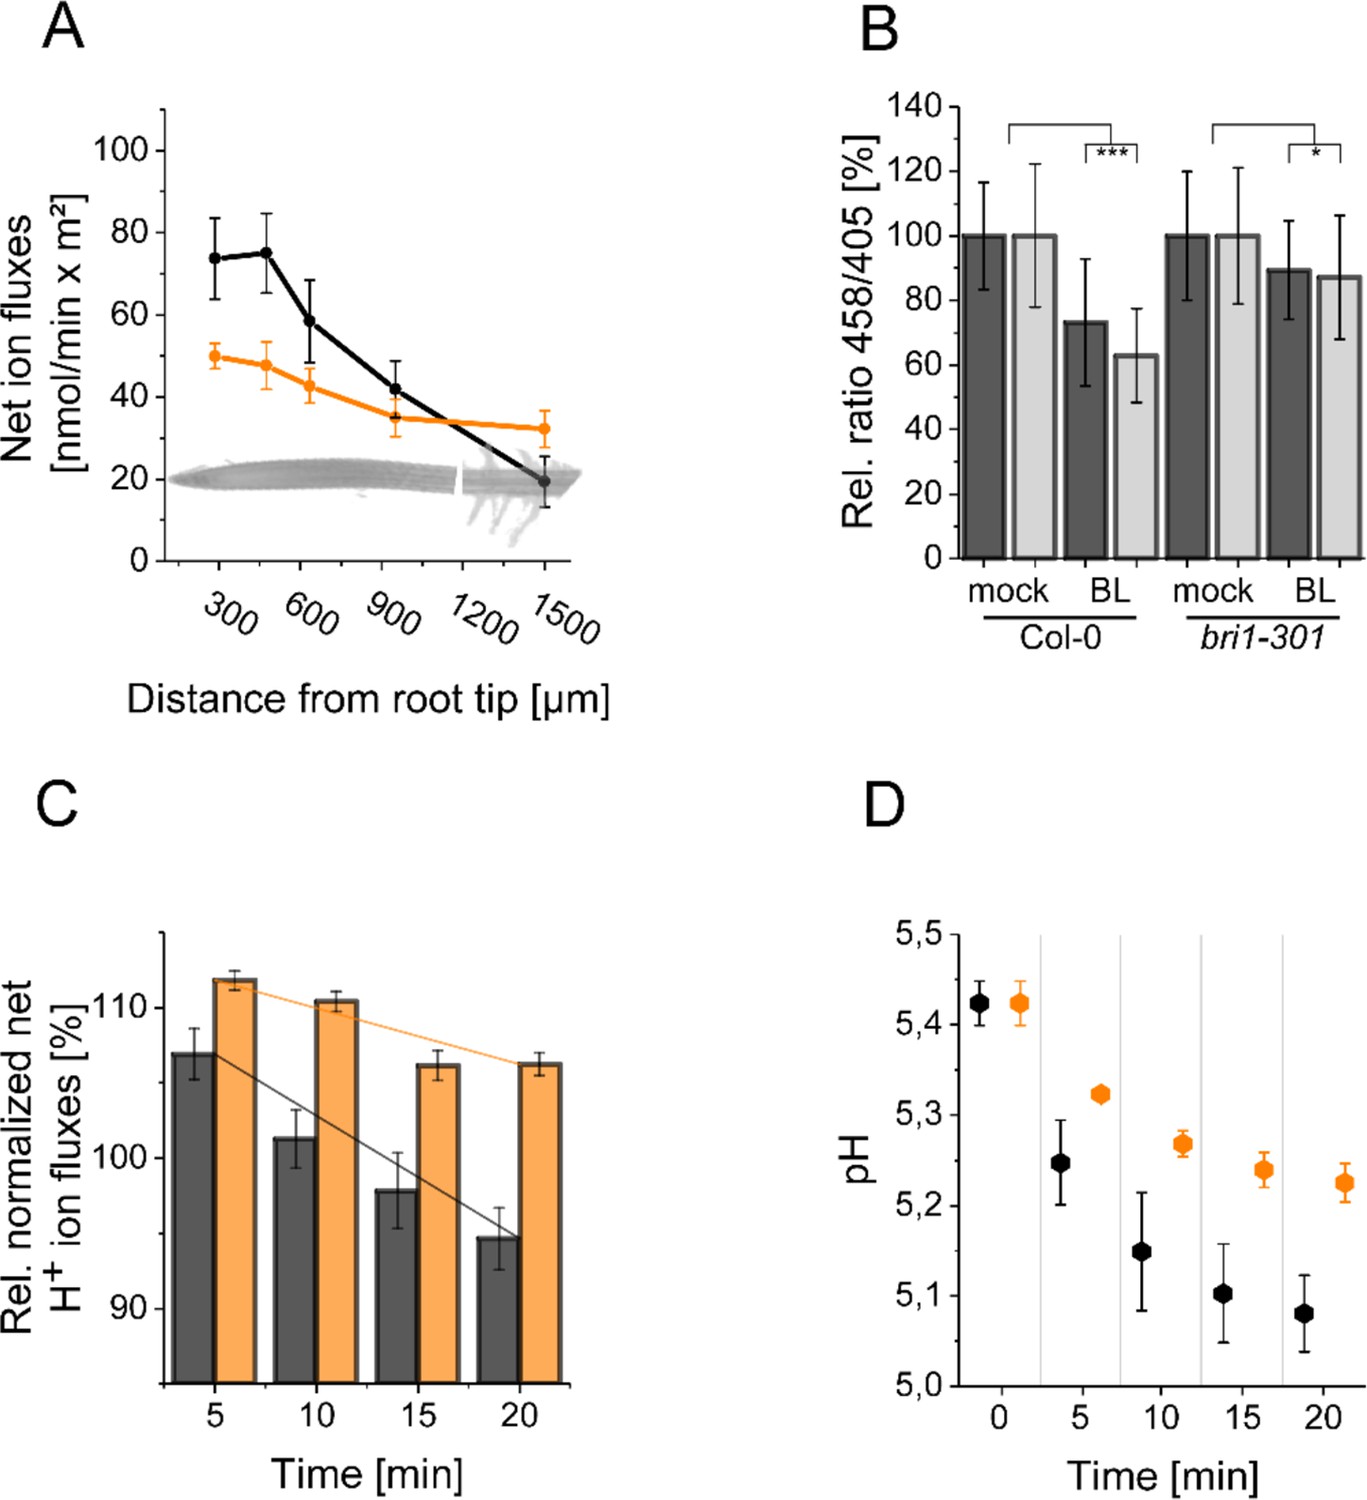
The resting apoplastic pH gradient of epidermal root cells along the axis and its regulation by BR depends on kinase-active BRI1.
(A) MIFE recording of the H+ fluxes along the root axis of Arabidopsis wild type (black line) and bri1-301 mutant (orange line) plants. Measurements were performed from 250 µm of the root tip off to the root hair zone. Error bars represent SD (n = 3). (B) Comparison of the relative apoplastic pH (ratio 458/405) of epidermal root cells in the MZ (black bars) and EZ (grey bars) of wild type and bri1-301 mutant plants after 60 min of BL (10 nM) or mock treatment, visualized by HPTS staining. The data derived from the mock treatments of the respective line were set to 100. Error bars represent SD (n≥30). Statistical evaluations were performed by comparing the respective groups separately (e.g. ‘Col-0 MZ mock’ compared with ‘Col-0 MZ BL’). Depending on the distribution of data and other assumptions either a (pooled) Two-Tailed T-Test or a Two-Tailed Wilcoxon Test were applied. The black asterisks indicate statistically significant differences (***: p≤0.001); (*: p≤0.05). The exact p-values can be found in the corresponding RAW data file. (C) Relative H+ fluxes at the EZ of wild type (black bars) and bri1-301 mutant (orange bars) plants between 5 and 20 min after application of 10 nM BL recorded by MIFE. The flux directly before the addition of BL was set to 100. The increase in net influx after treatment is due to a disturbance of the H+ conditions at the root surface, which is observed with any treatment. The solid lines illustrate the linear regression. The slope is –0.818 for the wild type and –0.371 for bri1-301. Error bars represent SD (n = 3). (D) Simulated response to 10 nM BL for the wild type (black) and bri1-301 mutant (orange), under the assumption that the bri1-301 mutant is biochemically half as active as the wild type. Error bars represent SD (n=10).
-
Figure 7—source data 1
Raw data underlying the representation of the results.
- https://cdn.elifesciences.org/articles/73031/elife-73031-fig7-data1-v3.xlsx
Figure 8
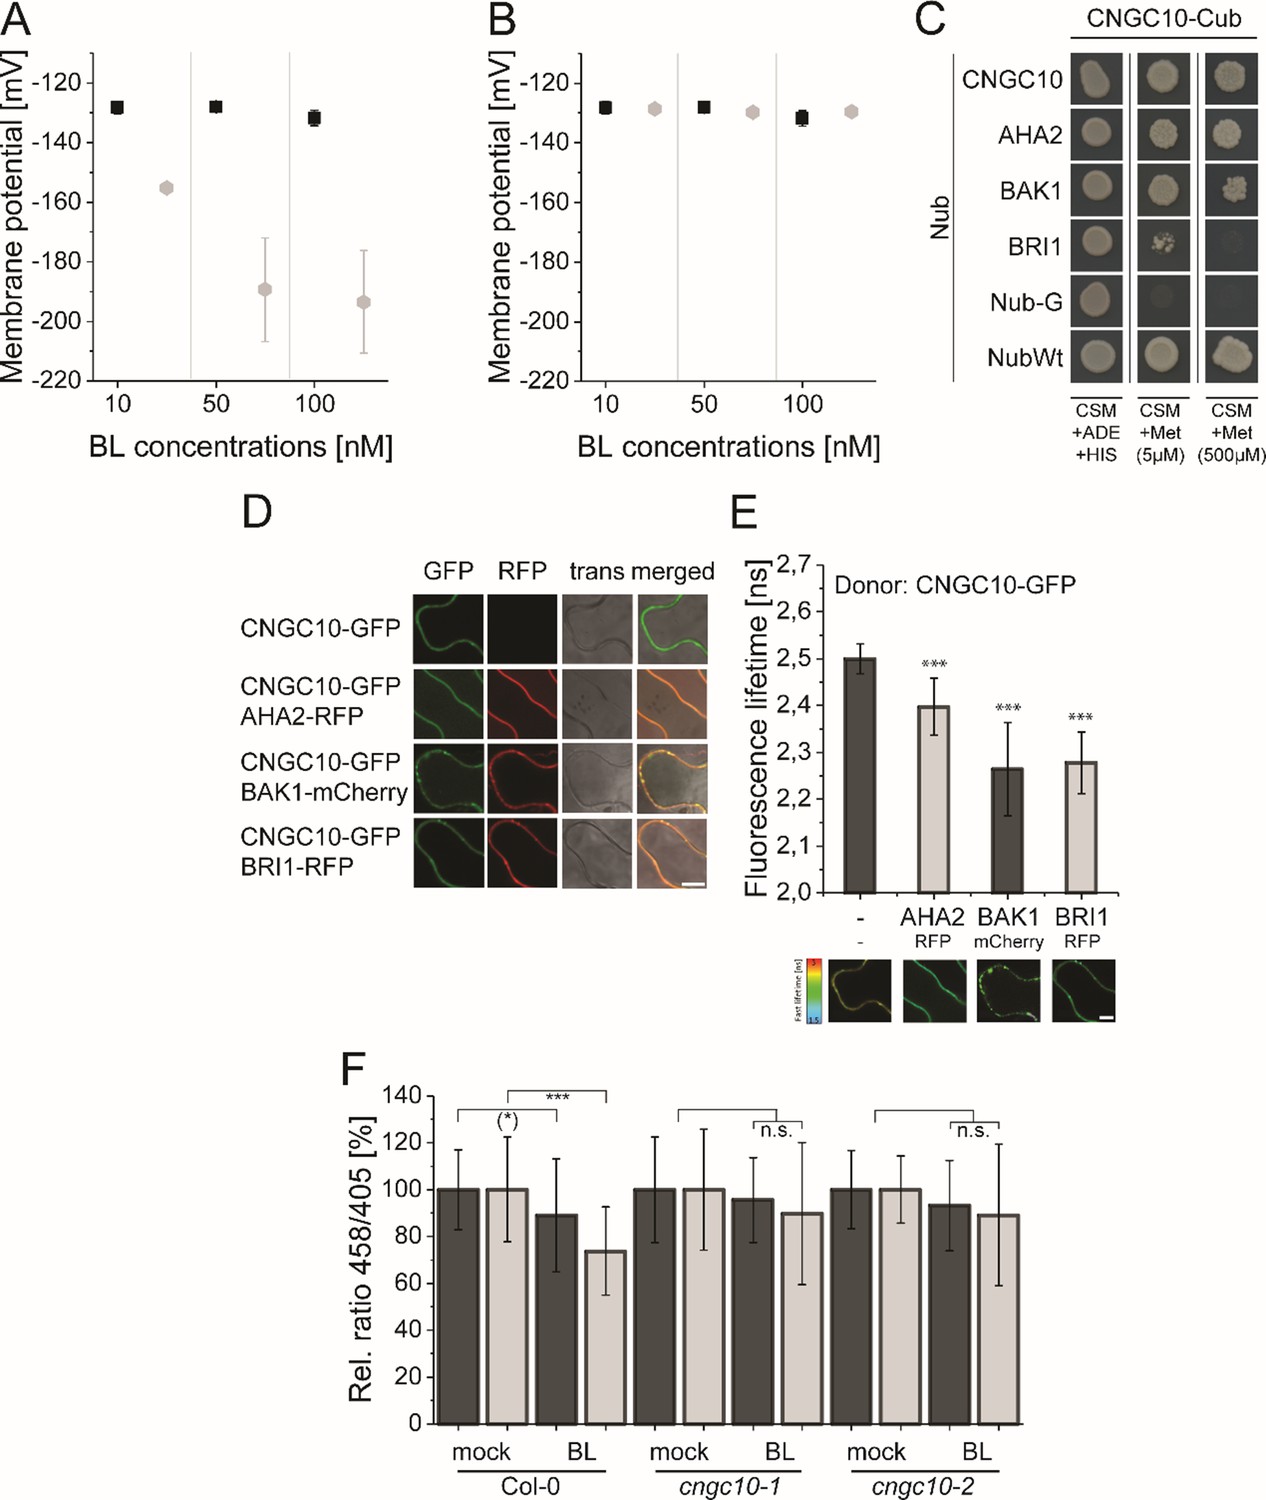
The computational model predicts the existence of a potassium channel, likely to be CNGC10, to maintain the homeostasis of the plasma membrane potential and apoplastic pH in Arabidopsis epidermal root cells.
(A) Modeled Em in the presence of different BL concentrations without the integration of potassium import (grey diamonds) in comparison to the published experimental data [black quadrats; Caesar et al., 2011] after 20 min of BL treatment. (B) Modeled Em in the presence of different BL concentrations with the integration of the CNGC10 potassium channel (grey diamonds) in comparison to the published experimental data [black quadrats; Caesar et al., 2011]. Error bars in A and B represent SEM (n≥4) in the experimental approach and SD (n = 5) of simulation results of the different model parameterizations. (C) CNGC10 forms homomers and interacts with BAK1 and AHA2 in the yeast mating-based split-ubiquitin system. The indicated combinations of Cub and Nub fusion constructs were transformed into yeast cells. Yeast cells were then grown either on media selective for the presence of the plasmids (CSM +Ade, +His) or on interaction selective media with two different concentrations (5 µM, 500 µM) of methionine (CSM +Met). The combination of CNGC10-Cub with Nub-G served as negative and that with NubWT as positive control. (D) CNGC10 colocalizes with AHA2, BAK1, and BRI1 in the plasma membrane of plant cells. Representative confocal images of transiently transformed tobacco epidermal leaf cells expressing the indicated fusion proteins. The Scale bars represents 10 µm. (E) CNGC10 is spatially closely associated with AHA2, BAK1 and BRI1 in the plasma membrane of plant cells. Fluorescence lifetime imaging microscopy (FLIM) analysis comparing the different Förster resonance energy transfer (FRET) pairs. Top: FLIM measurements of transiently transformed tobacco epidermal leaf cells expressing the CNGC10-GFP donor fusion with the indicated RFP or mCherry acceptor fusions. Error bars indicate SD (n≥20). Statistical evaluations were performed by a Kruskal-Wallis Test followed by Steel-Dwass post hoc test. The black asterisks indicate statistically significant differences (***: P≤0.0001). Bottom: Heat maps of representative plasma membrane areas used for FLIM measurements. The donor lifetimes of CNGC10 are color-coded according the scale at the left. The scale bar represents 7 µm. (F) Comparison of the relative apoplastic pH (ratio 458/405) of epidermal root cells in the MZ (black bars) and EZ (grey bars) of wild type and two independent cngc10 mutant lines after 60 min of BL (10 nM) or mock treatment, visualized by HPTS staining. The data derived from the mock treatments of the respective line were set to 100. Error bars represent SD (n≥27). Statistical evaluations were performed as described in Figure 7B. The black asterisks indicate statistically significant differences (***: p≤0.0001); ((*): p = 0.0603; borderline p-value); n.s.: not significant. The exact p-values can be found in the corresponding RAW data file.
-
Figure 8—source data 1
Raw data underlying the representation of the results.
- https://cdn.elifesciences.org/articles/73031/elife-73031-fig8-data1-v3.xlsx
Appendix 1—figure 1
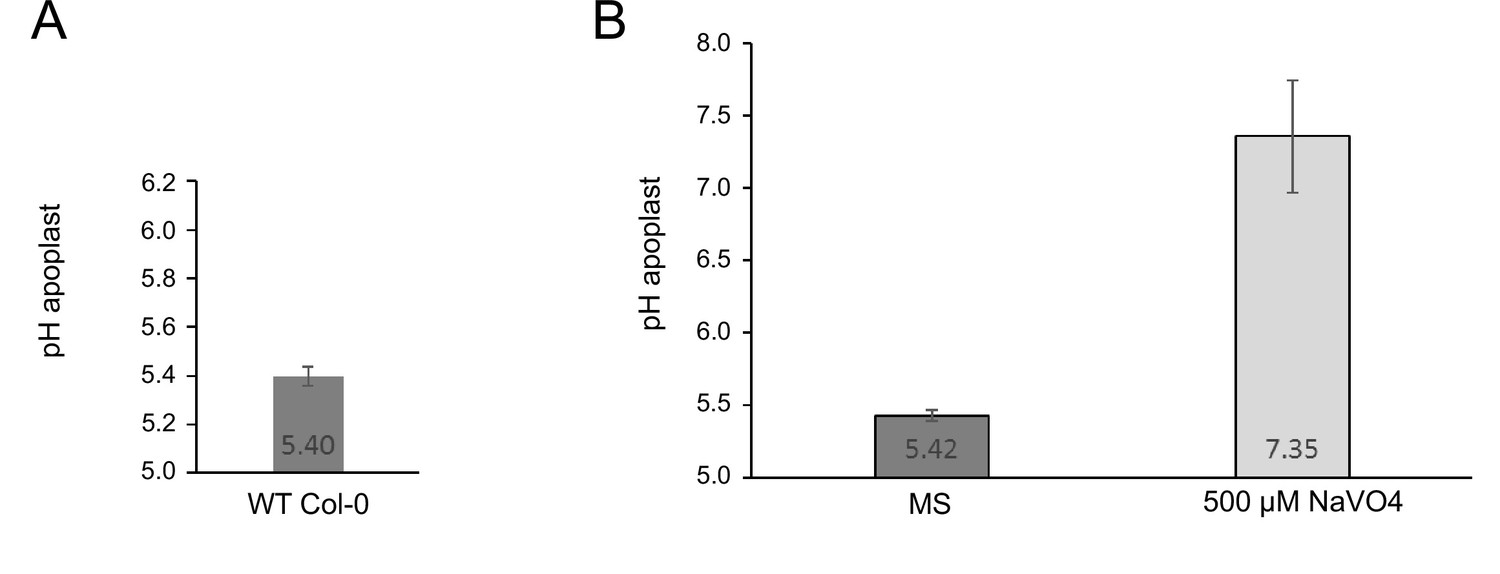
Measurement of the proton leak flux from the cell wall using SYP122-pHusion.
(A) Resting pH in the EZ of the WT Col-0. Error bars represent SD (n=3). (B) pH after 1 h of treatment with ortho-vanadate compared to control (MS). Error bars represent SD (n=30). The proton leak was estimated based on the pH difference and the average size of an epidermis cell in the mid EZ (Wilma van Esse et al., 2011).
-
Appendix 1—figure 1—source data 1
Raw data underlying the representation of the results.
- https://cdn.elifesciences.org/articles/73031/elife-73031-app1-fig1-data1-v3.xlsx
Appendix 1—figure 2

Exemplary images of the localization of fusions proteins.
Localization along the root axis. Shown is the localization of AHA2-GFP, BIR3-GFP and BRI1-GFP, expressed under the respective native promoter in the respective mutant background (5-days-old seedlings). Col-0 (top) served as control. From top to bottom: GFP channel; transmitted light (trans). As reported before the amount of BRI1-GFP did not alter much (see Figure 3C; van Esse et al., 2012). In addition, for BIR3-GFP a homogenous fluorescence was observed, as well (see Figure 3C). In contrast, there was a gradient of AHA2-GFP fluorescence intensity along the root axis, being comparatively low in the meristematic zone (MZ) but high in the elongation zone (EZ) / maturation zone (see Figure 3C). Images were taken with a SP8 laser scanning microscope (Leica Microsystems GmbH) under the use of the HC PL APO CS2 63 x/1.20 WATER objective. For all images, the same settings were used: Argon Laser: 30%. For GFP excitation: 488 nm laser line (with adequate laser power to avoid saturation of the signal). GFP fluorescence was detected by an HyD detector between 500 nm – 550 nm (190 V gain, –0.01 offset). PMT Trans was used to detect transmitted light (217 V gain, offset off). By an XY-dimension of 1024x512 px and a scan speed of 200 Hz, the zoom factor was 0.75. For better visibility, the intensity values were adjusted as followed: 0–75 (AHA2) for GFP channel and 0–85 for all transmitted light channels. Scale bar represents 25 µm and applies to all partial images.
Appendix 1—figure 3
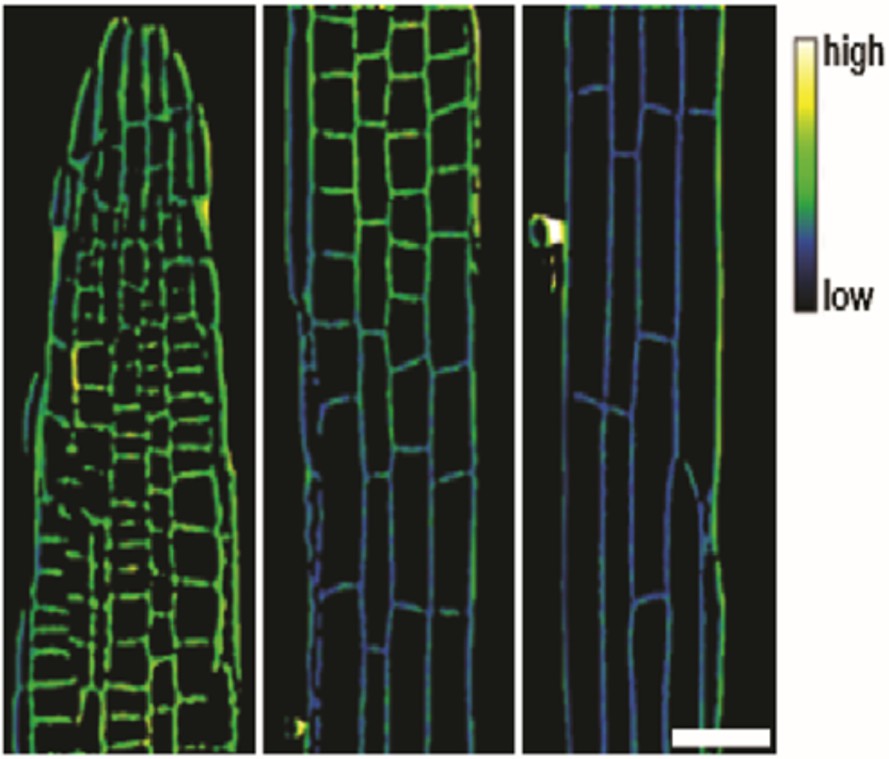
Representative image of the apoplastic pH of epidermal cells along the root axis of wild type Arabidopsis using HPTS-staining starting with the meristematic zone (MZ, left) over the transition zone (TZ, middle) to the elongation zone (EZ, right).
The scale bar represents 25 µm and applies to all partial images.
Appendix 1—figure 4
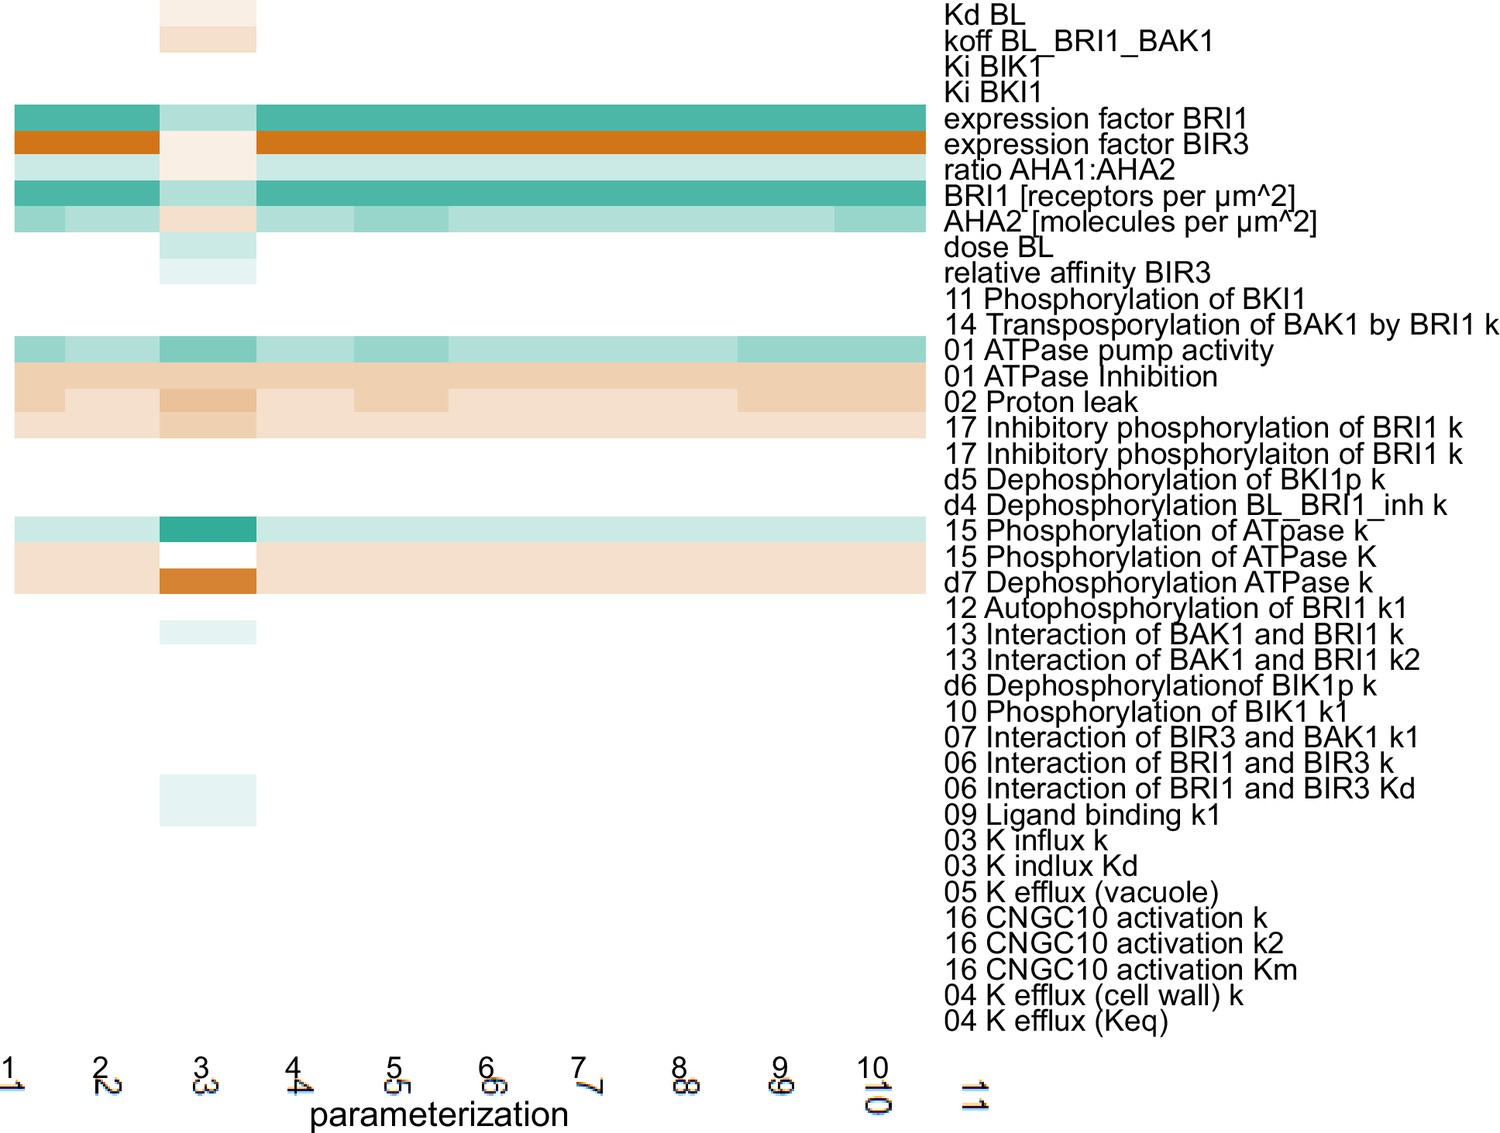
Scaled sensitivities of the pH change 60 min after stimulation with 10 nM BL in response to changes in the parameter and global quantities values.
Color code: red - negative control, white - no influence, green - positive control. Color saturation indicates strength of the influence.
-
Appendix 1—figure 4—source data 1
Raw data underlying the representation of the results.
- https://cdn.elifesciences.org/articles/73031/elife-73031-app1-fig4-data1-v3.xlsx
Appendix 1—figure 5
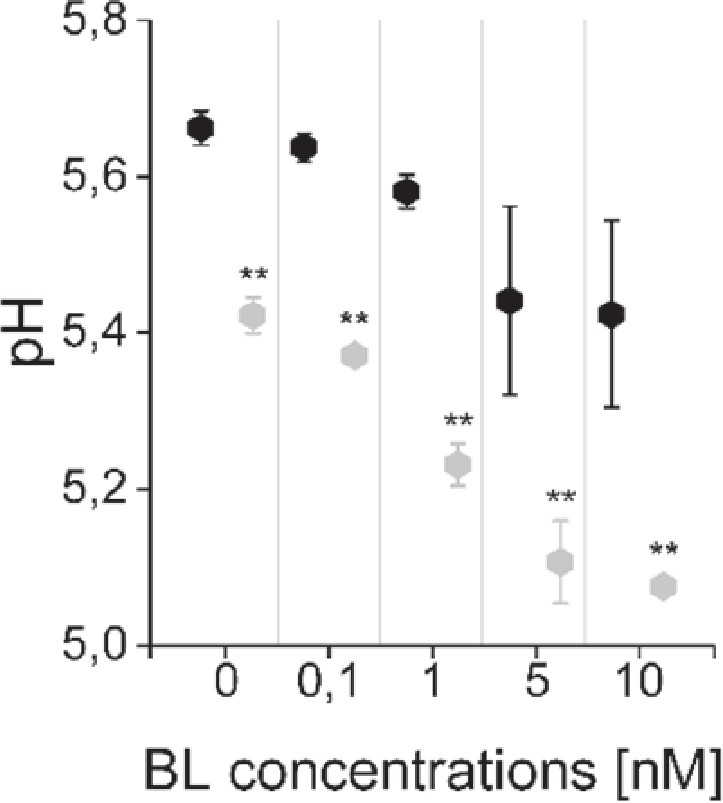
The computational model captures the differences in the sensitivity of apoplastic acidification between the root epidermal cells of the meristematic zone (MZ) and elongation zone (EZ) in response to BL.
Black diamonds represent MZ and grey diamonds EZ. Virtual BL incubation of different concentration was done for 60 min. Error bars represent SD for the simulations of different model parameterizations (n=10). Statistical evaluations were performed by comparing the respective groups separately (e.g. ‘0 nM MZ’ compared with ‘0 nM EZ’). For all comparisons a Two-Tailed Wilcoxon Test was applied. The black asterisks indicate statistically significant differences (**: p≤0.01). The exact p-values can be found in the attached RAW data file. The EZ cells showed a lower resting apoplastic pH and a stronger concentration-dependent response than MZ cells.
-
Appendix 1—figure 5—source data 1
Raw data underlying the representation of the results.
- https://cdn.elifesciences.org/articles/73031/elife-73031-app1-fig5-data1-v3.xlsx
Appendix 1—figure 6
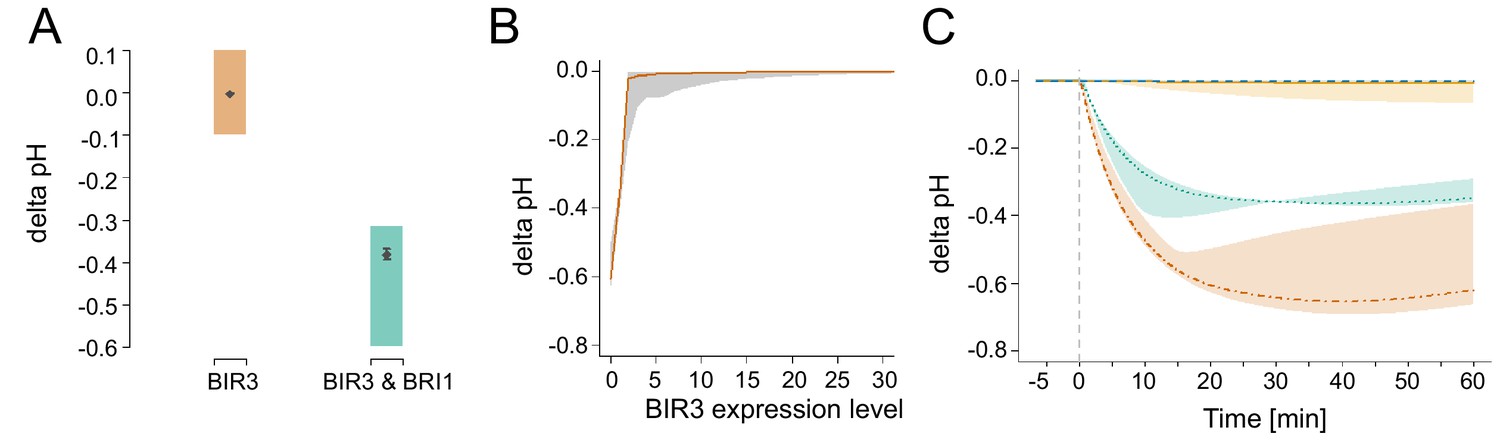
In silico analysis of the functional role of the negative regulator BIR3 on BL-regulated apoplastic acidification.
(A) Modelled qualitative acidification output of plants overexpressing BIR3 and BIR3 & BRI1, respectively. The colored area represents the pH response targeted during parameter estimation, which was approximated by the activity of BR signaling indicated by the plant phenotypes (Imkampe et al., 2017). (B) BIR3-Expression-response curve. Shown is the pH change 20 min after stimulation with 10 nM BL at different BIR3 expression levels ranging from 0- (loss-of-function mutant) to 30-times the normal expression level of the wild type. The entire range of simulated responses is indicated by the shaded area, the averaged response of all models is denoted by the line. (C) Exemplary time-course simulations of the pH change at 0 (loss-of-function mutant, orange), 1- (wild type expression, green), 10- (yellow), and 100-fold (blue) expression of BIR3 upon virtual application of 10 nM BL. Shown is the average pH response for the respective BIR3 expression level with the span between minimal and maximal values indicated by the colored area. The virtual addition of BL at time 0 is indicated by the vertical dashed line.
-
Appendix 1—figure 6—source data 1
Raw data underlying the representation of the results.
- https://cdn.elifesciences.org/articles/73031/elife-73031-app1-fig6-data1-v3.xlsx
Author response image 1

Ratiometric HPTS (458/405 emission ratio pH-dependent).
Measurement of apoplastic pH in the root HPTS-8-hydroxypyrene-1,3,6-trisulfonic acid (trisodium salt).
Tables
Appendix 1—table 1
Overview of model compartments and (initial) sizes for both MZ and early EZ.
a calculated by multiplying the membrane area with the cell wall thickness (Wilma van Esse et al., 2011; Caesar et al., 2011). b estimated volume based on cell dimensions and cellular volume (Wilma van Esse et al., 2011). c estimated surface area, included as scaling factor in the global quantities.
| Root zone | Compartment | Size |
|---|---|---|
| Meristematic zone | cytosol | 8.47 × 10⁻¹³ dm3 |
| membrane | 7.67 × 10⁻⁸ dm2 | |
| cell walla | 3.03 × 10⁻¹³ dm3 | |
| vacuole | NA | |
| vacuolar surface | NA | |
| Early elongation zone | cytosol | 2.271 × 10⁻¹² dm3 |
| membrane | 2.098 × 10⁻⁷ dm2 | |
| cell walla | 8.2871 ×10⁻¹³ dm3 | |
| vacuoleb | 2.352 × 10⁻¹² dm3 | |
| vacuolar surfacec | 1.087 × 10⁻⁷ dm2 |
Appendix 1—table 2
Protein are specified by the Uniprot identifier (Bairoch et al., 2005) and the corresponding gene ID.
For ions and chemical compounds, the ChEBI (Chemical Entities of Biological Interest Degtyarenko et al., 2008) identifier is used instead. The initial concentrations of all un-phosphorylated species and complexes between proteins were set to 0 pM.
| Species | Uniprot ID / | Gene ID | Initial | Source |
|---|---|---|---|---|
| ChEBI ID | Concentration | |||
| BRI1 | O22476 | At4g39400 | Wilma van Esse et al., 2011 | |
| BAK1 | Q94F62 | At4g33430 | Wilma van Esse et al., 2011 | |
| BIR3 | this study | |||
| AHA* | ||||
| AHA1 | P20649 | At2g18960 | assumption: | |
| mRNA data (eFP Browser) | ||||
| Winter et al., 2007 | ||||
| AHA2 | P19456 | At4g30190 | this study | |
| AHA CT* | C-terminus | assumed to be | ||
| of AHAs | ||||
| BKI1 | Q9FMZ0 | At5g42750 | assumption: | |
| BIK1 | O48814 | At2g39660 | assumption: | |
| CNGC10 | Q9LNJ0 | At1g01340 | ||
| H+in | 24636 | - | ||
| H+out | 24636 | - | fitted to data | |
| K+out | 29103 | - | 9.8425 × 10⁹ pM | ½ MS medium |
| K+in | 29103 | - | 8.4 × 10¹⁰ pM | Maathuis and Sanders, 1993 |
| K+vac | 29103 | - | 8.4 × 10¹⁰ pM | assumed to be identical to K+in |
| BL | 28277 | - | see experimental setup |
-
*
To avoid overly complicating the model we have summarized the pump activity of and into one reaction that is mediated by , which is defined as the sum of and . Similarly, regulatory function of the C-terminal regions of the AHAs is mediated by the unphosphorylated form of the C-terminus AHA CT, which represents the C-terminal regions of both and .
Appendix 1—table 3
Overview of model reactions, including the reaction number (ID), the general type of rate law chosen for the respective reaction as well as available experimental parameter values.
Rate law abbreviations: MA - mass action kinetics, MM - Michaelis-Menten kinetics, CF - constant flux.
| ID | Rate law | Parameter | Value | Source |
|---|---|---|---|---|
| r01 | modified MA | approx. fold for AHA2 | Regenberg et al., 1995 | |
| r02 | modified MA | to | this study | |
| r03 | modified MA | |||
| r04 | MA | |||
| r05 | MA | |||
| r06 | MA | |||
| r07 | MA | |||
| r08 | CF, MA | from to | Caesar et al., 2011 this study | |
| r09 | modified MA | to | Clouse, 2002 Hohmann et al., 2018 | |
| Kinoshita et al., 2005 | ||||
| Wang et al., 2001 | ||||
| Hohmann et al., 2018 | ||||
| r10 | modified MM | Wang et al., 2014 | ||
| r11 | modified MM | |||
| r12 | modified MA | |||
| r13 | MA | |||
| r14 | MA | |||
| r15 | MM | |||
| r16 | MM | |||
| r17 | MM | slow increase over | Oh et al., 2012 | |
| MA | ||||
| MA | max. kd | Hohmann et al., 2018 | ||
| MA | max. kd | Hohmann et al., 2018 | ||
| MA | residual after | Oh et al., 2012 | ||
| MA | ||||
| MA | ||||
| MA | ||||
Additional files
-
Transparent reporting form
- https://cdn.elifesciences.org/articles/73031/elife-73031-transrepform1-v3.docx
-
Appendix 1—figure 1—source data 1
Raw data underlying the representation of the results.
- https://cdn.elifesciences.org/articles/73031/elife-73031-app1-fig1-data1-v3.xlsx
-
Appendix 1—figure 4—source data 1
Raw data underlying the representation of the results.
- https://cdn.elifesciences.org/articles/73031/elife-73031-app1-fig4-data1-v3.xlsx
-
Appendix 1—figure 5—source data 1
Raw data underlying the representation of the results.
- https://cdn.elifesciences.org/articles/73031/elife-73031-app1-fig5-data1-v3.xlsx
-
Appendix 1—figure 6—source data 1
Raw data underlying the representation of the results.
- https://cdn.elifesciences.org/articles/73031/elife-73031-app1-fig6-data1-v3.xlsx
Download links
A two-part list of links to download the article, or parts of the article, in various formats.
Downloads (link to download the article as PDF)
Open citations (links to open the citations from this article in various online reference manager services)
Cite this article (links to download the citations from this article in formats compatible with various reference manager tools)
Computational modeling and quantitative physiology reveal central parameters for brassinosteroid-regulated early cell physiological processes linked to elongation growth of the Arabidopsis root
eLife 11:e73031.
https://doi.org/10.7554/eLife.73031


