Role of YAP in early ectodermal specification and a Huntington's Disease model of human neurulation
- Laboratory of of Stem Cell Biology and Molecular Embryology, The Rockefeller University, United States
- Howard Hughes Medical Institute, The Rockefeller University, United States
- Laboratory of Sensory Neuroscience, The Rockefeller University, United States
- ICBAS - Instituto de Ciências Biomédicas Abel Salazar, Universidade do Porto, Portugal
- i3S - Instituto de Investigação e Inovação em Saúde, Universidade do Porto, Portugal
- INEB - Instituto de Engenharia Biomédica, Universidade do Porto, Portugal
- Bioinformatics Resource Center, The Rockefeller University, United States
Figures
Figure 1 with 11 supplements
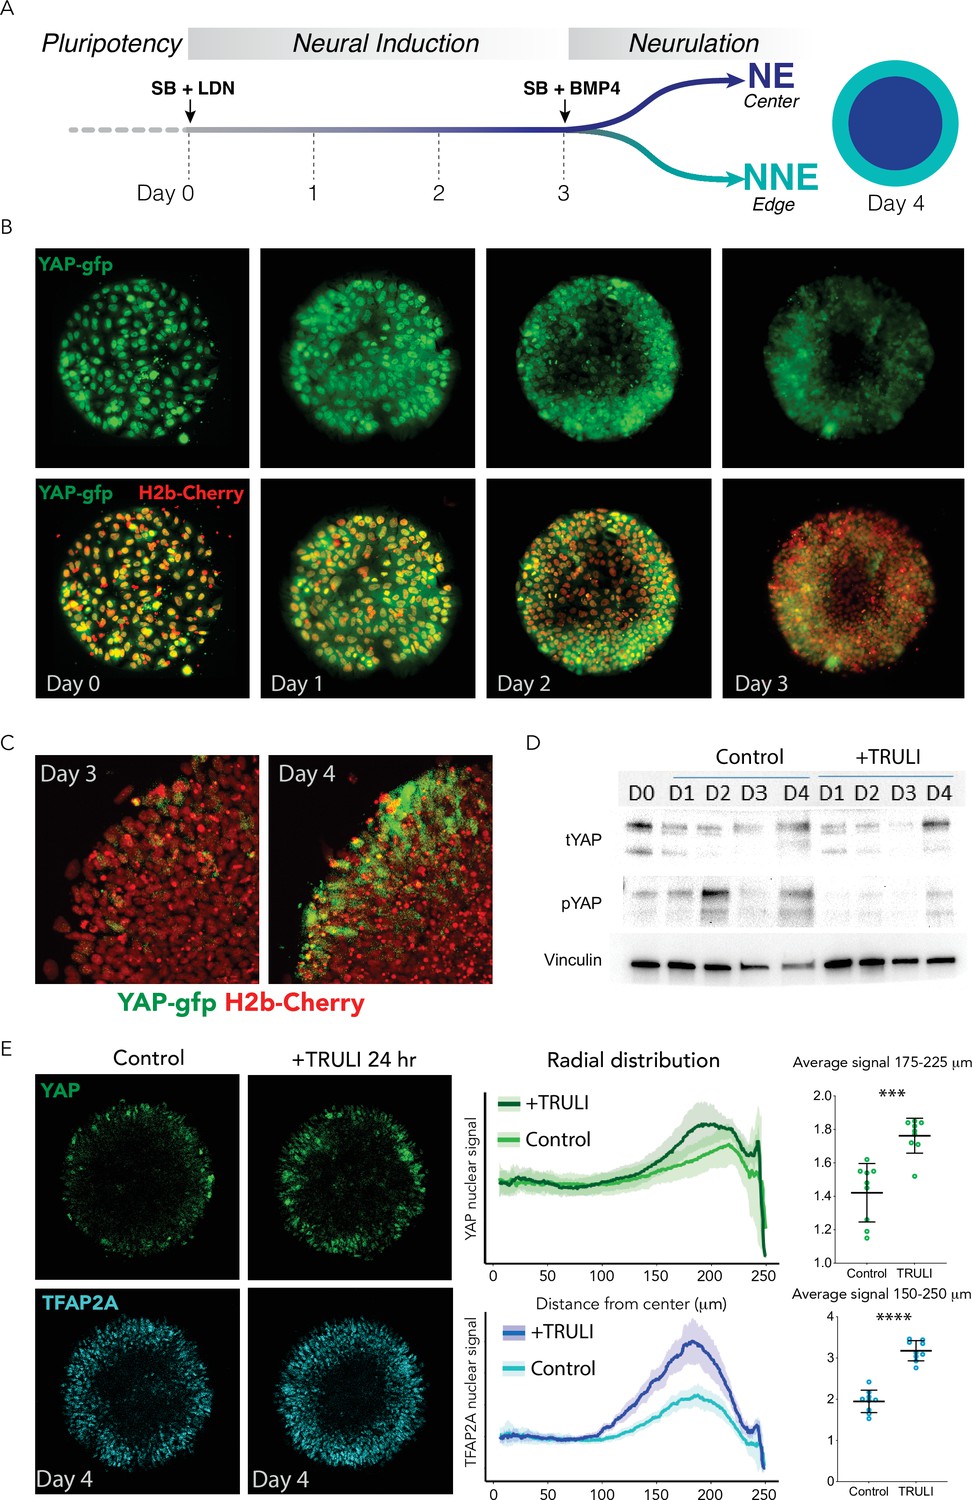
Dynamics of YAP expression and localization in early neuruloids.
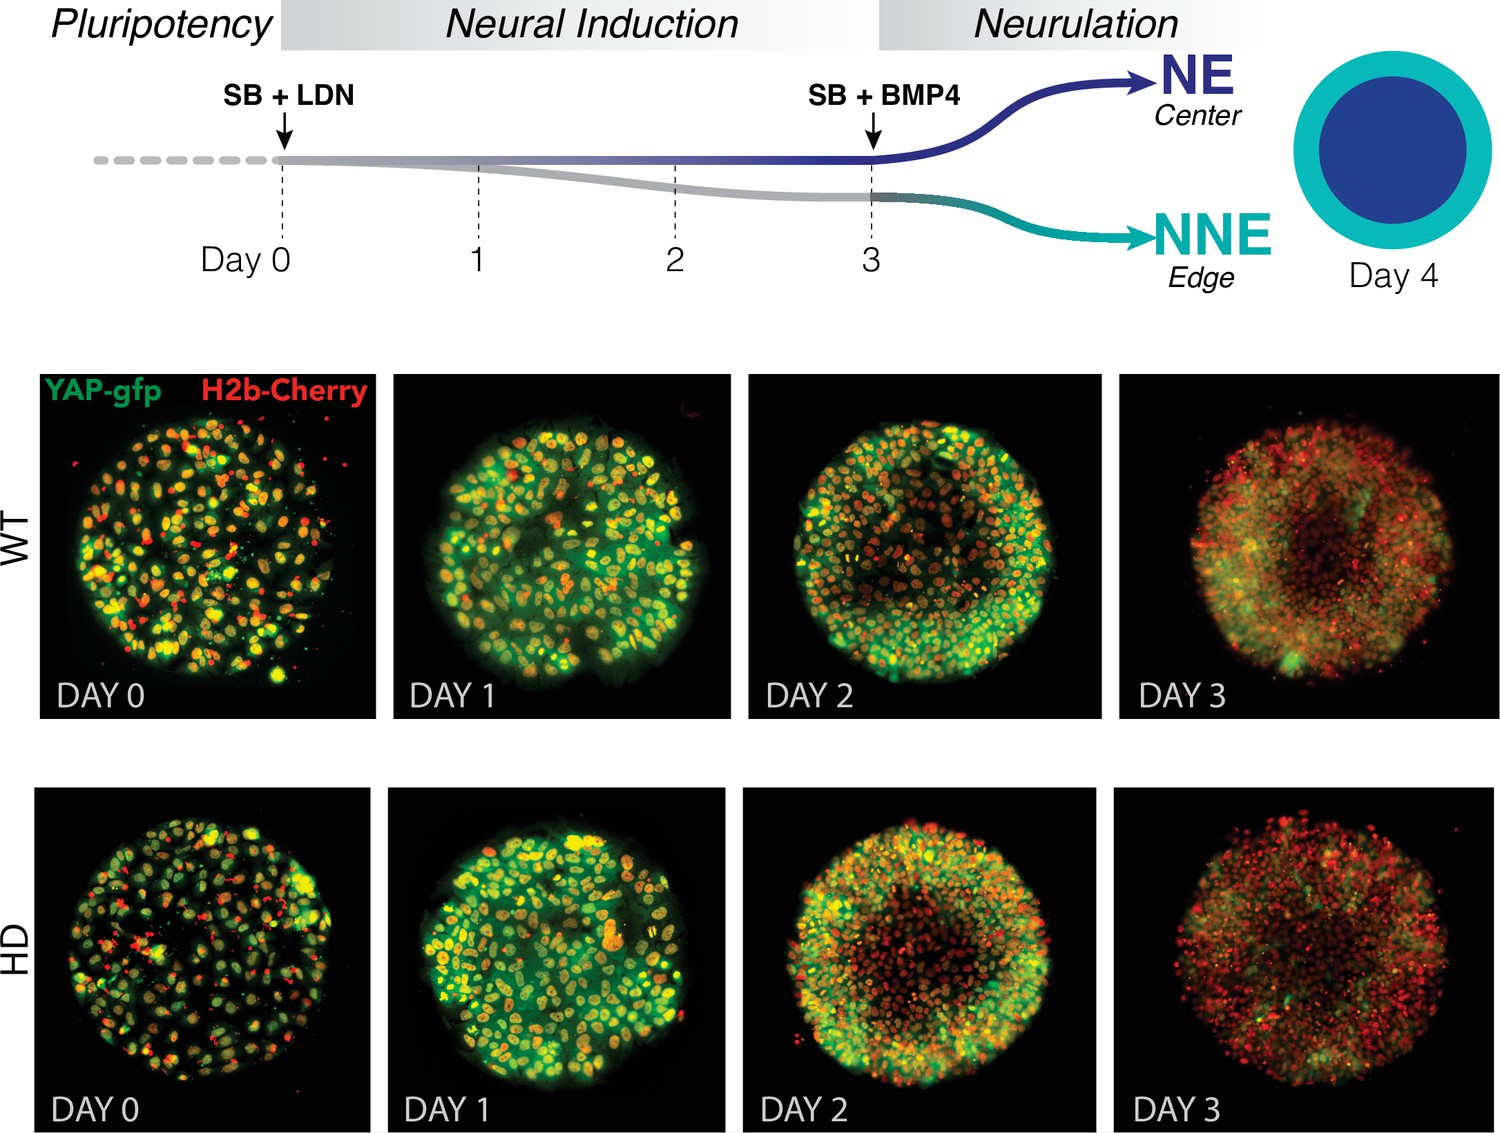
(A) During the first 4 days of the differentiation protocol, pluripotent hESCs seeded on a micropattern undergo 3 days of neural induction (SB +LDN) followed by BMP4 induction of neurulation (SB +BMP4). (B) Fluorescent images of living YAP-GFP and H2b-Cherry hESC colonies during neural induction show the progressive shift of YAP from nuclei into cytoplasm and a reduction in expression level. (C) Fluorescent images portray one quadrant of a colony acquired before (D3) and 24 hr after (D4) BMP4 administration. (D) Immunoblots from D0 to D4 of the neuruloid protocol illustrate the decrease in YAP phosphorylated at residue S127 (pYAP) upon treatment with 10 µM TRULI. The amount of total YAP protein (tYAP) initially declines but recovers by D4. Vinculin serves as a loading control. (E) Left: Immunolabeling of D4 neuruloids demonstrates the increased concentration of YAP and TFAP2A, a marker of NNE, at the edges of colonies treated for 24 hr with 10 µM TRULI. Right: Radial distribution of YAP and TFAP2A nuclear signals from several micropattern colonies quantitate the result. The average values at the edge of each colony are also shown. ****, p<0.0001; ***, p<0.001 in unpaired t-tests comparing untreated (control) and TRULI-treated samples. Nine colonies were analyzed for each condition. hESC, human embryonic stem cell.
-
Figure 1—source data 1
Raw images for immunoblot shown in Figure 1D.
- https://cdn.elifesciences.org/articles/73075/elife-73075-fig1-data1-v1.zip
Figure 1—figure supplement 1
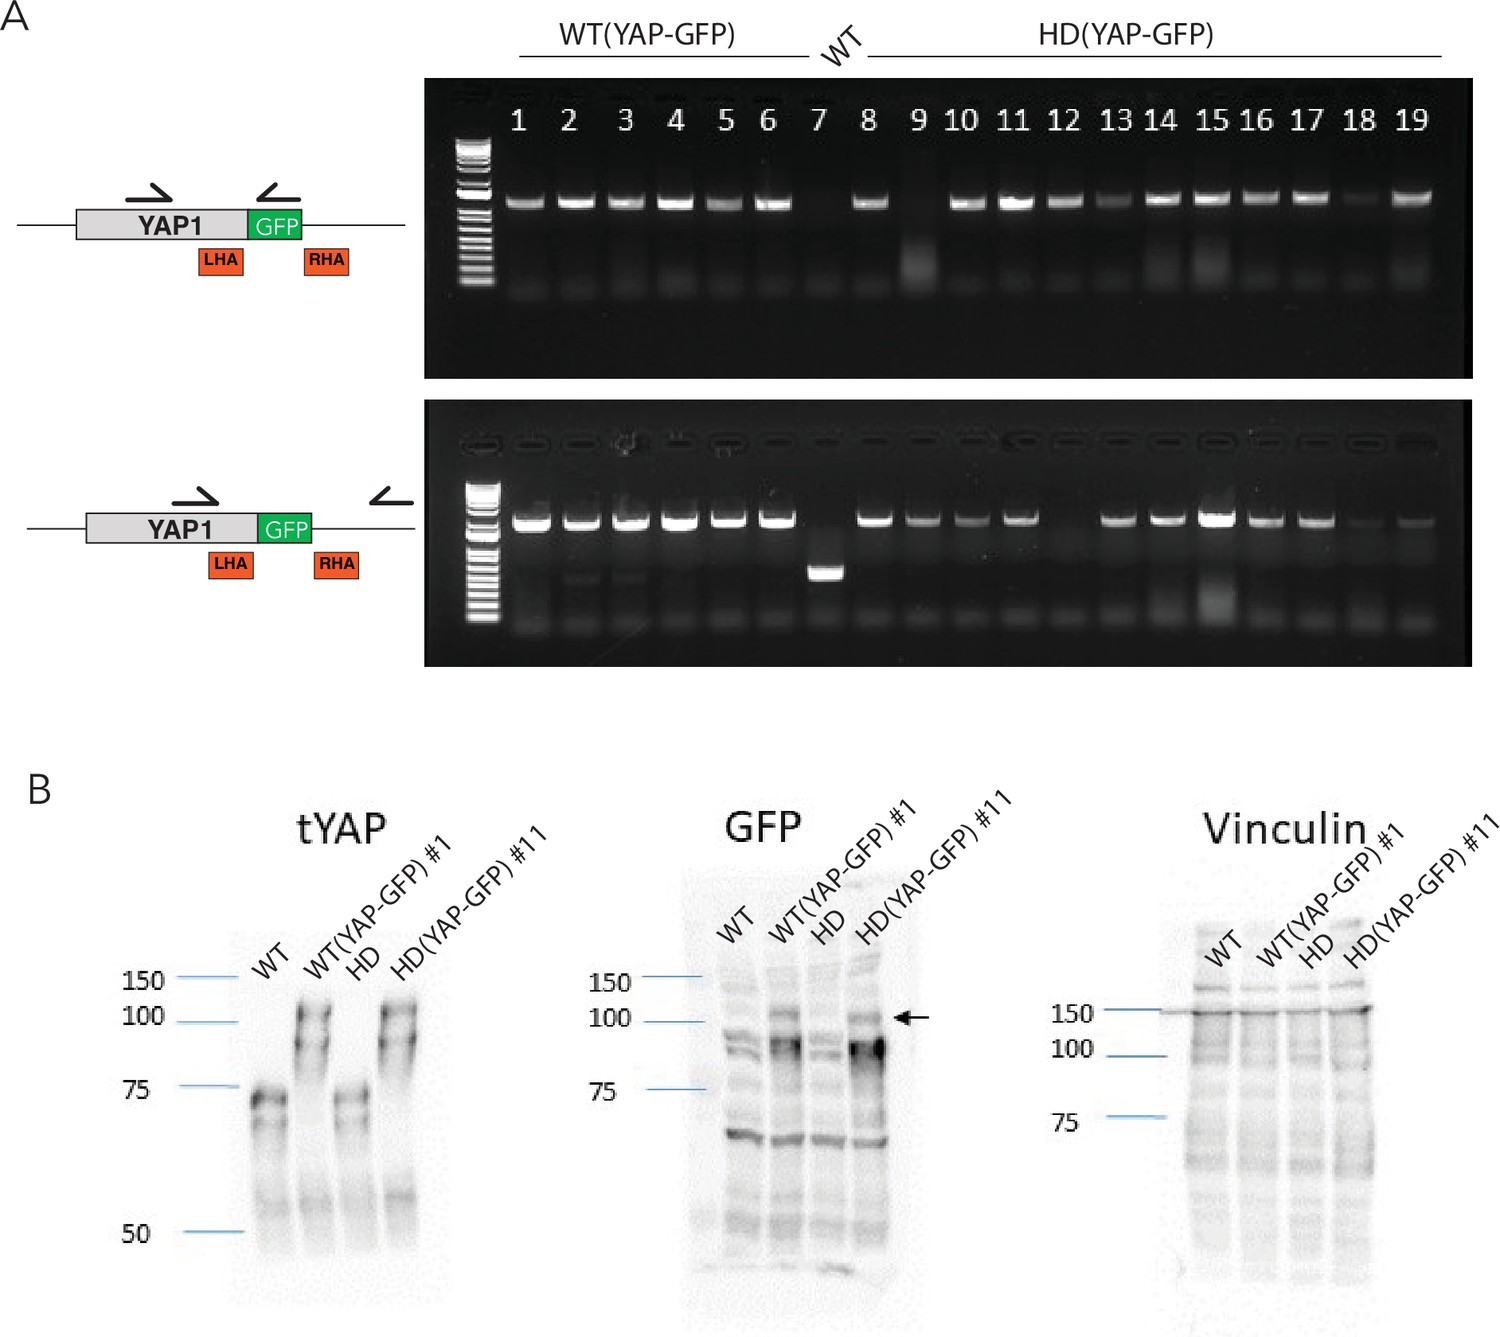
Screening of WT and HD YAP-GFP reporter lines.
(A) Genotypic screening of hESC clones from WT and HD backgrounds with PCR oligonucleotides (half-arrows) shows that multiple colonies underwent biallelic insertion of the GFP sequence. (B) Immunoblot for total YAP (tYAP) and GFP from one clone of WT (YAP-GFP) and one from HD (YAP-GFP) confirmed the expression of YAP-GFP fusion proteins (arrow). Untransfected WT and HD lines provide negative controls; vinculin provides a loading control. hESC, human embryonic stem cell.
Figure 1—figure supplement 2
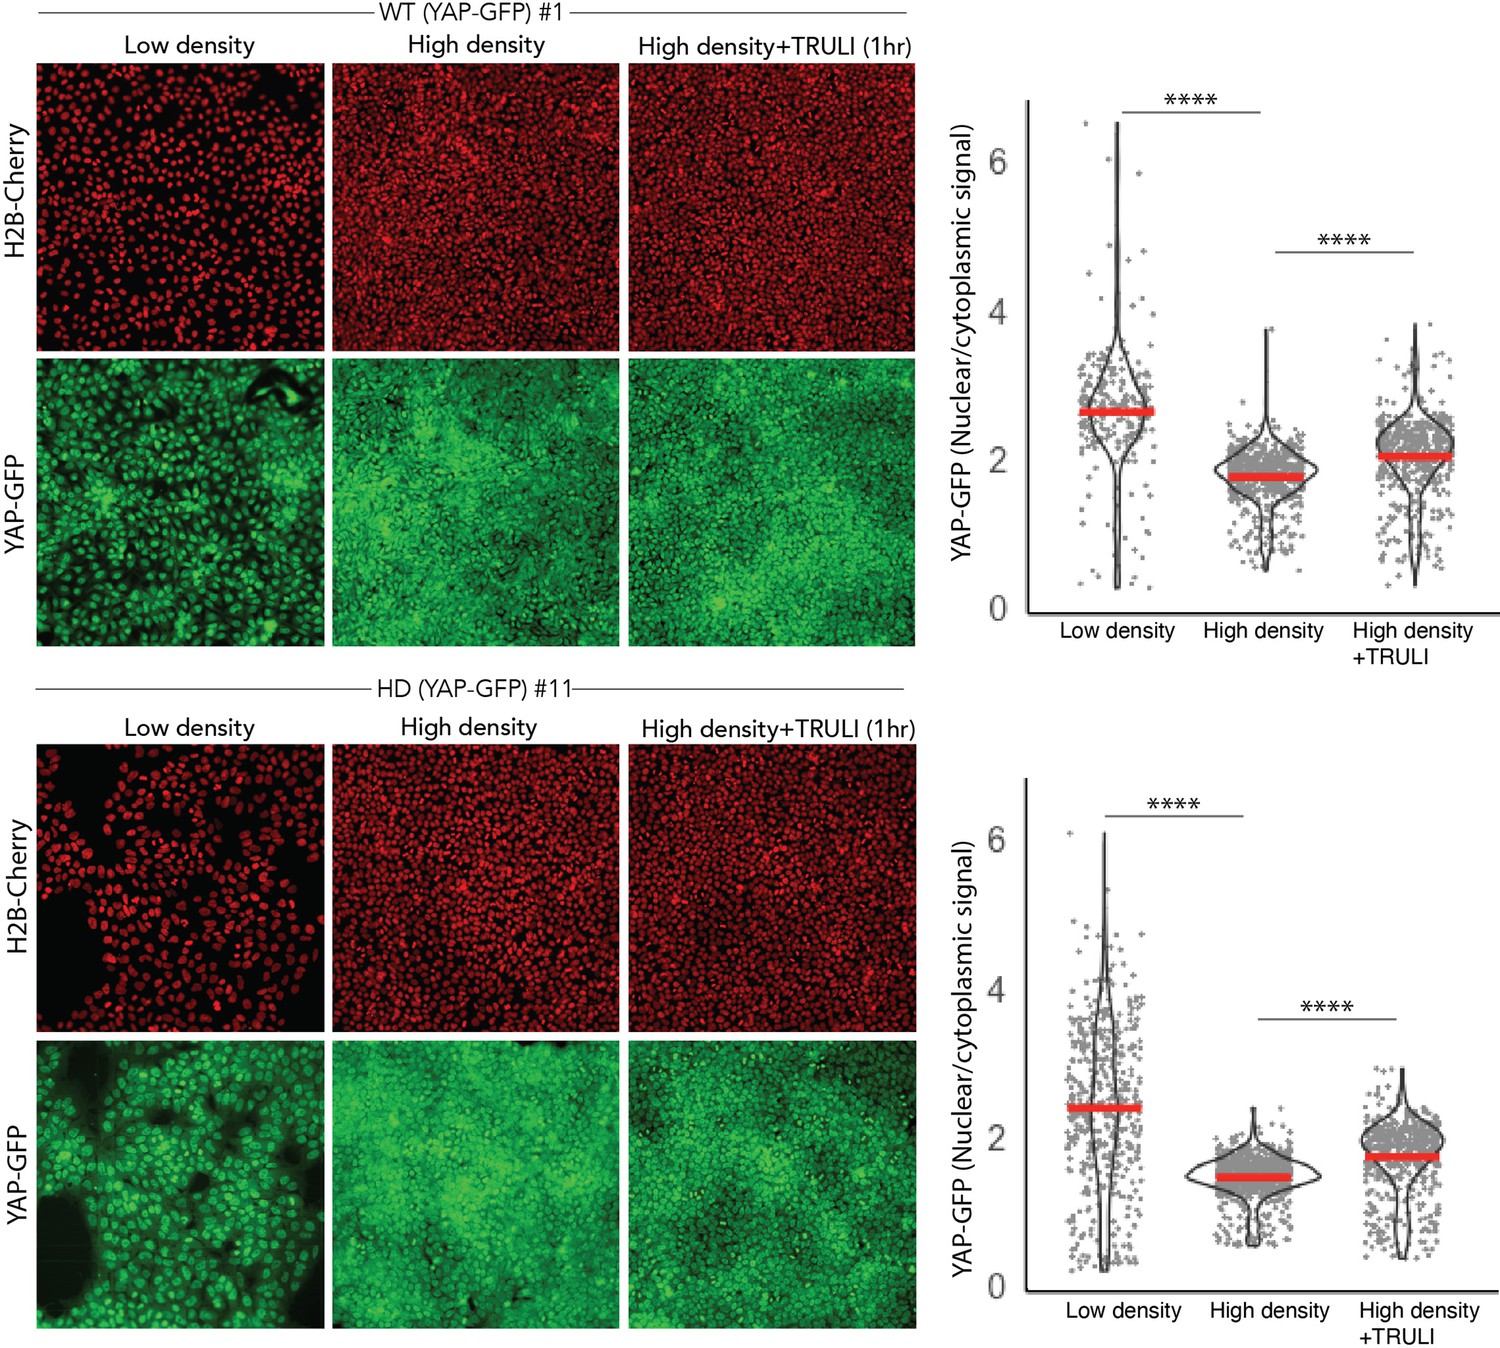
Validation of WT and HD YAP-GFP reporter lines.
(Right) Fluorescent images of living WT and HD hESC clones expressing endogenous YAP-GFP and H2b-Cherry show the effect on YAP nuclear accumulation of cellular density and of treatment with 10 μM TRULI for 1 hr. (Left) Quantification of the ratio of nuclear to cytoplasmic YAP-GFP signals confirms that high-density culture results in reduced nuclear accumulation of YAP and that TRULI treatment increases YAP in both WT and HD hESC lines. Nuclei are identified by segmentation of H2B-mCherry signal. The mean signal excluded by this nuclear mask was considered as the value for cytoplasm. ****, p<0.0001 in unpaired nonparametric t-tests comparing low and high densities, and high-density controls with TRULI-treated specimens. hESC, human embryonic stem cell.
Figure 1—figure supplement 3
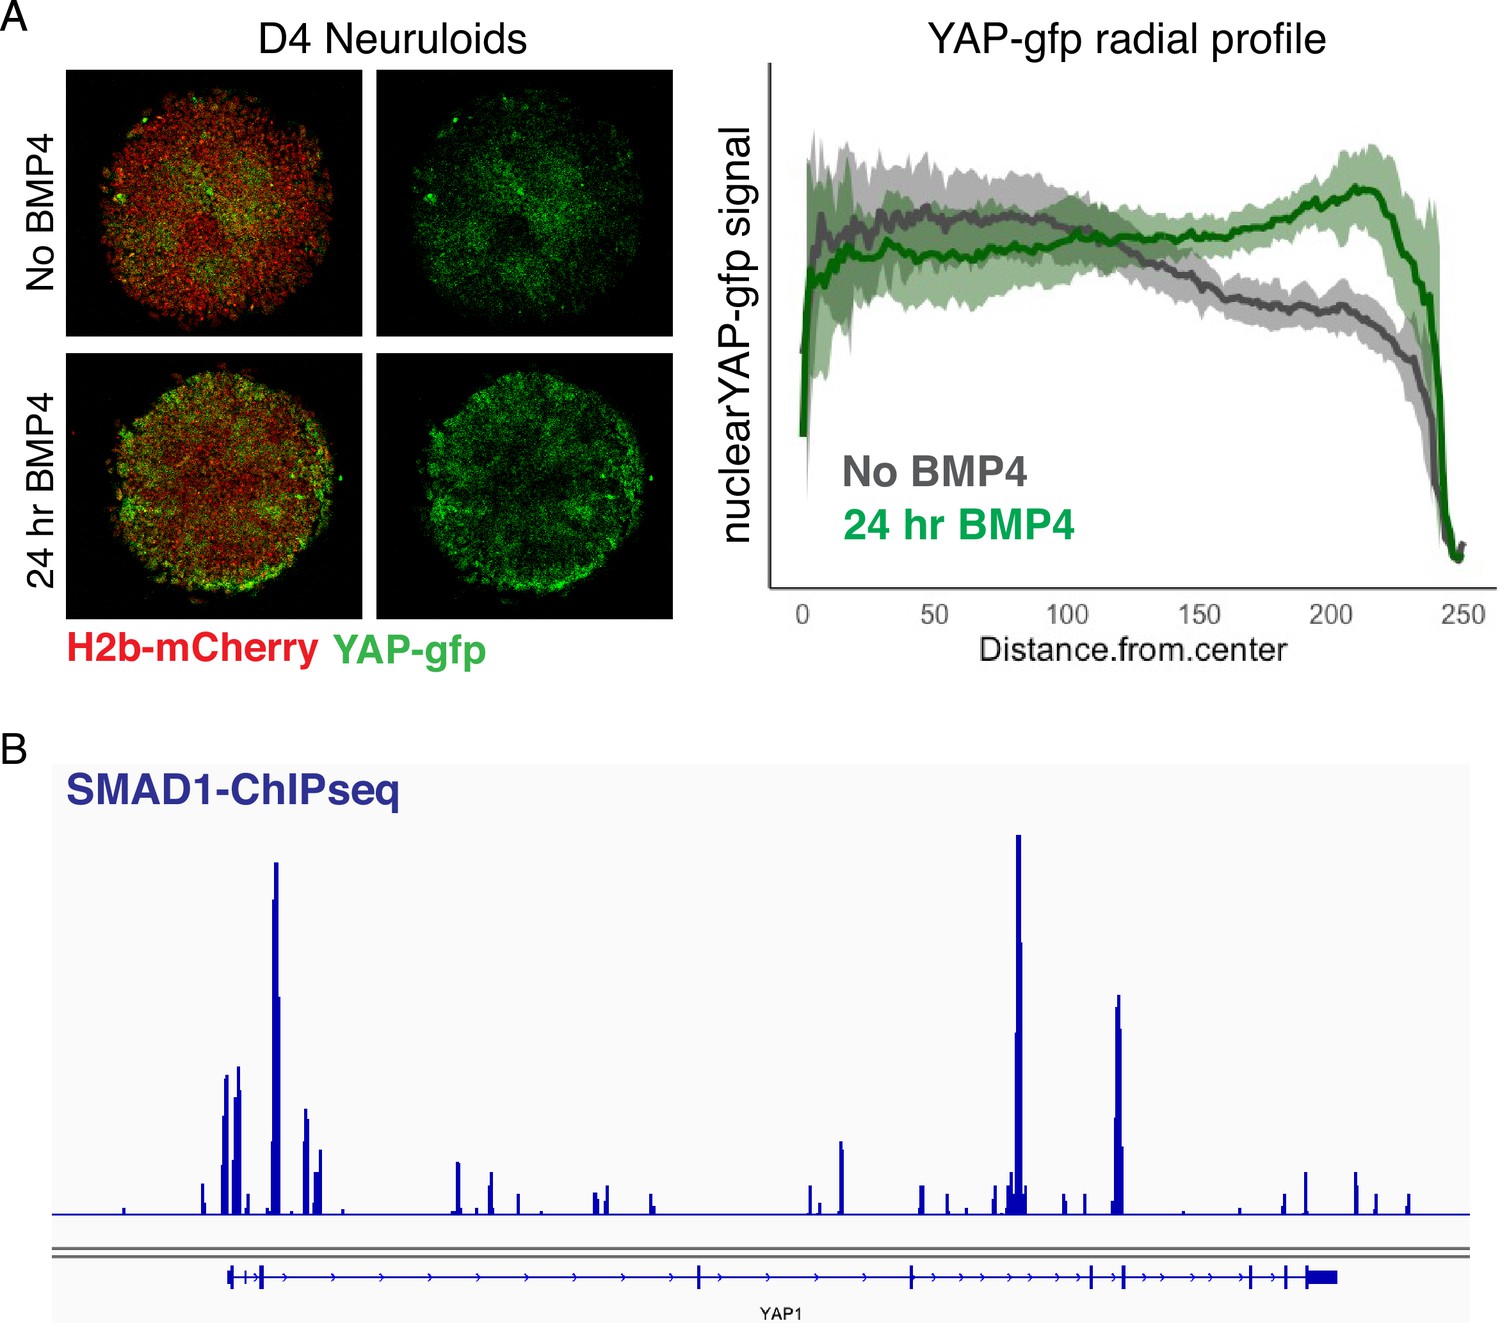
BMP4-dependent upregulation of YAP in D4 neuruloids.
(A) Fluorescent images of living D4 WT neuruloids demonstrate that the upregulation of YAP at the edge of the colony depends on BMP4 stimulation. (Left) Representative images show D4 neuruloids stimulated with BMP4 for 24 hr or left unstimulated. (Right) The radial distribution of nuclear YAP-GFP signal across 16 colonies shows the consistency of the effect. (B) Snapshot of SMAD1 Chip-seq in hESC (Tsankov et al., 2015) shows that the BMP4-SMAD1 signaling might directly regulate the expression of YAP. hESC, human embryonic stem cell.
Figure 1—figure supplement 4
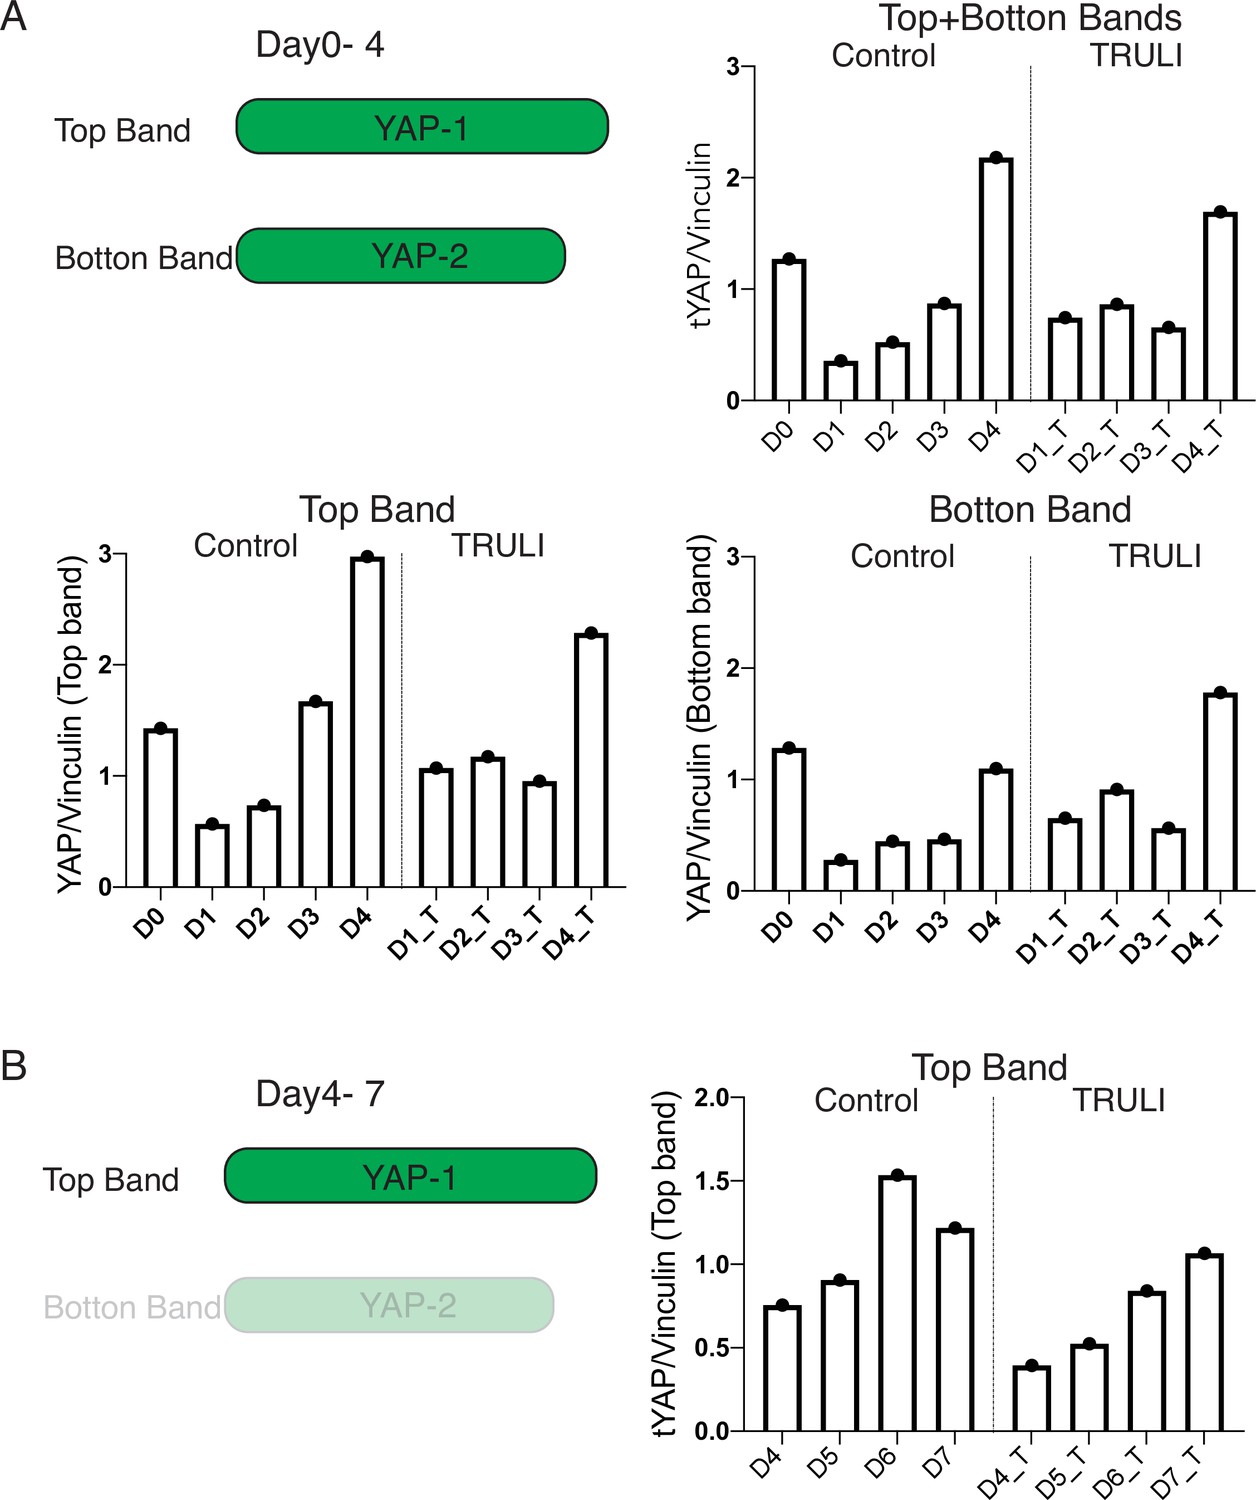
Quantification of immunoblots of total YAP.
(A) Quantification of protein expression quantification of two splicing alternatives of YAP (from D0 to D4, relative to Figure 1D) shows that both YAP proteins are downregulated upon neural induction (D1–D3) and then the larger protein (top band) is primarily upregulated following BMP4 stimulation (D4). TRULI treatment does not affect the dynamics of this expression. (B) Quantification of the expression of the longer YAP protein (top band alone) on neuruloids of D4–D7 (Relative to Figure 2B) shows that YAP continues to be upregulated following BMP4 treatment. Quantification was conducted by normalizing the intensity of the YAP signal to that of vinculin, which served as a loading control.
Figure 1—figure supplement 5
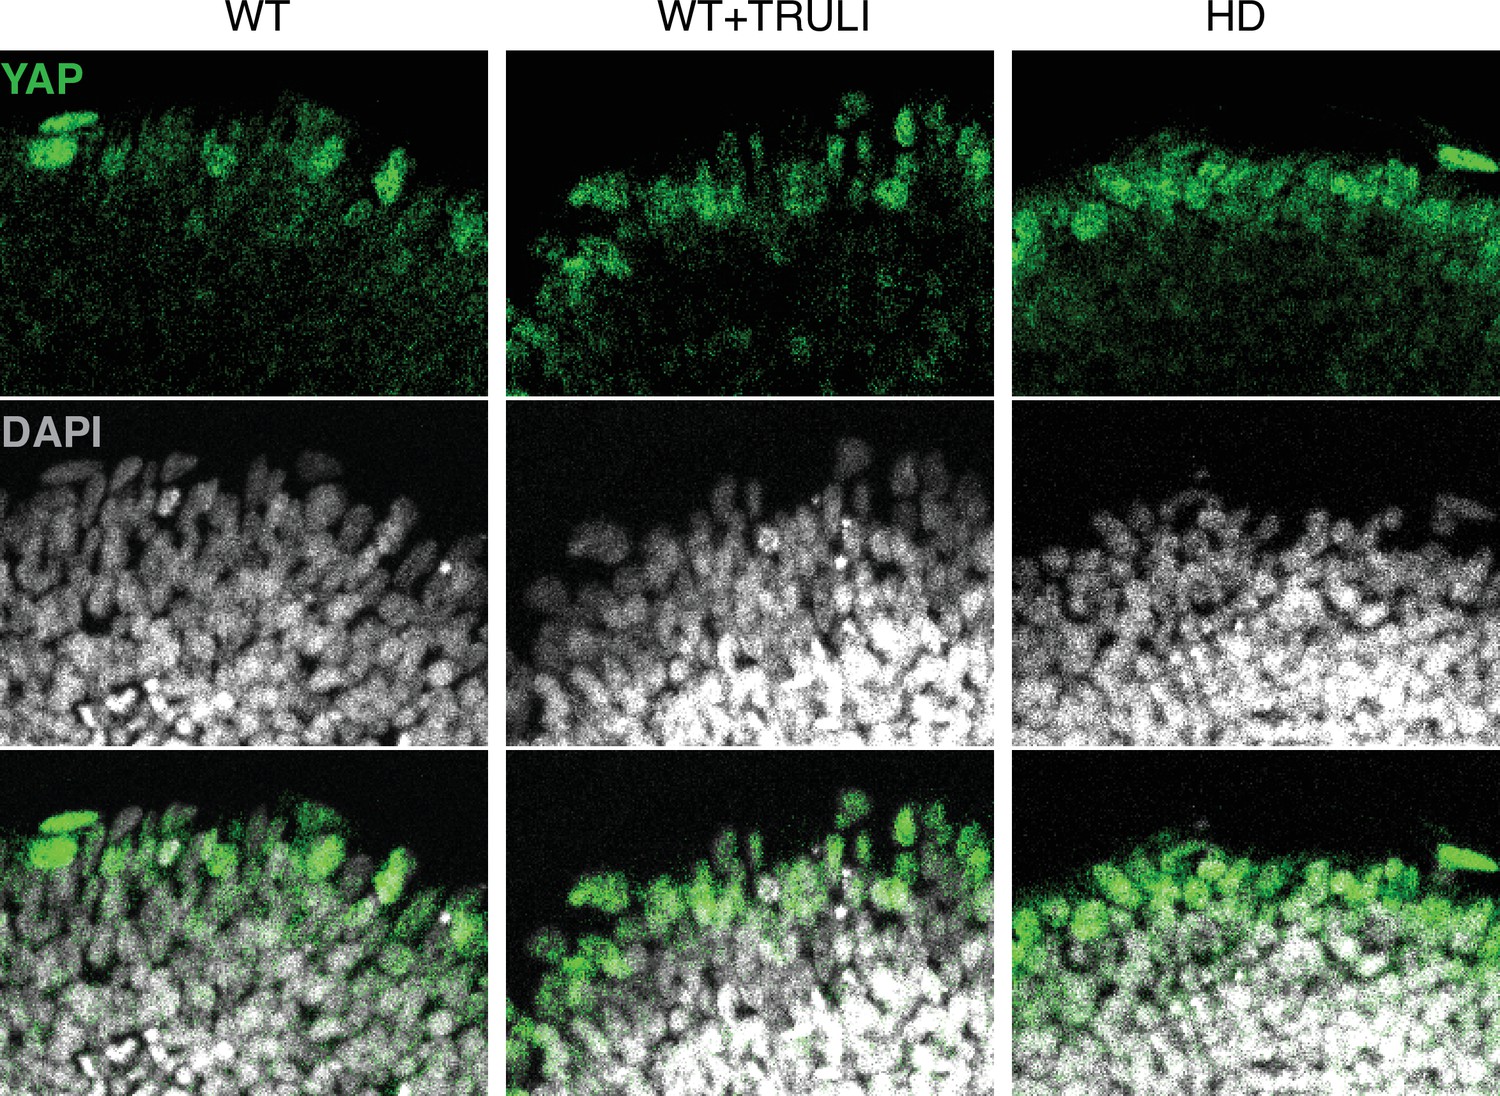
Magnified images of D4 neuruloids labeled for YAP and DAPI.
Confocal microscopy of D4 neuruloids illustrates that YAP occurs at the edge of the colony. YAP can be found sporadically in the nuclei of WT cells and more frequently in WT cells treated with TRULI (WT+TRULI) or in HD samples (HD).
Figure 1—video 1
Live YAP dynamics in D3 WT neuruloid upon BMP4 stimulation.
Live fluorescent images of a quadrant of a D3 WT neuruloid, acquired in a time course during the first 24 hr following BMP4 administration (D4), show that YAP (YAP-GFP, green) is upregulated at the edge of the colony and sporadically accumulates in the nucleolus (H2b-Cherry, red) of some cells.
Figure 1—video 2
Live YAP dynamics in D3 WT neuruloid upon BMP4 stimulation (detail, YAP-GFP and H2b-mCherry).
Live fluorescent images of a portion of a D3 WT neuruloid, acquired in a time course between 18 hr and 24 hr following BMP4 administration (D4), show in more details that YAP (YAP-GFP, green) is upregulated at the edge of the colonies and sporadically accumulates in the nucleolus (H2b-Cherry, red) of some cells. Same portion of colony is shown in Figure 1—video 3.
Figure 1—video 3
Live YAP dynamics in D3 WT neuruloid upon BMP4 stimulation (detail, YAP-GFP).
Live fluorescent images of a portion of a D3 WT neuruloid, acquired in a time course between 18 hr and 24 hr following BMP4 administration (D4), show in more details that YAP (YAP-GFP, green) is upregulated at the edge of the colonies and sporadically accumulates in the nucleolus of some cells. Same portion of colony is shown in Figure 1—video 2.
Figure 1—video 4
Live YAP dynamics in D3 WT neuruloid upon BMP4 stimulation and activation by TRULI.
Live fluorescent images of a quadrant of a D3 WT neuruloid, treated with TRULI, acquired in a time course during the first 24 hr following BMP4 administration (D4) show that YAP (YAP-GFP, green) is upregulated at the edge of the colony and accumulates in the nucleolus (H2b-Cherry, red) of most cells.
Figure 1—video 5
Live YAP dynamics in D3 WT neuruloid upon BMP4 stimulation and activation by TRULI (Detail, YAP-GFP and H2b-mCherry).
Live fluorescent images of a portion of a D3 WT neuruloid, treated with TRULI, acquired in a time course between 18 hr and 24 hr following BMP4 administration (D4) show in more details that YAP (YAP-GFP, green) is upregulated at the edge of the colonies and accumulates in the nucleolus (H2b-Cherry, red) of most cells. Same portion of colony is shown in Figure 1—video 6.
Figure 1—video 6
Live YAP dynamics in D3 WT Neuruloid upon BMP4 stimulation and activation by TRULI (Detail, YAP-GFP).
Live fluorescent images of a portion of a D3 WT neuruloid, treated with TRULI, acquired in a time course between 18 hr and 24 hr following BMP4 administration (D4) show in more details that YAP (YAP-GFP, green) is upregulated at the edge of the colonies and accumulates in the nucleolus of most cells. Same portion of colony is shown in Figure 1—video 5.
Figure 2 with 1 supplement
Dynamics of YAP expression and localization in late neuruloids.
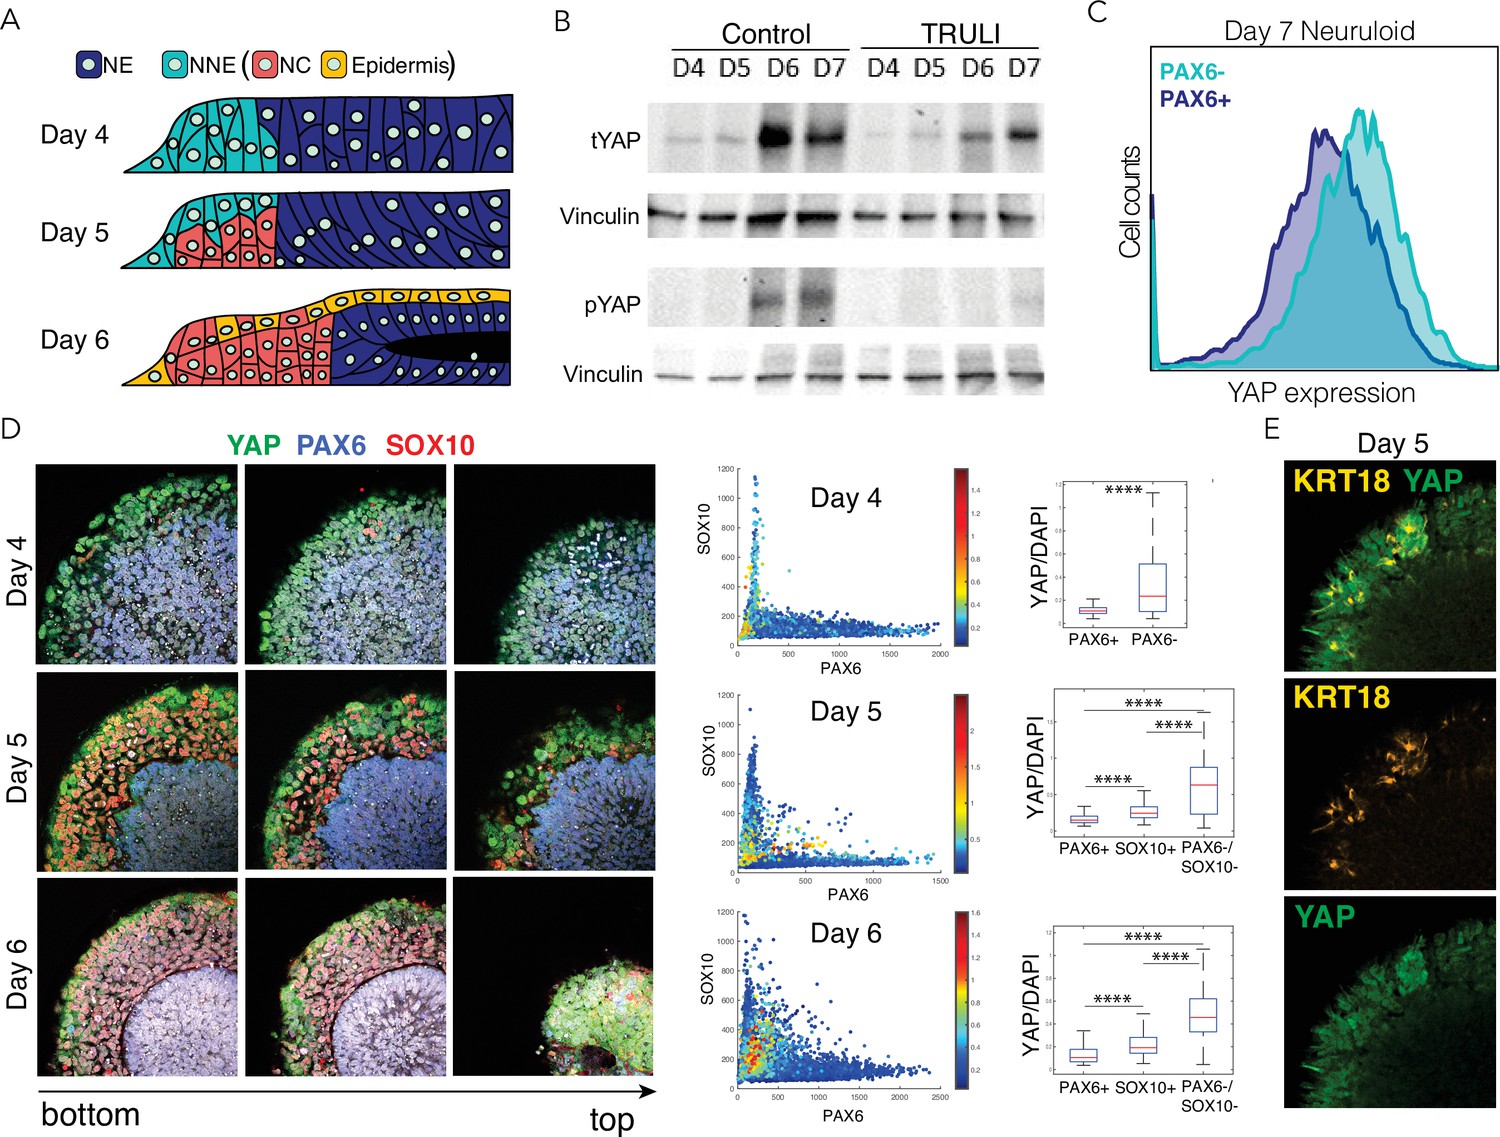
(A) In a schematic side view of the final phase of neuruloid formation, neural ectoderm (NE, dark blue) at the center is surrounded by nonneural ectoderm (NNE, cyan), which subsequently differentiates into neural crest (NC, red) and epidermis (yellow). (B) Immunoblot analysis of neuruloids at D4–D7 demonstrates the suppression of YAP phosphorylated on residue S127 (pYAP) by 10 µM TRULI. The concentration of total YAP protein (tYAP) increases under both conditions. Vinculin provides a loading control. (C) Analysis by fluorescence-activated cell sorting of D7 neuruloids shows less expression of total YAP protein in NE (PAX6+) than in NNE (PAX6−). The difference in YAP expression level between the two lineages was analyzed by both two-way ANOVA and nonparametric t-tests, consistently showing p<0.000001. (D) Immunohistochemistry during the late phase of neuruloid formation, D4–D6, shows the progressive decline in nuclear YAP in NE and NC lineages. For four neuruloid colonies at each time point, the nuclear signals of YAP, PAX6, and SOX10 were determined in individual cells. Scatterplots and box plots of normalized YAP signals quantify the effect. ****, p<0.0001 in unpaired nonparametric t-tests comparing the level of normalized nuclear YAP signal between the different conditions. (E) Immunofluorescence images of one quadrant of a D5 neuruloid demonstrate the presence of KRT18, a label for epidermis, in cells enriched for nuclear YAP.
-
Figure 2—source data 1
Raw images for immunoblot shown in Figure 2B.
- https://cdn.elifesciences.org/articles/73075/elife-73075-fig2-data1-v1.zip
Figure 2—figure supplement 1
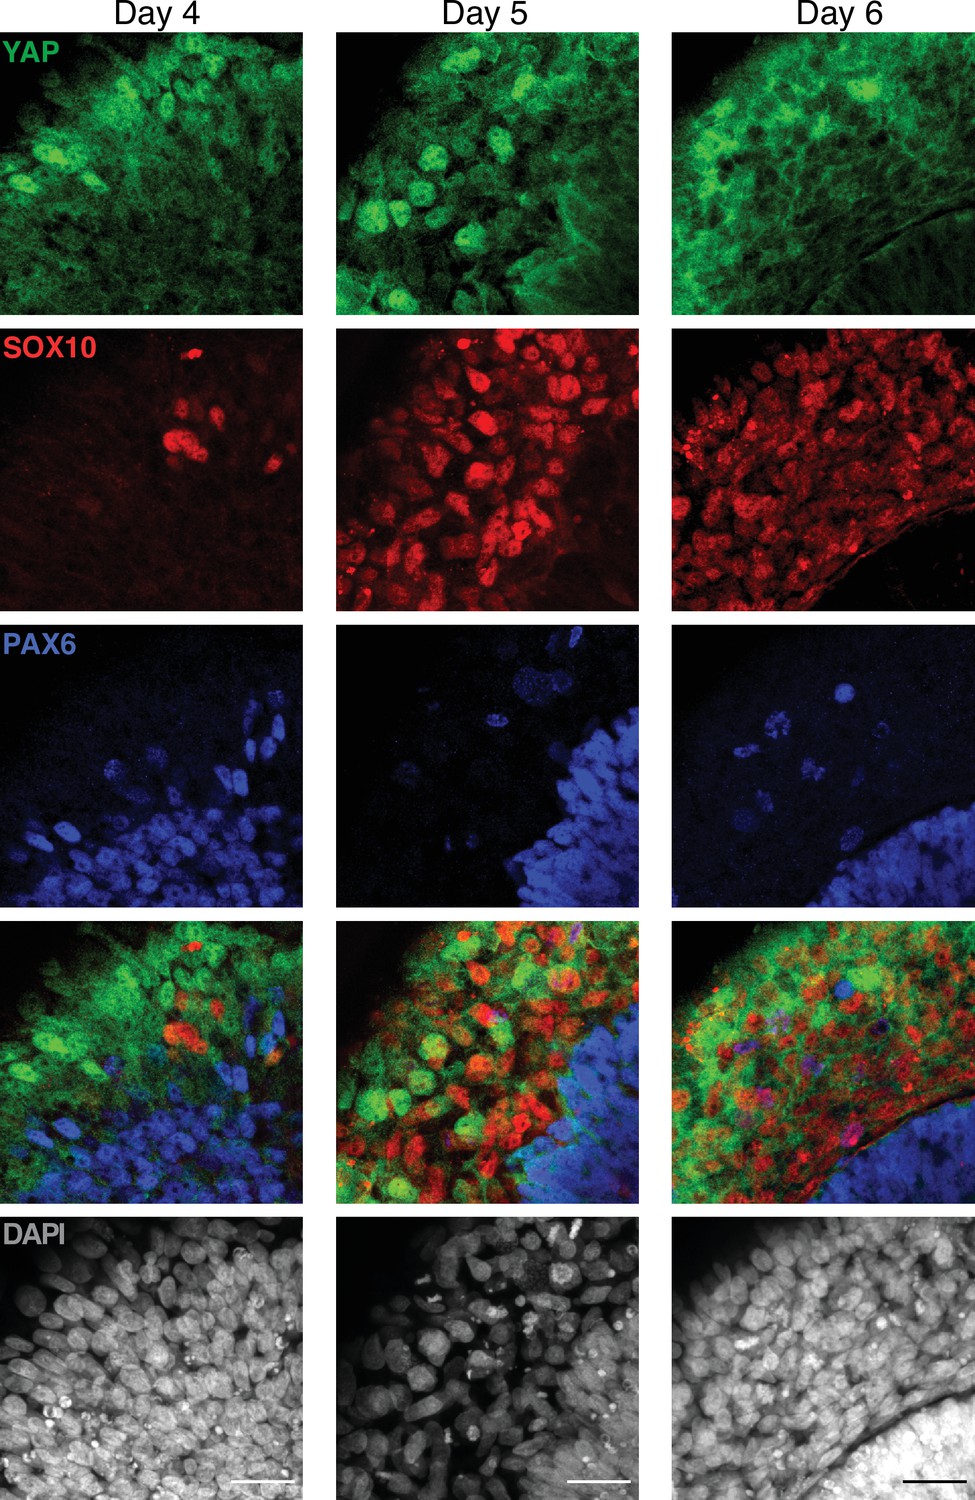
Dynamics of YAP expression and localization in late neuruloids (magnified).
Representative magnified images of the late phase of neuruloid formation, D4–D6, show that YAP is expressed by SOX10+ (red) and PAX6+ (blue) at the different time points, but in these two lineages, YAP remains mostly cytoplasmatic. The scale bar indicates 30 µm.
Figure 3 with 1 supplement

Effect of sustained YAP activation on neural crest and neural epithelium.
Immunofluorescence images of D7 WT neuruloids demonstrate that treatment with 10 µM TRULI enhances the expression of neural ectoderm marked by PAX6 and of epidermis marked by KRT18 at the expense of NC labeled by SOX10. The plots quantify the fractions of the areas of several colonies marked by PAX6 and KRT18 (as normalized to DAPI), as well as the radial distribution of SOX10. ****, p<0.0001 in an unpaired t-test comparing untreated (control, 12 colonies analyzed) and TRULI-treated samples (TRULI, 16 colonies analyzed).
Figure 3—figure supplement 1
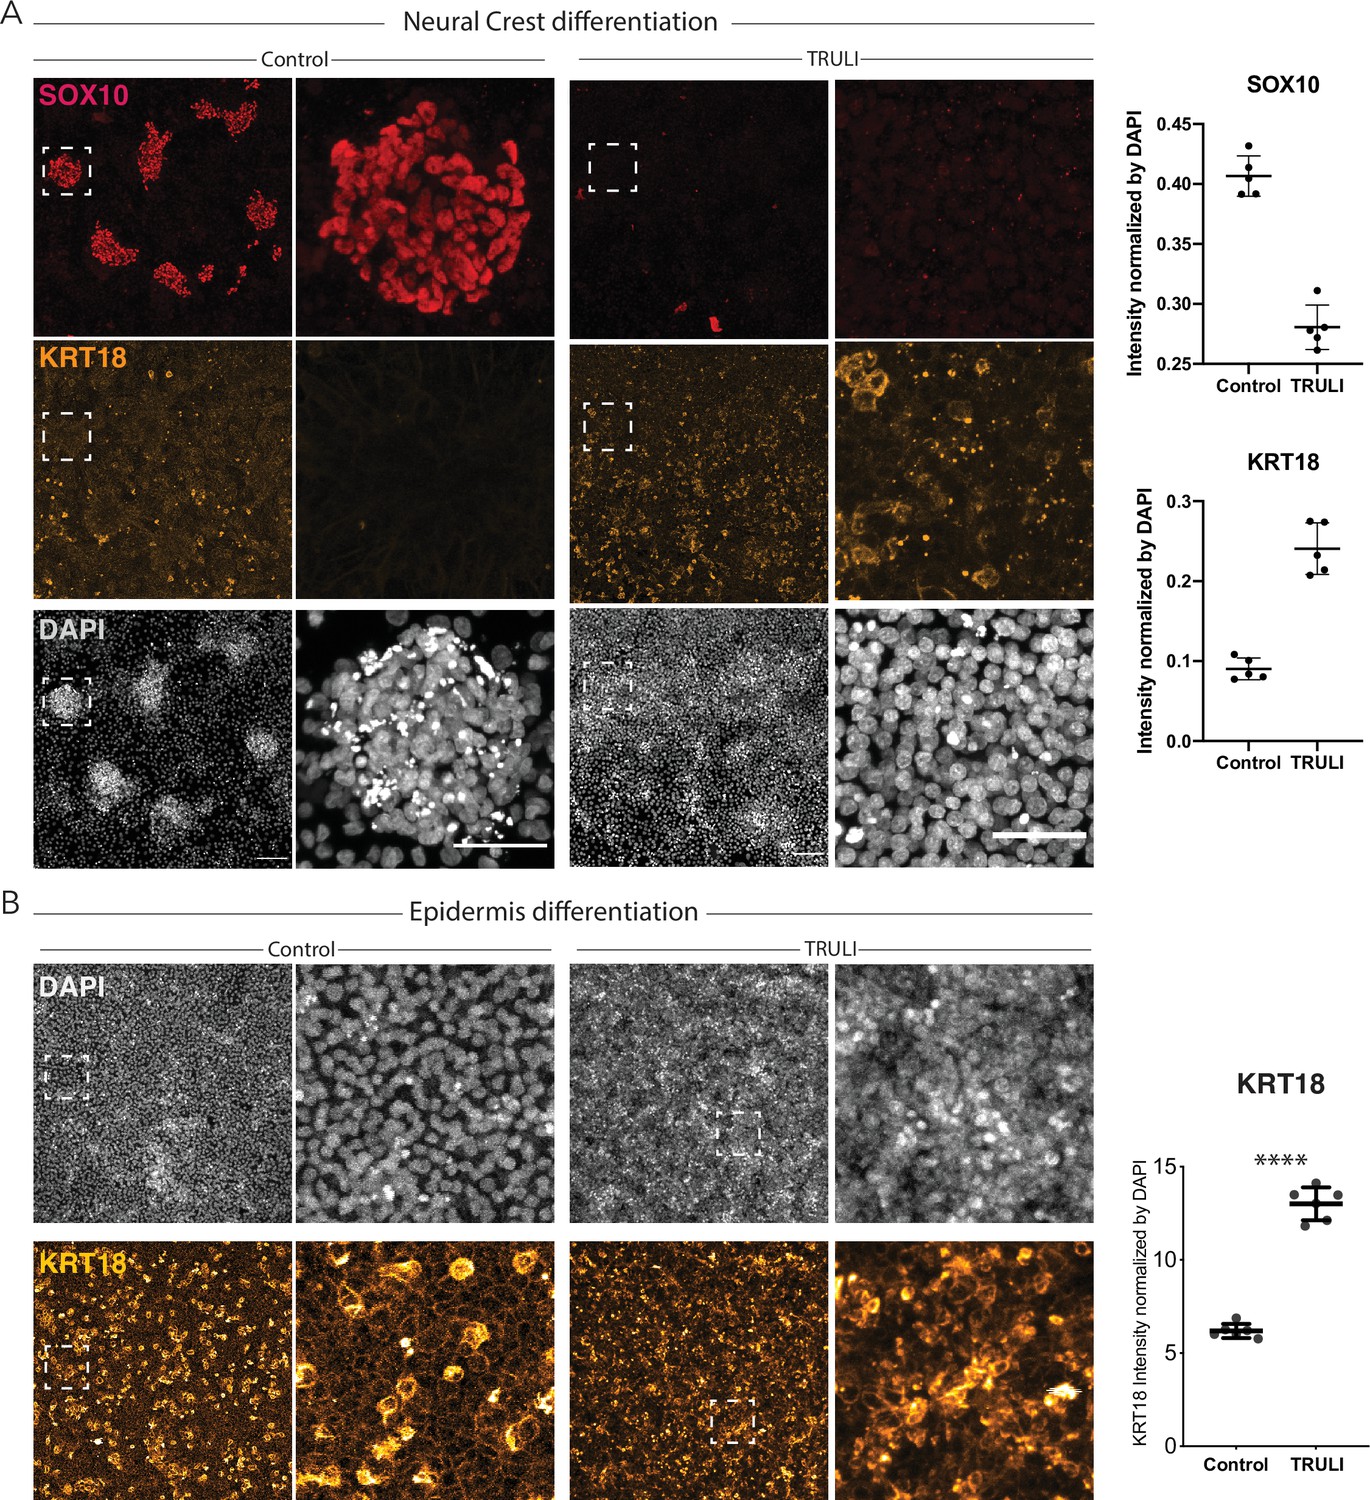
Effect of sustained YAP activation on differentiation of neural crest (NC) and epidermis.
(A) Immunofluorescence images of hESCs after 10 days of a differentiation protocol for NC without (control) or with 10 μM TRULI show that treatment precludes the formation of NC (SOX10, red) and yields significantly more epidermal cells (KRT18, yellow). At the right, plots quantify the effect of TRULI treatment on SOX10 and KRT18 signals, which are normalized to the DAPI signal. (B) Immunofluorescence images of hESCs after 10 days of a differentiation protocol for epidermis without (control) or with 10 μM TRULI reveal that TRULI treatment increases the intensity of KRT18 labeling. At the right, plots quantify the change in the KRT18 signal normalized to the DAPI signal and confirm that YAP activation results in the expression of KRT18. hESC, human embryonic stem cell.
Figure 4 with 6 supplements
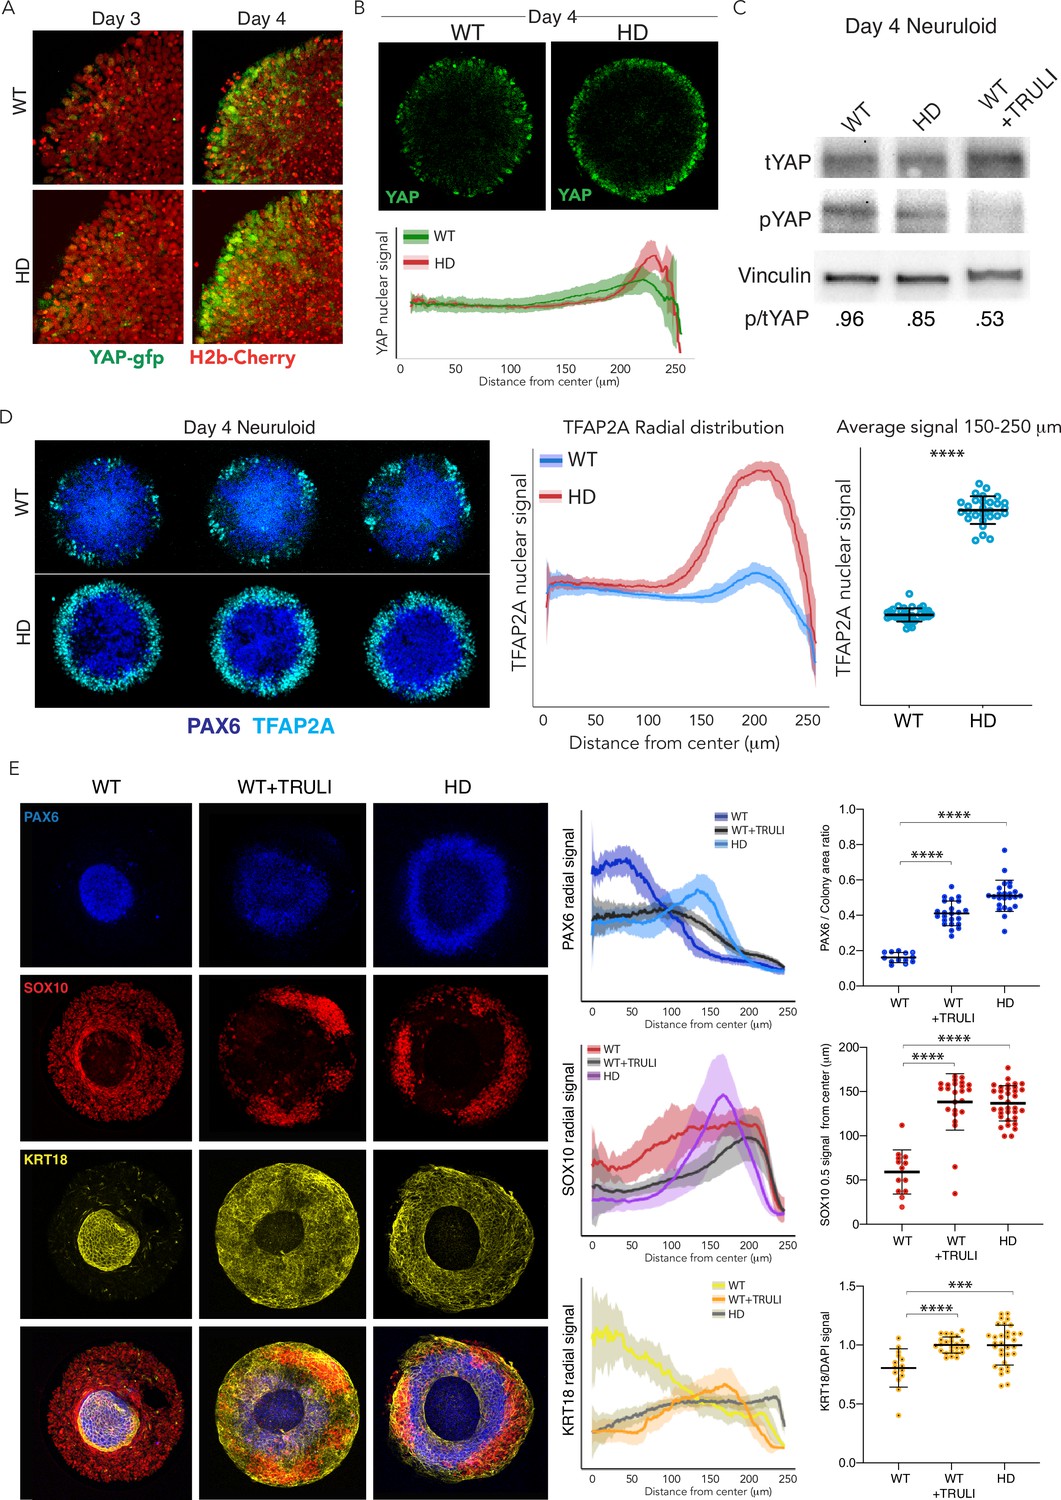
Dysregulation of YAP localization in HD neuruloids.
(A) Fluorescent images of the same portions of living neuruloids before (D3) and 24 hr after BMP4 administration (D4) show increased nuclear YAP in HD than in WT neuruloids. (B) Top, YAP immunofluorescence images of D4 neuruloids confirm the effect. Bottom, the radial distribution of YAP nuclear signals is quantitated for 16 neuruloid colonies for each condition. (C) Immunoblot analysis of WT and HD neuruloids at D4 shows reduction of YAP phosphorylated on residue S127 (pYAP) in HD colonies, similar to that after TRULI treatment of WT colonies. Vinculin provides a loading control. (D) Left, Immunofluorescence images of D4 neuruloids demonstrate enhanced TFAP2A at the perimeters of HD colonies. Right, quantitative analysis of nuclear TFAP2A signals confirms the effect. ****, p<0.0001 in unpaired t-tests comparing WT (n=36) and HD (n=28) colonies. (E) WT neuruloids (n=13), WT neuruloids treated with 10 µM TRULI (n=23), and HD neuruloids (n=24). Left, representative immunofluorescence images of D7 neuruloids demonstrate the similar phenotypes of TRULI treatment and HD: expansion of NE (PAX6), the diminishment of NC (SOX10), and the enhancement of epidermis (KRT18). Right, quantitative analysis of the three experimental conditions showing radial distributions of the lineage markers PAX6, SOX10, and KRT18 in several colonies. For each colony, plots show the area of the PAX6+ central region as a fraction of the entire colony and the radial distance from the colony’s center to the half-maximal intensity of the SOX10 domain. Plots of the KRT18 signal normalized by DAPI labeling confirm the result. ****, p<0.0001 in unpaired t-tests comparing the three experimental conditions. HD, Huntington’s Disease.
-
Figure 4—source data 1
Raw images for immunoblot shown in Figure 4C.
- https://cdn.elifesciences.org/articles/73075/elife-73075-fig4-data1-v1.zip
Figure 4—figure supplement 1
Dynamics of YAP localization in early WT and HD neuruloids.
(A) During the first 4 days of the differentiation protocol, pluripotent hESCs seeded on a micropattern undergo 3 days of neural induction (SB +LDN) followed by BMP4 induction of neurulation. (B) Fluorescent images of living YAP-GFP and H2b-Cherry hESC colonies during neural induction show the progressive shift of YAP from nuclei into cytoplasm and a reduction in expression for both WT and HD samples. HD, Huntington’s Disease; hESC, human embryonic stem cell.
Figure 4—figure supplement 2
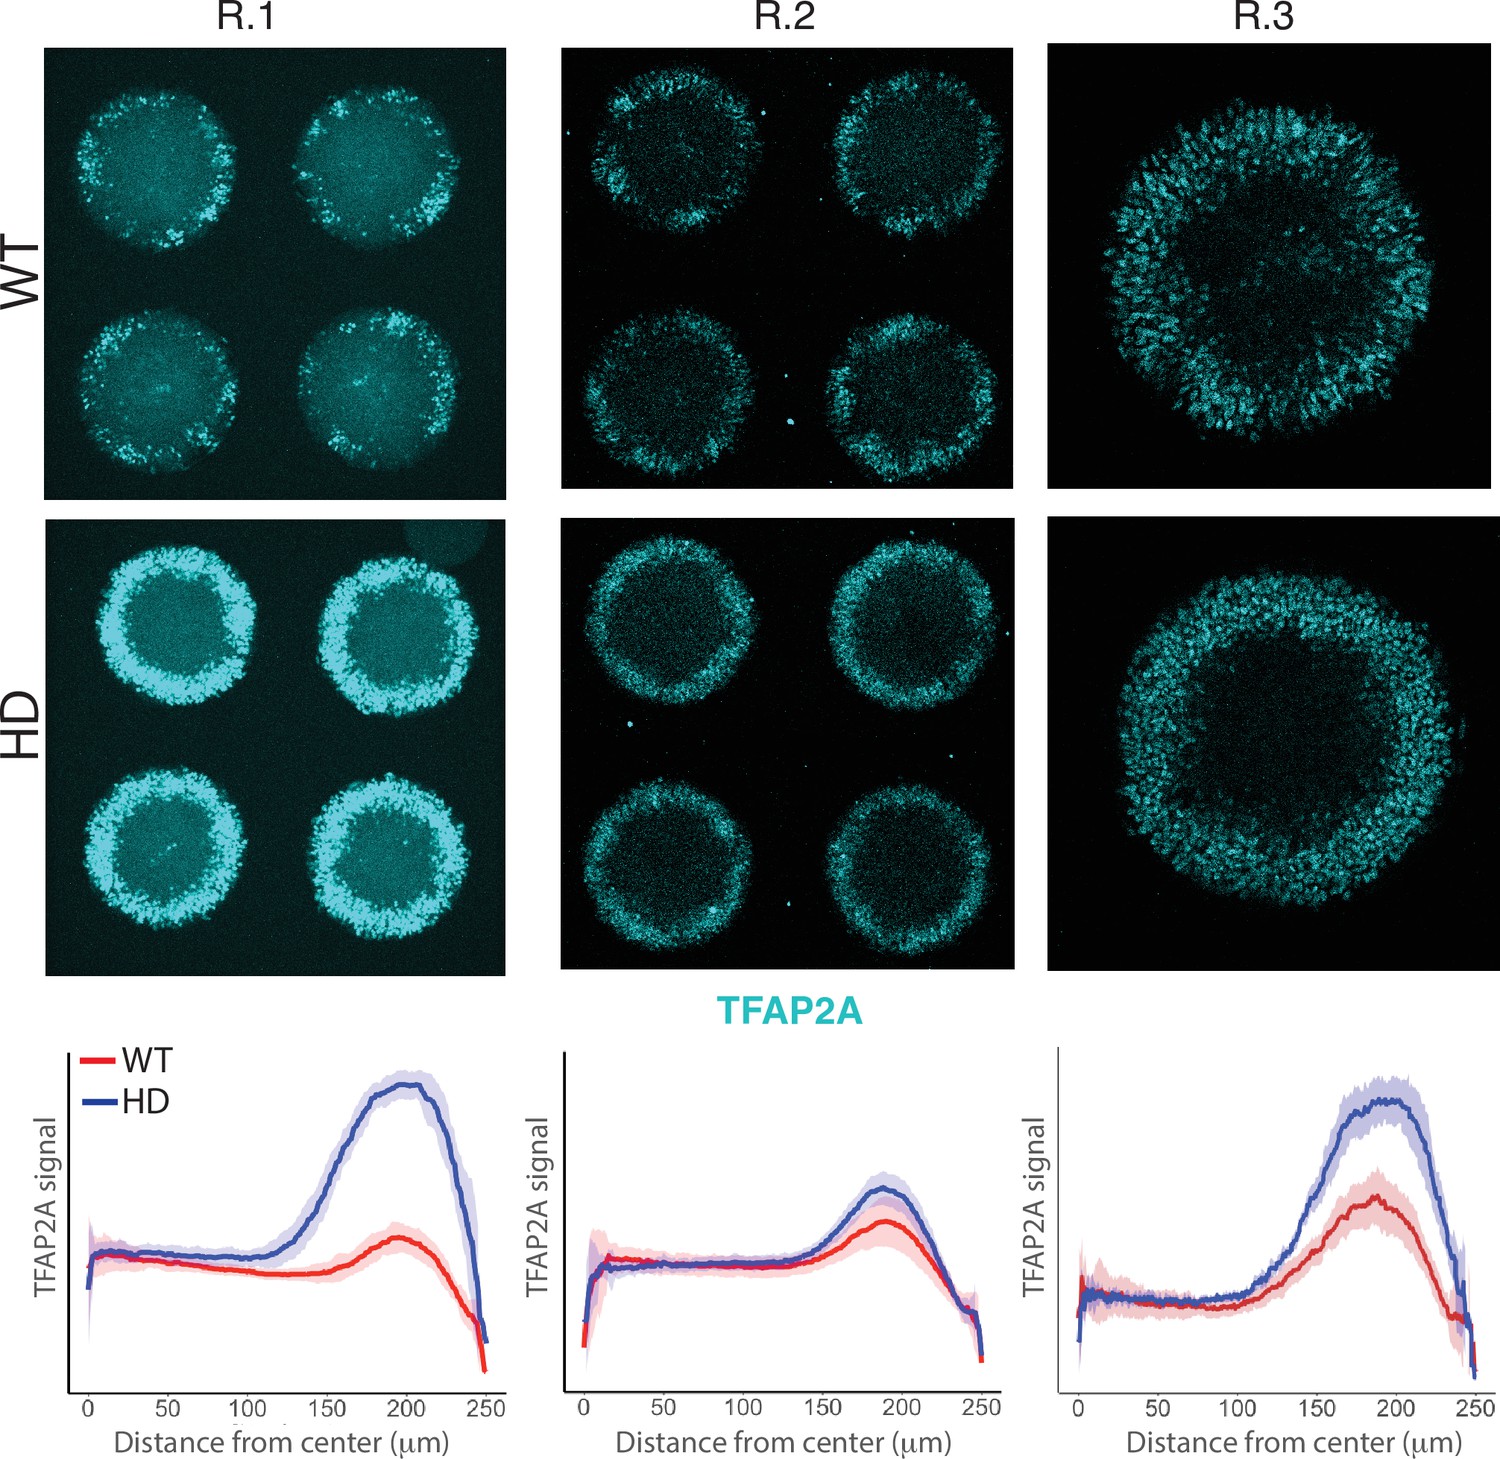
Induction of NNE in WT and HD D4 neuruloids.
Immunofluorescence images of D4 neuruloids demonstrate enhanced expression of TFAP2A at the perimeters of HD colonies in three independent experiments. At the bottom, the radial distribution of the nuclear TFAP2A signal confirms this observation in multiple colonies (R.1, colonies n=16; R.2, n=9; R.3, n=12). HD, Huntington’s Disease; NNE, nonneuronal ectoderm.
Figure 4—figure supplement 3
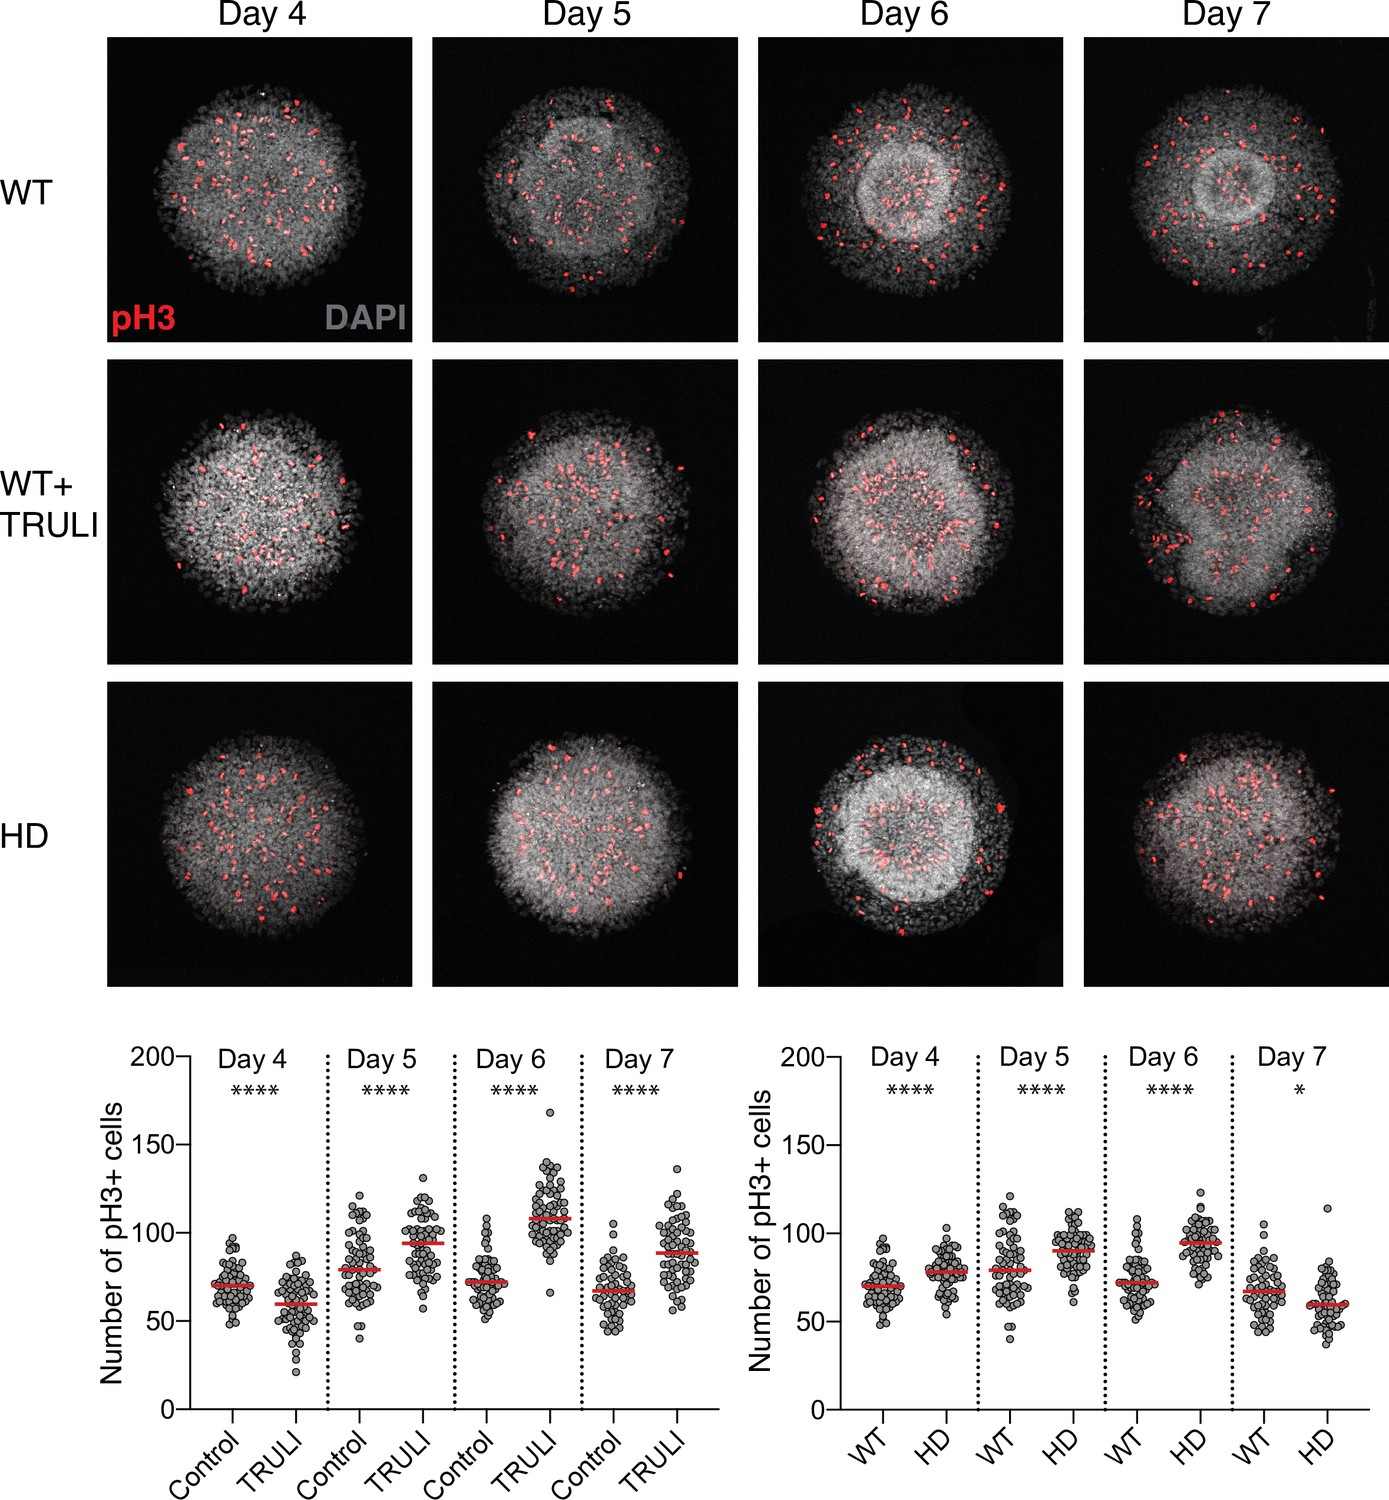
Effect of YAP activation and HD mutation of rate of cell division in neuruloids.
Confocal images of D4–D7 neuruloids, labeled for phospho-histone H3 (pH3) to identify mitotic nuclei, show that YAP activation by TRULI or HD mutation induces an increase in the rate of cell division. The plots show counts of pH3-positive nuclei—mitotic cells—per colony at each time. ****, p<0.0001 and *, p=0.0110 in unpaired nonparametric t-tests comparing WT untreated colonies with those and treated with TRULI, and WT colonies with HD colonies. For each experimental condition, we analyzed 55–72 colonies. HD, Huntington’s Disease.
Figure 4—video 1
Live YAP dynamics in D3 HD neuruloid upon BMP4 stimulation.
Live fluorescent images of a quadrant of a D3 HD neuruloid, acquired in a time course during the first 24 hr following BMP4 administration (D4), show that YAP (YAP-GFP, green) is upregulated at the edge of the colony and accumulates in the nucleolus (H2b-Cherry, red) of some cells. HD, Huntington’s Disease.
Figure 4—video 2
Live YAP dynamics in D3 HD neuruloid upon BMP4 stimulation (Detail, YAP-GFP and H2b-mCherry).
Live fluorescent images of a portion of a D3 HD neuruloid, acquired in a time course between 18 hr and 24 hr following BMP4 administration (D4), show in more details that YAP (YAP-GFP, green) is upregulated at the edge of the colonies and accumulates in the nucleolus (H2b-Cherry, red) of several cells. Same portion of colony is shown in Figure 4—video 3. HD, Huntington’s Disease.
Figure 4—video 3
Live YAP dynamics in D3 HD neuruloid upon BMP4 stimulation (Detail, YAP-GFP).
Live fluorescent images of a portion of a D3 HD neuruloid, acquired in a time course between 18 hr and 24 hr following BMP4 administration (D4), show in more details that YAP (YAP-GFP, green) is upregulated at the edge of the colonies and accumulates in the nucleolus of several cells. Same portion of colony is shown in Figure 4—video 2. HD, Huntington’s Disease.
Figure 5 with 7 supplements

Expression of YAP target genes in WT and HD neuruloids.
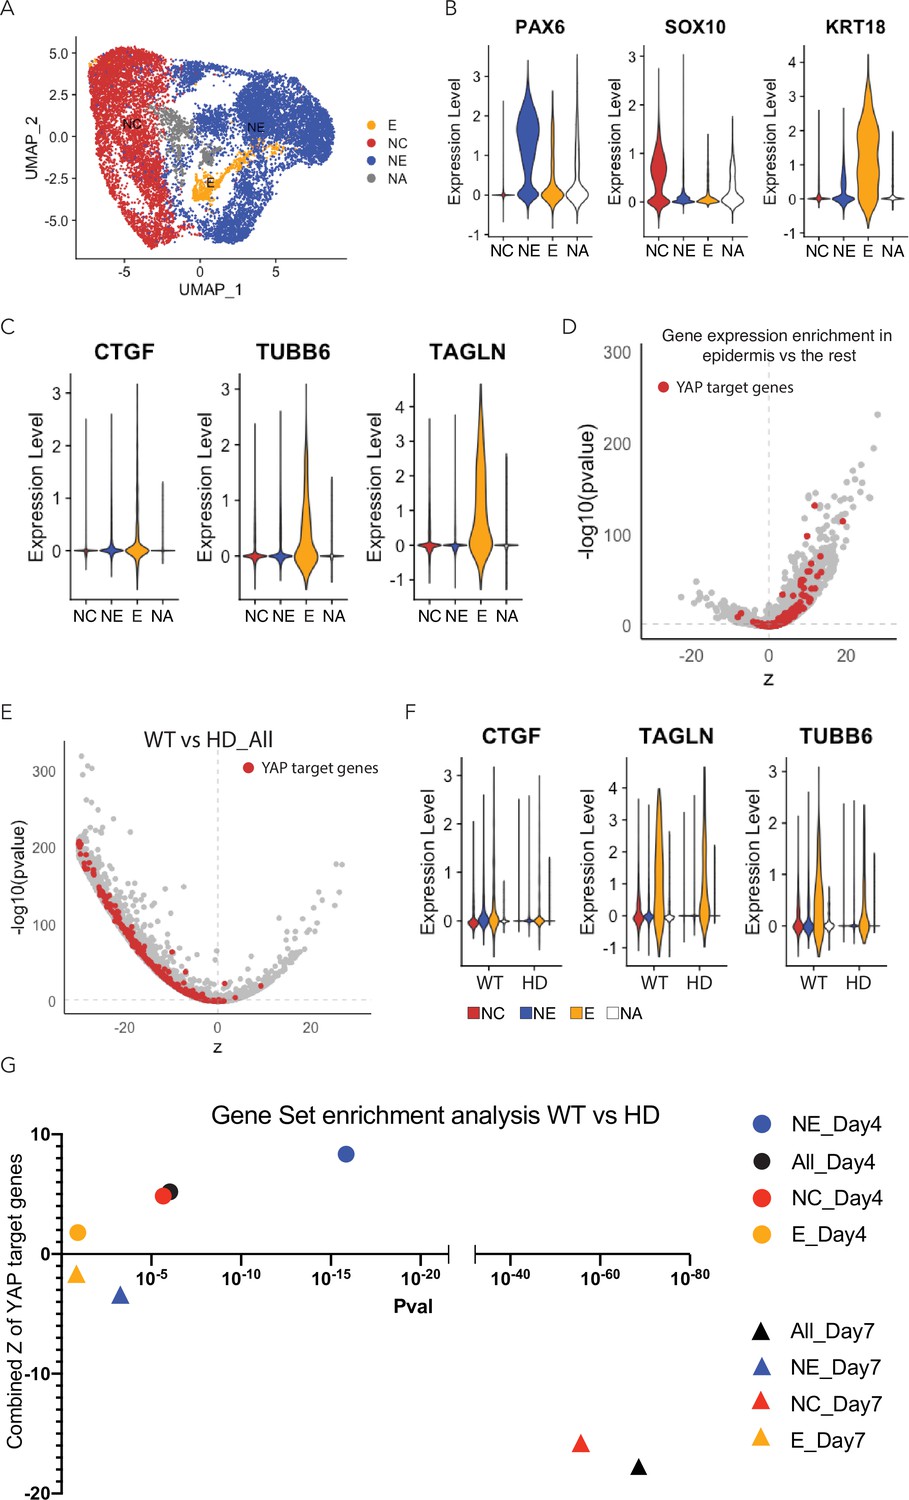
(A) Violin plots show the expression of YAP and three representative target genes in the three clusters representing the main ectodermal lineages from scRNA-seq analysis of D4 neuruloids. Expression levels are normalized counts, calculated by Seurat for each gene and plotted on a logarithmic scale. (B) A volcano plot shows the greater expression of several YAP target genes in epidermis compared to the remainder of the neuruloid. (C) An analysis of differential gene expression from scRNA-seq data shows upregulation of YAP target genes (red) in HD with respect to WT neuruloids. (D) Violin plots show the expression of three representative YAP target genes in the three lineage clusters from D4 WT and HD neuruloids. The color code is: neural crest (NC), red; neural ectoderm (NE), blue; epidermis (E), yellow; and unidentified (NA), white. The augmented expression of YAP target genes is more pronounced in the nonepidermal lineages. (E) Gene-set enrichment analysis of YAP target genes confirms the effect. (F) Analysis by uniform manifold approximation and projection (UMAP) shows the ectopic enhancement of a representative YAP target, TUBB6, in D4 WT and HD neuruloids. Full statistics are provided in Figure 5—figure supplement 5. HD, Huntington’s Disease.
Figure 5—figure supplement 1
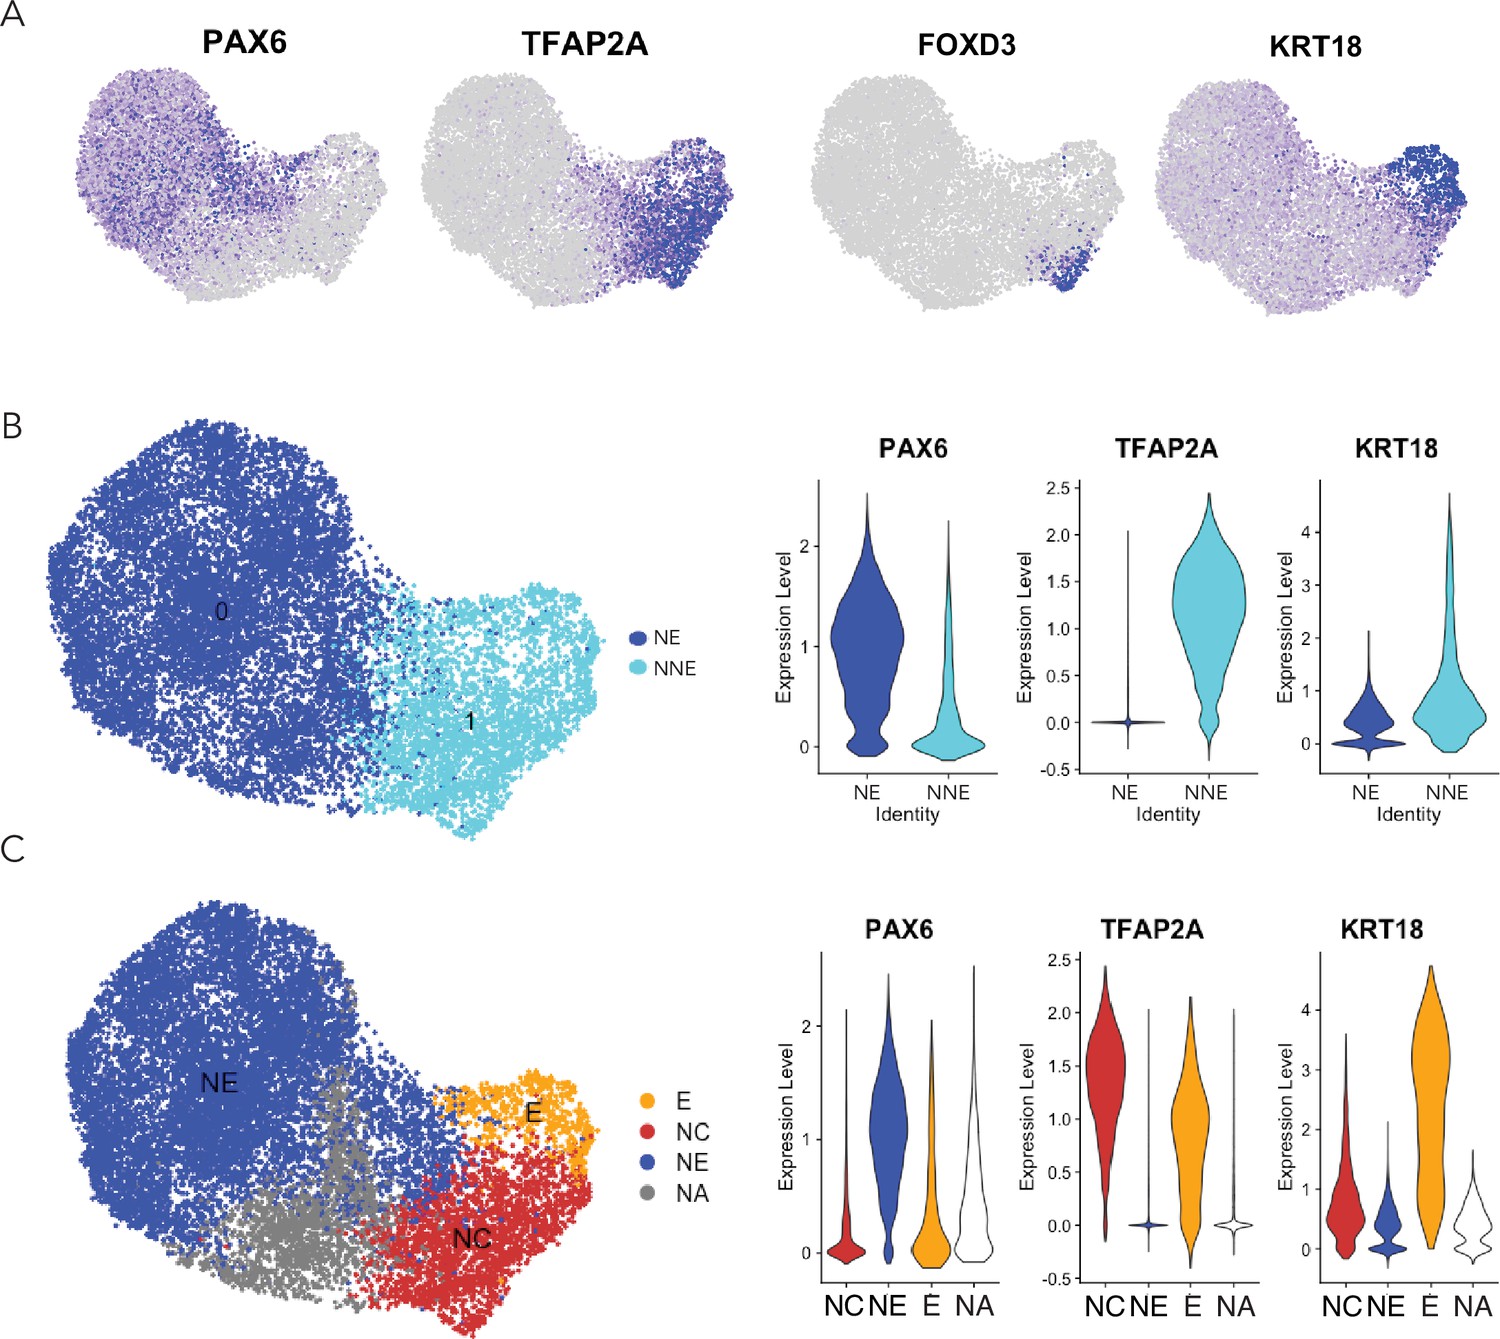
Ectodermal lineage annotation in scRNA-seq from D4 neuruloids.
(A) Uniform manifold approximation and projection (UMAP) shows the expression of key ectodermal lineage makers: PAX6 identifies neural ectoderm (NE) and TFAP2A delineates nonneural ectoderm (NNE). Within the NNE, FOXD3 identifies progenitors of neural crest (NC) and KRT18 marks early epidermis (E).(B) On the left, a plot documents the separation of NE and NNE in UMAP. At the right, violin plots show the expression of lineage genes in the NE and NNE. (C) On the left, a plot demonstrates the separation of the three ectodermal lineages in UMAP. NA represents the population of unidentified cells. At the right, violin plots show the expression of lineage genes in the three populations.
Figure 5—figure supplement 2
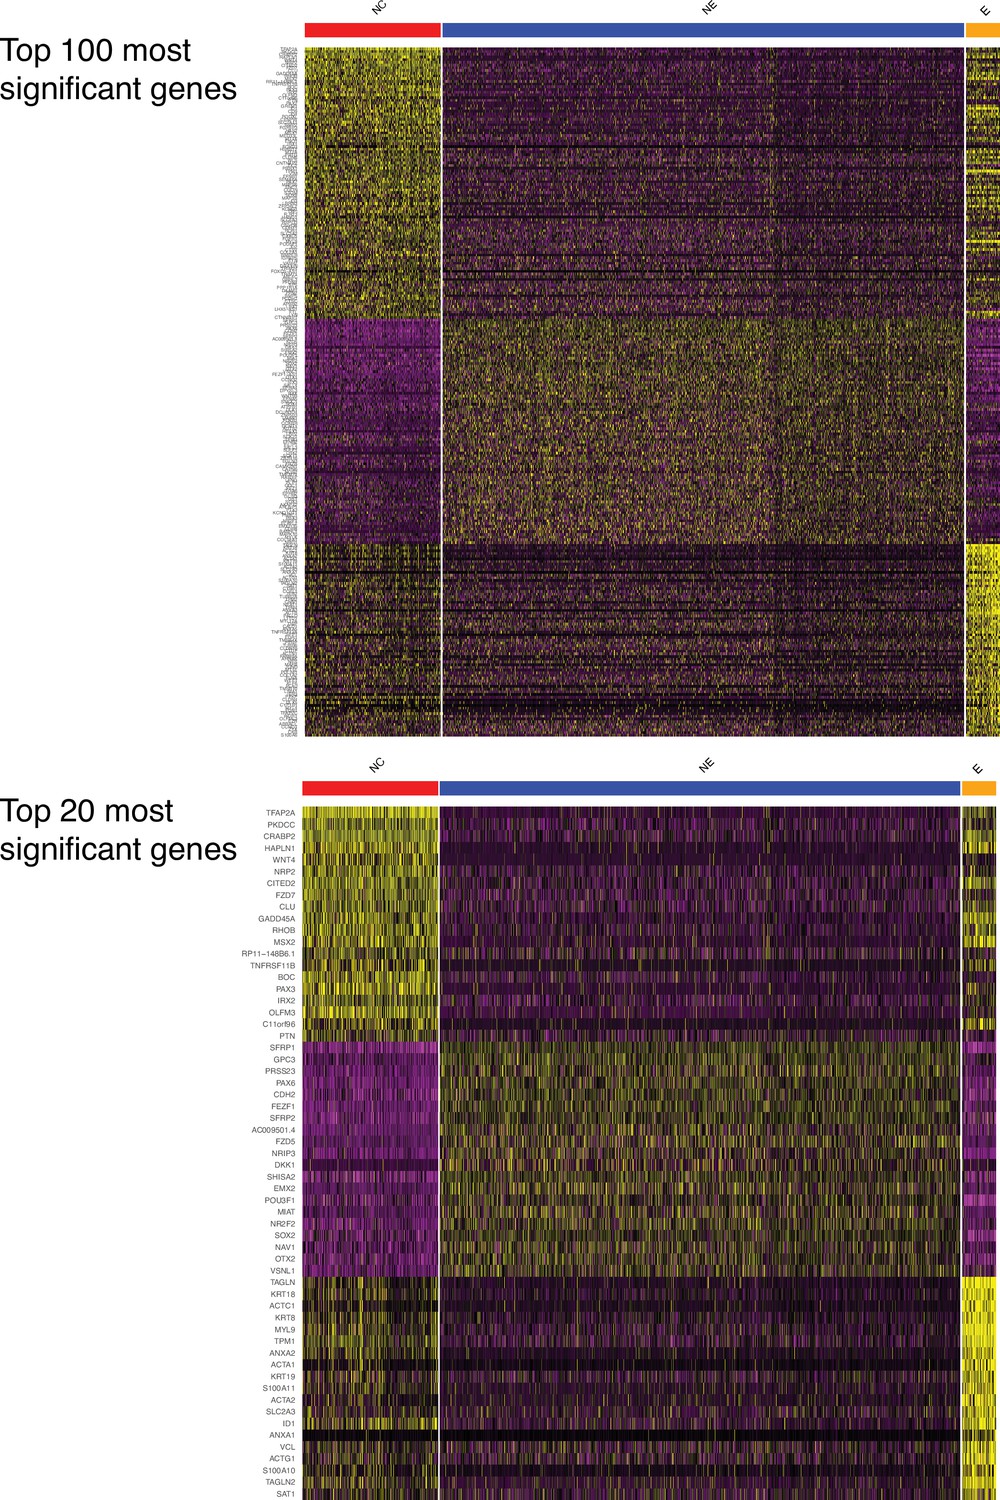
Marker genes for the three main human ectodermal lineages.
(Top) A heatmap displays the 100 genes that are most significantly expressed differentially between the three lineages. (Bottom) An enlargement displays the 20 genes that are most significantly expressed differentially between the three lineages.
Figure 5—figure supplement 3
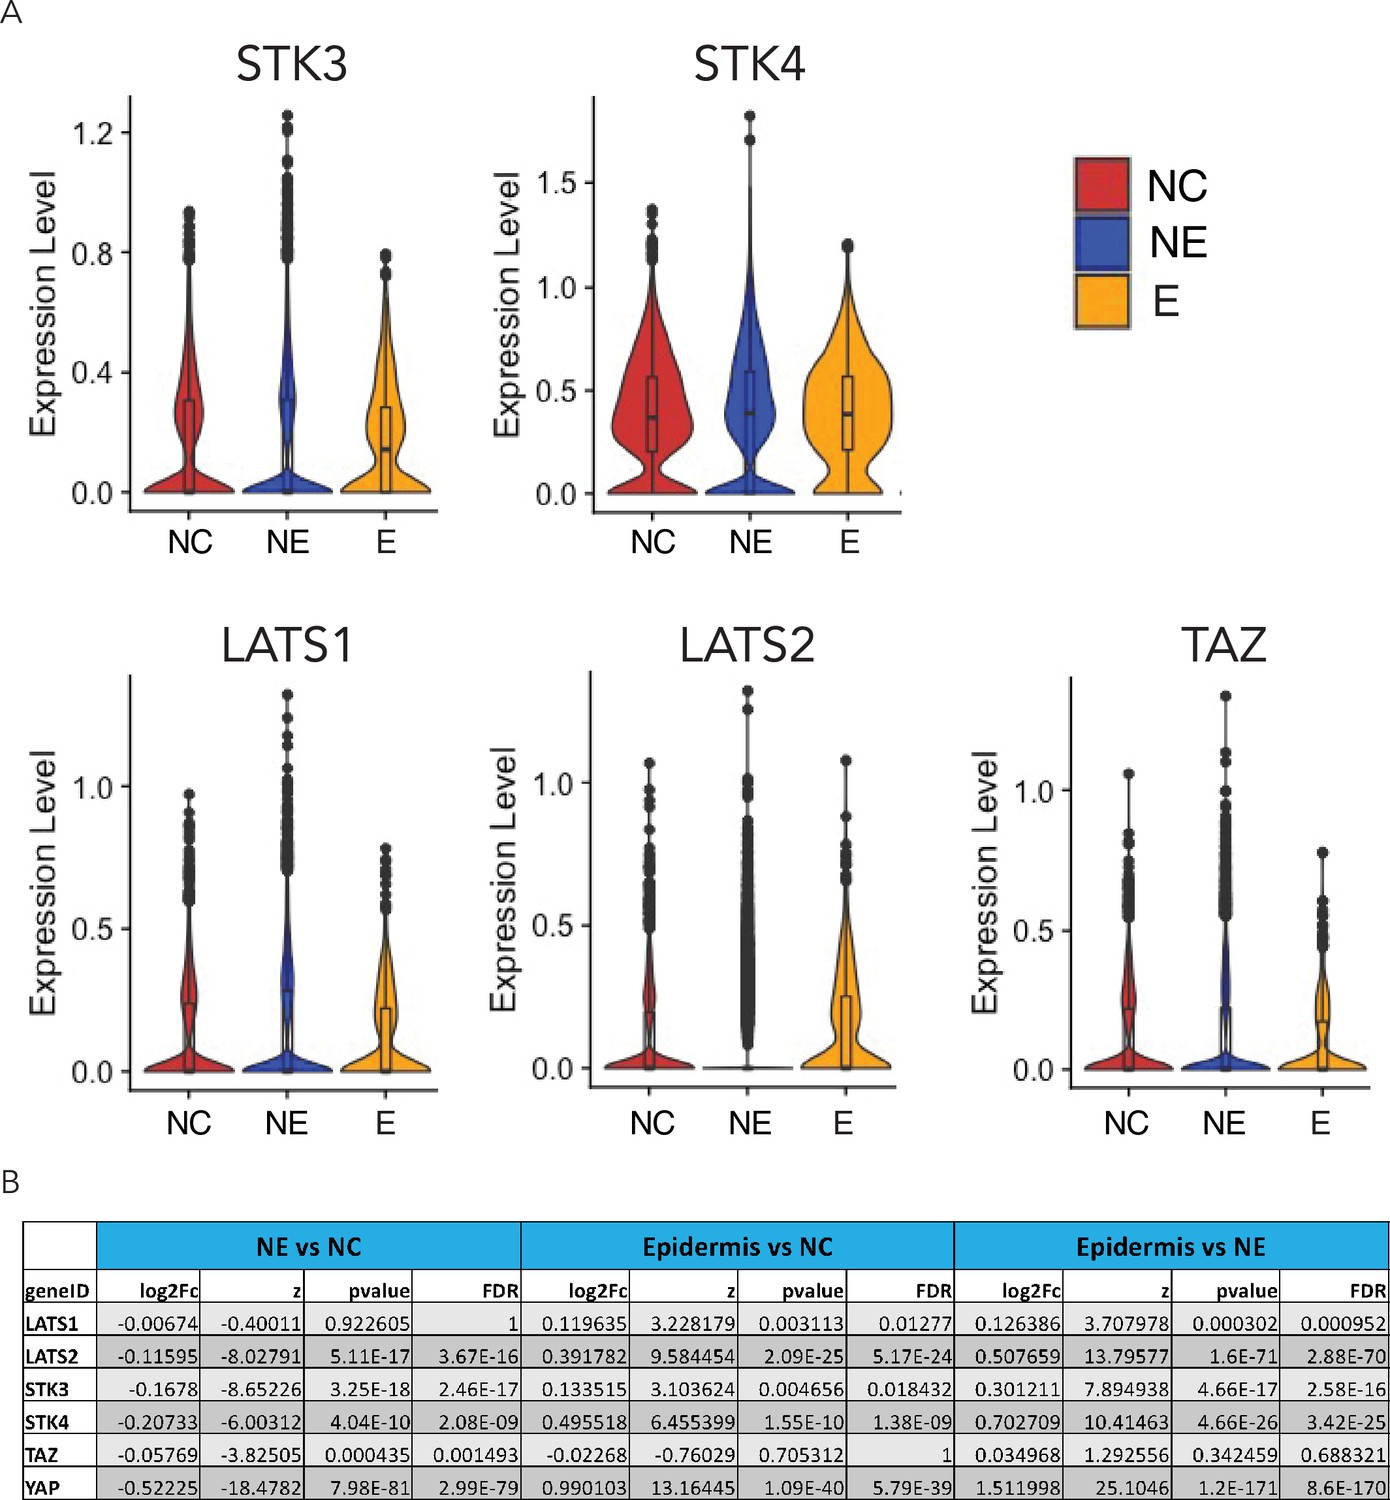
Expression of key components of the Hippo pathway in D4 neuruloids.
(A) Violin plots document the expression of components of the Hippo pathway in the three ectodermal lineages. (B) A table summarizes the statistics for the pairwise differential-expression analysis of components of the Hippo pathway. YAP and key Hippo-pathway components can be found in all three lineages, but are more strongly expressed in NC and epidermis. NC, neural crest.
Figure 5—figure supplement 4
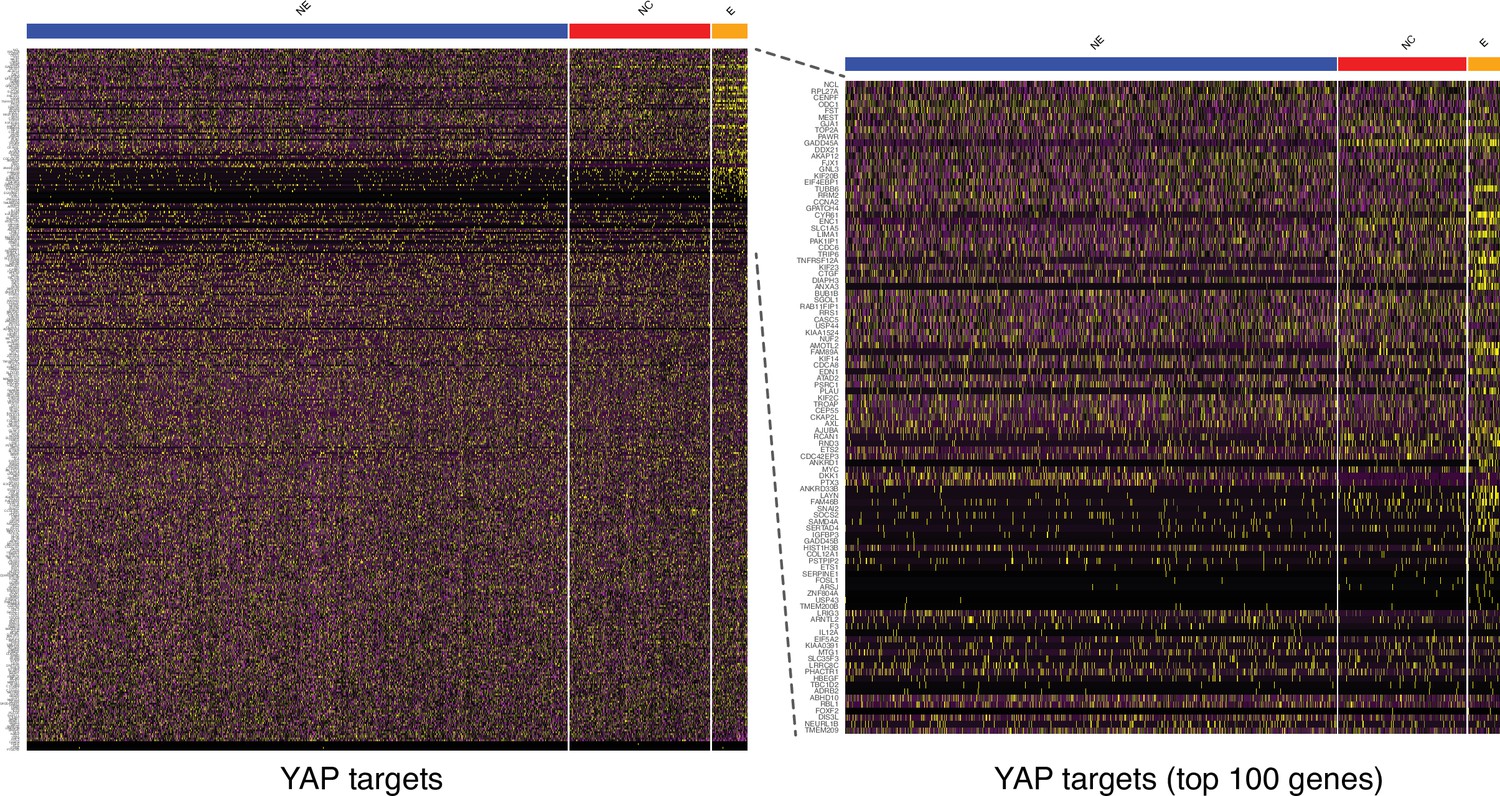
Expression of YAP targets in the three human ectodermal lineages at D4.
(Left) A heatmap displays the expression of a large set of genes that are direct targets of YAP (Zanconato et al., 2015). (Right) The 100 genes most differentially expressed in epidermis show that YAP is active predominantly within precursors of the epidermal lineage, followed by neural crest (NC) and finally neural ectoderm (NE).
Figure 5—figure supplement 5
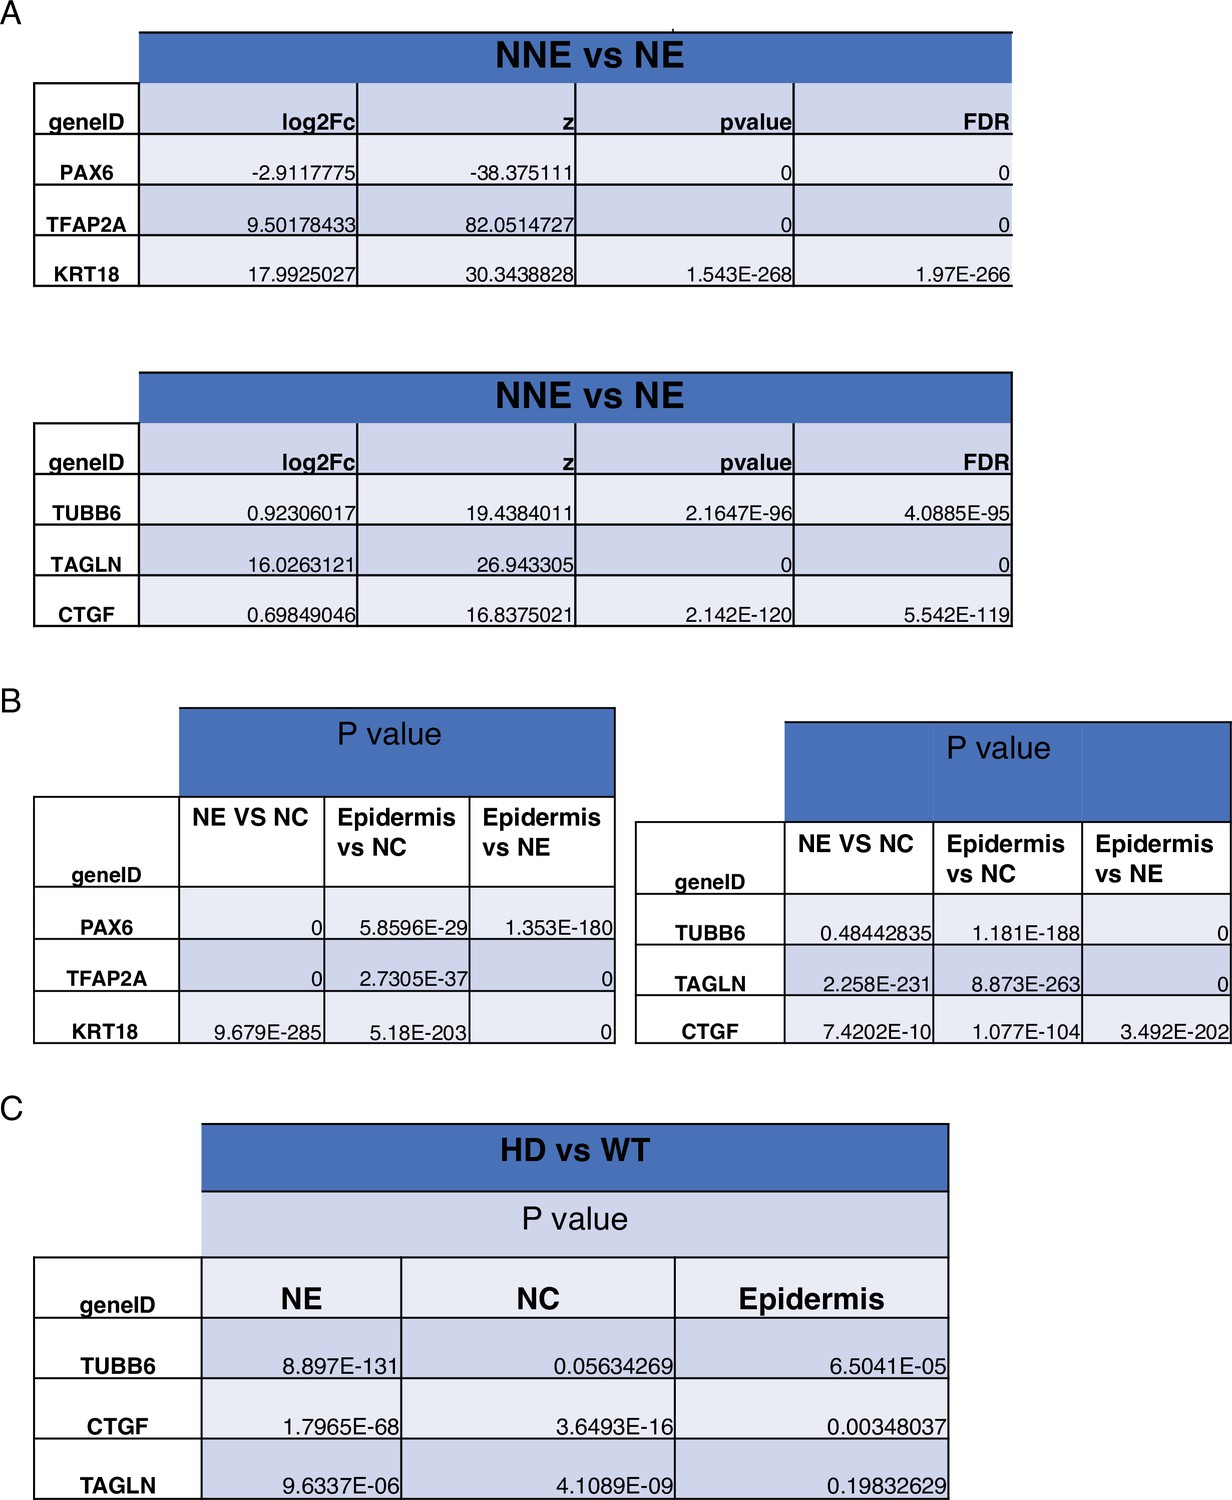
Statistical analysis of D4 neuruloids.
Figure 5—figure supplement 6
Expression of YAP target genes in D7 WT and HD neuruloids.
(A) Uniform manifold approximation and projection (UMAP) shows the distribution of the three major ectodermal lineages in D7 neuruloid: neural ectoderm (NE, blue), neural crest (NC, red), and epidermis (E, yellow). NA (gray) labels a cell population that was not identified. (B) Violin plots quantify the expression of key ectodermal lineage makers: PAX6 identifies neural ectoderm (NE), SOX10 identifies NC, and KRT18 identifies epidermis (E).(C) Violin plots quantify the expression of three representative YAP target genes in the three main ectodermal lineages from scRNA-seq analysis of D7 neuruloids. (D) An analysis of differential gene expression from scRNA-seq data confirms the greater expression of several YAP target genes (red) in epidermis compared to the remainder of the D7 neuruloid. (E) An analysis of differential gene expression from scRNA-seq data for whole D7 neuruloids shows downregulation of YAP target genes (red) in HD neuruloids with respect to that in WT neuruloids. (F) Violin plots show the expression of three representative YAP target genes in the three lineage clusters from D7 WT and HD neuruloids: NC (red), NE (blue), epidermis (E, yellow), and unidentified (NA, white). (G) Gene-set enrichment analysis of YAP target genes reveals reduced YAP activity in D7 HD neuruloids in NE and NC, but not in epidermis. An opposite pattern pertains in less mature D4 neuruloids. The relevant statistics appear in Figure 5—figure supplement 7. HD, Huntington’s Disease.
Figure 5—figure supplement 7
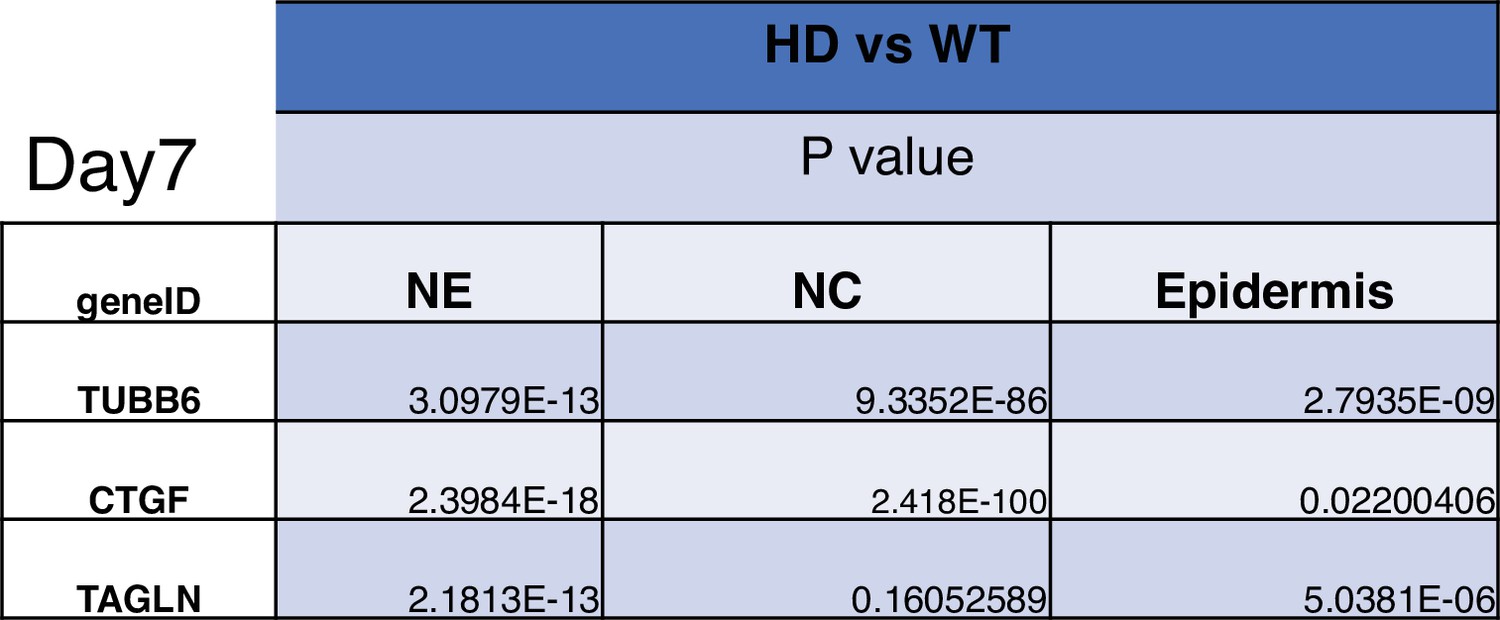
Statistical analysis of D7 neuruloids.
The statistics refer to the violin plots of Figure 5—figure supplement 6.
Figure 6 with 1 supplement
Perturbation of YAP activity in WT and HD neuruloids.
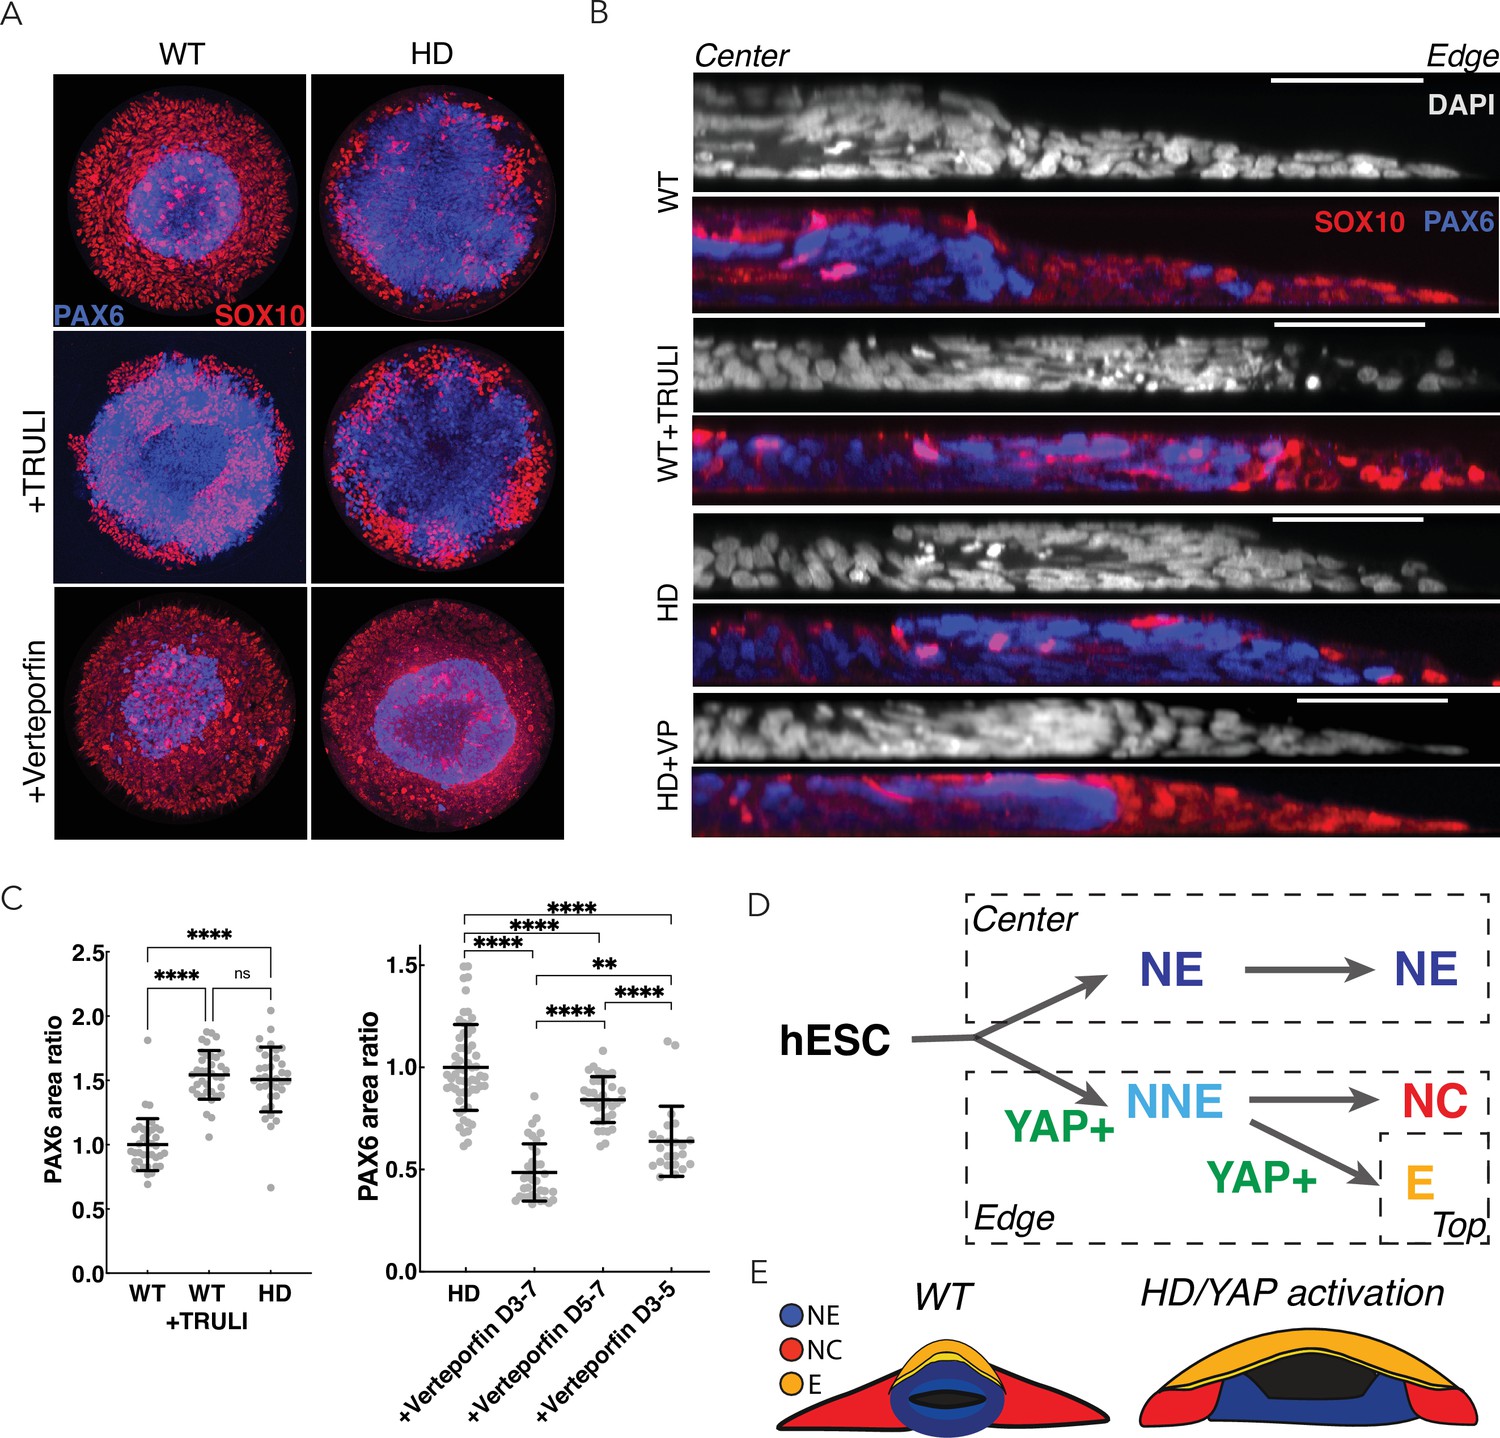
(A) Immunofluorescence images of D7 neuruloids show that the expansion of NE (PAX6, blue) at the expense of NC (SOX10, red) after exposure to 10 µM TRULI or in HD cells. Treatment with 0.3 µM verteporfin has no effect on WT colonies but partially rescues the effect of HD. (B) Side views portray neuruloids under the conditions used in (A). (C) The ratios of PAX6+ areas to control values under various conditions confirm the similarity of TRULI-treated WT neuruloids to HD neuruloids and the suppressive effect of verteporfin (WT colonies, n=36; WT+TRULI, n=36; HD, n=35). Rescue of this HD phenotype is stronger for early than for late exposure to verteporfin (HD, n=60, HD+VP D3–D7, n=35; HD+VP D5–D7, n=36; HD+VP D3–D5, n=25). ****, p<0.0001; ns, p>0.05 in unpaired t-tests comparing the different experimental conditions. (D) In a model of neurulation, YAP activity (green) is posited to favor nonneuronal fates, and hyperactivity (red)—either from TRULI treatment or HD—yields characteristic abnormalities. (E) A diagram illustrates the structure of a mature neuruloid and the effects on its architecture of YAP activation or HD mutation. HD, Huntington’s Disease; NE, neuronal ectoderm; NNE, nonneuronal ectoderm.
Figure 6—figure supplement 1
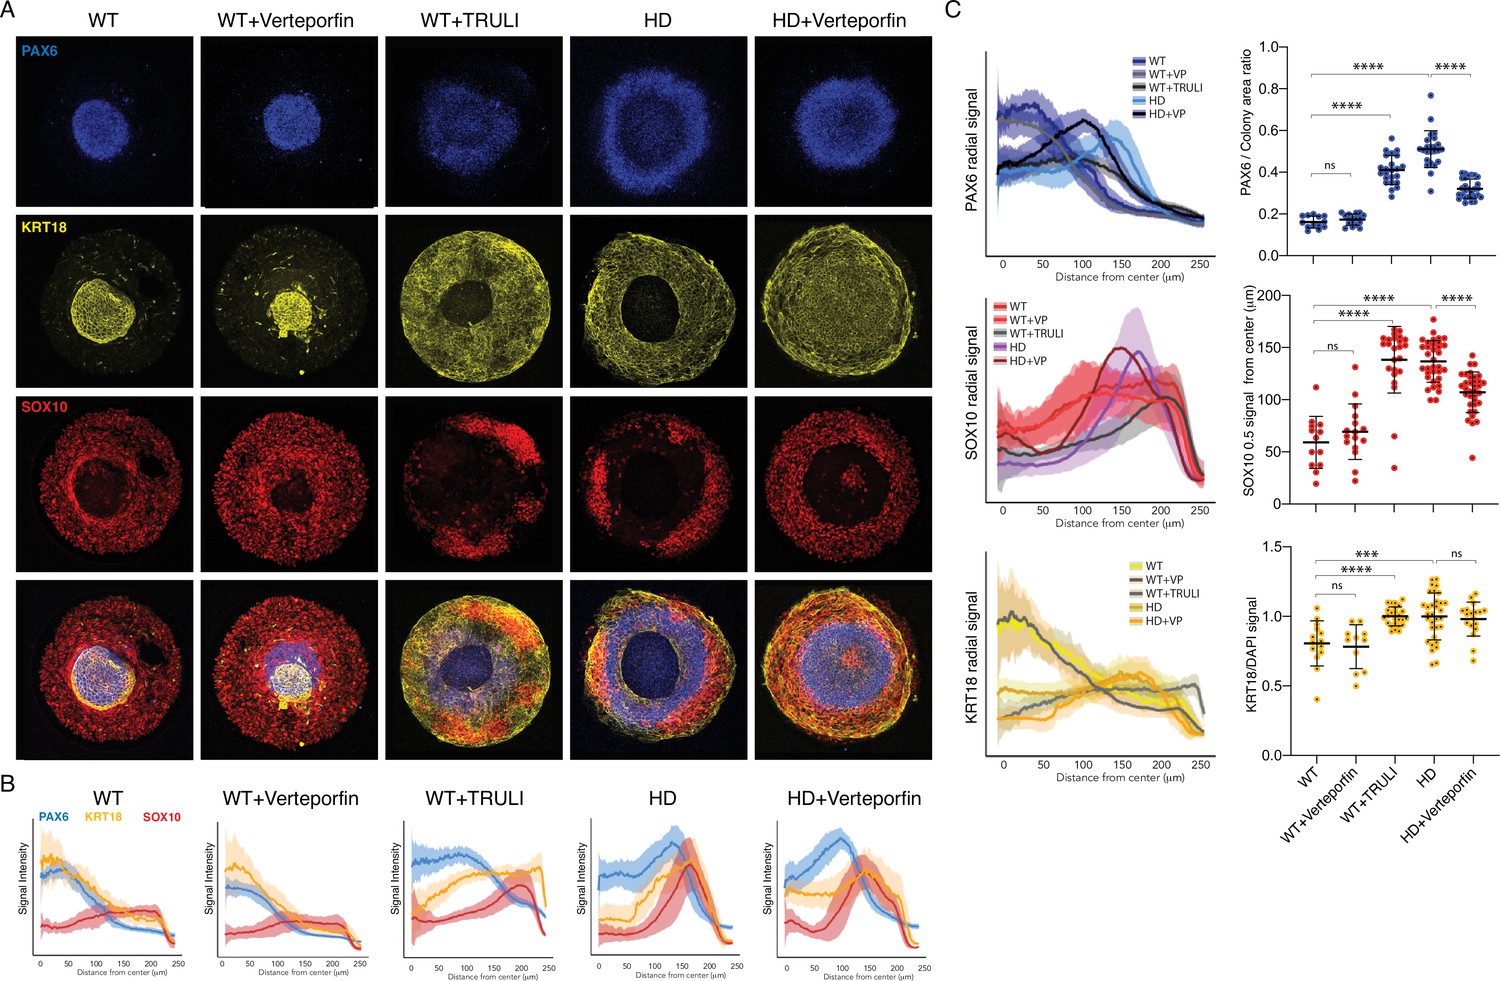
Perturbation of YAP activity in WT and HD neuruloids.
(A) Immunofluorescence images of D7 neuruloids show that treatment with 0.3 µM verteporfin has no effect on WT colonies, whereas treatment with 10 µM TRULI results in the expansion of the central area of NE (PAX6, blue) and enhancement of the epidermal population (KRT18, yellow) at the expense of NC (SOX10, red). This phenotype resembles that of HD colonies. The NE and NC phenotypes of HD colonies are partially rescued by treatment with 0.3 µM verteporfin. (B) Quantitative analysis of the three experimental conditions shows radial distributions of the lineage markers PAX6, SOX10, and KRT18 in several colonies. (C) On the left, radial distributions quantify the lineage markers PAX6, SOX10, and KRT18 in the five experimental conditions. At the right, plots show the area of the PAX6+ central region as a fraction of each entire colony, the radial distance from the colony’s center to the half-maximal intensity of the SOX10 domain, and the KRT18 signal normalized by DAPI labeling. ***, p<0.001; ****, p<0.0001; ns, p>0.05 in unpaired t-tests comparing the different experimental conditions (WT, n = 13; WT +VP, n=17; WT +TRULI, n=23; HD, n=24; HD+VP, n=28). Legends for Videos. HD, Huntington’s Disease; NC, neural crest; NE, neuronal ectoderm; NNE, nonneuronal ectoderm.
Additional files
Download links
A two-part list of links to download the article, or parts of the article, in various formats.
Downloads (link to download the article as PDF)
Open citations (links to open the citations from this article in various online reference manager services)
Cite this article (links to download the citations from this article in formats compatible with various reference manager tools)
Role of YAP in early ectodermal specification and a Huntington's Disease model of human neurulation
eLife 11:e73075.
https://doi.org/10.7554/eLife.73075


