In situ imaging of bacterial outer membrane projections and associated protein complexes using electron cryo-tomography
- Division of Biology and Biological Engineering, California Institute of Technology, United States
- Leiden University, Sylvius Laboratories, Netherlands
- Department of Veterinary Science, University of Kentucky, United States
- Department of Physics and Astronomy, University of Southern California, United States
- Department of Biochemistry and Biophysics, Perelman School of Medicine, University of Pennsylvania, United States
- Department of Life Sciences, Imperial College London, United Kingdom
- Hampshire College, United States
- Department of Biological Sciences, Minnesota State University, United States
- Department of Biological Sciences, University of Wisconsin-Milwaukee, United States
- Department of Microbiology, Immunology, and Molecular Genetics, University of Kentucky, United States
- Department of Pharmaceutical Sciences, University of Kentucky, United States
- Department of Chemistry and Biochemistry, Brigham Young University, United States
Figures
Figure 1 with 3 supplements
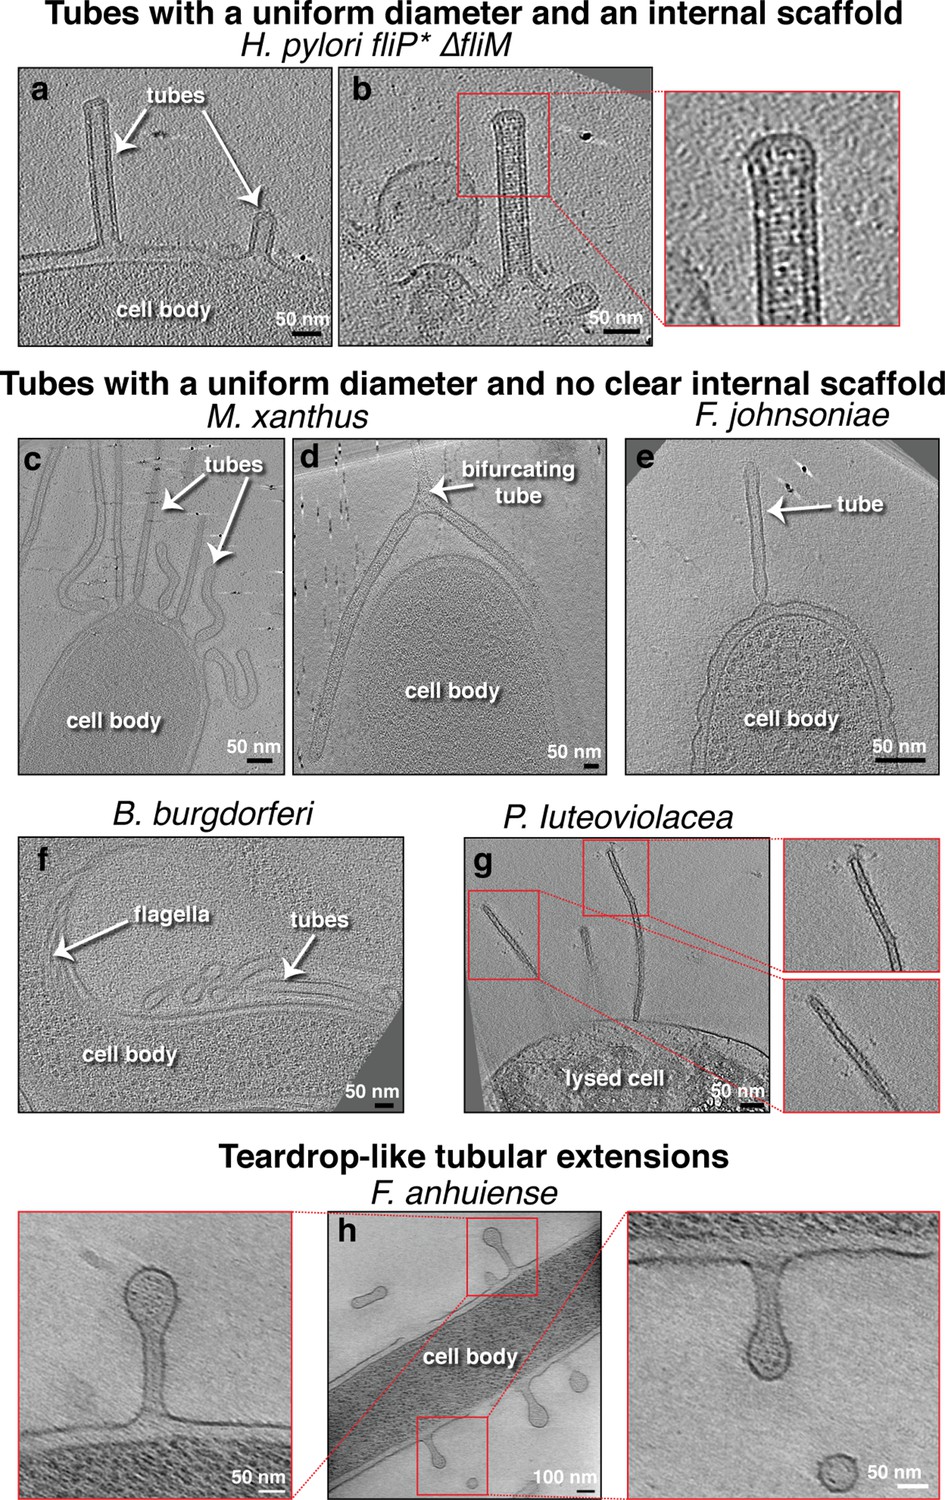
Membrane tubes with a uniform diameter, either with or without an internal scaffold.
Slices through electron cryo-tomograms of the indicated bacterial species highlighting the presence of outer membrane extensions (OMEs) with uniform diameters and either with (a–b) or without (c–g) an internal scaffold, and teardrop-like extensions (h). In this and all subsequent figures, red boxes indicate enlarged views of the same slice. Scale bars are 50 nm, except in main panel (h) 100 nm.
Figure 1—figure supplement 1
Examples of membrane tubes stemming from intact, lysed or vesicles of Helicobacter pylori mutants.
The tubes stemming from vesicles in (b and d) have a bulging at their end due to the absence of the scaffold protein and dark densities can be seen at the other base of these tubes. Scale bars in black boxed panels are 100 nm, in red boxed panels 50 nm except in (b and d) 20 nm.
Figure 1—figure supplement 2
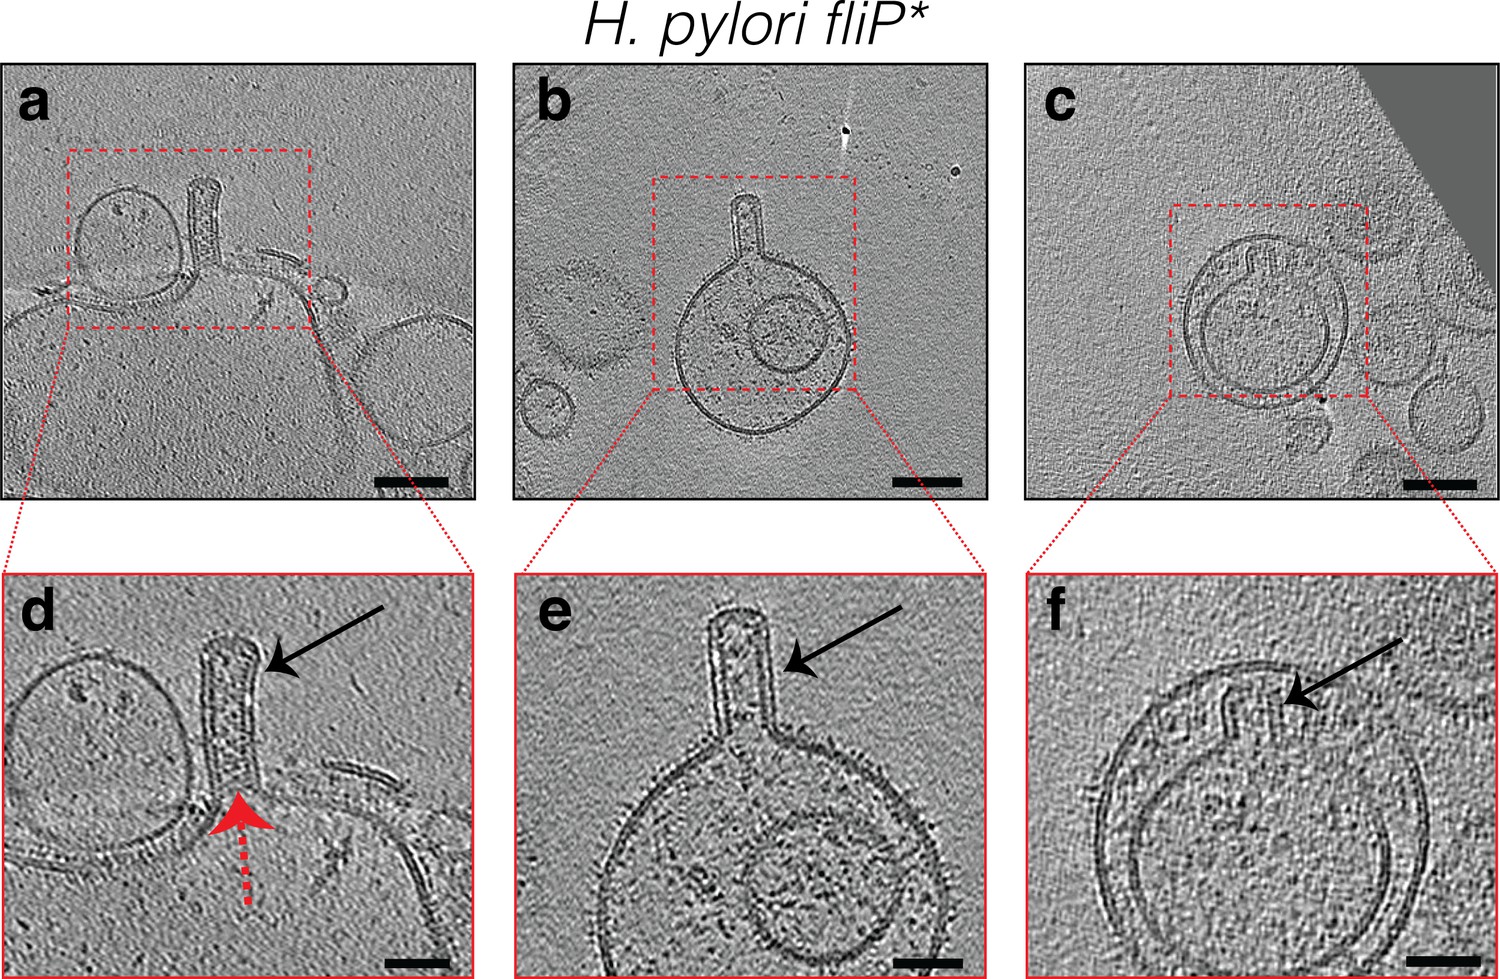
Slices through electron cryo-tomograms of lysed Helicobacter pylori fliP* ΔfliM cells illustrating the presence of outer membrane (OM) tubes in vesicles resulting from cell lysis (black arrows).
Dashed red arrow in (d) points to the scaffold structure inside the tube. Scale bars are 100 nm in (a–c) and 50 nm in (d–f).
Figure 1—figure supplement 3
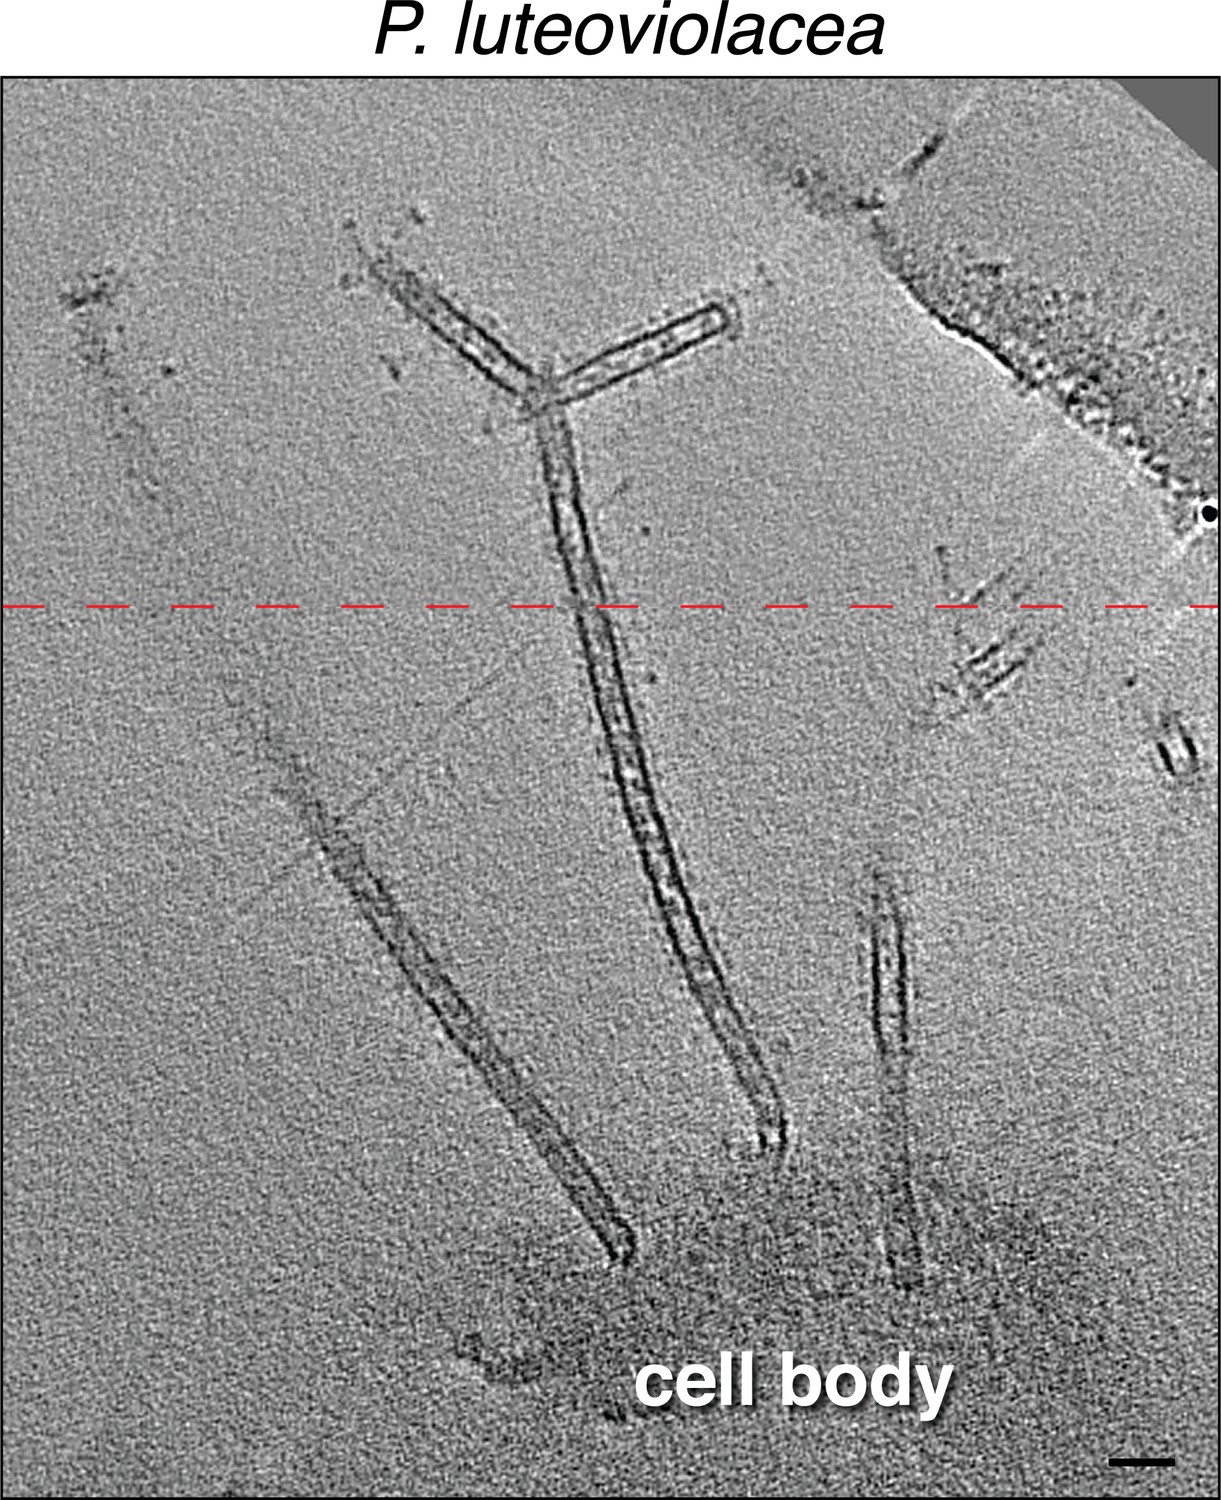
A slice through an electron cryo-tomogram of a lysed Pseudoalteromonas luteoviolacea cell illustrating a bifurcated 20 nm wide membrane tube.
Scale bar is 50 nm. Dashed red line indicates a composite image of two slices through the tomogram at different z-heights.
Figure 2
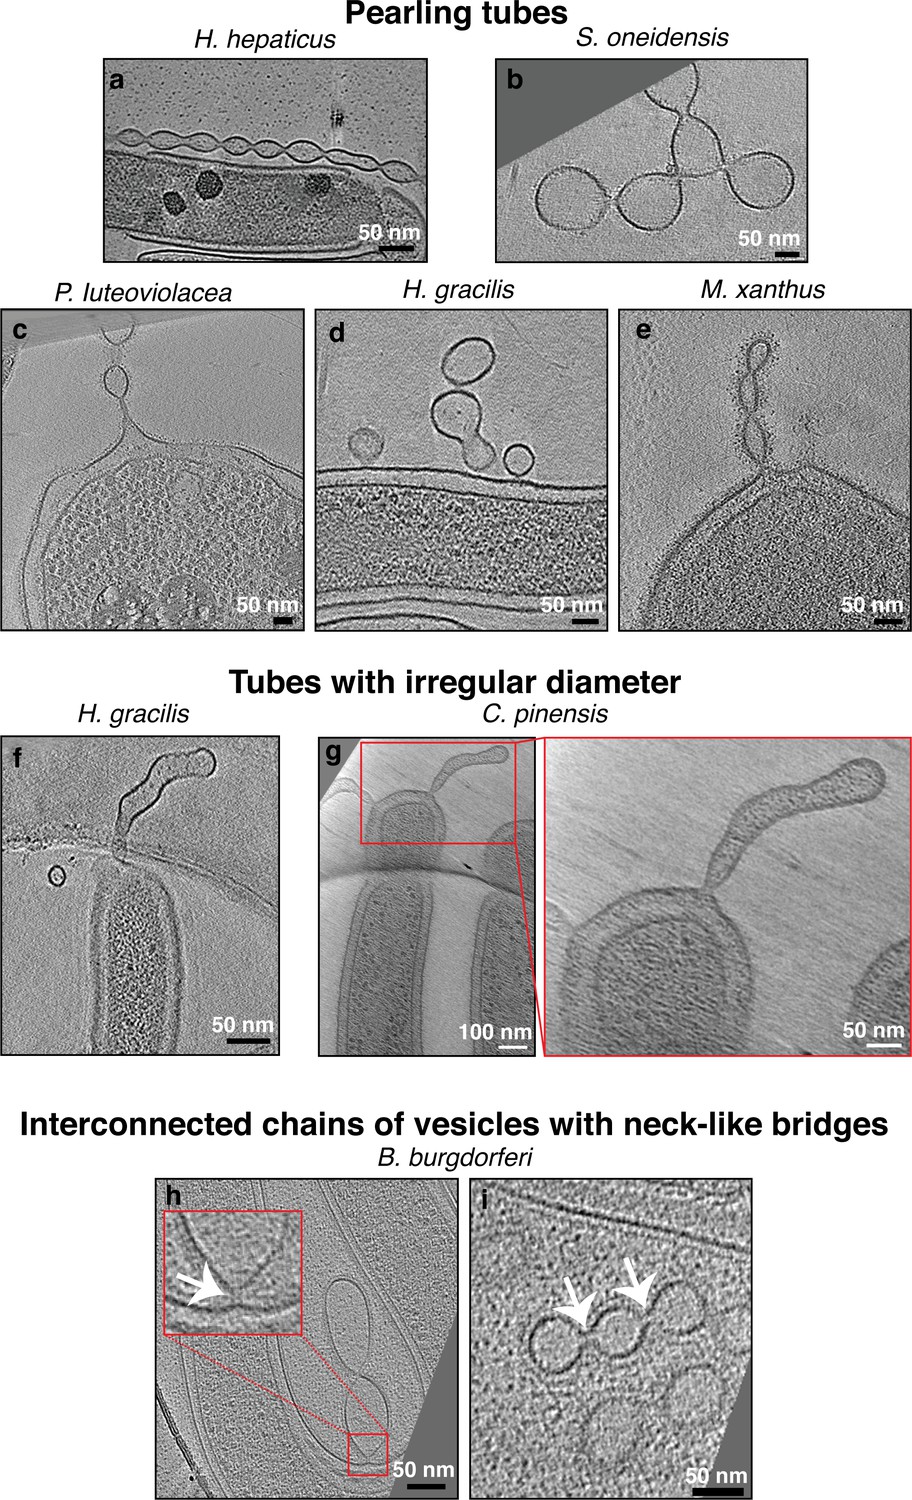
Pearling tubes, tubes with irregular diameter, and vesicle chains with neck-like connections.
Slices through electron cryo-tomograms of the indicated bacterial species highlighting the presence of pearling tubes (a–e), tubes with irregular diameter (f–g), or outer membrane vesicle (OMV) chains connected by neck-like bridges (h–i). White arrows in the enlargement in (h) and in panel (i) point to the 14 nm connectors in Borrelia burgdorferi. Scale bars are 50 nm, except in main panel (g) 100 nm.
Figure 3 with 2 supplements
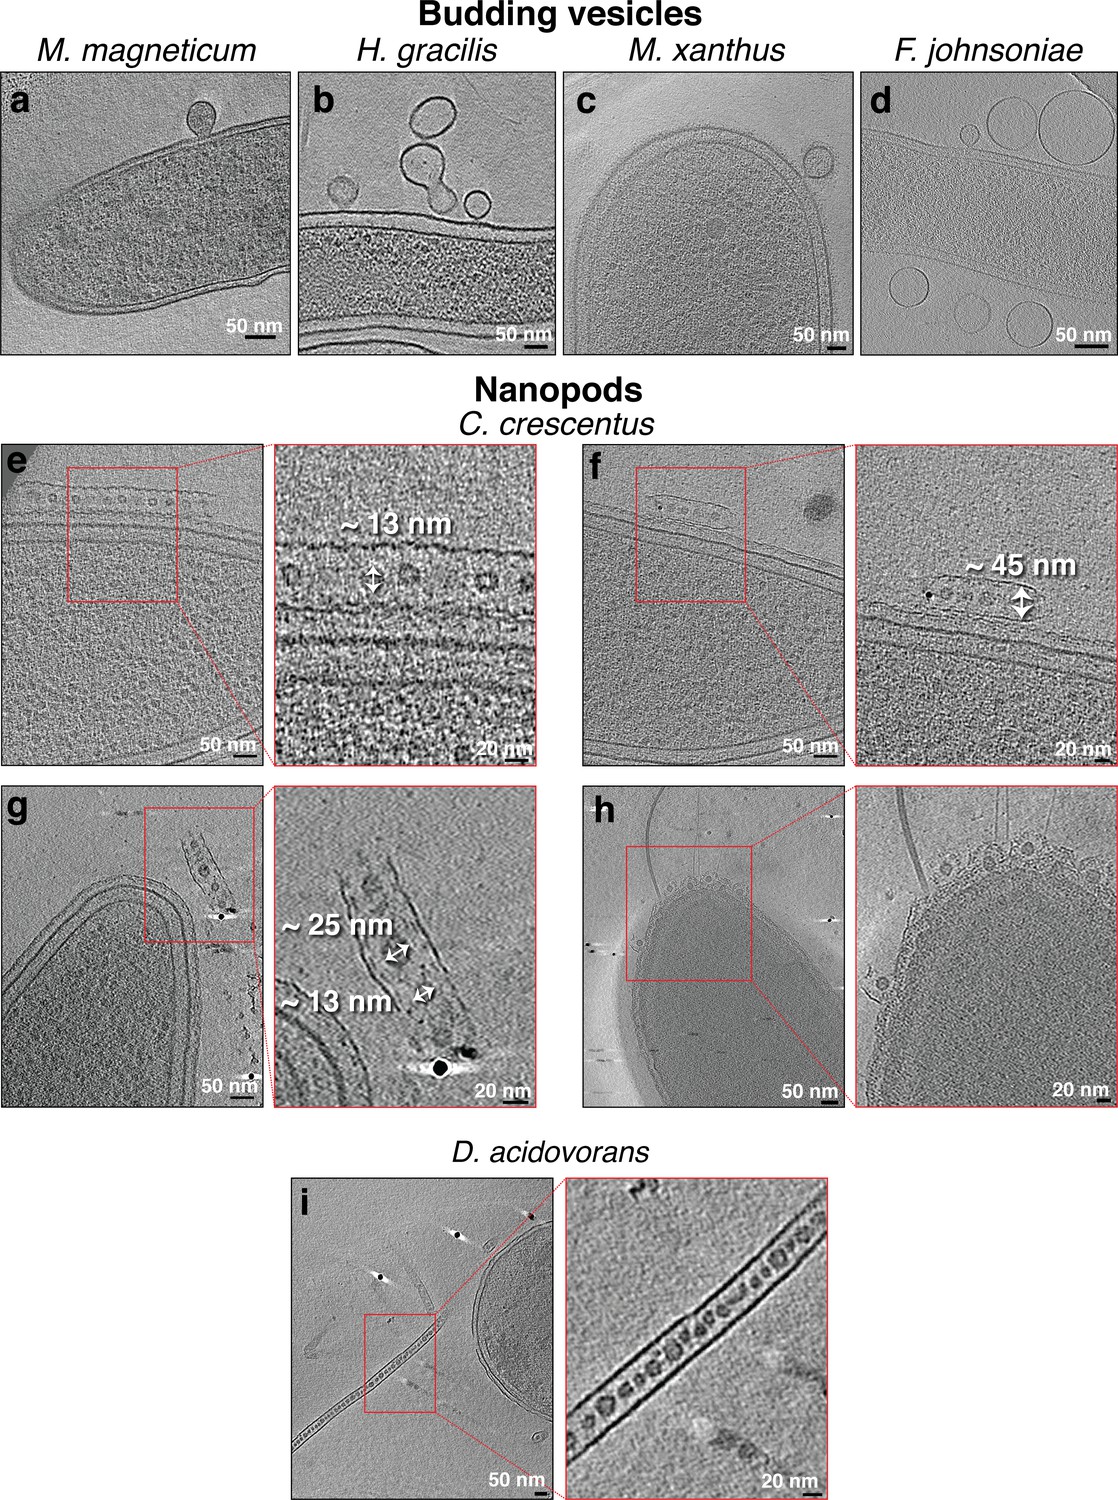
Budding outer membrane vesicles (OMVs) and nanopods.
Slices through electron cryo-tomograms of the indicated bacterial species highlighting the presence of budding vesicles (a–d) or nanopods (e– i). Scale bars are 50 nm in main panels and 20 nm in enlargements.
Figure 3—figure supplement 1
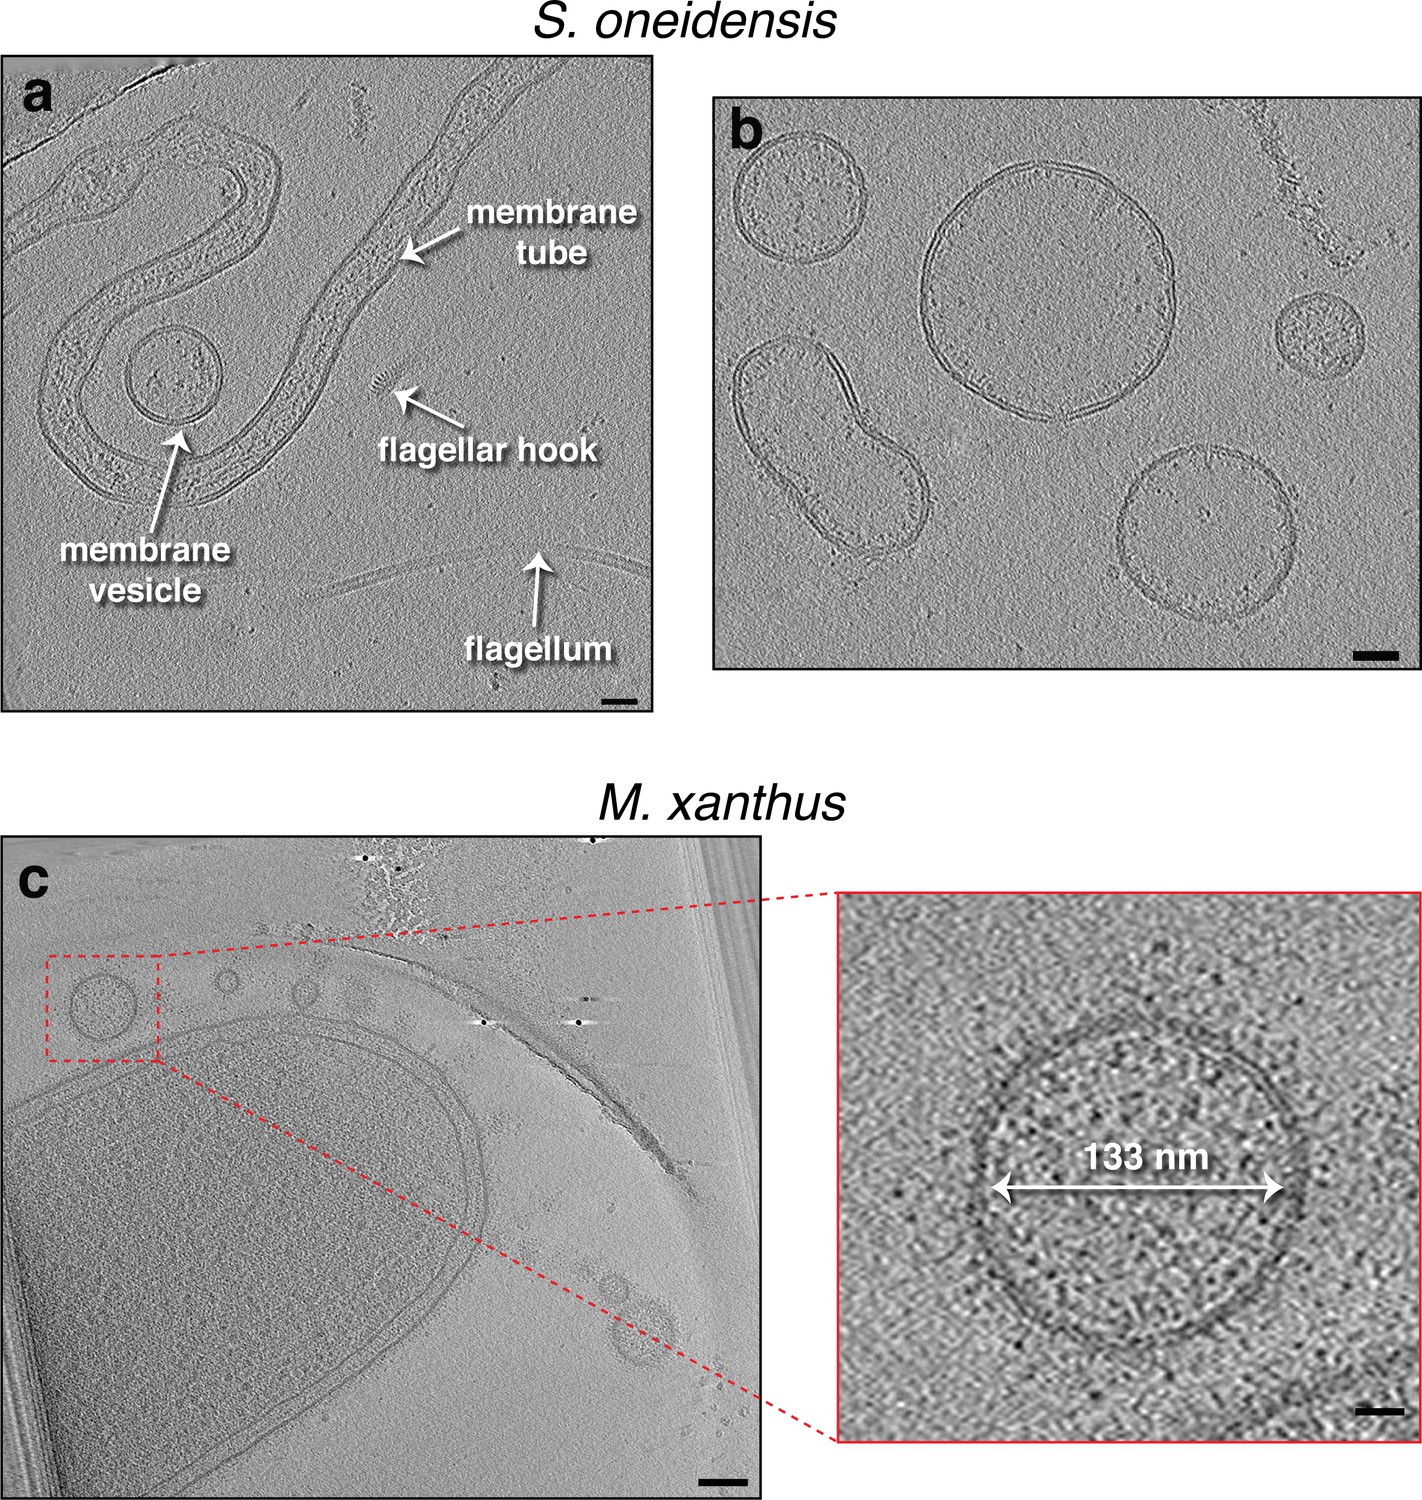
Outer membrane extensions and vesicles in S. oneidensis and M. xanthus.
(a and b) Slices through electron cryo-tomograms of purified membrane extensions (MEs) and membrane vesicles (MVs) from Shewanella oneidensis. Scale bar is 10 nm. (c) A slice through an electron cryo-tomogram of an Myxococcus xanthus cell highlighting the presence of outer MVs (OMVs). Scale bars are 100 nm and 20 nm in the enlargement on the right.
Figure 3—figure supplement 2
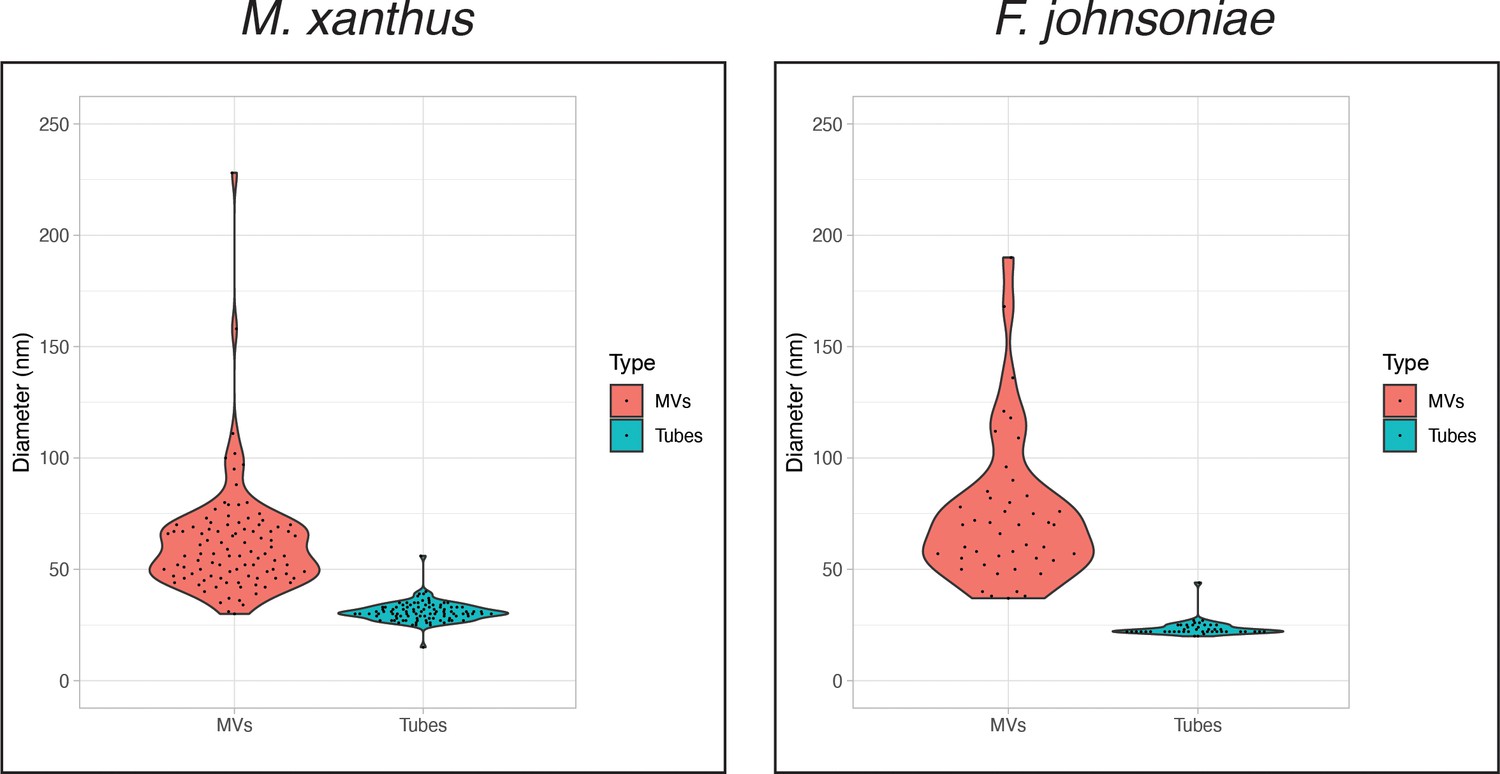
Violin plots of the sizes of outer membrane (OM) vesicles (OMVs) and OM tubes in Myxococcus xanthus (100 randomly picked examples of each) and Flavobacterium johnsoniae (45 randomly picked examples of each).
For both species, p < 0.001 (determined using t-test: two-sample assuming unequal variances).
Figure 4
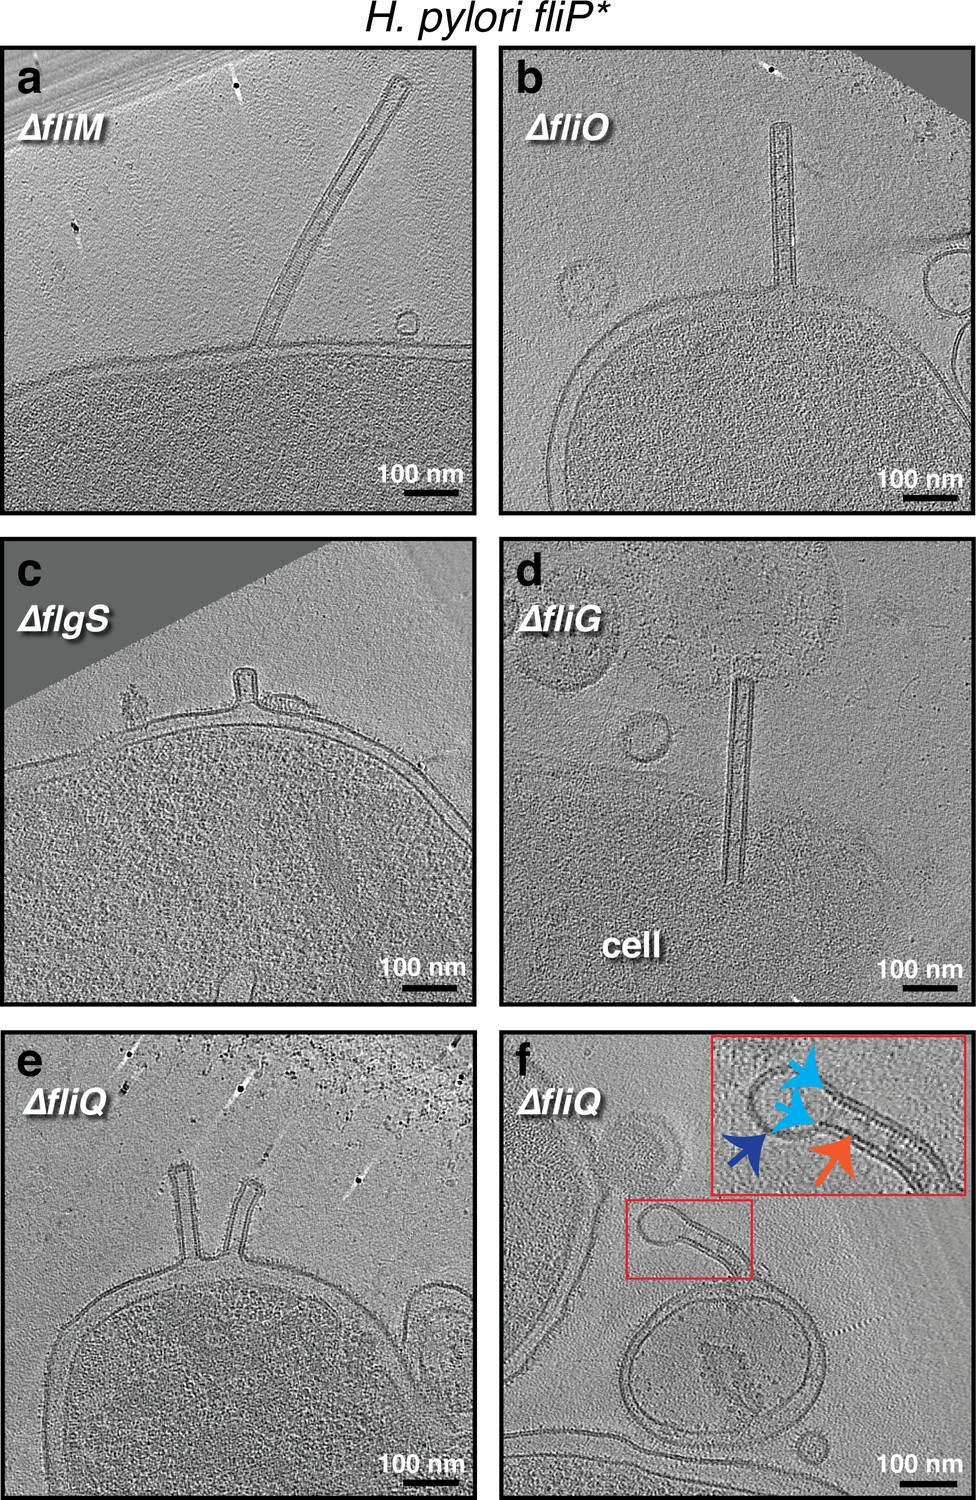
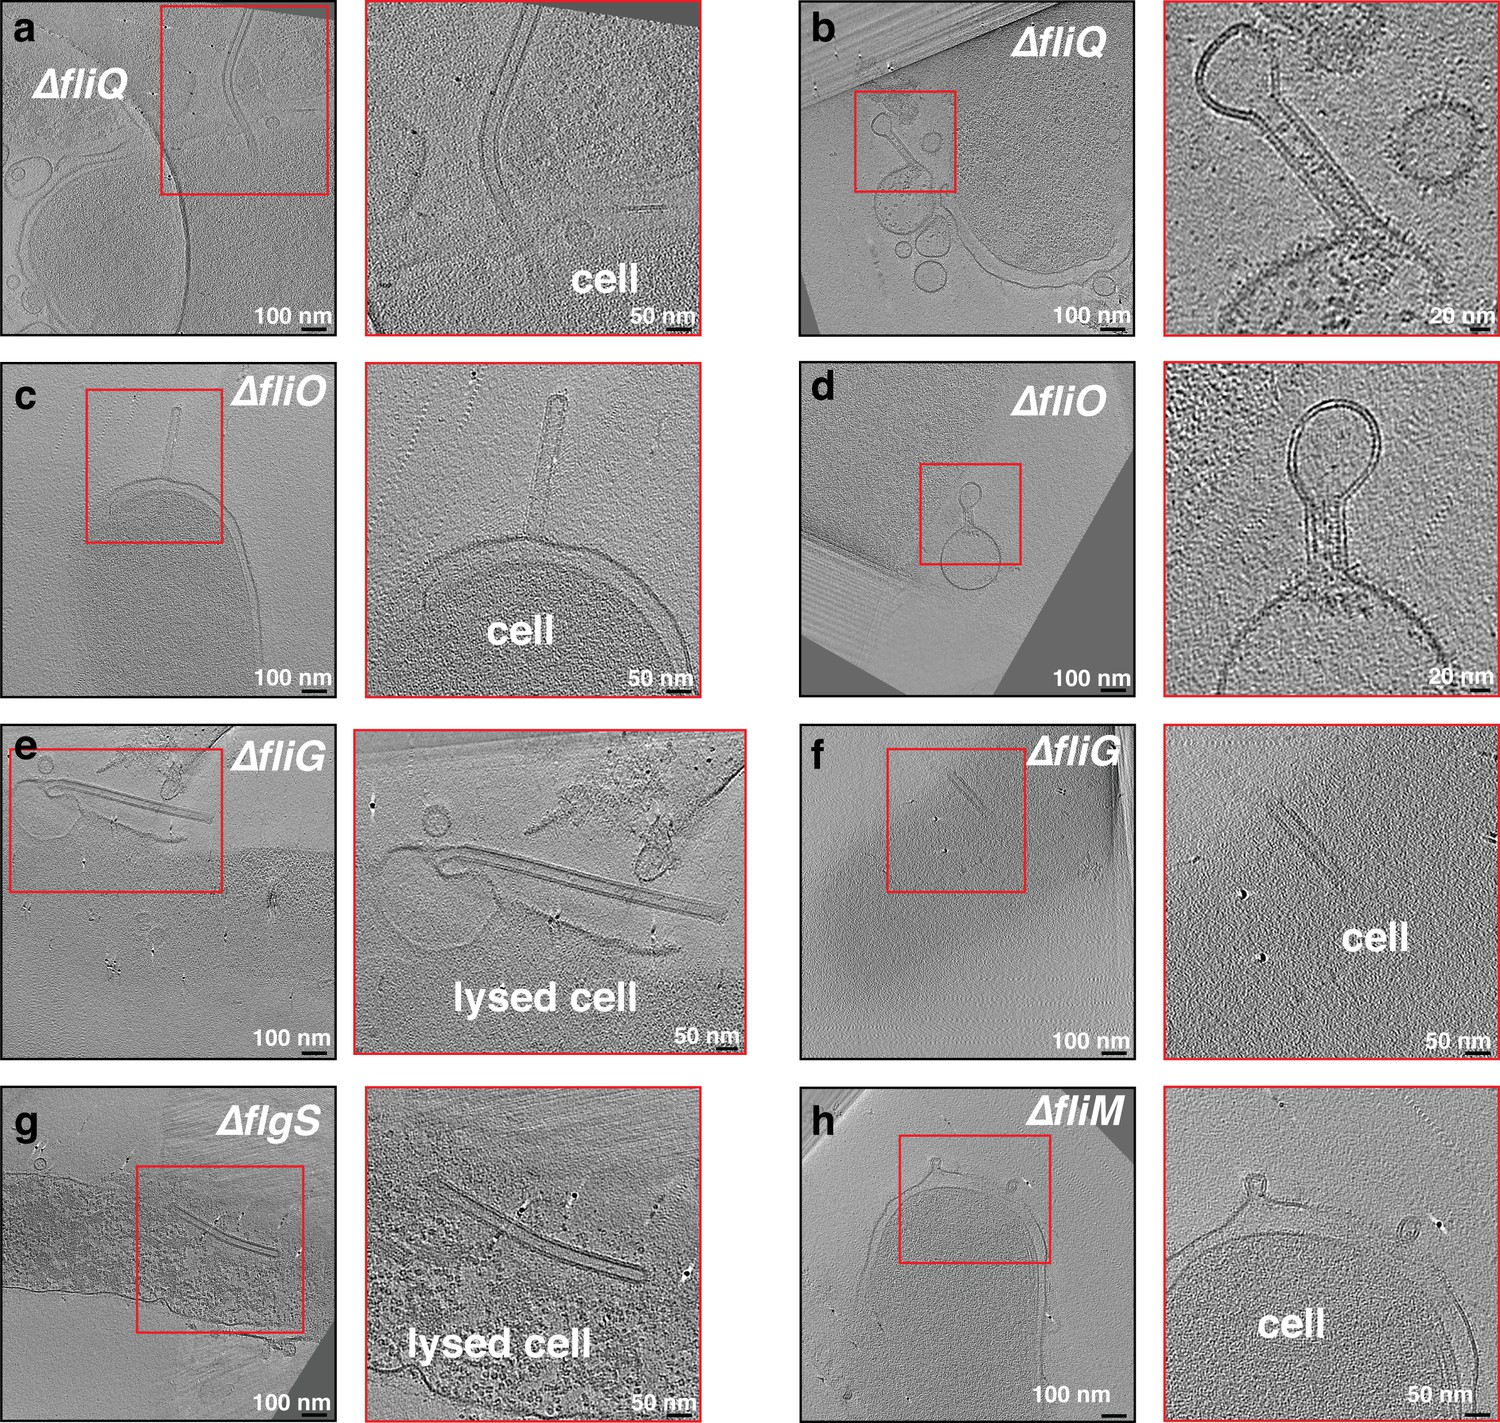
The formation of outer membrane (OM) tubes persists in various Helicobacter pylori mutants, including CORE mutants.
Slices through electron cryo-tomograms of the indicated H. pylori mutants (all in the fliP* background) showing the presence of membrane tubes. The enlargement in (f) highlights a dilation at the end of the tube (dark blue arrow) due to the absence of the scaffold (orange arrow). Light blue arrows indicate the end points of the scaffold. Scale bar is 100 nm.
Figure 5
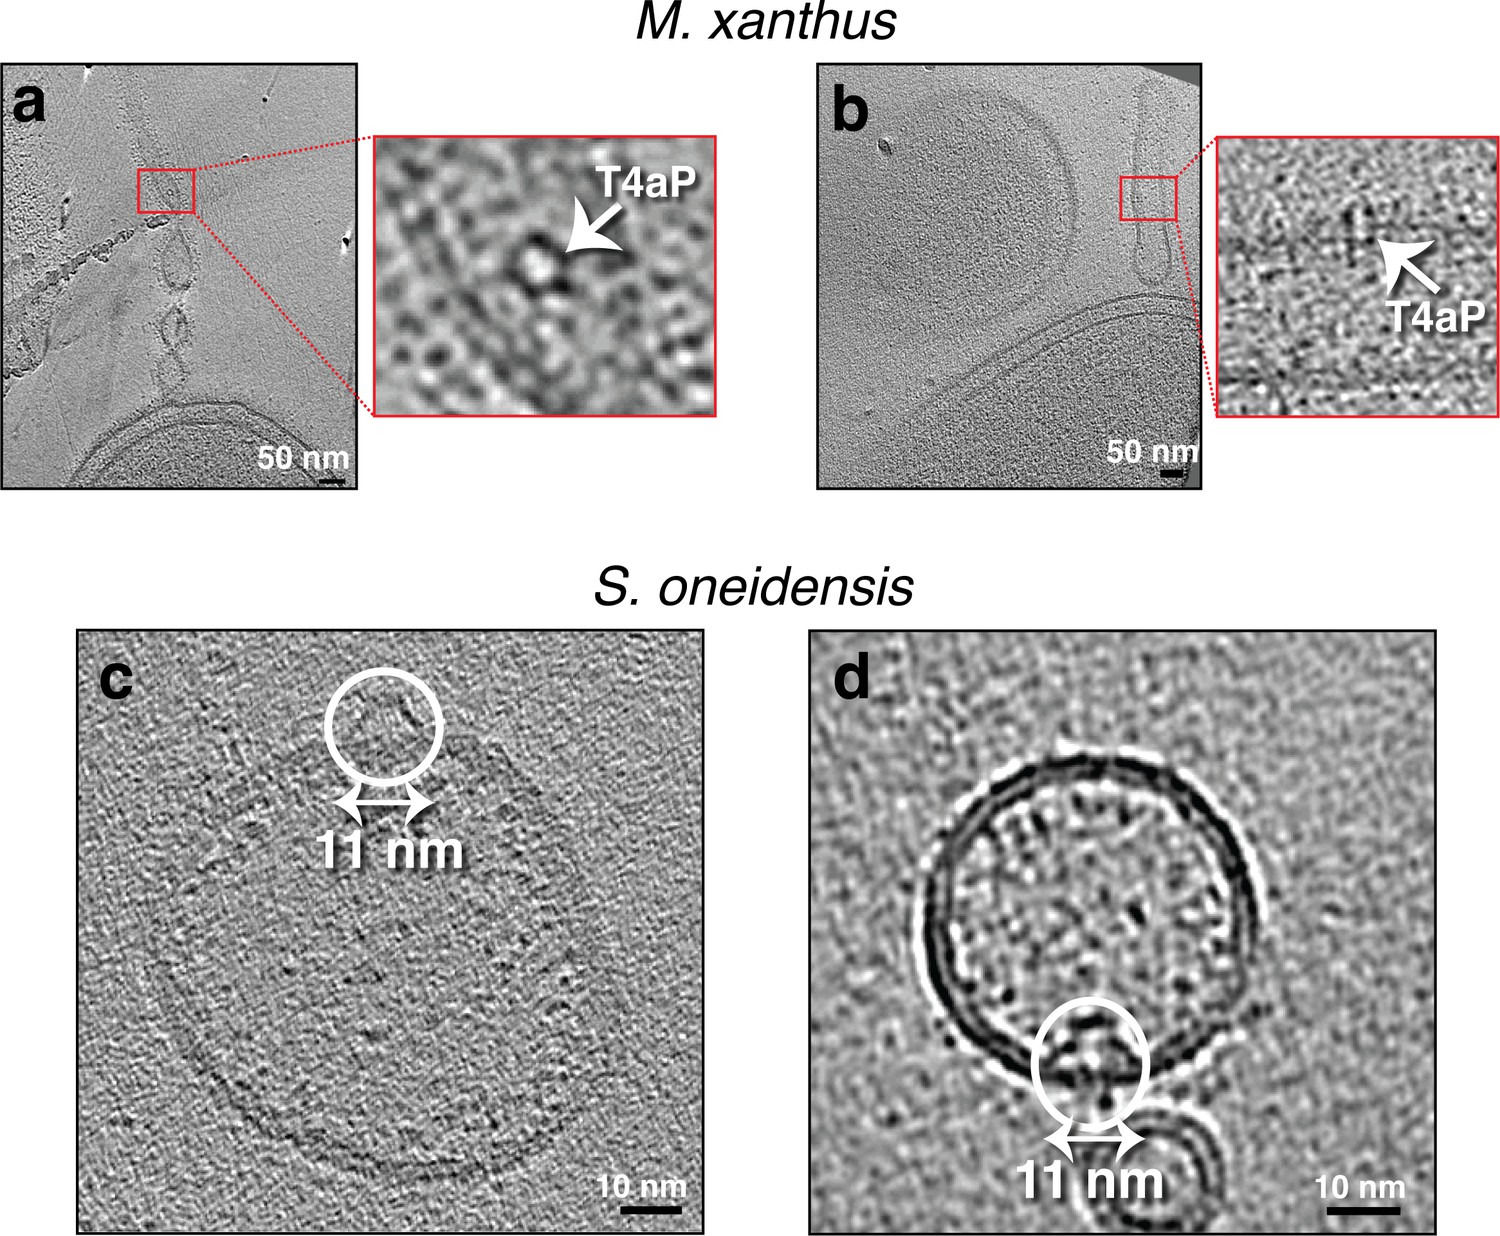
Seemingly randomly located protein complexes on outer membrane extensions (OMEs) of Myxococcus xanthus and purified membrane vesicles (MVs) of Shewanella oneidensis.
(a and b) Slices through electron cryo-tomograms of M. xanthus indicating the presence of pearling tubes with top (a) and side (b) views of type IVa pilus basal bodies (T4aP). Scale bar is 50 nm. (c and d) Slices through electron cryo-tomograms of purified S. oneidensis naturally shed MEs and MVs highlighting the presence of trapezoidal structures on the outside (c) and inside (d) of vesicles. Scale bar is 10 nm.
Figure 6 with 1 supplement
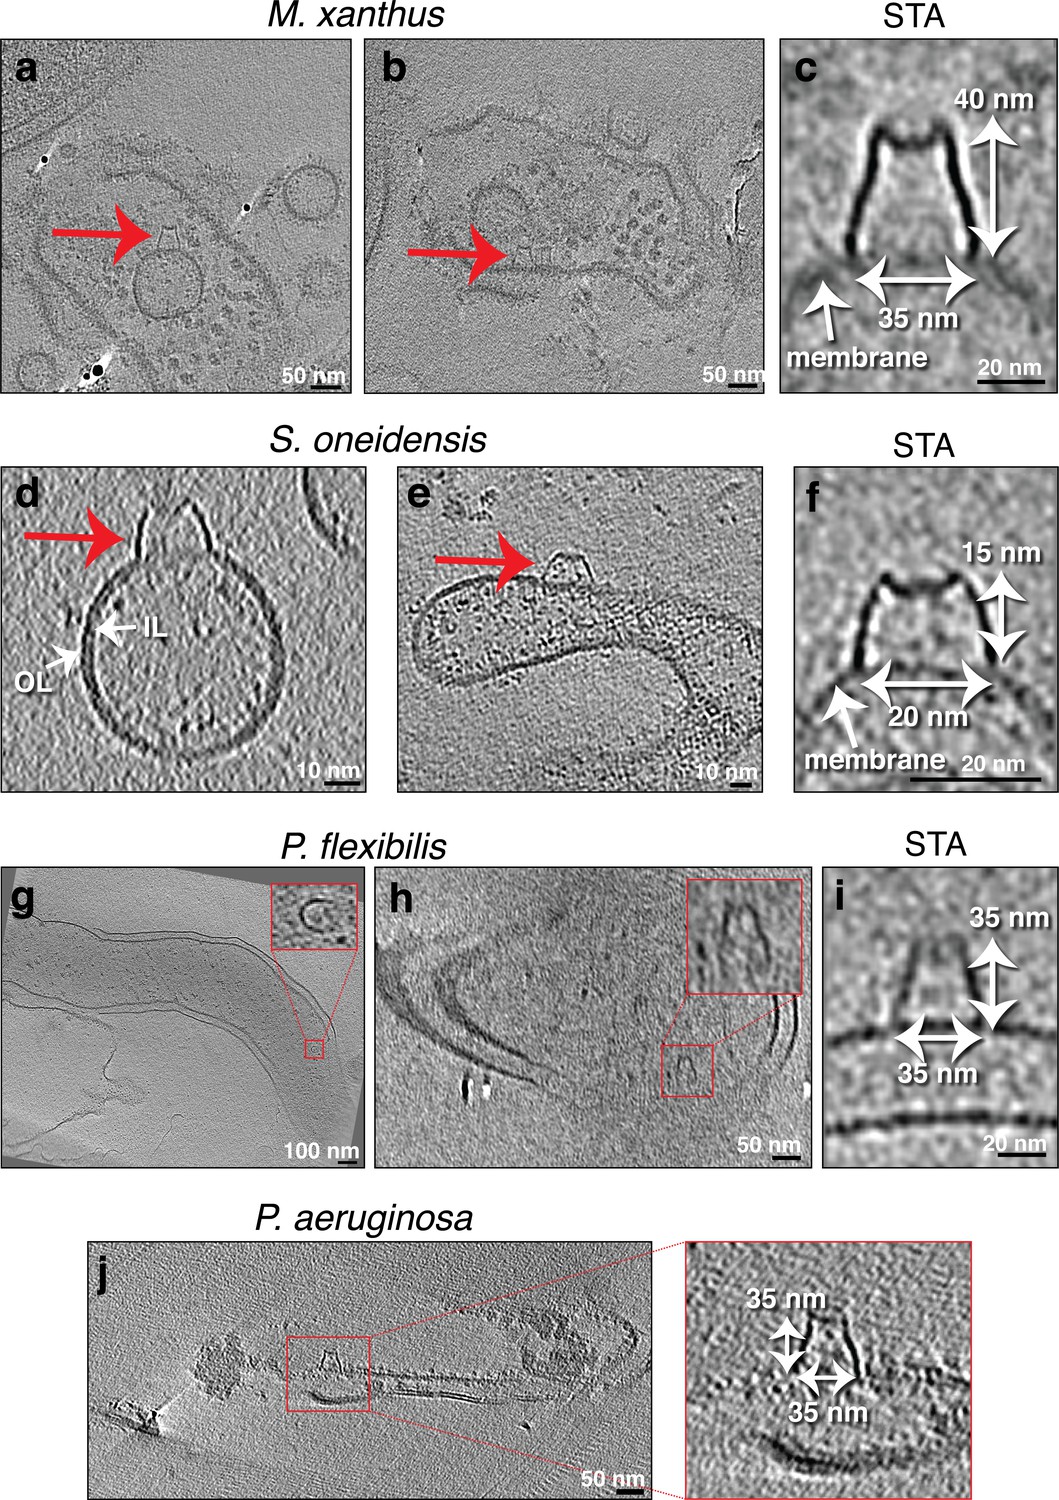
Seemingly randomly located protein complexes associated with lysed cells.
Slices through electron cryo-tomograms of lysed cells (a, b, g, h, and j) or purified membrane extensions (MEs) and membrane vesicles (MVs) (d and e) showing the presence of MVs and lysed membranes with a crown-like complex (red arrows and red boxed enlargements). Scale bars: 50 nm (a, b, h, and j), 100 nm (g), 10 nm (d and e). (c, f, and i) Central slices through subtomogram averages (with twofold symmetry along the Y-axis applied) of nine particles (c), four particles, (f), or three particles (i) of the crown-like complex in the indicated species. Scale bar is 20 nm. OL = outer leaflet, IL = inner leaflet.
Figure 6—figure supplement 1
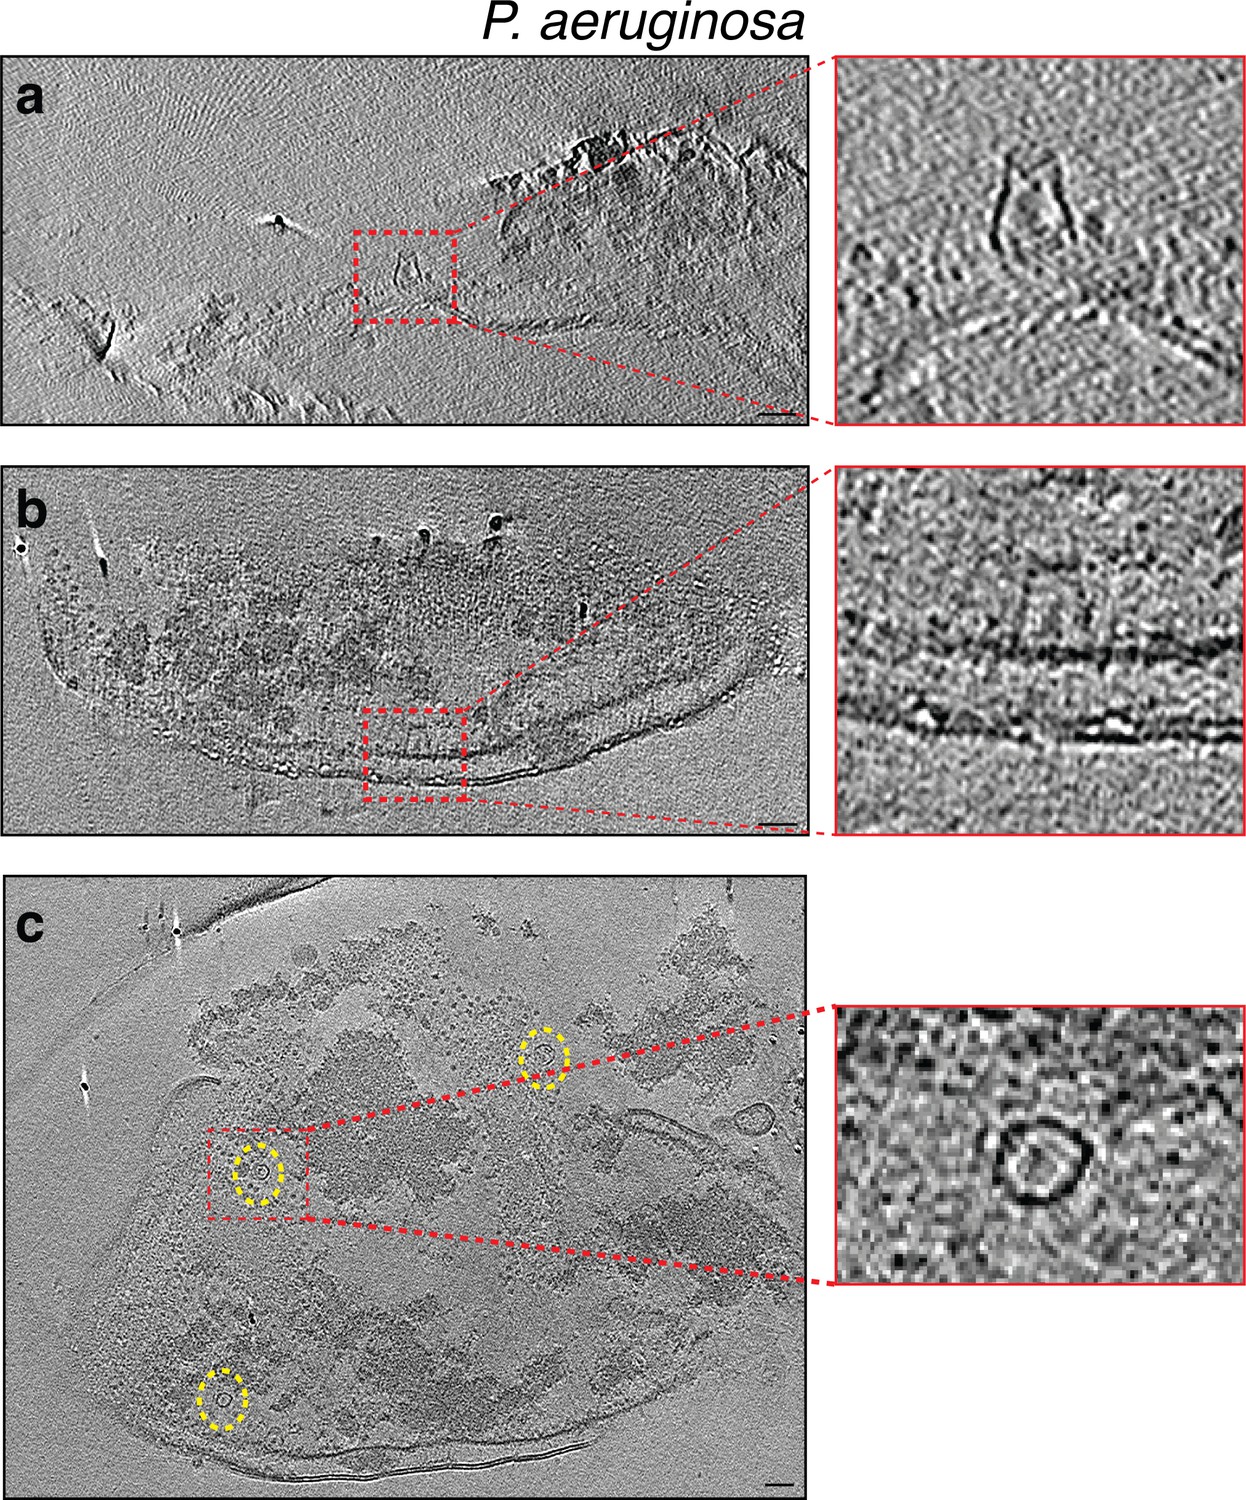
Slices through electron cryo-tomograms of lysed Pseudomonas aeruginosa cells indicating the presence of crown-like structures in side views (a and b) and top view (c, dashed yellow ellipses).
Panels on the right are enlargements of the boxed areas. Scale bar is 50 nm.
Figure 7 with 2 supplements
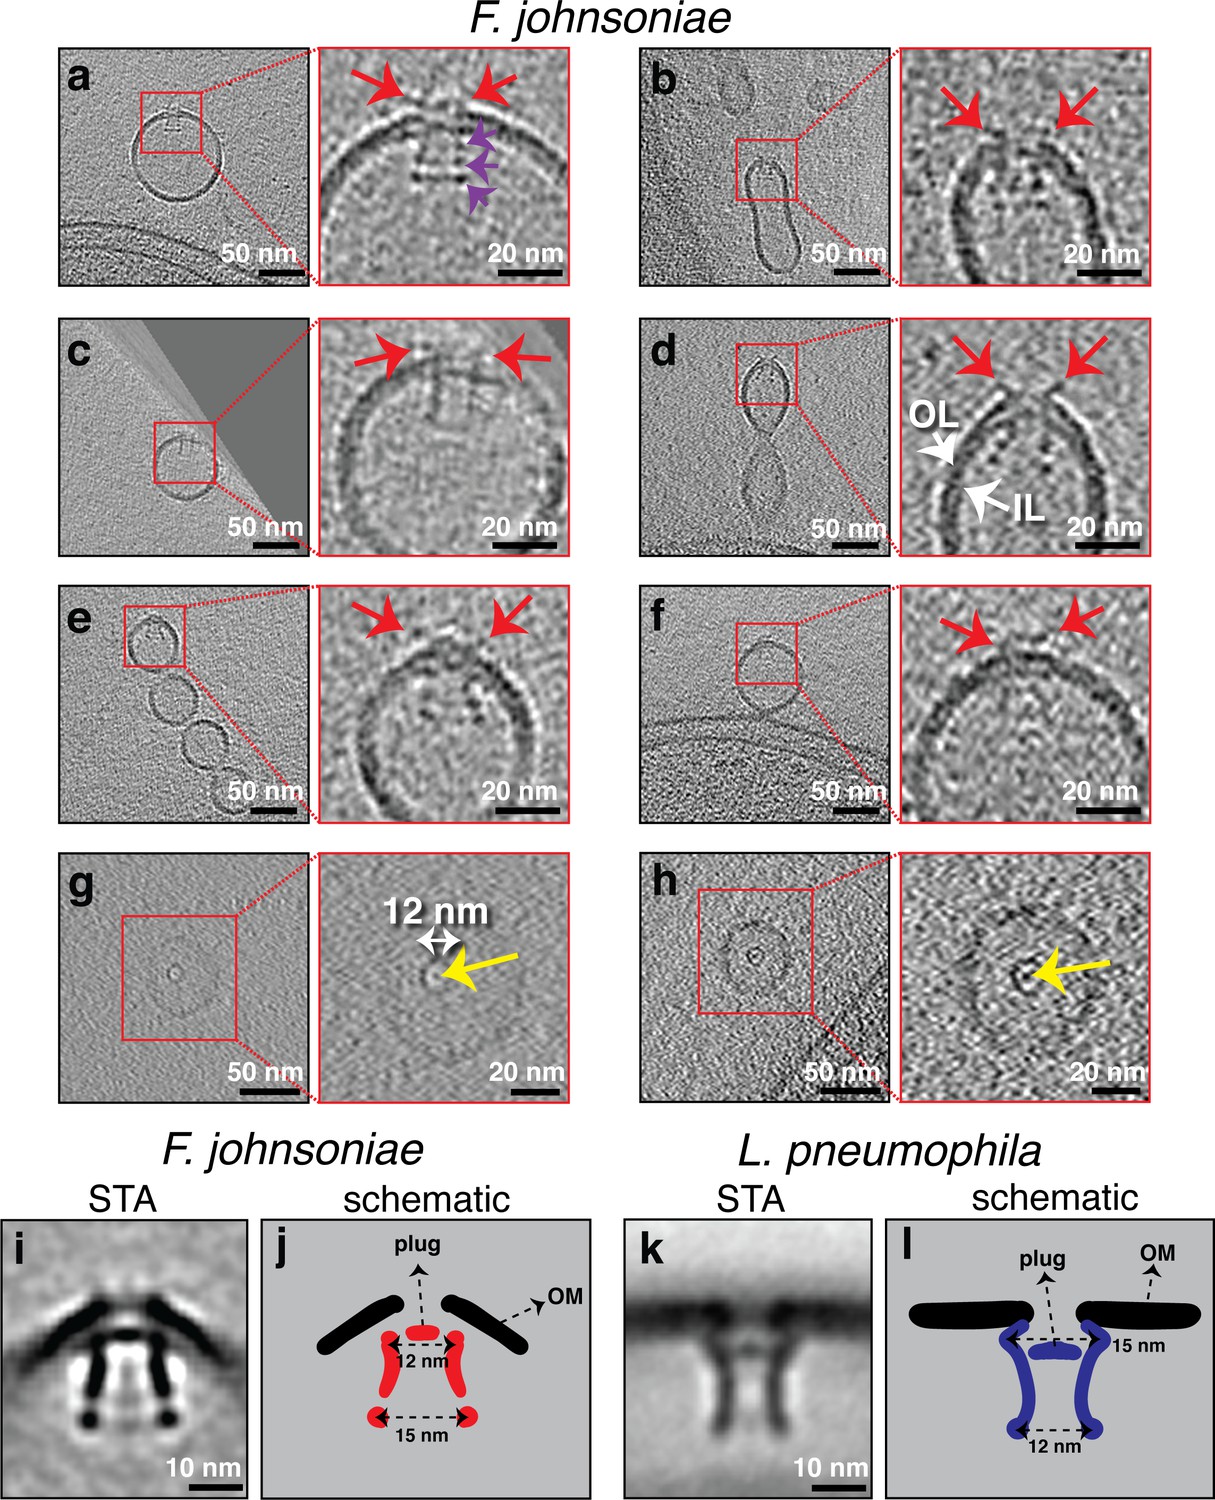
Secretin-like complexes located at the tip of outer membrane extensions (OMEs) and outer membrane vesicles (OMVs) in Flavobacterium johnsoniae.
Slices through electron cryo-tomograms of F. johnsoniae illustrating the presence of secretin-like complexes (side views in a–f), top views in (g and h) with yellow arrows pointing to the plug in OMEs and OMVs of F. johnsoniae. Red arrows point to the extracellular part of the complex. Purple arrows in the enlargement in (a) point to the three periplasmic densities. Scale bars are 50 nm in main panels and 20 nm in enlargements. (i) A central slice through the subtomogram average of 88 particles of the secretin-like complex (with twofold symmetry along the Y-axis applied). Scale bar is 10 nm. (j) A schematic representation of the STA shown in (i). (k) A central slice through the subtomogram average of the secretin of the type II secretion systems (T2SS) of Legionella pneumophila (EMD 20713, see Ghosal et al., 2019). Scale bar is 10 nm. (l) A schematic representation of the STA shown in (k).
Figure 7—figure supplement 1
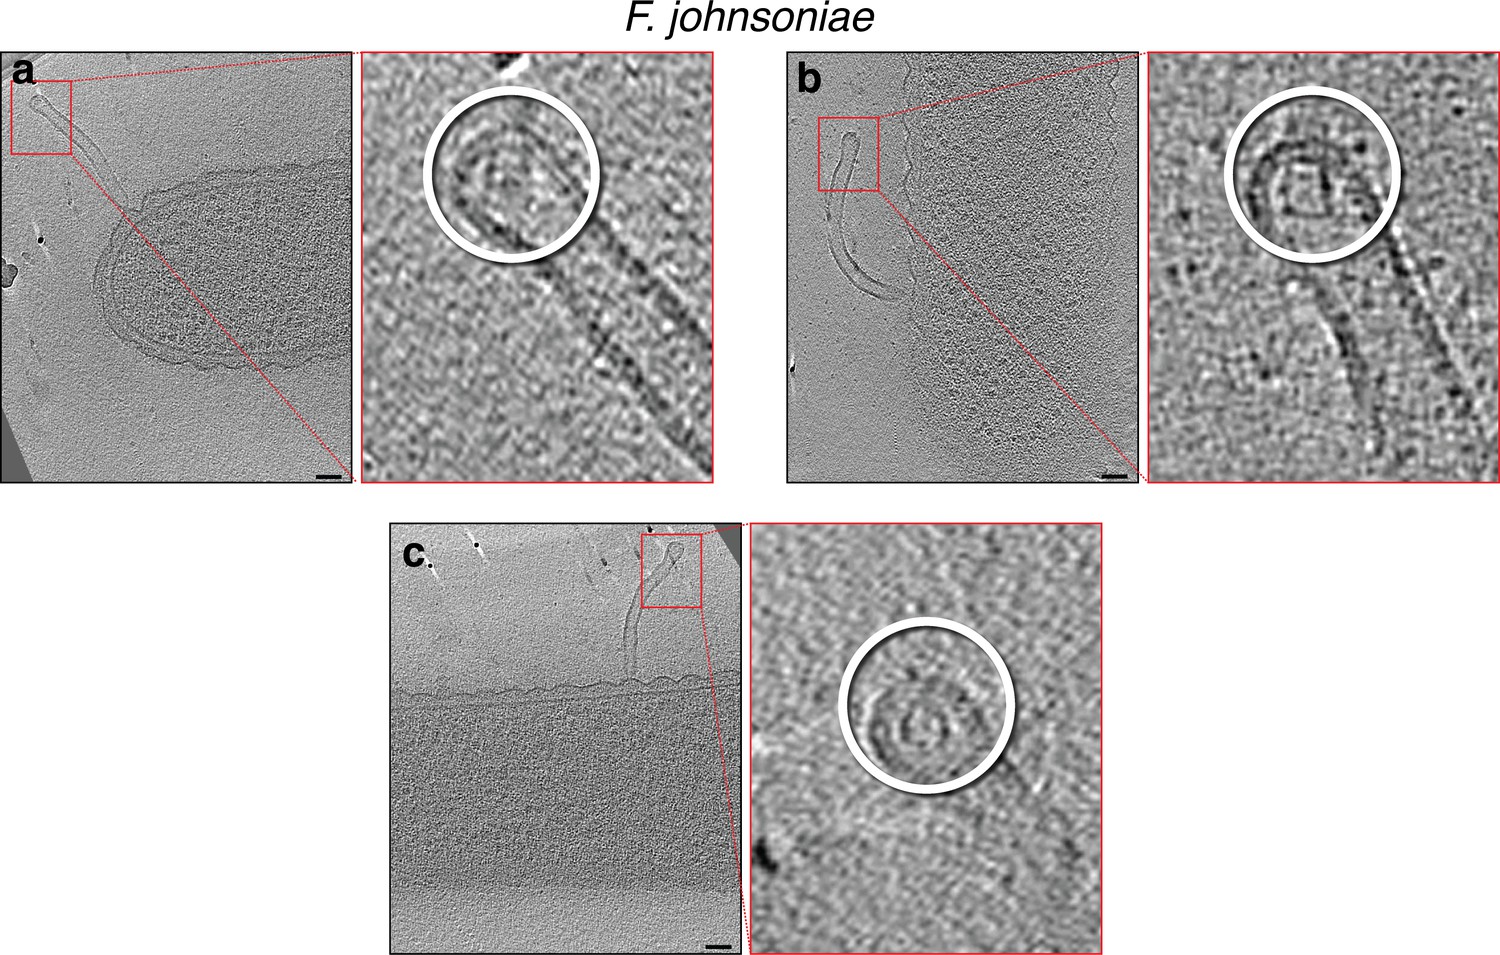
Slices through electron cryo-tomograms of Flavobacterium johnsoniae (with wavy outer membrane [OM]) illustrating tubes stemming from cells with secretin-like complexes at their tips, as highlighted in the enlargements on the right (white circles).
Note that the rotation of the slices on the left is optimized to show the full tube stemming from the cell, while the rotation of the enlargements on the right is optimized to show the best view of the secretin-like complex. Scale bar is 50 nm.
Figure 7—figure supplement 2
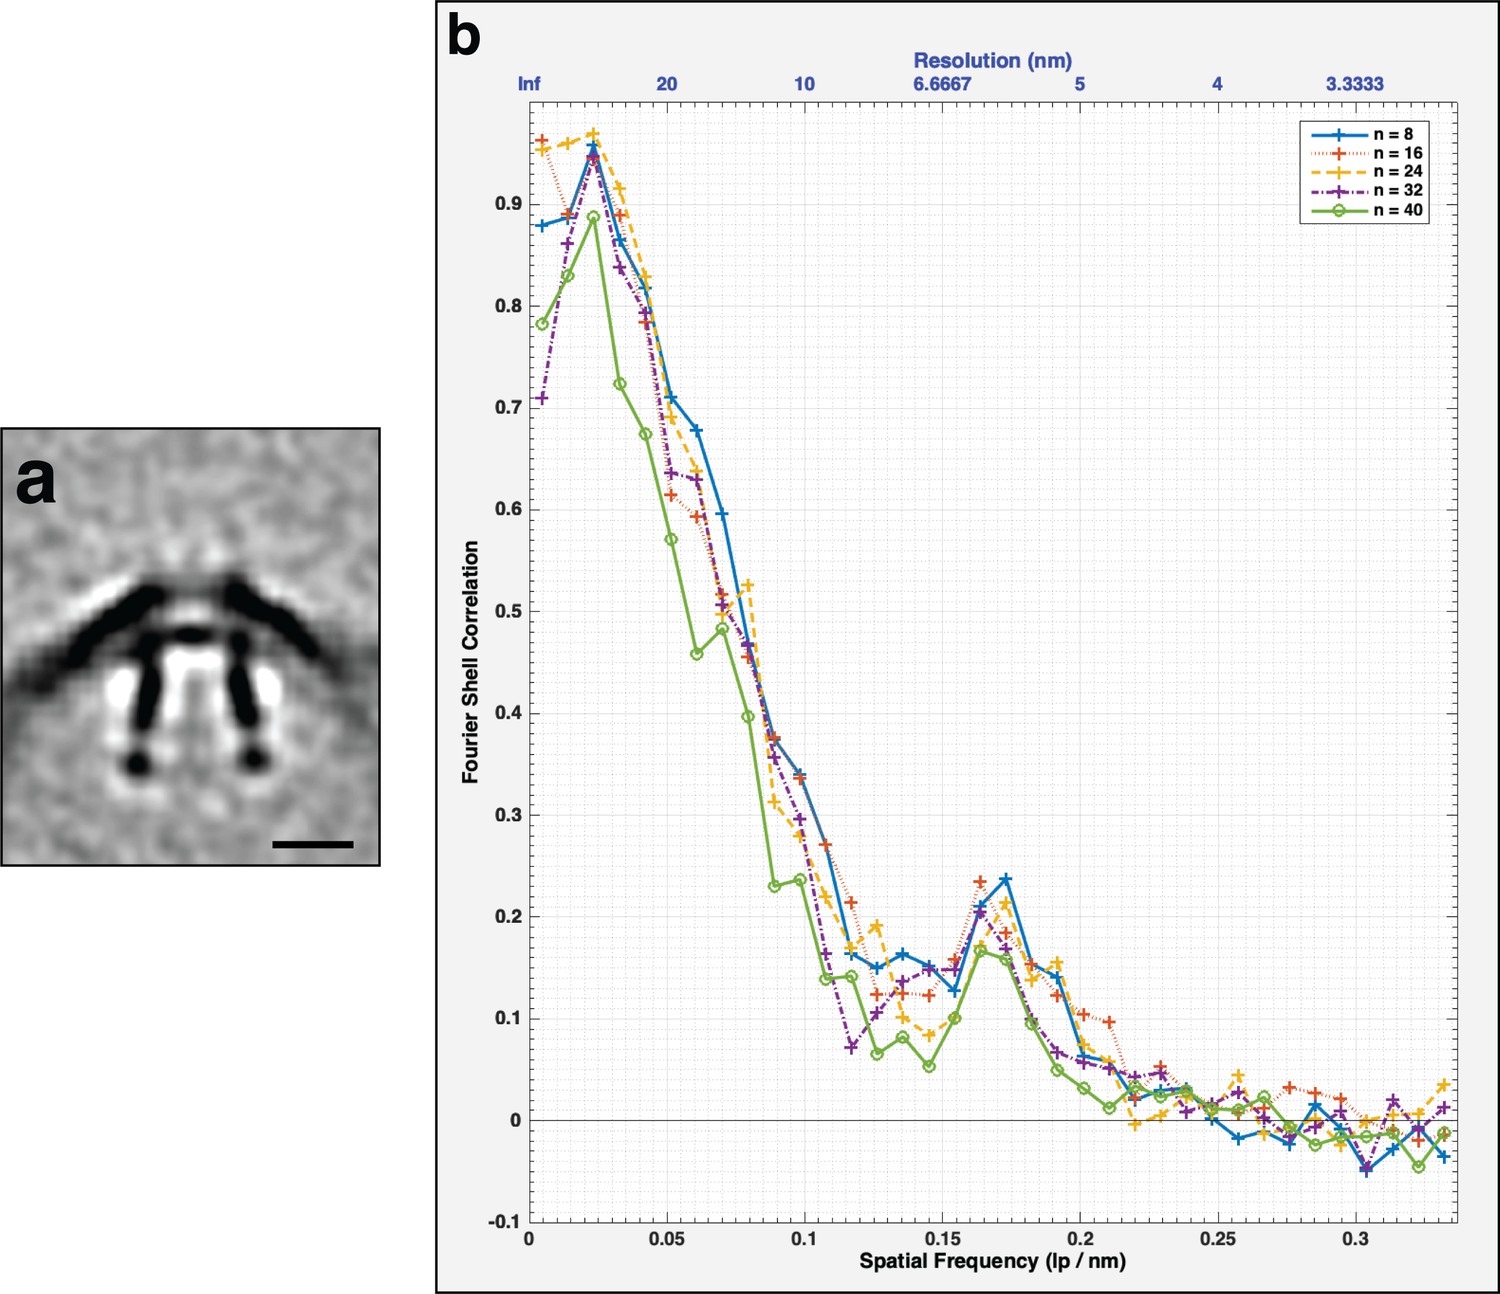
FSC curves of the subtomogram average of the secretin-like complex.
(a) Central slice through the unsymmetrized subtomogram average of the secretin-like complex present in outer membrane (OM) extensions in Flavobacterium johnsoniae. Scale bar is 10 nm. (b) FSC curve of the subtomogram average shown in (a). The different colored curves represent different subsets of particles.
Figure 8
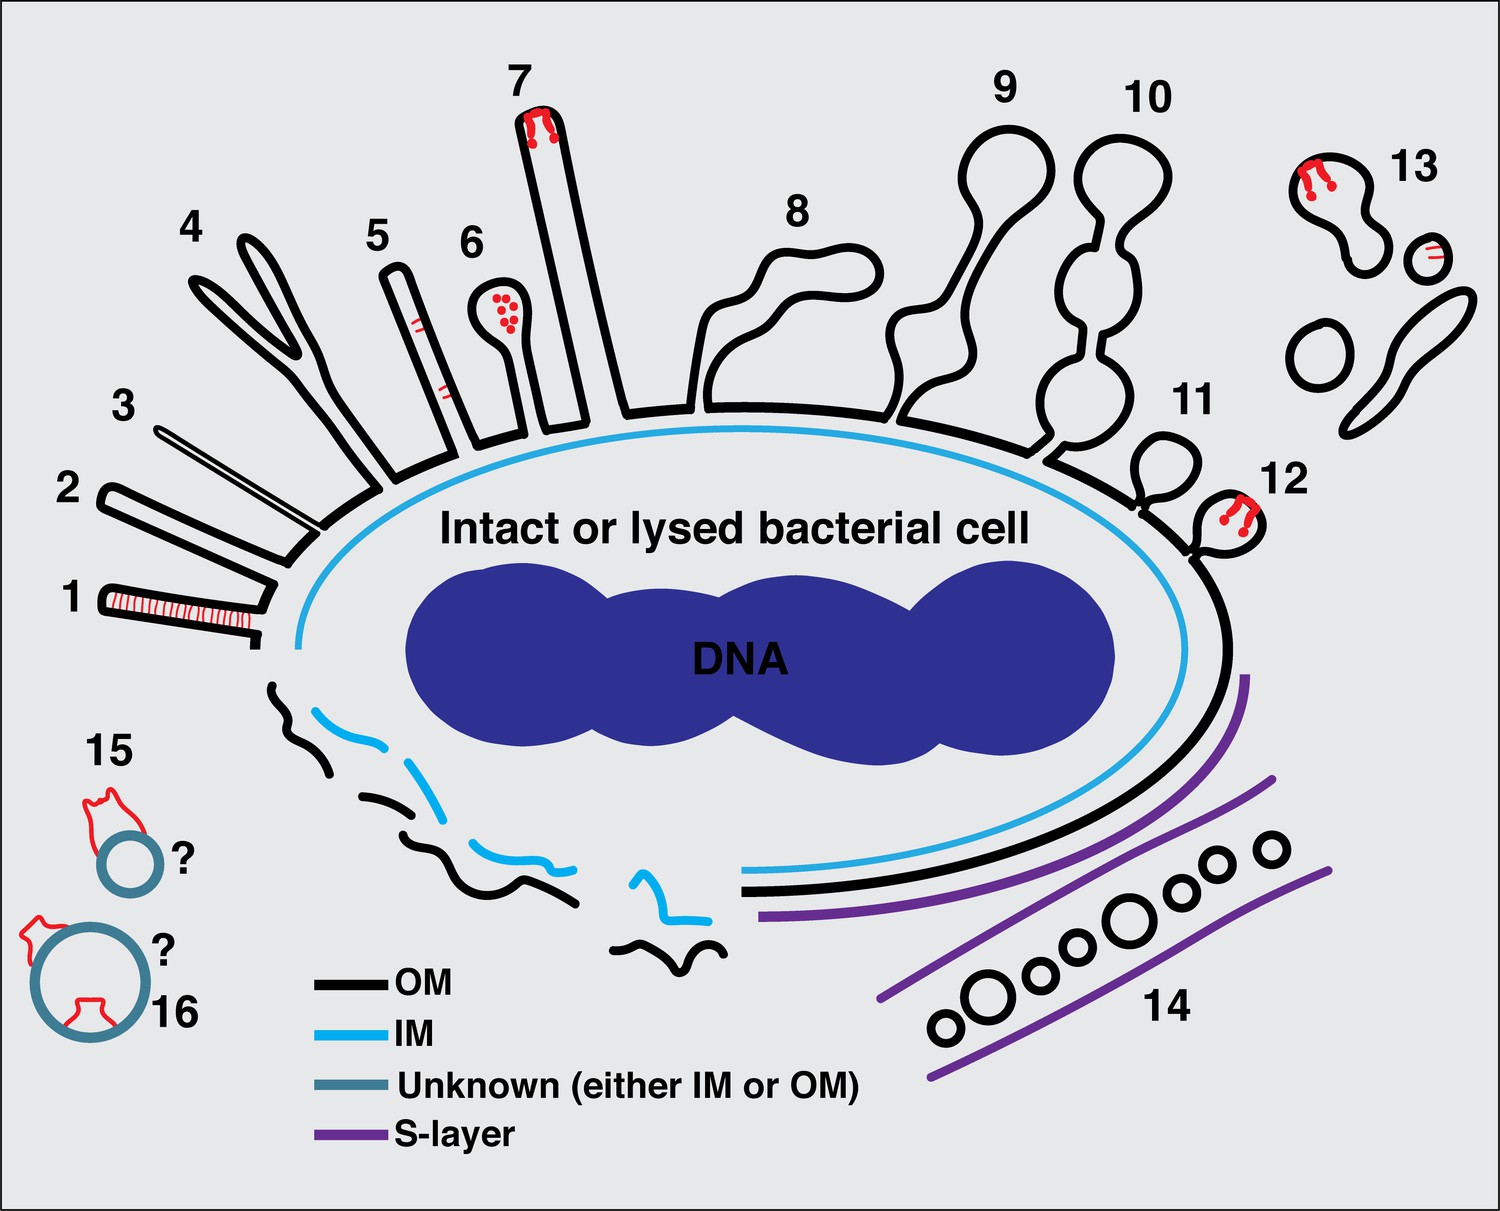
Summary of types of membrane extensions (MEs) and membrane vesicles (MVs) identified in this study.
(1) Tubes with a uniform diameter and with an internal scaffold; (2 and 3) tubes with a uniform diameter but without an internal scaffold; (4) bifurcating tubes; (5) tubes with seemingly randomly located protein complexes (type IVa pilus [T4aP]); (6) teardrop-like extensions; (7) tubes with a secretin-like complex at their tip; (8) tubes with irregular diameter; (9) pearling tubes; (10) interconnected chains of vesicles with 14 nm connectors; (11) budding vesicles; (12) budding vesicles with a secretin-like complex at their tip; (13) various disconnected membrane structures in the vicinity of bacterial cells; (14) nanopods in species with an inner membrane (IM), outer membrane (OM), and S-layer; (15) membrane structures with a crown-like complex from lysed cells; (16) purified outer MVs (OMVs) with trapezoidal complexes. The question marks in (15) and (16) indicate the difficulty of determining whether a membrane structure from lysed cells or purified vesicles originated from the IM or the OM or is in its original topology.
Videos
Video 1
An electron cryo-tomogram of an Myxococcus xanthus cell with multiple outer membrane tubes stemming from the cell.
Video 2
An electron cryo-tomogram of an Flavobacterium johnsoniae cell with outer membrane tubes stemming from the cell.
Note the wavy outer membrane of the cell.
Video 3
An electron cryo-tomogram of an Myxococcus xanthus cell with a pearling outer membrane tube stemming from the cell.
Video 4
An electron cryo-tomogram of an Myxococcus xanthus cell with multiple branched outer membrane tubes stemming from the cell.
Video 5
An electron cryo-tomogram of a Caulobacter crescentus cell with a nanopod (black arrow) close to the cell.
Video 6
An electron cryo-tomogram of an Flavobacterium johnsoniae cell highlighting the presence of secretin-like particles at the tips of outer membrane tubes.
Tables
Table 1
A summary of the species included in this study and the major membrane structures identified in each species.
Note that the approximation symbol before the number of cells indicates that in many tomograms we only see a part of the cell(s).
| Species | Class | No. of cells | Features observed | |||||||
|---|---|---|---|---|---|---|---|---|---|---|
| Tubes | Vesicle chains | Budding/ vesicles | Nanopods | |||||||
| Uniform diameter – scaffold | Uniform diameter – no scaffold | Variable diameter | Pearling | Connectors | No connectors | |||||
| Shewanella oneidensis | Gammaproteobacteria | ~700 | See Subramanian et al., 2018 | > 100 | ||||||
| Pseudoalteromonas luteoviolacea | Gammaproteobacteria | ~67 | ~100 | ~10 | ||||||
| Hylemonella gracilis | Betaproteobacteria | ~105 | 3 | 4 | 15 | |||||
| Delftia acidovorans | Betaproteobacteria | n.a. | See Shetty et al., 2011 | |||||||
| Magnetospirillum magneticum | Alphaproteobacteria | ~56 | 49 | |||||||
| Caulobacter crescentus | Alphaproteobacteria | ~464 | 53 | |||||||
| Helicobacter hepaticus | Epsilonproteobacteria | ~28 | 2 | |||||||
| Helicobacter pylori | Epsilonproteobacteria | ~883 | >100 | >100 | ||||||
| Myxococcus xanthus | Deltaproteobacteria | ~2000 | >100 | >100 | >100 | |||||
| Borrelia burgdorferi | Spirochaetes | ~61 | 9 | 19 | 16 | |||||
| Flavobacterium johnsoniae | Flavobacteria | ~203 | ~45 | ~15 | >100 | |||||
| Flavobacterium anhuiense | Flavobacteria | ~49 | 5 | 7 | 4 | >100 (including the teardrop-like extensions) | ||||
| Chitinophaga pinensis | Chitinophagia | ~61 | 11 | 12 | 3 | 81 | ||||
Table 2
The different bacterial strains used in this study.
| Species | Strain | Relevant references |
|---|---|---|
| Shewanella oneidensis | MR-1 211,586 | Subramanian et al., 2018; Kaplan et al., 2019a; Kaplan et al., 2019b |
| Pseudoaltermonas luteoviolacea | 43,657 | Shikuma et al., 2014 |
| Hylemonella gracilis | ATCC 19624 887,062 | Kaplan et al., 2020; Chen et al., 2011; Kaplan et al., 2021b |
| Delftia acidovorans | Cs1-4 80,866 | Shetty et al., 2011 |
| Magnetospirillum magneticum | AMB-1 342,108 | Cornejo et al., 2016 |
| Caulobacter crescentus | NA1000 | Kaplan et al., 2021c |
| Helicobacter hepaticus | ATCC 51449 235,279 | Chen et al., 2011 |
| Helicobacter pylori | 26,695 | Chang et al., 2018 |
| Myxococcus xanthus | DK1622 | Chang et al., 2016 |
| Borrelia burgdorferi | B31 224,326 | Briegel et al., 2009; Chen et al., 2011 |
| Flavobacterium johnsoniae | CJ2618 | This study |
| Flavobacterium anhuiense | 98 | Carrión et al., 2019 |
| Chitinophaga pinensis | 94 | Carrión et al., 2019 |
Table 3
Numbers of tubes identified in different Helicobacter pylori mutants.
Note that the approximation symbol before the number of cells indicates that in many tomograms we only see a part of the cell(s).
| Mutant | Number of cells | Number of tubes |
|---|---|---|
| H. pylori ∆fliG fliP* | ~47 | 12 |
| H. pylori ∆fliM fliP* | ~265 | 88 |
| H. pylori ∆fliO fliP* | ~267 | 49 |
| H. pylori ∆fliQ fliP* | ~220 | 55 |
| H. pylori ∆flgS fliP* | ~84 | 15 |
Additional files
Download links
A two-part list of links to download the article, or parts of the article, in various formats.
Downloads (link to download the article as PDF)
Open citations (links to open the citations from this article in various online reference manager services)
Cite this article (links to download the citations from this article in formats compatible with various reference manager tools)
In situ imaging of bacterial outer membrane projections and associated protein complexes using electron cryo-tomography
eLife 10:e73099.
https://doi.org/10.7554/eLife.73099


