Monitoring single-cell dynamics of entry into quiescence during an unperturbed life cycle
- Department of Developmental Biology and Stem Cells, Institut de Génétique et de Biologie Moléculaire et Cellulaire, France
- Centre National de la Recherche Scientifique, France
- Institut National de la Santé et de la Recherche Médicale, France
- Université de Strasbourg, France
- Institut de Biochimie et Génétique Cellulaires, UMR 5095 CNRS - Université de Bordeaux, Bordeaux, France, France
Figures
Figure 1 with 5 supplements
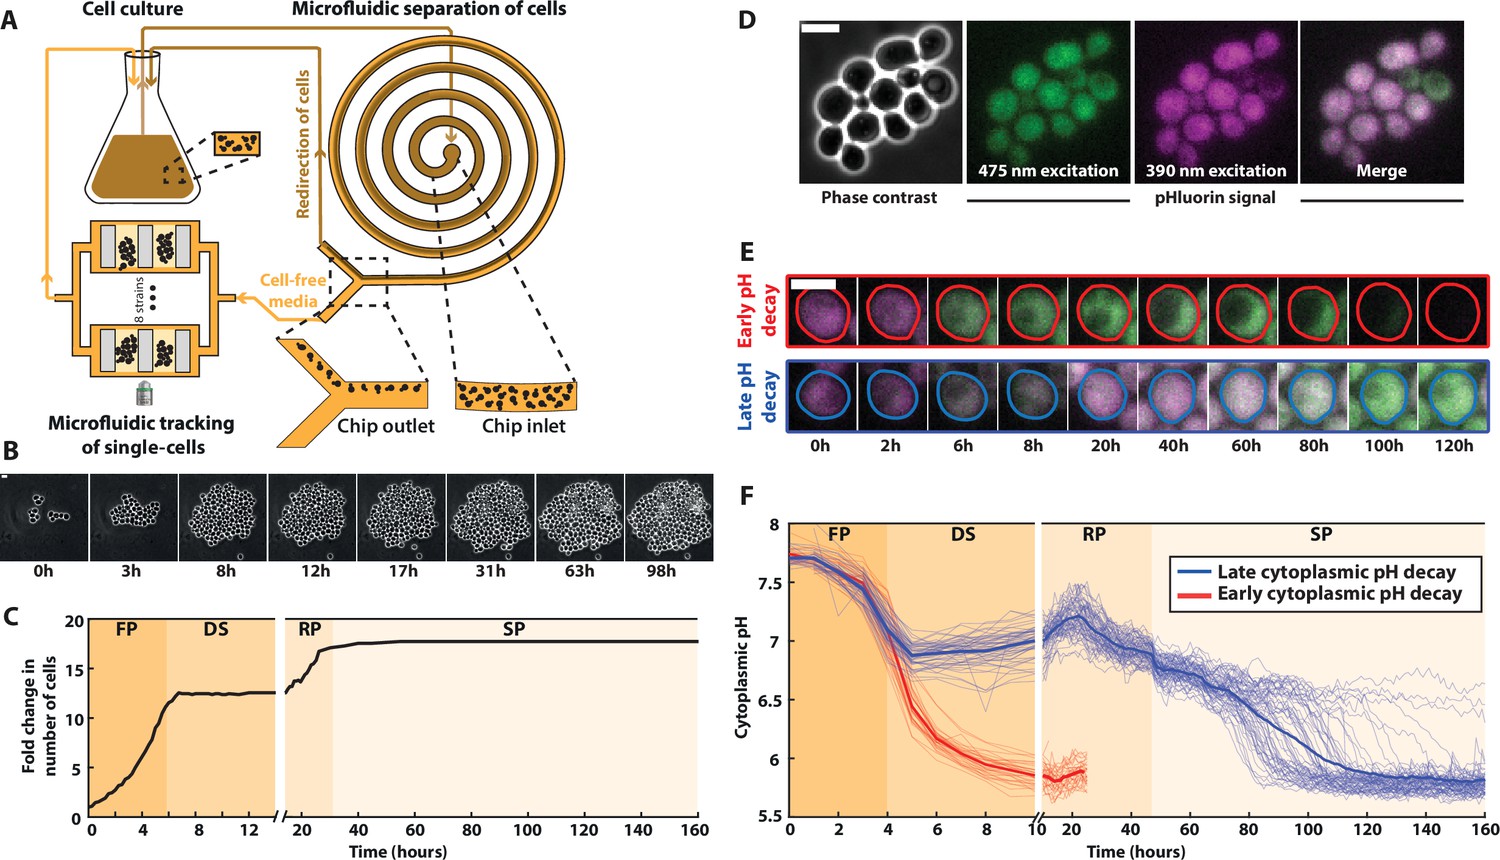
A microfluidic platform for single-cell tracking during the yeast proliferation cycle.
(A) Schematics of the experimental setup, representing the liquid culture flask, the observation microfluidic device with trapped cells, and the microfluidic filtering device designed to redirect the cells back to the liquid culture while recirculating the medium of the liquid culture to the observation microfluidic chamber. (B) Sequence of phase-contrast images of cells growing in the microfluidic device. Scale bar = 5 μm. (C) Fold increase in cell number over an entire life cycle for the microcolony displayed in B; each shaded area represents a distinct proliferation phase, which was determined using piecewise linear fitting to cell proliferation data (see Materials and methods and Figure 1—figure supplement 1G for details): fermentation phase (FP), diauxic shift (DS), respiration phase (RP), and stationary phase (SP). (D) Cluster of cells showing typical phase-contrast, fluorescence, and overlay images using the cytoplasmic pH sensor pHluorin. (E) Typical sequences of overlaid fluorescence images obtained with the pHluorin sensor at indicated time points. Colored lines indicate cell contours. (F) Quantification of the absolute cytoplasmic pH as a function of time; each line represents an individual cell, while the bold line indicates the average among cells with either an early (red lines, N = 32 cells displayed) or late (blue line, N = 64 cells displayed) decaying pH.
-
Figure 1—source data 1
Spreadsheet containing the numerical values used to plot panels 1C and D.
- https://cdn.elifesciences.org/articles/73186/elife-73186-fig1-data1-v2.xlsx
Figure 1—figure supplement 1
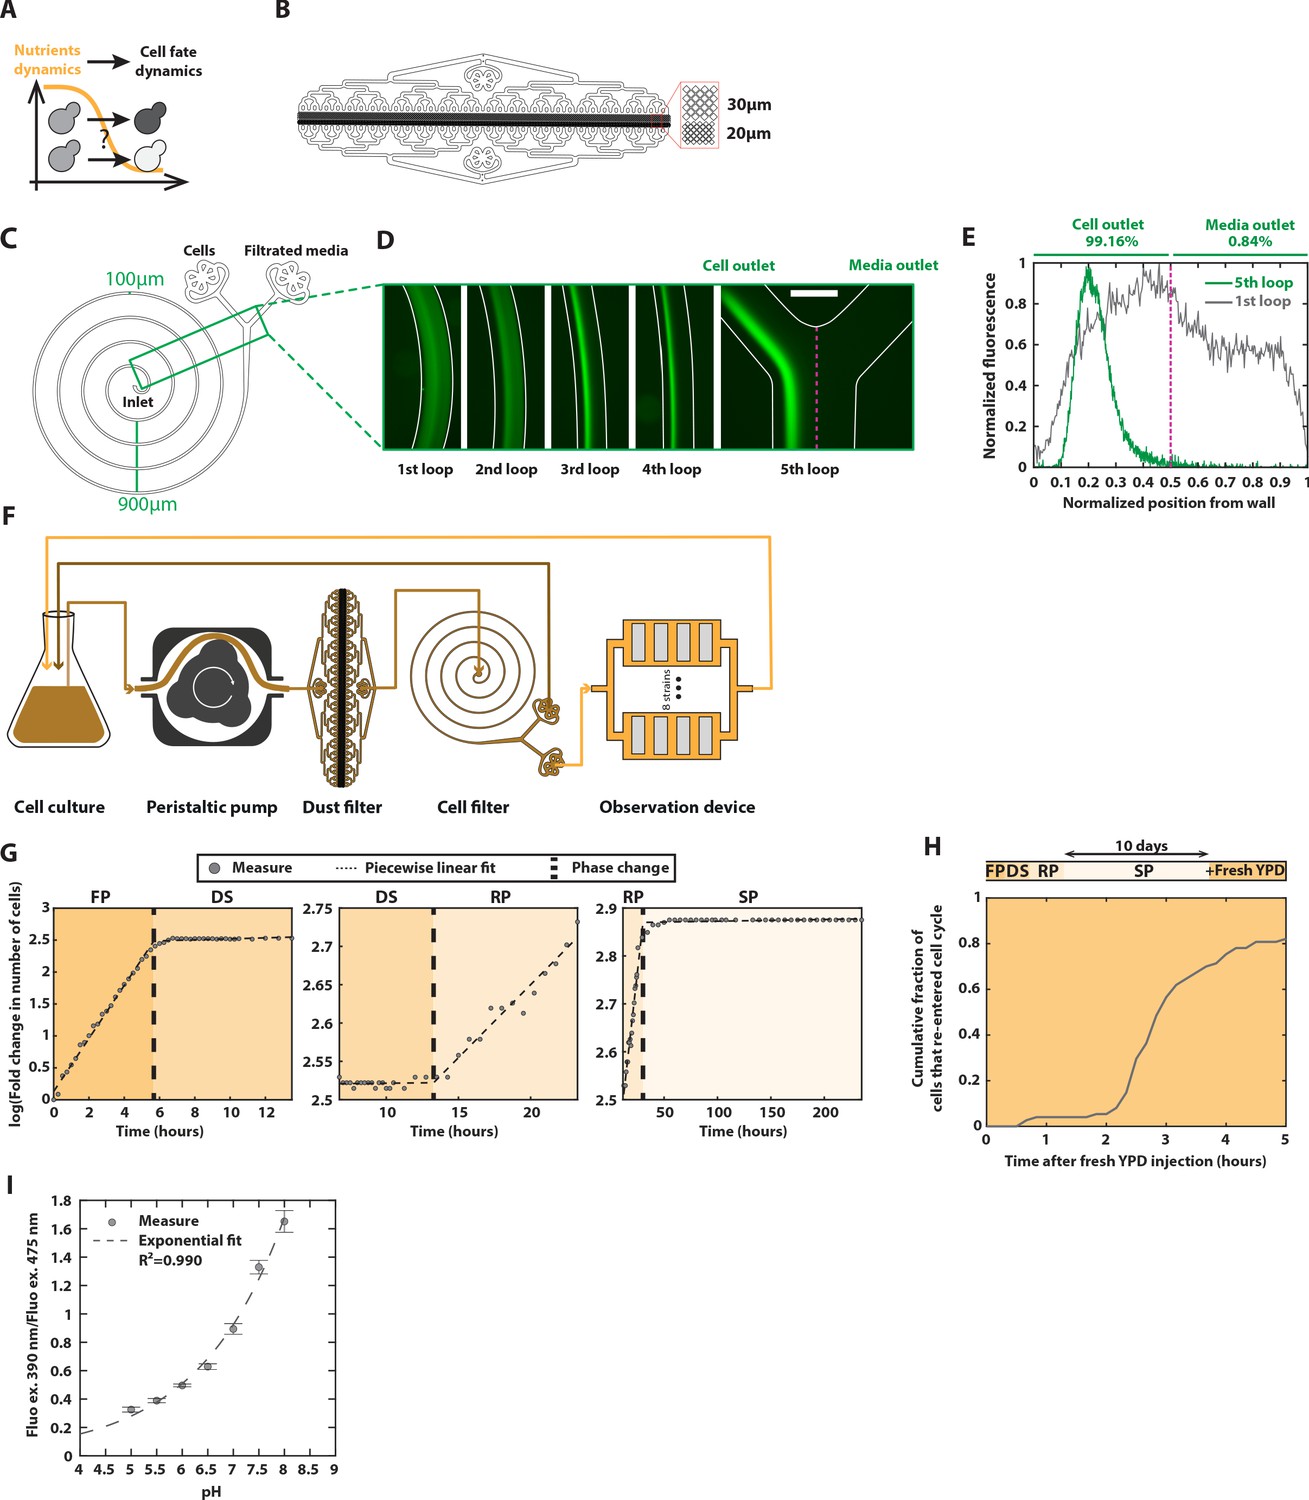
Design and calibration of the experimental setup.
(A) Schematics representing the main question addressed in this study, namely how the natural dynamics of environmental changes shapes nonuniform cellular responses and induces distinct cellular fates in a clonal population. (B) Schematics of the dust filter device, including a closeup of withe debris retention arrays of 30 and 20 µm size. (C) Schematics of the cell-filtering device, made of a spiraling channel with five loops of 100 µm width, separated by 900 µm. (D) Sample fluorescence images of TDH3-GFP cells at different positions in the filtering device. Each image represents the indicated loop. The magenta dotted line represents the middle of the channel. Scale bar = 150 µm. (E) Fluorescence profile of the first loop (gray) and fifth loop (green) along the channel’s cross-section. The value is normalized to the maximum of each condition. In the upper part is displayed the cumulative signal on each side of the channel of the fifth loop. (F) Schematics of the whole closed-loop fluidic platform. The flask is connected to a peristaltic pump, which drives media flows to the dust filter. The dust-free media then flows into the inlet of the spiral. The cell outlet of the spiral is redirected into the flask while the cell-free outlet irrigates the observation device. To close the loop, the outlet of the observation device is connected to the flask. (G) Determination of the culture metabolic phases during the yeast life cycle based on the evolution of cell number over time. A piecewise linear fit on the number of cells defines the limit between fermentation phase (FP) and diauxic shift (DS; left), DS and respiration phase (RP; middle), or RP and stationary phase (SP; right). Gray dots represent the measured number of cells in one microcolony, thin dashed lines represent the line fits and vertical dashed lines the transition time. Each shaded area represents a distinct proliferation phase, as indicated in the legend. (H) Cumulative fraction of cells reentering the cell cycle after 10 days in SP over time, upon refeeding with YPD medium (N = 60). (I) Calibration curve of the pHluorin probe Gray dots represent the ratio of fluorescence collected at 390 nm over the fluorescence collected at 475 nm excitations, error bars represent the standard deviation (N = 20). The dashed line corresponds to an exponential fit f(x) = a × exp(b × x) of parameters (with 95 % confidence bounds): a = 0.01419 (0.005774, 0.0226) and b = 0.5967 (0.5174, 0.6761).
Figure 1—figure supplement 2
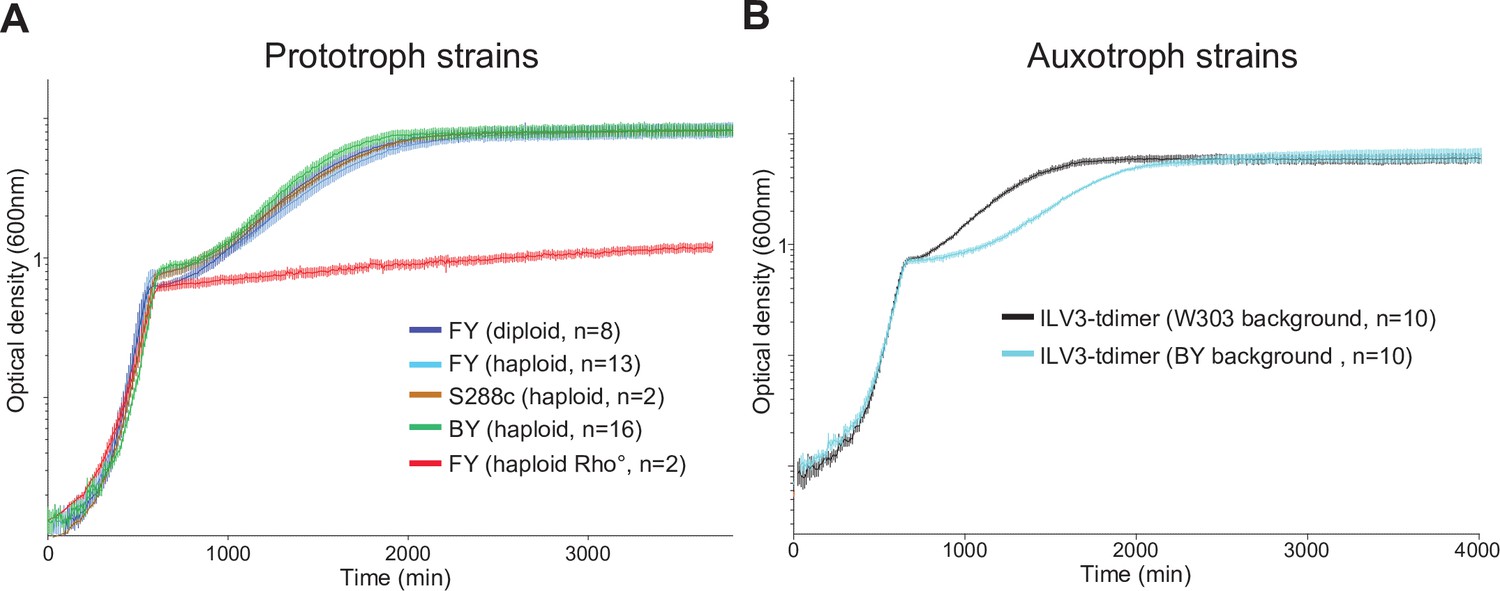
Population measurements of cell growth during an entire life cycle.
Growth curves comparison between prototrophs FY, S288c, and BY (A) and auxotrophs W303 and BY Ilv3-tdimer expressing strains (B). Haploid FY Rho (red curve) is unable to respire and stop proliferating after carbon fermentation. Automated turbidity measurement was done using the Bioscreen C device (Labsystems). Strains were maintained 24 hr in exponential phase in rich medium supplemented with Adenine (YPDA) at 30°C, then inoculated into the microplates at OD600m = 0.01, 150 μl YPDA, 30 °C. Yeasts were grown at continuous agitation, with absorbances reading every 10 min during 3 days.
Figure 1—figure supplement 3
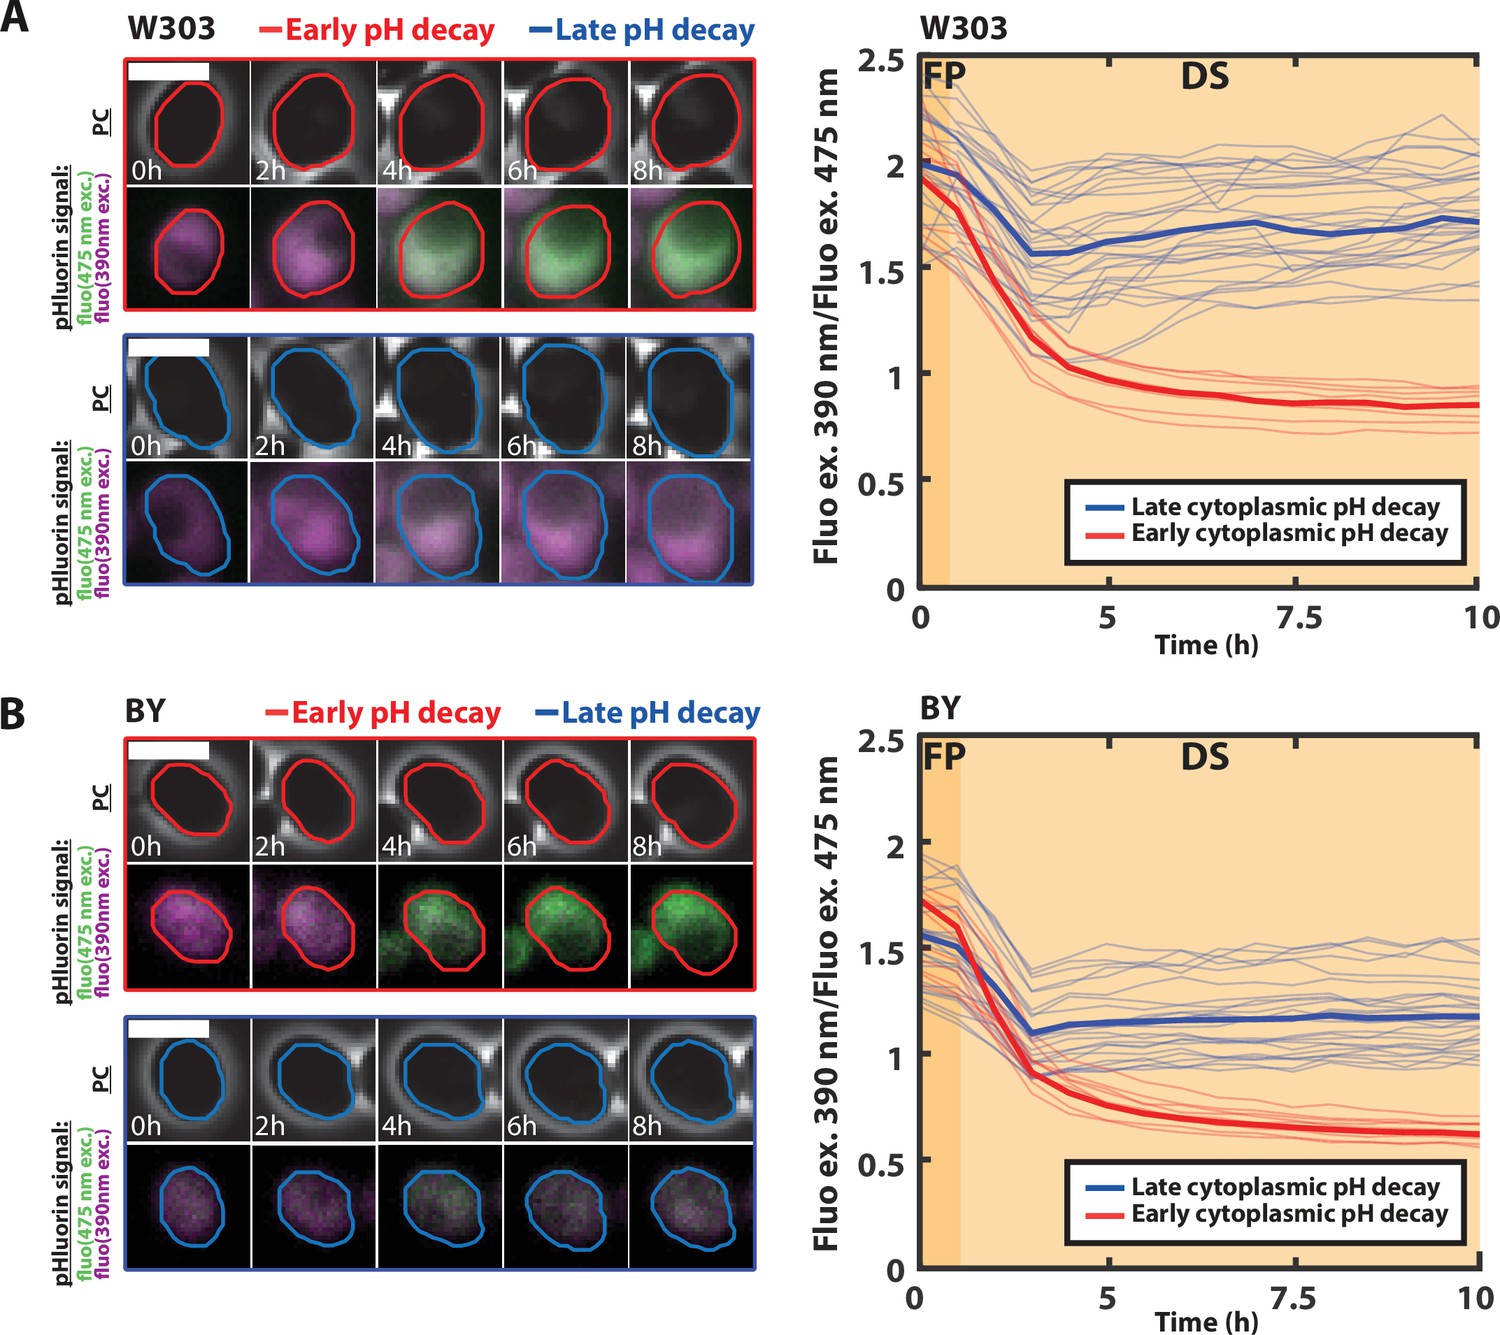
Single-cell dynamics of entry into stationary phase in BY versus W303 strains.
(A) Left: typical sequence of phase-contrast and fluorescence images for W303 cells that display (respectively, do not display) an early pH decay upon the diauxic shift (DS; red and blue cell contours, respectively). The fluorescence image displays an overlay of fluorescence images obtained using indicated excitation wavelengths. Right: quantification of the raw (i.e., uncalibrated) ratio of the fluorescence level obtained using indicated excitation wavelength. The colored shading indicates the fermentation phase (FP) and the DS. N > 30 cells. (B) Same as A, but using the BY strain as a control. N > 30 cells.
Figure 1—video 1
Top: phase-contrast video of a microcolony growing in the observation device during the life cycle of the culture.
Bottom: fold increase in the number of cells during colony proliferation. The colored progress bar indicates the metabolic phase of the culture as defined in Figure 1. Scale bar: 6.3 µm.
Figure 1—video 2
Top: phase-contrast (left) and pHluorin (right, channels 1 and 2 merged as in Figure 1) video of a microcolony growing in the observation device during the life cycle of the culture.
Figure 2 with 2 supplements
Divergent cell fates induced by a metabolic challenge at the diauxic shift (DS).
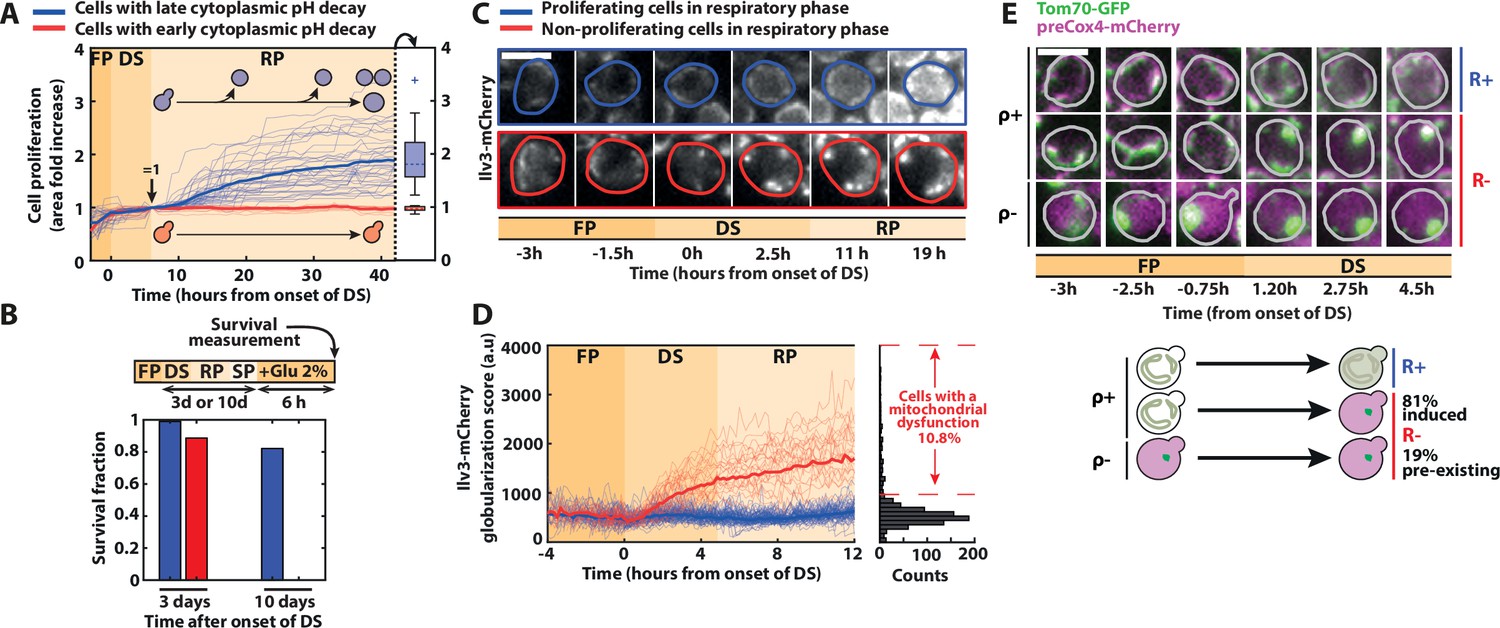
(A) Quantification of single-cell growth during F, DS, and R phases, as defined in Figure 1. Each line represents the fold area increase (including buds) of single cells over time, normalized by cell area at the end of the DS (N = 50). The bold lines represent the averages over all the cells that experience fast (red) and slow (blue) pH decay, respectively. Right: box plot indicating the fold increase in cellular area in each subpopulation during the R phase (N = 40 for the slow pH decay population, N = 10 for the fast pH decay population). (B) Fraction of surviving cells among adapting (blue bars) and nonadapting (red bars) cells, measured by quantifying the cells’ ability to resume growth 6 hr after reintroduction of fresh medium (2 % glucose) at 3 (N = 53 for red bars, N = 221 for blue bars) or 10 days (N = 114 for red bars, N = 403 for blue bars) after the DS. Scale bar = 5 µm. (C) Representative sequence of fluorescence images obtained with the Ilv3-mCherry mitochondrial marker at the indicated time points for the different classes of cells, as indicated by the colored contour. (D) Single-cell quantification of a globularization score (see Materials and methods) from fluorescence images over time for both adapting (blue line; N = 81) and nonadapting cells (red line; N = 28). The bold lines represent averages within each subpopulation. Right: histogram of globularization score for each cell (N = 720). (E) Preexisting versus newly occurring respiratory defects in cells experiencing the DS Sequence of fluorescent images (overlay of preCox4-mCherry and Tom70-GFP) at indicated times. Scale bar = 5 µm. Each line represents a different type of cell fates (top: ρ+ R+ ; middle: ρ+ R−; bottom: ρ− R−). Schematics: representation of the different cell fates based on the fluorescence patterns of preCox4-mCherry and Tom70-GFP, with the quantification of the fraction of each subpopulation (N = 701).
-
Figure 2—source data 1
Spreadsheet containing the numerical values used to plot panels 2A and D.
- https://cdn.elifesciences.org/articles/73186/elife-73186-fig2-data1-v2.xlsx
Figure 2—figure supplement 1
Complementary analyses of the divergent cell fate at the diauxic shift.
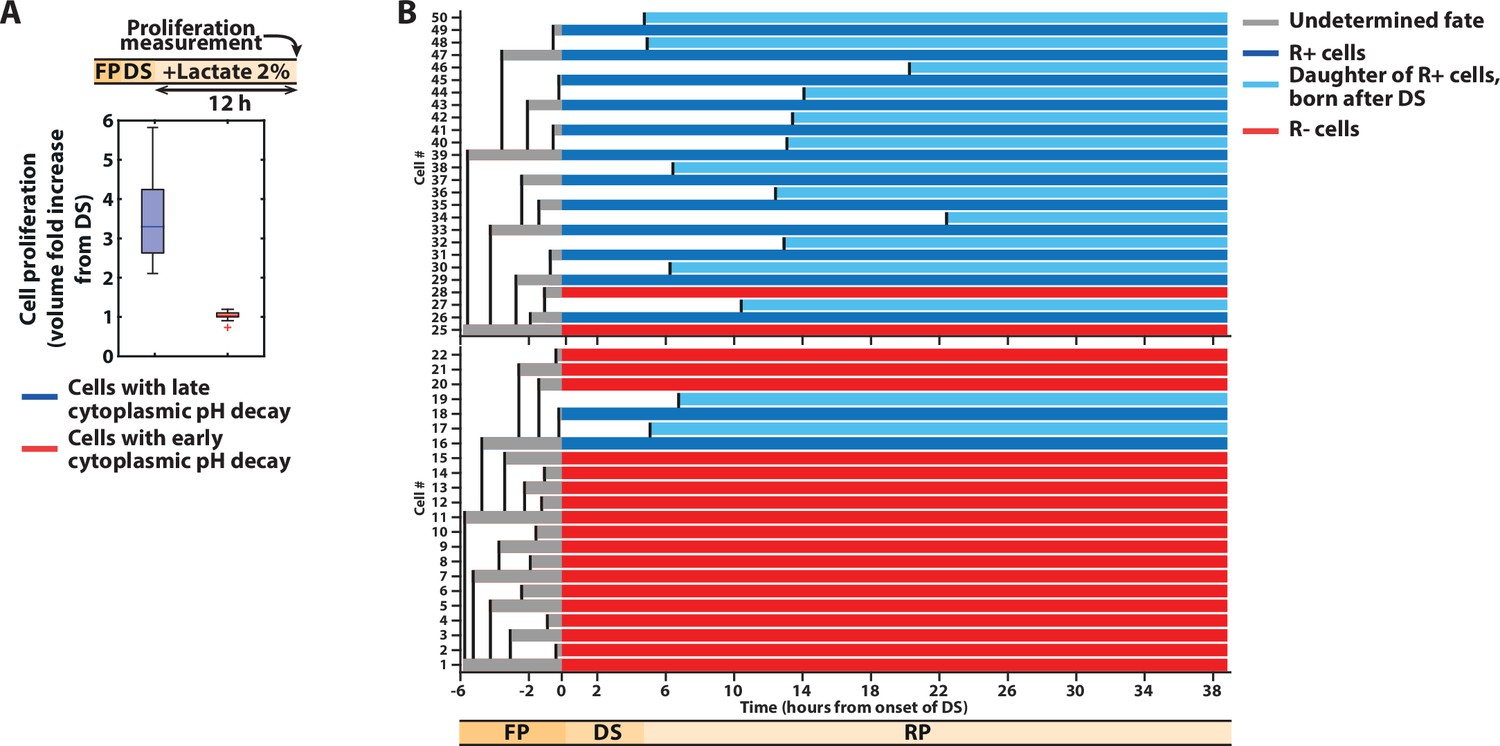
(A) Proliferation capacity in a respirative media. Box plots indicate the fold increase in cell area from the diauxic shift (DS) in each subpopulation (blue and red lines for cells with a late or early cytoplasmic pH decay, respectively), after a 12 hr exposure to a 2 % lactate respirative media after the DS (N = 30 for each box plot). (B) Inheritance of the R+ and R− phenotypes. Sample pedigrees representing two single cells (#1 and #25) and their progeny; each horizontal bar represents a cell. Cells reveal their respiratory status at the DS, hence are displayed in gray before the DS, and red (for R−) or blue (R+) after the DS. Daughters born after DS are represented in light blue. Only the first daughter of mothers born before the DS are represented for clarity.
Figure 2—video 1
Phase-contrast (left) and Ilv3-mCherry (right) video of a microcolony growing in the observation device during the life cycle of the culture.
The colored progress bar indicates the metabolic phase of the culture as defined in Figure 1. The thick red and blue contours indicate original R− and R+ cells, respectively, while the thin red and blue contours indicate the daughters of the original cells. Scale bar: 6.3 µm.
Figure 3 with 2 supplements
pH-driven phase transition to a gel-like state upon proliferation cessation.
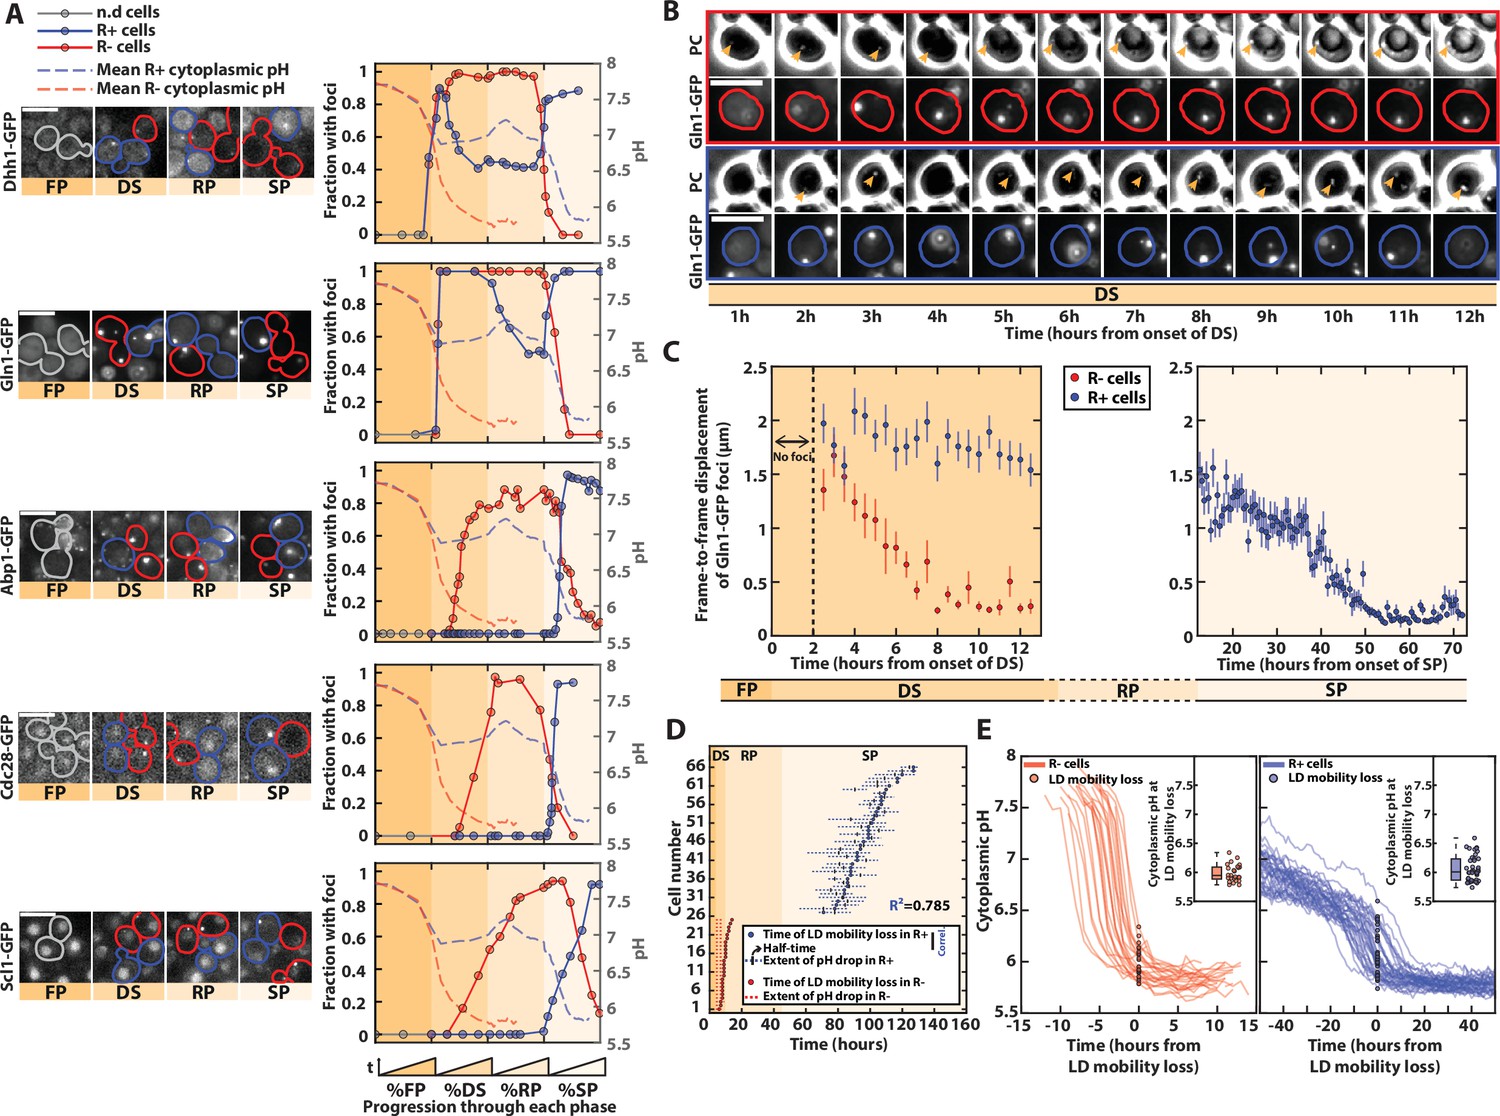
(A) Observation and quantification of fluorescent foci formation for the indicated fusion proteins (Dhh1-GFP, Gln1-GFP, Abp1-GFP, Cdc28-GFP, and Scl1-GFP). Left: each strip of fluorescence images displays unrelated cells at different phases during entry into stationary phase (SP). Colored contours indicate cells of interest (red for R− cells, blue for R+ cells, gray before the diauxic shift [DS]). Right: quantification of the fraction of cells with foci for each indicated fluorescent marker, as a function of the normalized time spent in each phase. Each solid colored line represents an indicated subpopulation of cells. The dashed colored lines represent the evolution of pH over time, based on data obtained in Figure 1; N > 25 cells for each marker. Scale bar = 5 µm. (B) Mobility of Gln1-GFP fluorescent foci and observation of lipid droplets (LDs). Sequence of phase-contrast and Gln1-GFP fluorescence images at indicated time points. The colored contours indicate the cells of interest (red and blue for R− and R+ cells, respectively). The orange arrowheads on the phase-contrast images indicate the LD. Scale bar = 5 µm. (C) Mobility of Gln1-GFP fluorescent foci. Quantification of average frame-by-frame displacement of Gln1-GFP foci for R+ and R− cells (blue and red points, respectively) starting after the appearance of foci (t > 2 hr after the onset of DS). Error bars represent the standard error on mean (N = 51 for R− and N = 110 for R+). The right plot only features R+ cells, since Gln1-GFP foci are no longer present in the SP phase in R− cells (N = 28). (D) Temporal link between the drop in internal pH and the time of mobility loss of LD (N = 25 for R− and N = 43 for R+). Each line corresponds to a single cell and represents the extent of pH drop (see Material and methods for details). Half-times of these drops are represented by a small vertical bar. The time of LD mobility loss is displayed as a dot. Of note, two cells did not display a pH drop, nor an LD mobility loss, hence they are not displayed on the plot. (E) Measurement of internal pH at the time of LD mobility loss. Overlay of internal pH in single cells obtained after synchronizing all traces with respect to the time of LD mobility loss, for R− (left) and R+ cells (right). Each dot represents the pH at the time of mobility loss in each cell (N = 25 for R− and N = 43 for R+). Inset: box plot showing the distribution of pH values of every single cell at the time of LD mobility loss.
-
Figure 3—source data 1
Spreadsheet containing the numerical values used to plot panel 3A.
- https://cdn.elifesciences.org/articles/73186/elife-73186-fig3-data1-v2.xlsx
-
Figure 3—source data 2
Spreadsheet containing the numerical values used to plot panels 3D and E for R+ cells.
- https://cdn.elifesciences.org/articles/73186/elife-73186-fig3-data2-v2.xlsx
-
Figure 3—source data 3
Spreadsheet containing the numerical values used to plot panels 3D and E for R− cells.
- https://cdn.elifesciences.org/articles/73186/elife-73186-fig3-data3-v2.xlsx
Figure 3—figure supplement 1
Coincidence of lipid droplets and Gln1-GFP foci mobility.
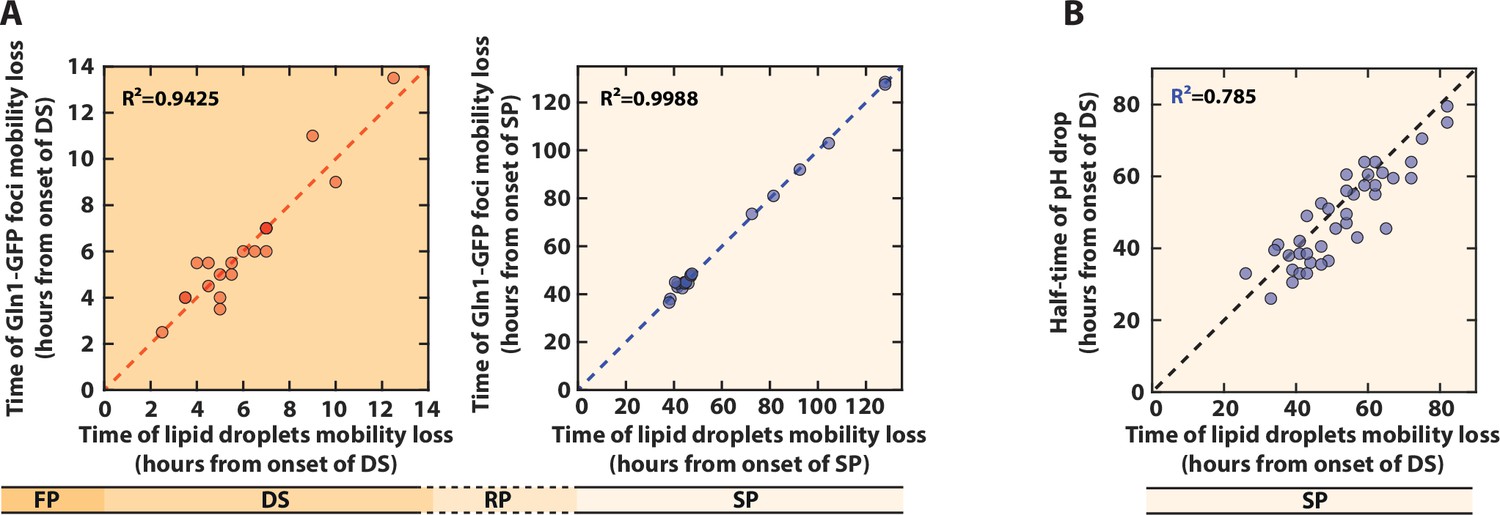
(A) Correlation of the time of mobility loss of Gln1-GFP foci with that of the lipid droplet (LD) in R− (left plot) or R+ (right plot) cells. The origin of time is set as the proliferation arrest for each type of cells, that is the onset of diauxic shift (DS) and the onset of stationary phase (SP), respectively. The dashed lines represent the diagonal. (B) Correlation of the half-time of the pH drop with the time of LD mobility loss in R+ cells. The time origin the onset of SP. The dashed lines represent the diagonal.
Figure 3—video 1
Phase-contrast (left) and Gln1-GFP (right) video of a microcolony growing in the observation device from fermentation phase to respiration phase.
The colored progress bar indicates the metabolic phase of the culture as defined in Figure 1. The red and blue contours indicate R− and R+ cells, respectively. Scale bar: 6.3 µm.
Tables
Key resources table
| Reagent type (species) or resource | Designation | Source or reference | Identifiers | Additional information |
|---|---|---|---|---|
| Strain, strain background(S. cerevisiae, BY, mat a) | WT | Euroscarf; PMID:9483801 | ||
| Strain, strain background(S. cerevisiae, BY, mat a) | BJQ-3 | Thermo Fisher; PMID:14562095 | ||
| Strain, strain background(S. cerevisiae, BY, mat a) | BJQ-7 | Thermo Fisher; PMID:14562095 | ||
| Strain, strain background(S. cerevisiae, BY, mat a) | BJQ-28 | Thermo Fisher; PMID:14562095 | ||
| Strain, strain background(S. cerevisiae, BY, mat a) | BJQ-23 | Thermo Fisher; PMID:14562095 | ||
| Strain, strain background(S. cerevisiae, BY, mat a) | BJQ3-3 | Thermo Fisher; PMID:14562095 | ||
| Strain, strain background(S. cerevisiae, BY, mat a) | Y10794 | Sagot Lab; PMID:18504300 | ||
| Strain, strain background(S. cerevisiae, BY, mat a) | YSF120-9D | Charvin Lab; PMID:24332850 | ||
| Strain, strain background(S. cerevisiae, BY, mat a) | BJ2-44 | Thermo Fisher; PMID:14562095 | ||
| Strain, strain background(S. cerevisiae, BY, mat alpha) | Y11453 | This paper | Results from a cross between Y11314 (Daignan-Fornier lab) and Y11453 | |
| Strain, strain background(S. cerevisiae, S288C, mat alpha) | Y2658 | Daignan-Fornier Lab; PMID:19795422 | ||
| Strain, strain background(S. cerevisiae, FY, mat a) | Y2438 | Daignan-Fornier Lab; PMID:7762301 | ||
| Strain, strain background(S. cerevisiae, FY, mat a) | Y2439 | Daignan-Fornier Lab; PMID:7762301 | ||
| Strain, strain background(S. cerevisiae, FY, mat a/alpha) | Y12322 | This paper | Results from a cross between Y2438 and Y2439 | |
| Strain, strain background(S. cerevisiae, FY, mat a) | Y5738 | Sagot Lab; PMID:30299253 | ||
| Strain, strain background(S. cerevisiae, W303, mat a) | Y8037 | Sagot Lab; PMID:24338369 | ||
| Strain, strain background(S. cerevisiae, BY, mat a) | Y6735 | Sagot Lab; PMID:24338369 | ||
| Strain, strain background(S. cerevisiae, W303, mat alpha) | BJQ-11 | Alberti Lab; PMID: PMID:27003292 |
Additional files
-
Transparent reporting form
- https://cdn.elifesciences.org/articles/73186/elife-73186-transrepform1-v2.docx
-
Supplementary file 1
Strain table.
- https://cdn.elifesciences.org/articles/73186/elife-73186-supp1-v2.xlsx
Download links
A two-part list of links to download the article, or parts of the article, in various formats.
Downloads (link to download the article as PDF)
Open citations (links to open the citations from this article in various online reference manager services)
Cite this article (links to download the citations from this article in formats compatible with various reference manager tools)
Monitoring single-cell dynamics of entry into quiescence during an unperturbed life cycle
eLife 10:e73186.
https://doi.org/10.7554/eLife.73186


