Apelin signaling dependent endocardial protrusions promote cardiac trabeculation in zebrafish
- Department of Developmental Genetics, Max Planck Institute for Heart and Lung Research, Germany
Figures
Figure 1 with 4 supplements

Stages of endocardial-myocardial interactions during zebrafish heart development.
(A-D) Confocal projection images of the heart of Tg(myl7:mCherry-CAAX); Tg(cdh5:Gal4ff); Tg(UAS:LIFEACT-GFP) zebrafish at 24 (A), 48 (B), 60 (C) and 72 (D) hpf. (A-A’’) Endocardial protrusions (arrows) towards the myocardium at 24 hpf. (B-B’’) Endocardial protrusions (arrows) and touchdowns (asterisks) with the myocardium at 48 hpf. (C-C’’’) Endocardial protrusions (arrows) during CM delamination (arrowheads) at 60 hpf. (C’’’) 3D surface rendering of the area in the yellow box in C’. (D-D’’’) Endocardial protrusions (arrows) during trabecular assembly and expansion (arrowheads) at 72 hpf. (D’’’) 3D surface rendering of the area in the yellow box in D’. (A’’’’-D’’’’) Schematics of endocardial protrusions, endocardial touchdowns, CM delamination, and trabecular expansion. Black asterisks indicate delaminating CMs; purple asterisks indicate trabeculae. (E-H) Still images from a spinning disc time-lapse movie of a 48 hpf Tg(myl7:mCherry-CAAX); Tg(cdh5:Gal4ff); Tg(UAS:LIFEACT-GFP) heart; white asterisks indicate endocardial touchdowns; numbers in the bottom right corner refer to seconds. All images are ventral views, anterior to the top. V, ventricle; A, atrium.
Figure 1—figure supplement 1
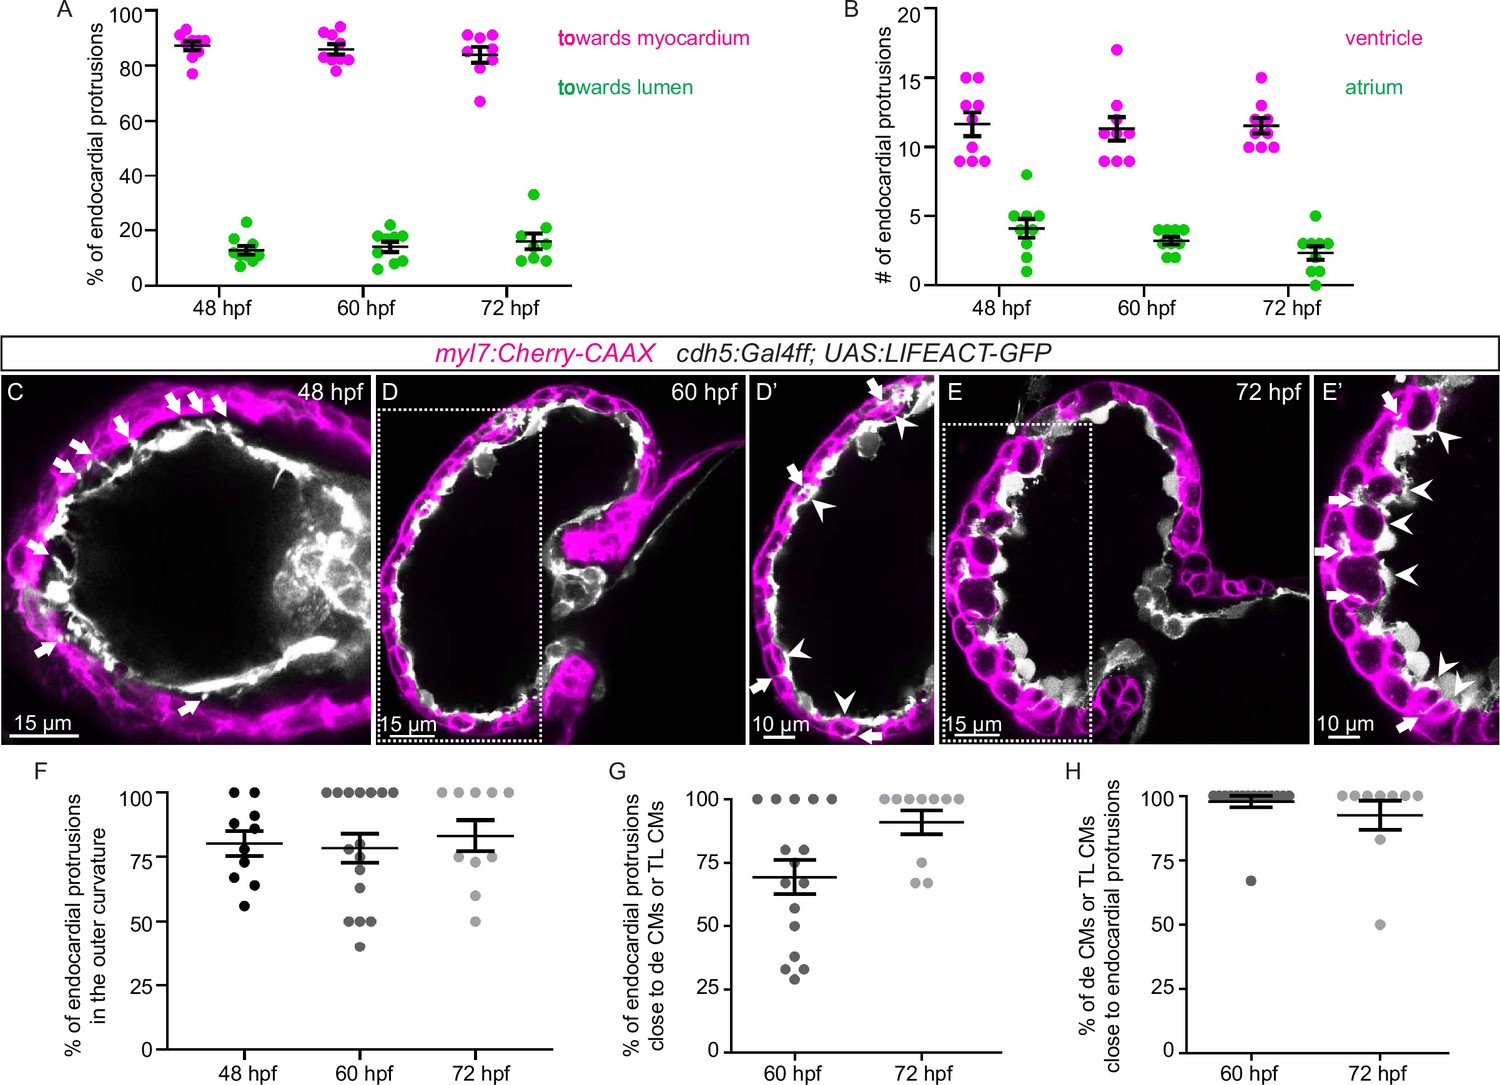
Endocardial protrusions in the ventricle are mostly located in the outer curvature and are close to delaminating or trabecular cardiomyocytes (CMs).
(A) Quantification of the direction of endocardial protrusions; most endocardial protrusions extend toward the myocardium. (B) Quantification of the average number of endocardial protrusions in the ventricle and atrium. (C–D) Confocal projection images of the heart of Tg(myl7:mCherry-CAAX); Tg(cdh5:Gal4ff); Tg(UAS:LIFEACT-GFP) zebrafish at 60 (C) and 72 (D) hours post-fertilization (hpf). Arrows point to endocardial protrusions; arrowheads point to delaminating CMs and trabecular CMs close to endocardial protrusions. (E) Quantification of the percentage of endocardial protrusions in the outer curvature of the ventricle. (F) Quantification of the percentage of endocardial protrusions in close proximity to delaminating CMs or trabecular CMs. (G) Quantification of the percentage of delaminating CMs or trabecular CMs in close proximity to endocardial protrusions. de CM, delaminating CM; TL CM, trabecular layer CM.
Figure 1—video 1
Endocardial touchdowns during cardiac contraction.
Related to Figure 1E–H. Beating 48 hours post-fertilization (hpf) zebrafish heart. Magenta, myocardium; white, endocardium.
Figure 1—video 2
Endocardial protrusions extend along delaminating cardiomyocytes (CMs) at 60 hours post-fertilization (hpf).
Related to Figure 1C’’’. 3D surface rendering of a 60 hpf ventricle. Magenta, myocardium; white, endocardium; yellow, endocardial protrusions extending along delaminating CMs.
Figure 1—video 3
Endocardial protrusions are in close proximity to trabecular cardiomyocytes (CMs) at 72 hours post-fertilization (hpf).
Related to Figure 1D’’’. 3D surface rendering of a 72 hpf ventricle. Magenta, myocardium; white, endocardium; yellow, endocardial protrusions in close proximity to trabecular CMs.
Figure 2
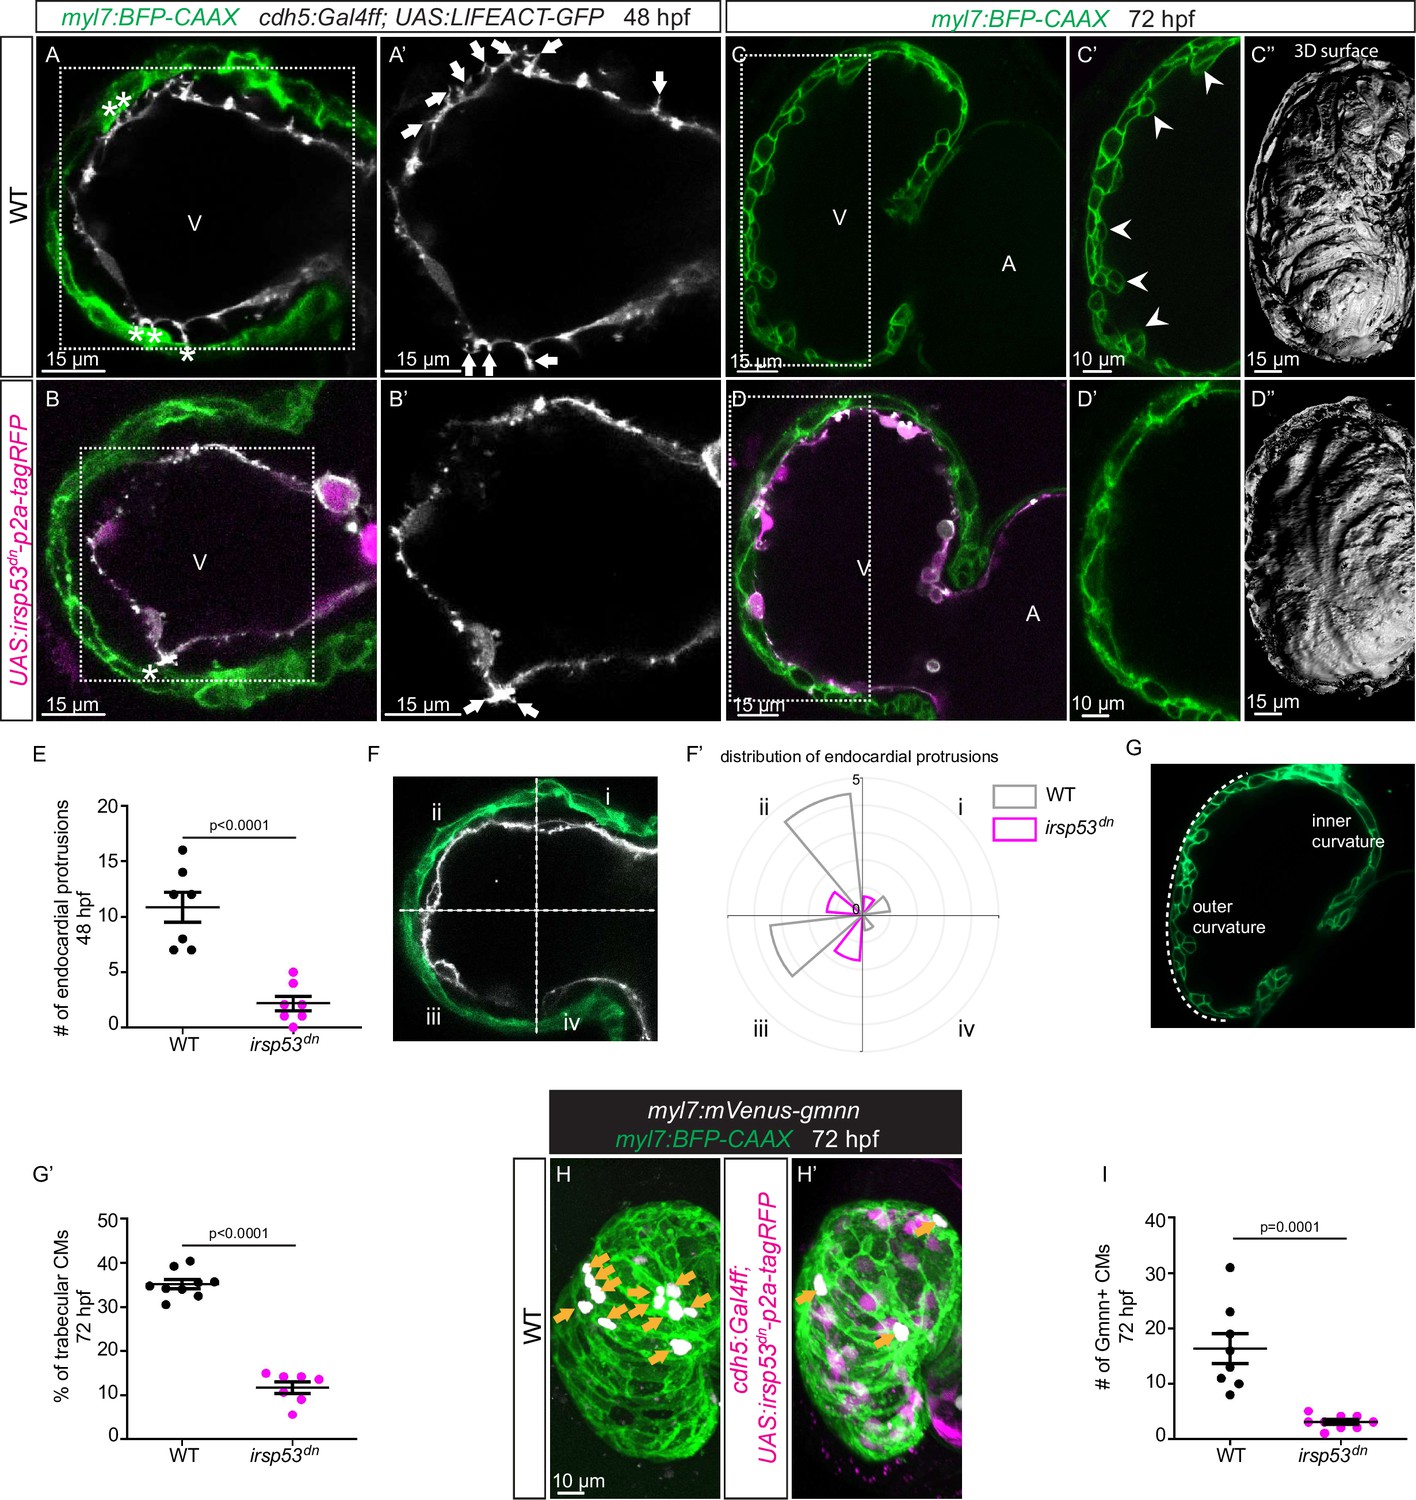
Blocking endocardial protrusion formation reduces cardiac trabeculation.
(A–D) Confocal projection images of the heart of Tg(myl7:BFP-CAAX); Tg(cdh5:Gal4ff); Tg(UAS:LIFEACT-GFP);±Tg(UAS:irsp53dn-p2a-tagRFP) zebrafish at 48 (A–B) and 72 (C–D) hours post-fertilization (hpf). (A–B) Endocardial protrusions (white arrows) and touchdowns (white asterisks) are reduced in embryos with endothelial overexpression of irsp53dn. (C–D) Cardiac trabeculation (arrowheads) is reduced in larvae with endothelial overexpression of irsp53dn; (C’–D) 3D rendering. (E) Quantification of the number of endocardial protrusions in wild-type and in embryos with endothelial overexpression of irsp53dn at 48 hpf. (F-F’) Illustration of the division of the 48 hpf ventricle into four regions (F). Distribution and average number of endocardial protrusions in different regions of mid-sagittal sections of the ventricle from 48 hpf wild-type and irsp53dn embryos (F’). (G–G’) Illustration of the division of the 72 hpf ventricle into the outer and inner curvature (G). Quantification of the percentage of trabecular cardiomyocytes (CMs) in the outer curvature of wild-type and irsp53dn larvae at 72 hpf (G’). (H–H’) 72 hpf larvae with endothelial overexpression of irsp53dn display a reduced number of myl7:mVenus-Gmnn+ CMs (yellow arrows) in their ventricle. (I) Quantification of the number of mVenus-Gmnn+ CMs in the ventricle of wild-type and irsp53dn larvae at 72 hpf. All images are ventral views, anterior to the top. V, ventricle; A, atrium. Data in graphs expressed as mean ± SEM.
Figure 3

Expression pattern of Apelin signaling pathway components.
(A–D) Confocal projection images of the heart of TgBAC(apln:EGFP); Tg(myl7:MKATE-CAAX) (A, B) and TgBAC(aplnrb:VenusPEST); Tg(kdrl:HsHRAS-mCherry) (C, D) zebrafish at 48 (A, C) and 72 (B, D) hours post-fertilization (hpf). (A’–’D’) Maximum intensity projections. (A–B) TgBAC(apln:EGFP) expression is detectable in the myocardium at 48 (A) and 72 (B) hpf. (C–D) TgBAC(aplnrb:VenusPEST) expression is detectable in the endocardium with higher expression in the ventricular endocardium at 48 (C) and 72 (D) hpf. All images are ventral views, anterior to the top. V, ventricle; A, atrium.
Figure 4 with 6 supplements
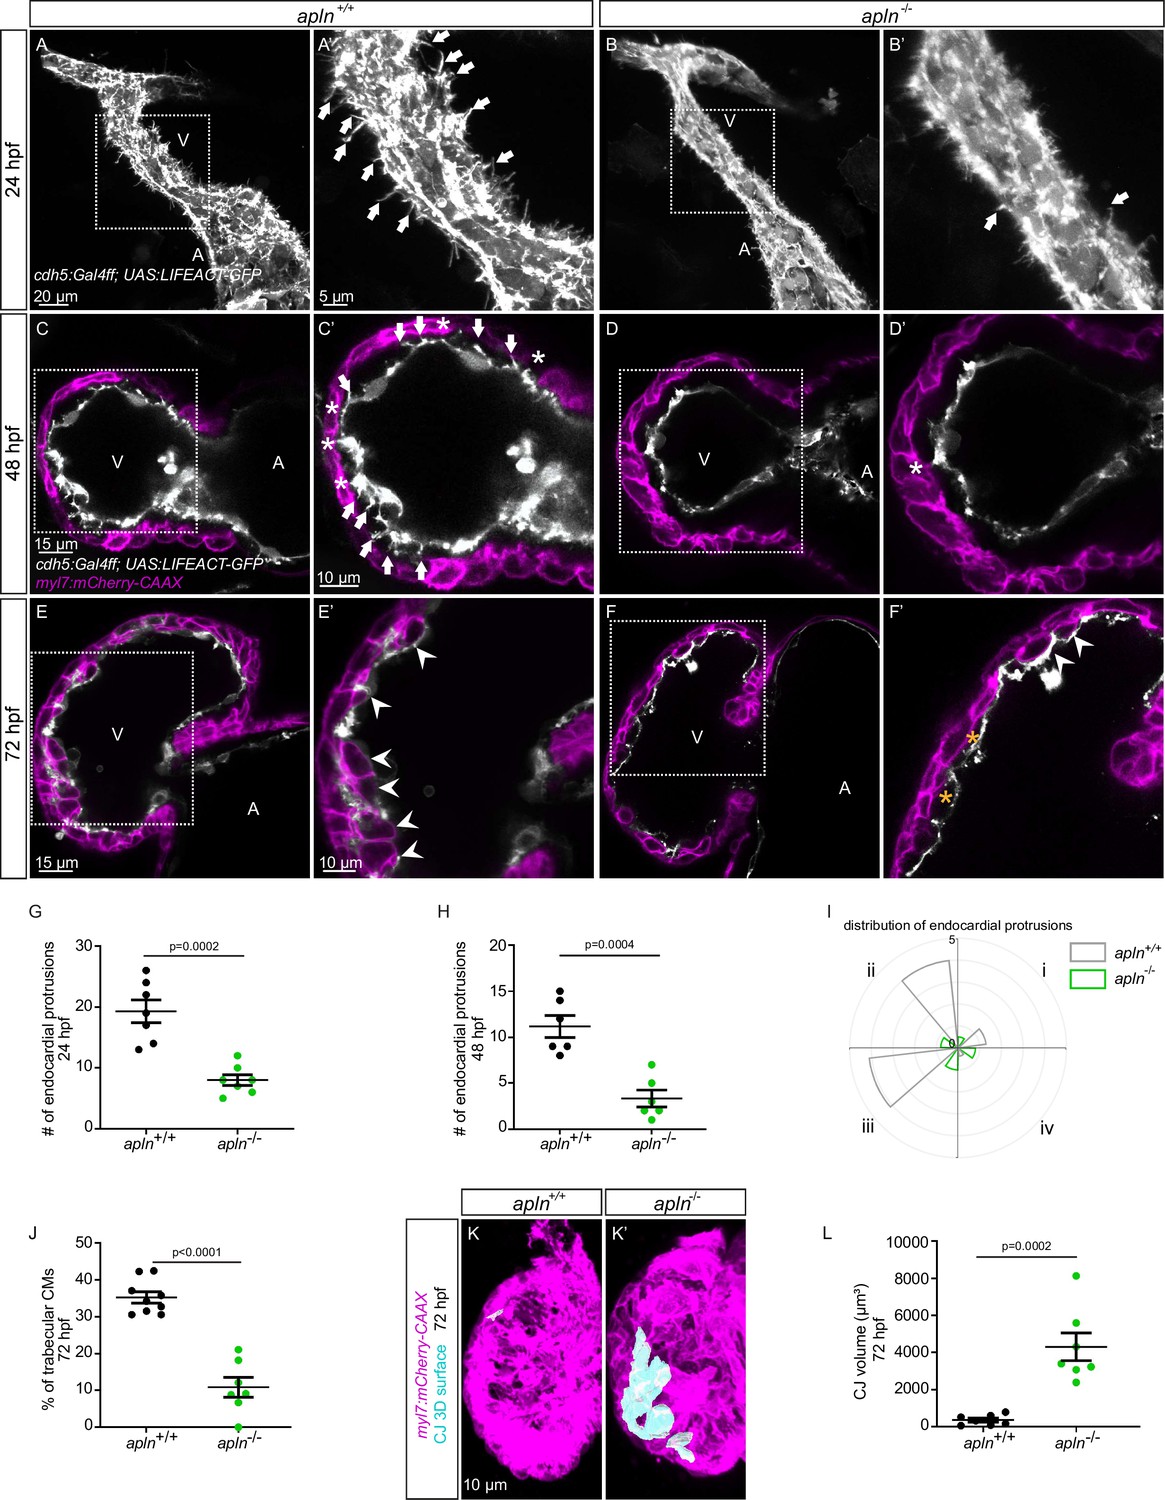
Loss of Apelin signaling leads to reduced endocardial protrusion and reduced myocardial trabeculation.
(A–F) Confocal projection images of the heart of Tg(cdh5:Gal4ff); Tg(UAS:LIFEACT-GFP) zebrafish at 24 hours post-fertilization (hpf) (A–B) and of the heart of Tg(myl7:mCherry-CAAX); Tg (cdh5:Gal4ff); Tg(UAS:LIFEACT-GFP) (C–F) zebrafish at 48 (C–D) and 72 (E–F) hpf. Maximum intensity projections (A–B) and mid-sagittal sections (C–F). (A) Endocardial protrusions (arrows) in apln+/+ embryos at 24 hpf. (B) The number of endocardial protrusions (arrows) is reduced in apln-/- siblings at 24 hpf. (C–D) The numbers of endocardial protrusions (arrows) and touchdowns (white asterisks) are reduced in apln-/- embryos (D) at 48 hpf compared with apln+/+ siblings (C). (E–F) apln-/- larvae (F) exhibit reduced trabeculation (arrowheads) and thicker cardiac jelly (CJ) (yellow asterisks) at 72 hpf compared with apln+/+ siblings (E). (G–H) Quantification of the number of endocardial protrusions in the ventricle of apln+/+ and apln-/- siblings at 24 (G) and 48 (H) hpf. (I) Distribution and average number of endocardial protrusions in different regions of mid-sagittal sections of the ventricle from 48 hpf apln+/+ and apln-/- siblings. (J) Quantification of the percentage of trabecular cardiomyocytes (CMs) in the outer curvature of apln+/+ and apln-/- siblings at 72 hpf. (K–K’) Maximum intensity projections. apln-/- larvae (K’) exhibit a thicker CJ at 72 hpf compared with apln+/+ siblings (K). (L) Quantification of the CJ volume in the outer curvature of apln+/+ and apln-/- siblings at 72 hpf. All images are ventral views, anterior to the top. V, ventricle; A, atrium; +/+, apln+/+; -/-, apln-/-. Data in graphs expressed as mean ± SEM.
Figure 4—figure supplement 1
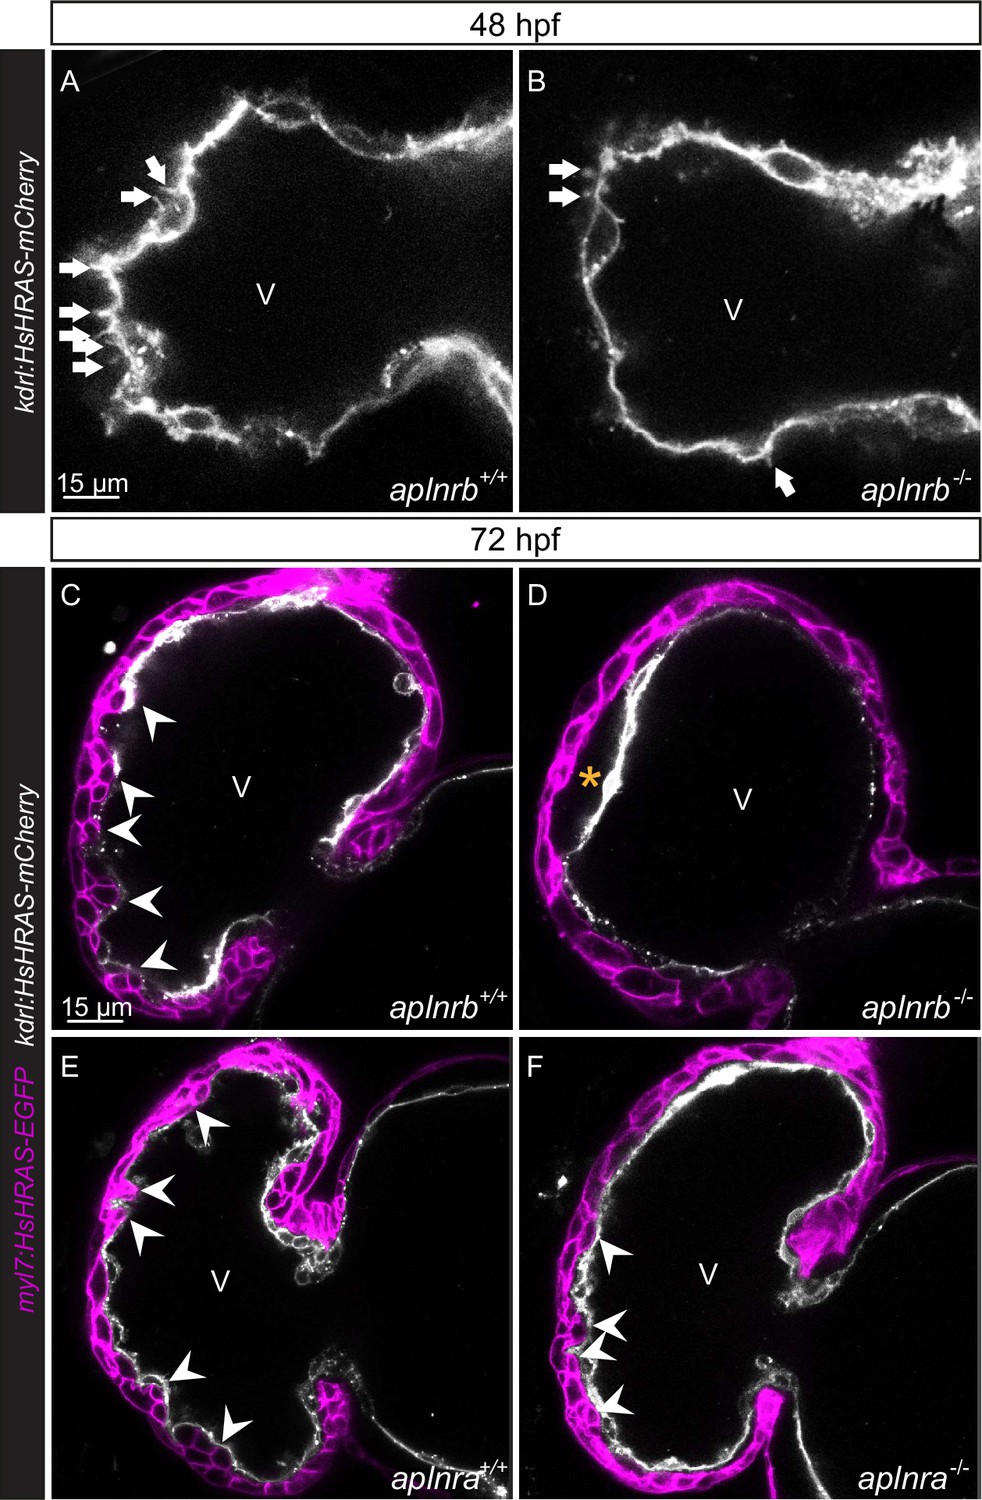
aplnrb mutants exhibit reduced endocardial protrusion formation and reduced trabeculation, and aplnra mutant exhibit a mild reduction in trabeculation.
(A–F) Confocal projection images of the heart of Tg(kdrl:HsHRAS-mCherry) (A–B) and Tg(myl7:HsHRAS-EGFP); Tg(kdrl:HsHRAS-mCherry) (C–F) zebrafish at 48 (A–B) and 72 (C–F) hours post-fertilization (hpf). (A–B) aplnrb-/- embryos exhibit fewer endocardial protrusions (arrows) compared with aplnrb+/+ siblings (A) at 48 hpf. (C–D) aplnrb-/- larvae (D) exhibit reduced trabeculation (arrowheads) and thicker cardiac jelly (CJ) (asterisk) compared with aplnrb+/+ siblings (C) at 72 hpf. (E–F) aplnra-/- larvae (F) exhibit a mild reduction in trabeculation compared with aplnra+/+ siblings (E) at 72 hpf. V, ventricle.
Figure 4—figure supplement 2
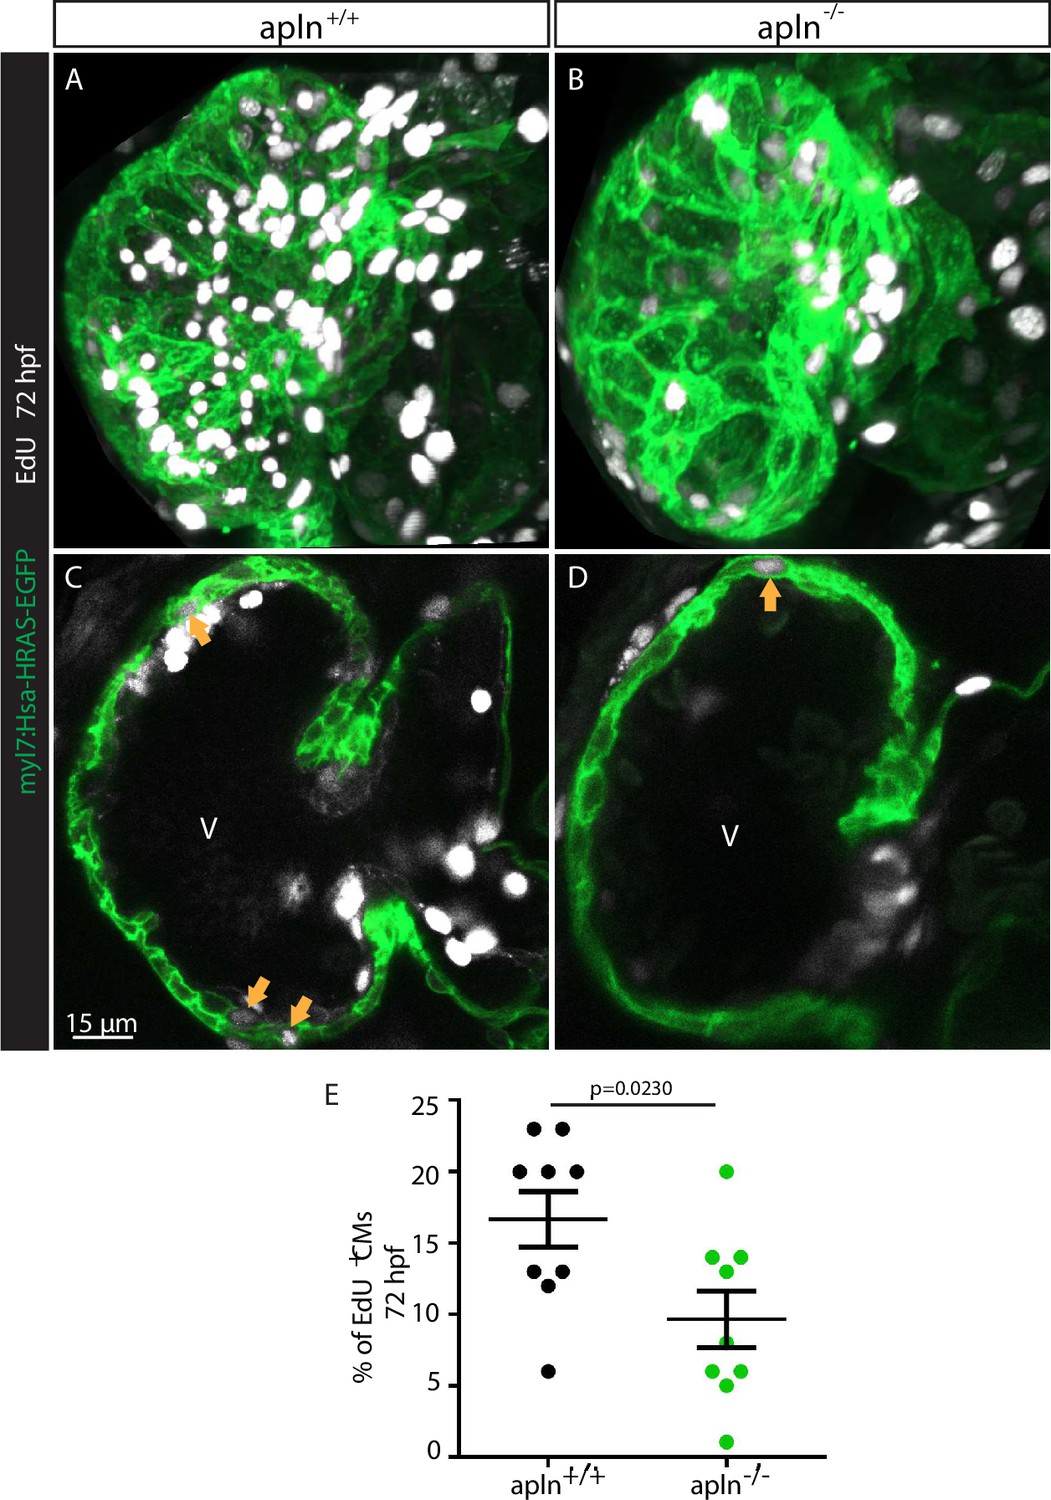
Apelin signaling regulates cardiomyocyte (CM) proliferation in the ventricle.
(A–D) Confocal projection images of the heart of Tg(myl7:HsHRAS-EGFP) larvae at 72 hours post-fertilization (hpf). (A–B) Maximum intensity projections of confocal images. (C–D) Mid-sagittal sections of A and B, respectively. apln-/- larvae (D) exhibit fewer EdU+ CMs (arrows) in their ventricle compared with apln+/+ siblings (C). (E) Quantification of the percentage of EdU+ CMs in the ventricle of apln+/+ and apln-/- siblings. V, ventricle. Data in graphs expressed as mean ± SEM.
Figure 4—figure supplement 3
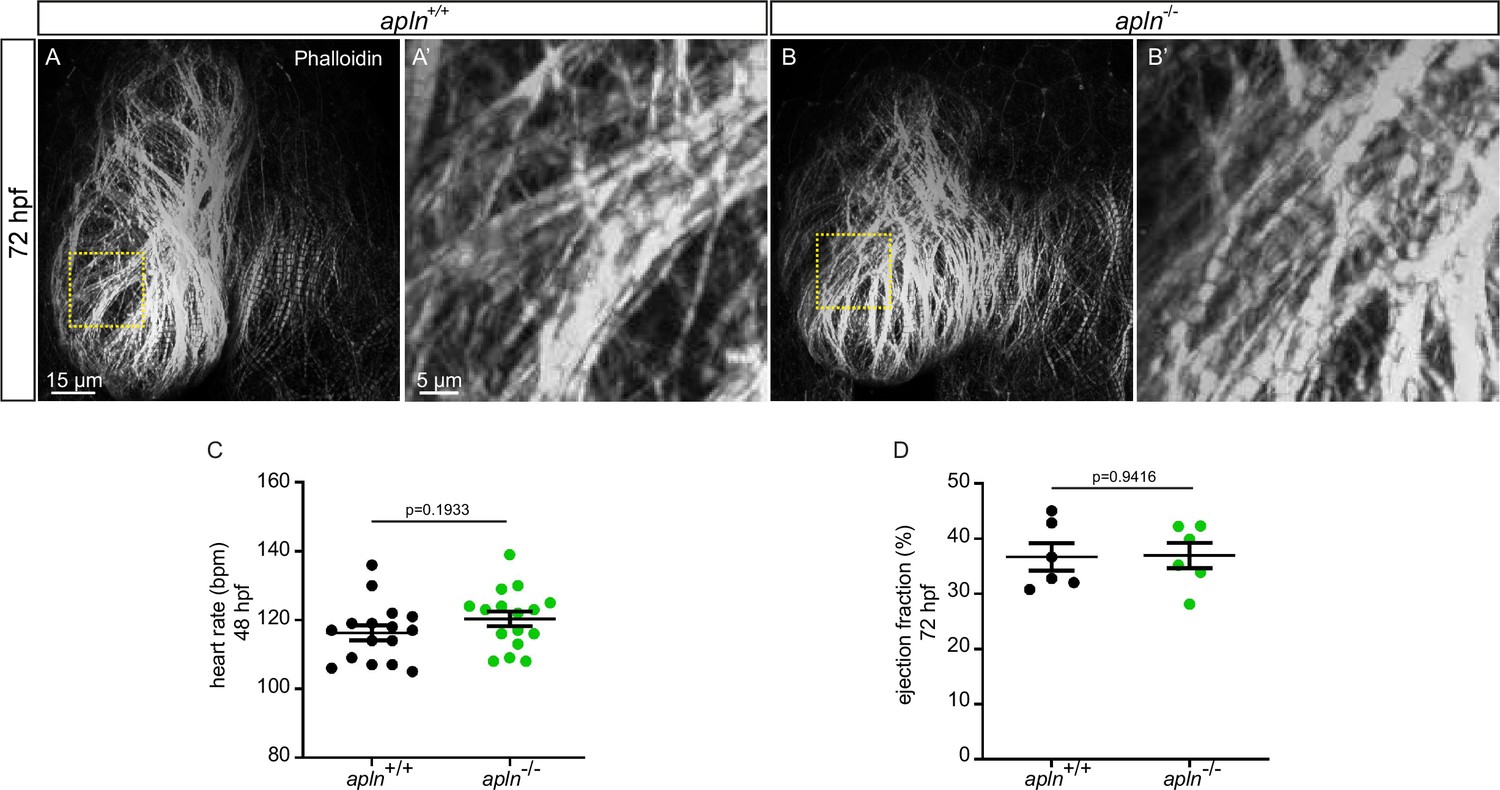
Wild-type like sarcomere structure and heart function in apln-/- larvae.
(A–B) Confocal projection images. Maximum intensity projections of confocal images of the heart of 72 hours post-fertilization (hpf) larvae stained with Phalloidin. Sarcomere formation does not appear to be affected in apln-/- larvae (B) compared with apln+/+ siblings (A) (apln+/+, n = 5; apln-/-, n = 4). (C–D) Quantification of heart rate (C) and ejection fraction (D) of apln+/+ and apln-/- siblings. V, ventricle.
Figure 4—figure supplement 4
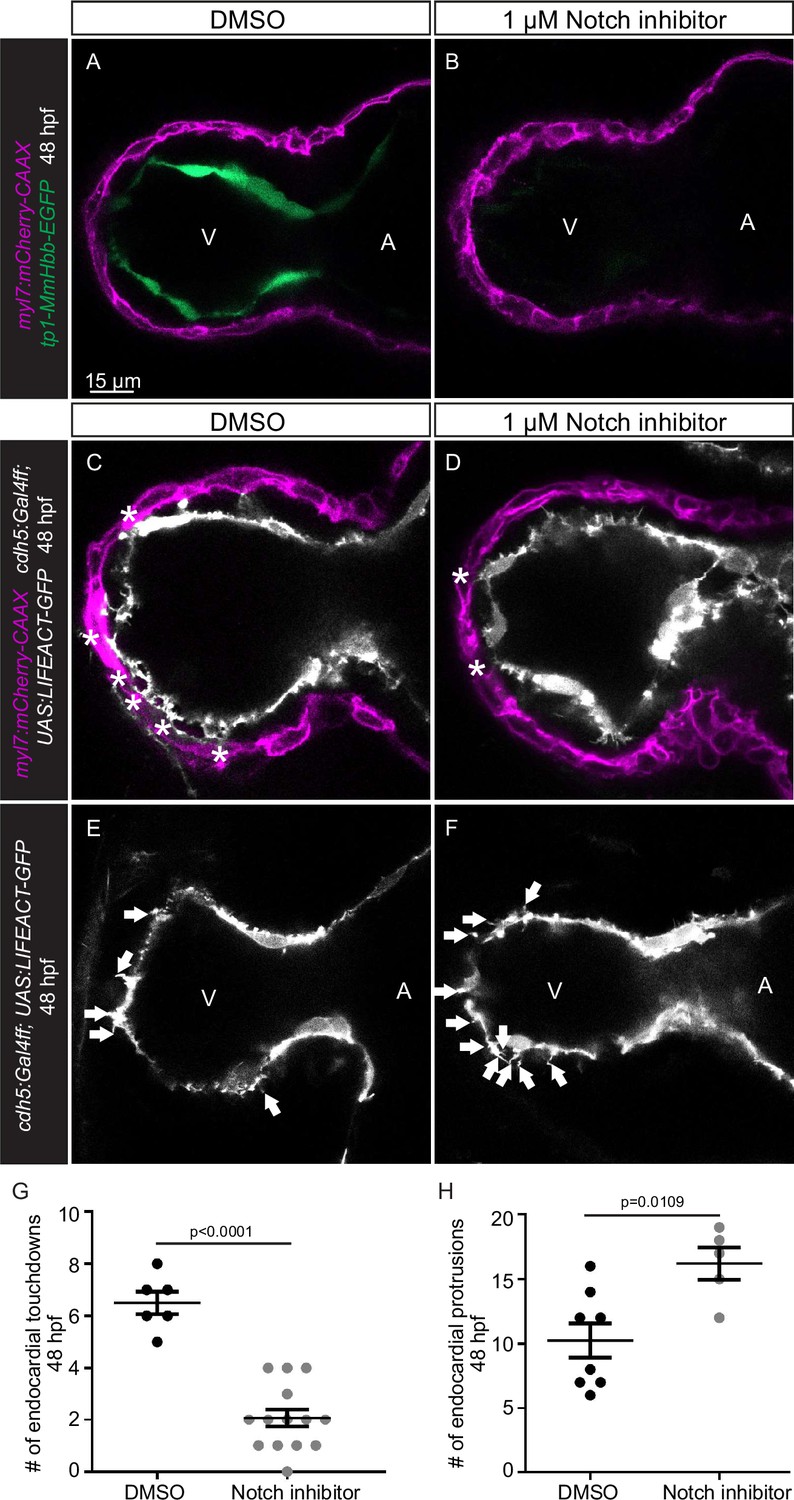
Notch signaling represses endocardial protrusion formation.
(A–D) Confocal projection images of the heart of Tg(myl7:mCherry-CAAX); Tg(tp1-MmHbb:EGFP) (A–B) and Tg(cdh5:Gal4ff); Tg(UAS:LIFEACT-GFP) (C–D) embryos at 48 hours post-fertilization (hpf). (A–B) Treatment with 1 µM of the Notch inhibitor RO4929097 from 24 to 48 hpf blocks the expression of the Tg(tp1-MmHbb:EGFP) Notch reporter in the endocardium. (C–D) Embryos treated with the Notch inhibitor exhibit fewer endocardial touchdowns (asterisks). (E–F) Embryos treated with the Notch inhibitor exhibit more endocardial protrusions (arrows). (G) Quantification of the number of endocardial touchdowns in the ventricle of DMSO and Notch inhibitor treated embryos at 48 hpf. (H) Quantification of the number of endocardial protrusions in the ventricle of DMSO and RO4929097 treated embryos at 48 hpf. All images are ventral views, anterior to the top. V, ventricle; A, atrium. Data in graphs expressed as mean ± SEM.
Figure 4—video 1
apln+/+ blood circulation at 48 hours post-fertilization (hpf).
Related to Figure 4—figure supplement 3.
Figure 4—video 2
apln-/- blood circulation at 48 hours post-fertilization (hpf).
Related to Figure 4—figure supplement 3.
Figure 5 with 1 supplement
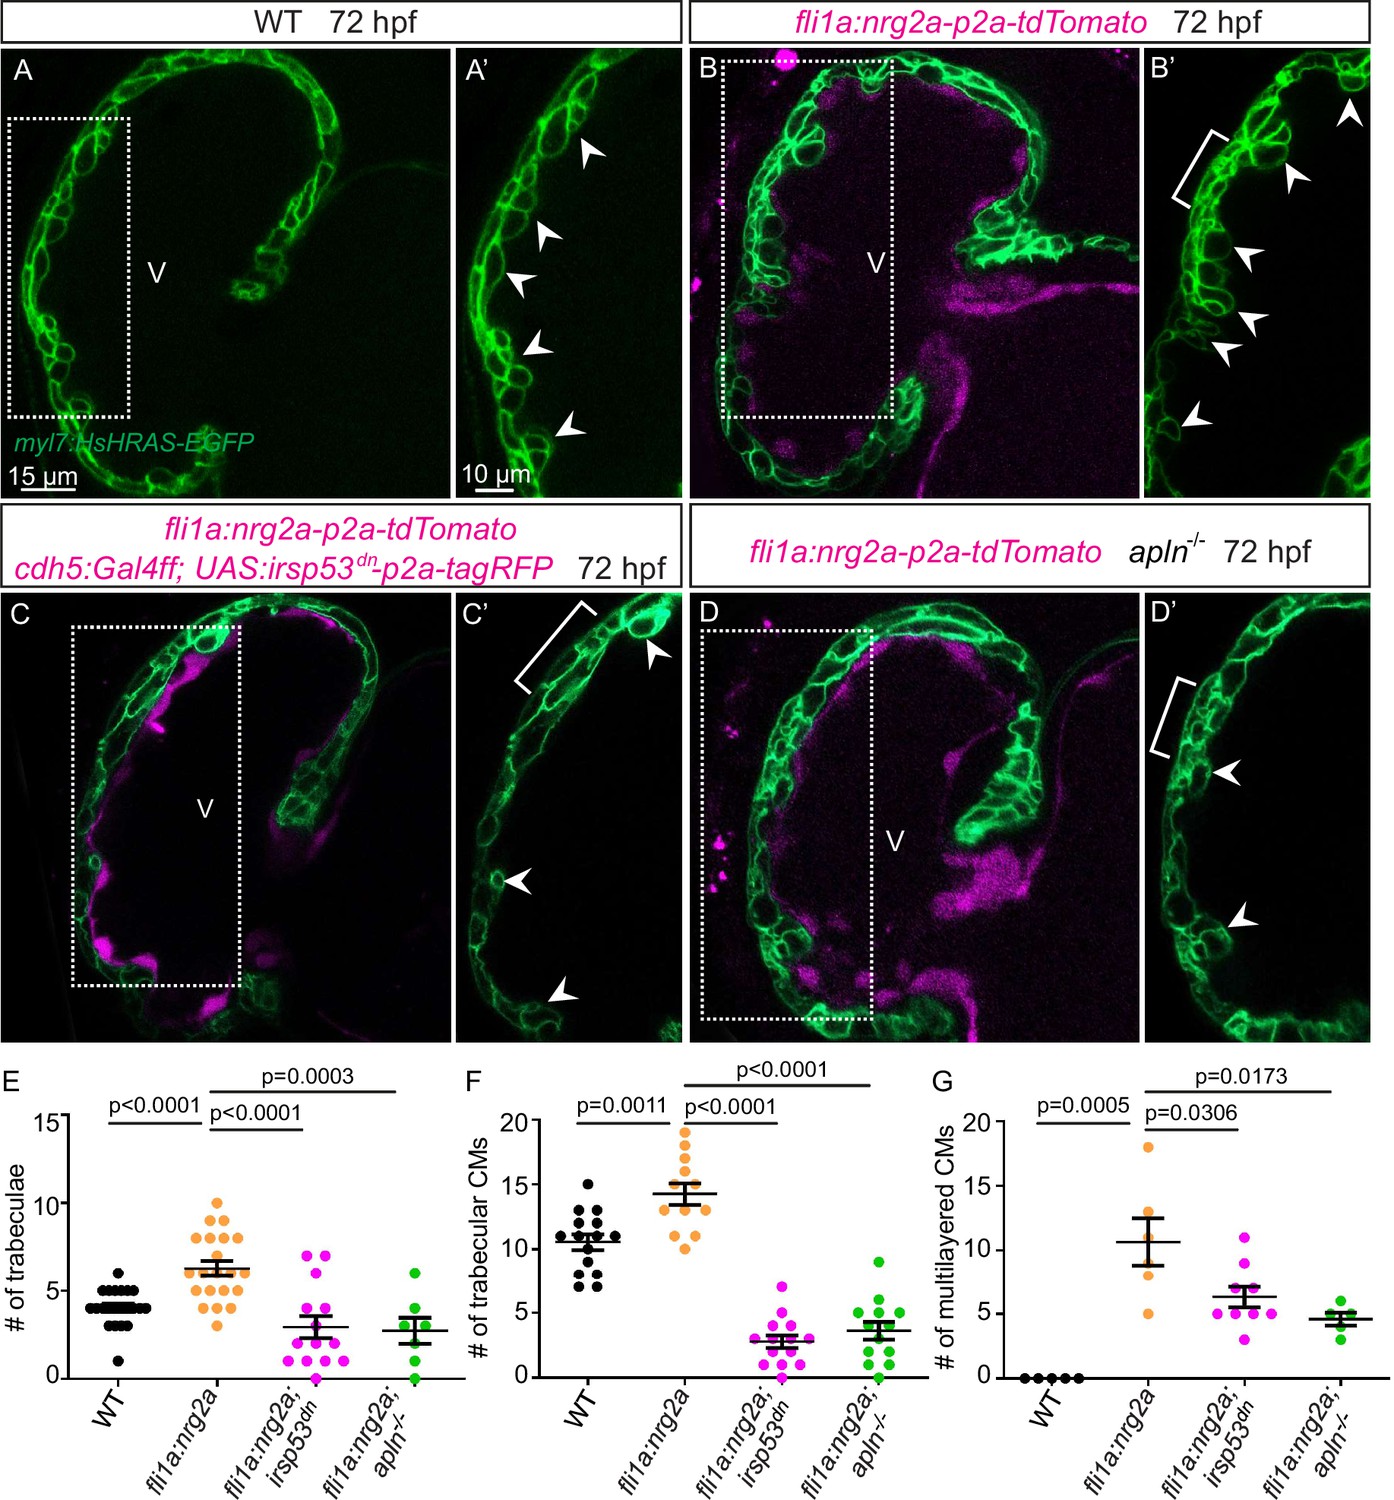
Endocardial protrusions are necessary for nrg2a function.
(A–D) Confocal projection images of the heart of Tg(myl7:HsHRAS-EGFP) larvae at 72 hours post-fertilization (hpf). (A–B) Overexpression of nrg2a in the endothelium (B) leads to an increased number of trabeculae (arrowheads) and the multilayering of cardiomyocytes (CMs) (brackets) compared with wild-type (A). (C) Larvae with endothelial overexpression of nrg2a and irsp53dn exhibit a reduced number of trabeculae (arrowheads) and of multilayered CMs (brackets) compared with larvae with endothelial overexpression of nrg2a alone (B). (D) apln mutant larvae with endothelial overexpression of nrg2a exhibit a reduced number of trabeculae (arrowheads) and of multilayered CMs (brackets) compared with wild-type larvae with endothelial overexpression of nrg2a (B). (E) Quantification of the number of trabeculae. (F) Quantification of the number of trabecular CMs. (G) Quantification of the number of multilayered CMs in the ventricle. Brackets indicate multilayered CMs. All images are ventral views, anterior to the top. V, ventricle. Data in graphs expressed as mean ± SEM.
Figure 5—figure supplement 1
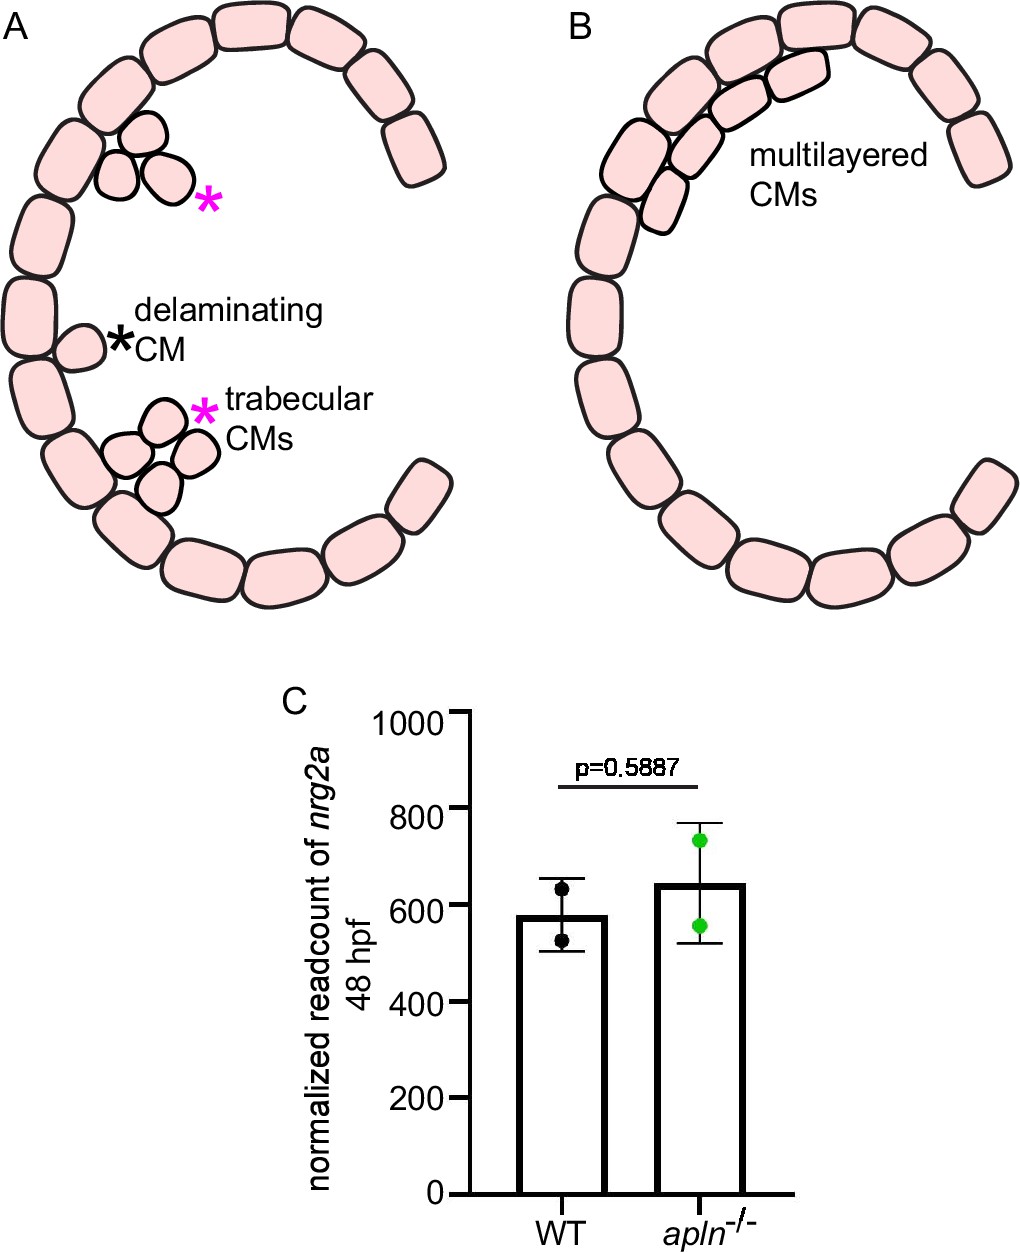
nrg2a expression does not appear to be affected in apln mutants.
(A–B) Schematic illustration showing delaminating cardiomyocytes (CMs) and trabecular CMs vs. multilayered CMs. (C) nrg2a mRNA levels in extracted hearts from wild types and apln mutants at 48 hours post-fertilization (hpf) (from RNA-seq data). Data in graphs expressed as mean ± SEM.
Figure 6 with 2 supplements
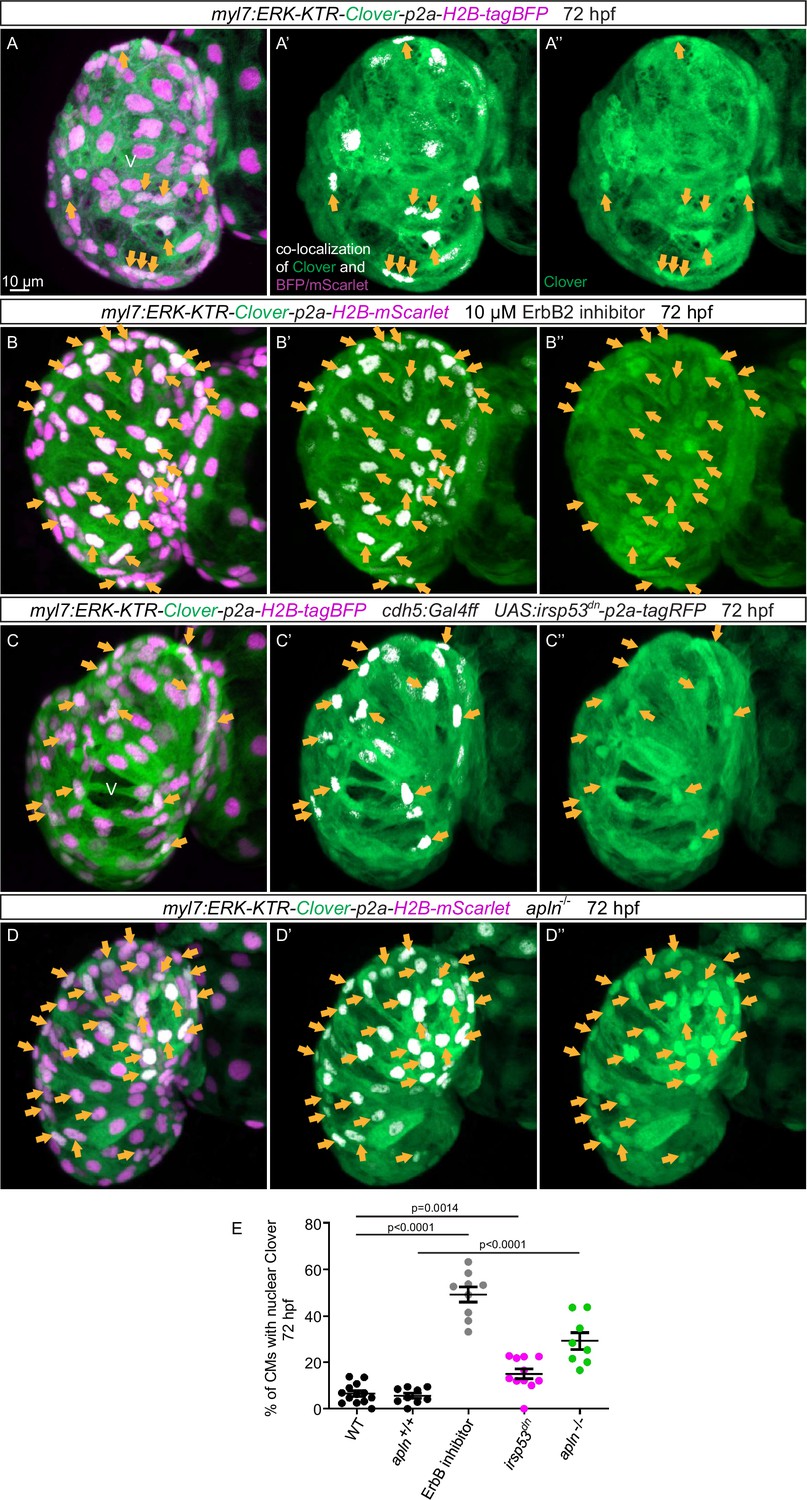
Blocking endocardial protrusion formation reduces myocardial extracellular signal-regulated kinase (Erk) signaling activity.
(A–D) Maximum intensity projections of confocal images of the heart of Tg(myl7:ERK-KTR-Clover-p2a-H2B-tagBFP/mScarlet) larvae at 72 hours post-fertilization (hpf). (A) Visualization of Erk activity by a cardiomyocyte (CM)-specific ERK-kinase translocation reporter (KTR) reporter. Nuclear Clover expression (arrows) indicates CMs with inactive Erk signaling. (B) Larvae treated with an ErbB2 inhibitor exhibit an increased number of CMs with inactive Erk signaling (arrows) compared with control larvae (A). (C) Larvae with endothelial overexpression of irsp53dn exhibit an increased number of CMs with inactive Erk signaling (arrows) compared with control larvae (A). (D) apln mutant larvae exhibit an increased number of CMs with inactive Erk signaling (arrows) compared with apln+/+ siblings. (E) Quantification of the percentage of ventricular CMs with nuclear Clover expression. All images are ventral views, anterior to the top. V, ventricle. Data in graphs expressed as mean ± SEM.
Figure 6—figure supplement 1
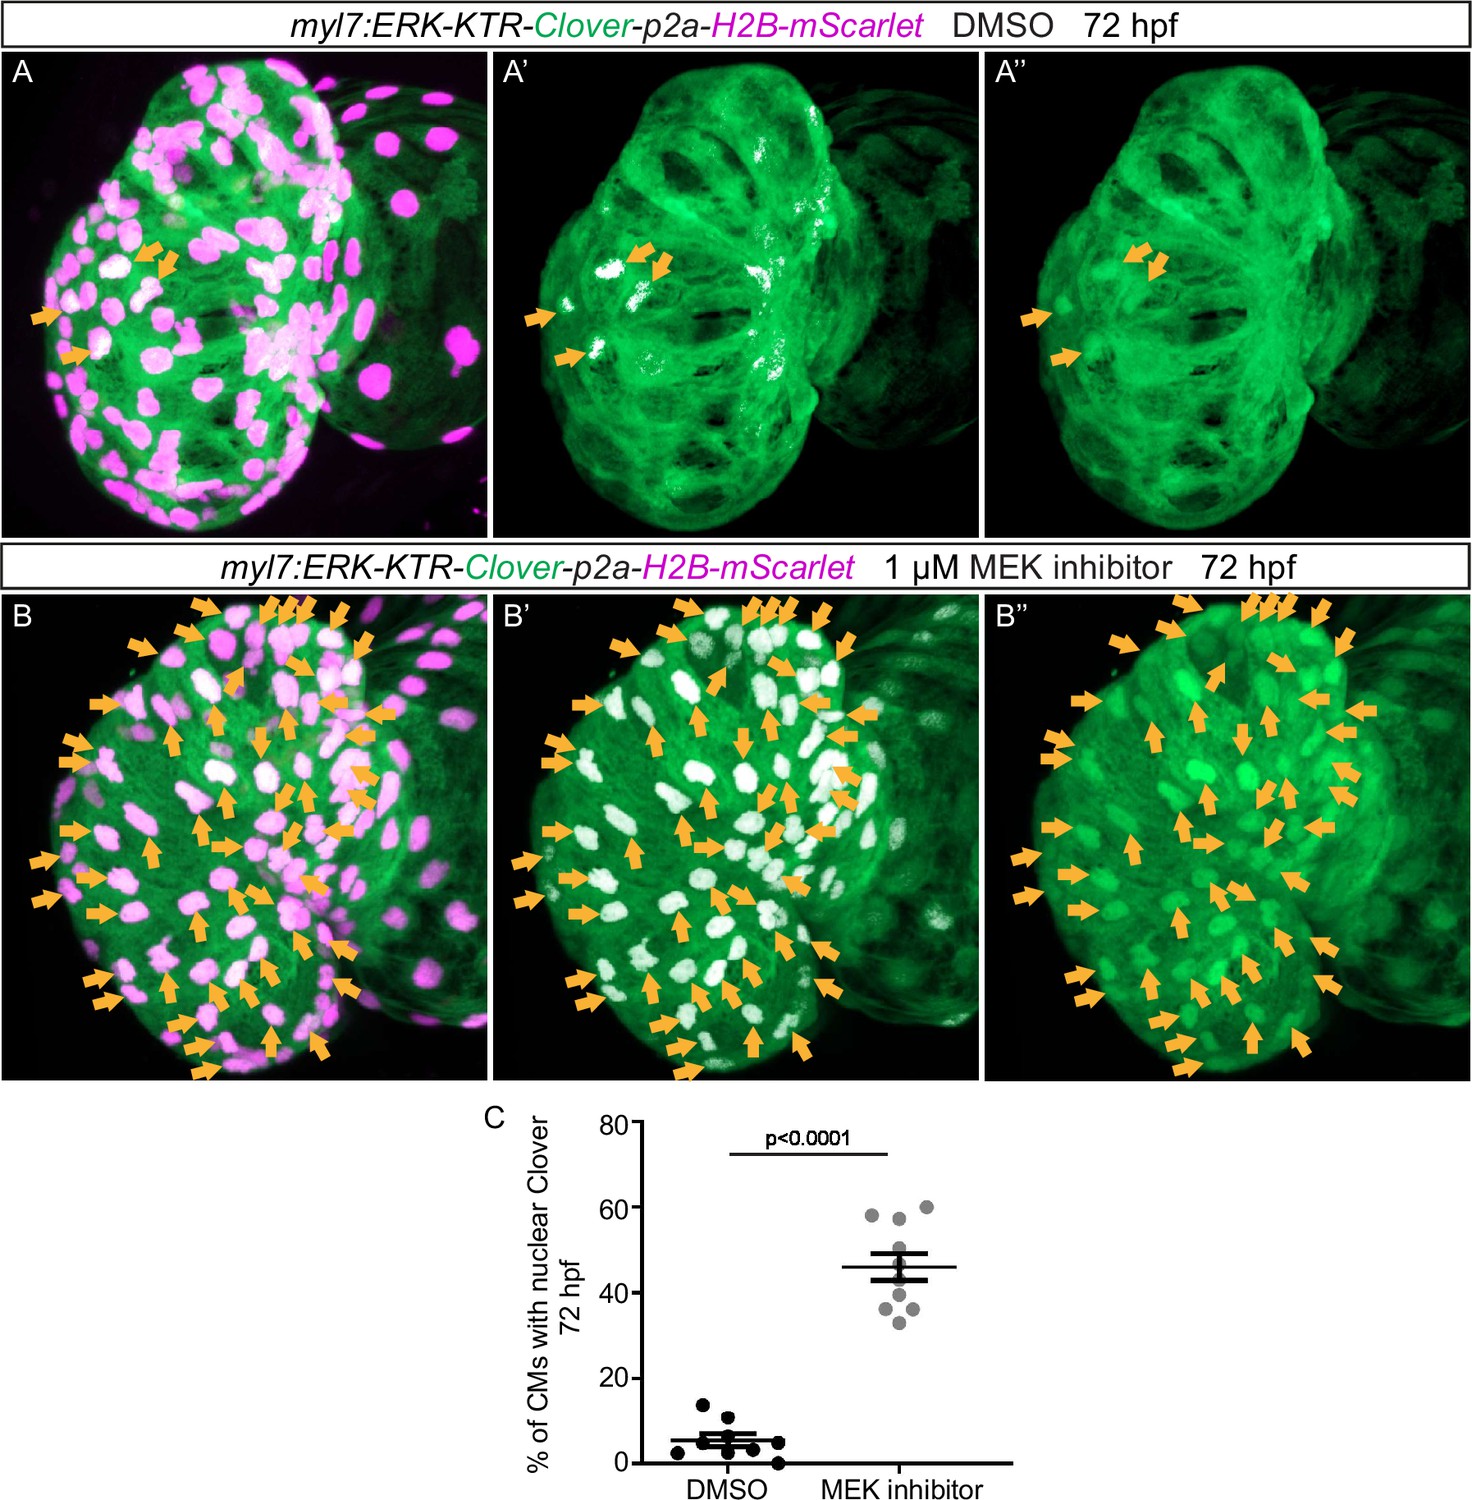
Validation of the extracellular signal-regulated kinase (Erk) reporter line using MEK inhibitor treatment.
(A–B) Confocal projection images. Maximum intensity projections of the heart of Tg(myl7:ERK-KTR-Clover-p2a-H2B-mScarlet) larvae at 72 hours post-fertilization (hpf). (B) Larvae treated with the MEK inhibitor PD 0325901 from 56 to 72 hpf exhibit an increased number of cardiomyocytes (CMs) with inactive Erk signaling (arrows) compared with larvae treated with DMSO (A). (C) Quantification of the percentage of ventricular CMs with nuclear Clover. All images are ventral views, anterior to the top. V, ventricle. Data in graphs expressed as mean ± SEM.
Figure 6—figure supplement 2
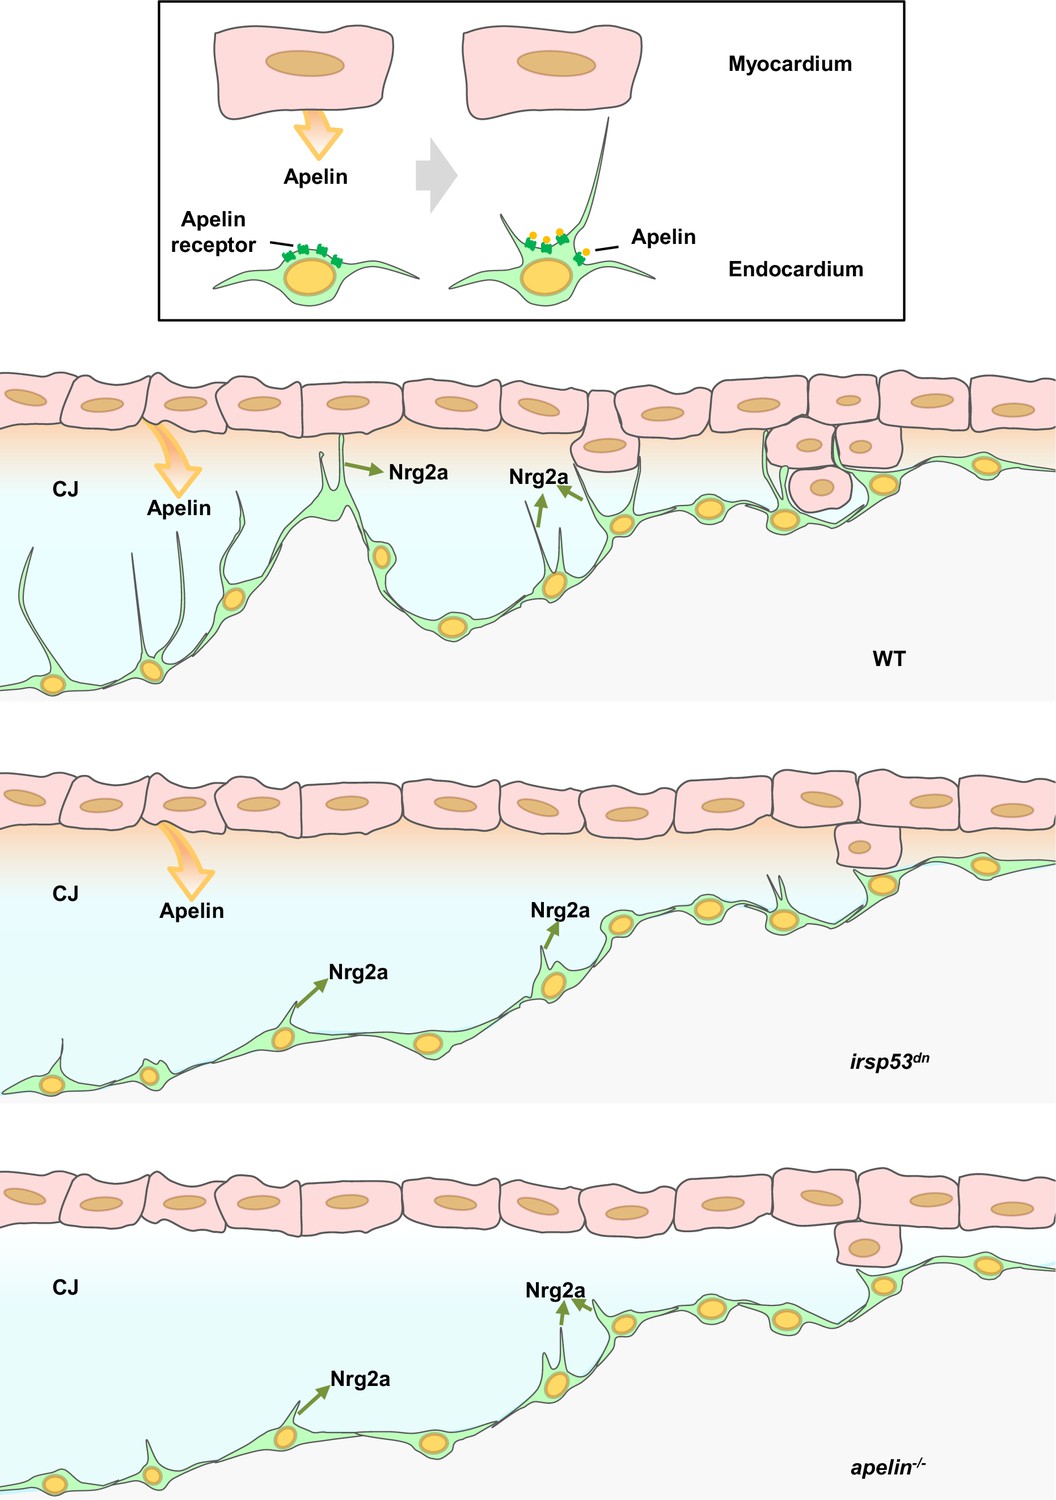
Schematic model.
Schematic model depicts that inhibiting the formation of endocardial protrusions results in cardiac trabeculation defects via affecting neuregulin (Nrg)/ErbB signaling.
Tables
Key resources table
| Reagent type (species) or resource | Designation | Source or reference | Identifiers | Additional information |
|---|---|---|---|---|
| Genetic reagent (Danio rerio) | TgBAC(apln:EGFP)bns157 | Helker et al., 2020 | ZFIN: bns157 | |
| Genetic reagent (Danio rerio) | TgBAC(cdh5:Gal4ff)mu101 | Bussmann et al., 2011 | ZFIN: mu101 | |
| Genetic reagent (Danio rerio) | Tg(UAS:LIFEACT-GFP)mu271 | Helker et al., 2013 | ZFIN: mu271 | |
| Genetic reagent (Danio rerio) | Tg(fli1a:nrg2a-p2a-tdTomato)bns199 | Rasouli and Stainier, 2017 | ZFIN: bns199 | |
| Genetic reagent (Danio rerio) | Tg(myl7:mCherry-CAAX)bns7 | Uribe et al., 2018 | ZFIN: bns7 | |
| Genetic reagent (Danio rerio) | Tg(myl7:BFP-CAAX)bns193 | Guerra et al., 2018 | ZFIN: bns193 | |
| Genetic reagent (Danio rerio) | Tg(myl7:MKATE-CAAX)sd11 | Lin et al., 2012 | ZFIN: sd11 | |
| Genetic reagent (Danio rerio) | Tg(kdrl:HsHRAS-mCherry)s896 | Chi et al., 2008 | ZFIN: s896 | |
| Genetic reagent (Danio rerio) | Tg(myl7:HRAS-EGFP)s883 | D’Amico et al., 2007 | ZFIN: s883 | |
| Genetic reagent (Danio rerio) | Tg(tp1-MmHbb:EGFP)um14 | Parsons et al., 2009 | ZFIN: um14 | |
| Genetic reagent (Danio rerio) | Tg(myl7:mVenus-gmnn)ncv43Tg | Jiménez-Amilburu et al., 2016 | ZFIN: ncv43Tg | |
| Genetic reagent (Danio rerio) | Tg(UAS: irsp53dn-p2a-tagRFP)bns440 | This paper | bns440 | See Materials and methods section |
| Genetic reagent (Danio rerio) | TgBAC(aplnrb:VenusPEST)mr13 | This paper | mr13 | See Materials and methods section |
| Genetic reagent (Danio rerio) | Tg(–0.8myl7:ERK-KTR-Clover-p2a-Hsa.H2B-tagBFP) | This paper | See Materials and methods section | |
| Genetic reagent (Danio rerio) | Tg(–0.8myl7:ERK-KTR-Clover-p2a-Hsa.H2B-mScarlet)bns565 | This paper | bns565 | See Materials and methods section |
| Genetic reagent (Danio rerio) | aplnmu267 mutant | Helker et al., 2015 | ZFIN: mu267 | |
| Genetic reagent (Danio rerio) | aplnrbmu281 mutant | Helker et al., 2015 | ZFIN: mu281 | |
| Genetic reagent (Danio rerio) | aplnramu296 mutant | Helker et al., 2015 | ZFIN: mu296 | |
| Antibody | Alexa Fluor 488 anti-Chicken IgG (H + L) (goat polyclonal) | Thermo Fisher Scientific | Cat# A-11039 | (1:500) |
| Antibody | Alexa Fluor 568 anti-Mouse IgG (H + L) (goat polyclonal) | Thermo Fisher Scientific | Cat# A-11004 | (1:500) |
| Antibody | Alexa Fluor 647 anti-Rabbit IgG (H + L) (goat polyclonal) | Thermo Fisher Scientific | Cat# A-21244 | (1:500) |
| Antibody | Anti-GFP (chicken polyclonal) | AvesLab | Cat#: GFP-1020 | (1:500) |
| Antibody | Anti-mCherry (mouse monoclonal) | Takara Bio Clontech | Cat# 632,543 | (1:500) |
| Chemical compound, drug | Agarose, low gelling temperature | Sigma | A9414-25g | |
| Chemical compound, drug | EdU | Thermo Fisher Scientific | Cat# A10044 | (1 mM) |
| Chemical compound, drug | ErbB2 inhibitor PD168393 | Sigma | Cat# PZ0285 | (10 µM) |
| Chemical compound, drug | MEK inhibitor PD0325901 | Sigma | Cat# PZ0162 | (1 µM) |
| Chemical compound, drug | RO 4929097 | MedChemExpress | Cat# HY-11102 | (1 µM) |
| Other | DAPI | Sigma | Cat# D9542 | (1 μg/ml) |
| Commercial assay or kit | Alexa Fluor 568 Phalloidin | Thermo Fisher Scientific | Cat# A12380 | (1:100) |
| Commercial assay or kit | Click-iT EdU Cell Proliferation Kit for Imaging, Alexa Fluor 647 dye | Thermo Fisher Scientific | Cat# C10340 | |
| Commercial assay or kit | DyNAmo ColorFlash SYBR Green qPCR Mix | Thermo Fisher Scientific | Cat# F416S | |
| Commercial assay or kit | In-Fusion HD Cloning Plus | Takara Bio | Cat# 638,910 | |
| Commercial assay or kit | Maxima First Strand cDNA kit | Thermo Fisher Scientific | Cat# K1641 | |
| Commercial assay or kit | RNA clean and concentrator-5 | Zymo Research | R1016 | |
| Software, algorithm | Fiji Image J | Schindelin et al., 2012 | RRID:SCR_002285 | |
| Software, algorithm | GraphPad Prism 8 | GraphPad Software | RRID:SCR_002798 | |
| Software, algorithm | Imaris – version 9.6.0 | Bitplane | RRID:SCR_007370 | |
| Software, algorithm | ZEN Digital Imaging | Zeiss | RRID:SCR_013672 |
Additional files
Download links
A two-part list of links to download the article, or parts of the article, in various formats.
Downloads (link to download the article as PDF)
Open citations (links to open the citations from this article in various online reference manager services)
Cite this article (links to download the citations from this article in formats compatible with various reference manager tools)
Apelin signaling dependent endocardial protrusions promote cardiac trabeculation in zebrafish
eLife 11:e73231.
https://doi.org/10.7554/eLife.73231


