Metabolic requirement for GOT2 in pancreatic cancer depends on environmental context
- Doctoral Program in Cancer Biology, University of Michigan-Ann Arbor, United States
- Department of Molecular and Integrative Physiology, University of Michigan-Ann Arbor, United States
- Department of Surgery, University of Michigan-Ann Arbor, United States
- Department of Cell and Developmental Biology, University of Michigan-Ann Arbor, United States
- Molecular and Cellular Pathology Graduate Program, University of Michigan-Ann Arbor, United States
- Program in Chemical Biology, University of Michigan-Ann Arbor, United States
- Department of Radiology, University of Michigan, United States
- Rogel Cancer Center, University of Michigan, United States
- Department of Pathology and Institute of Gerontology, University of Michigan, United States
- Department of Cancer Systems Imaging, University of Texas MD Anderson Cancer Center, United States
- Department of Molecular and Cellular Oncology, University of Texas MD Anderson Cancer Center, United States
- Department of Internal Medicine, Division of Gastroenterology and Hepatology, University of Michigan, United States
Figures
Figure 1 with 2 supplements
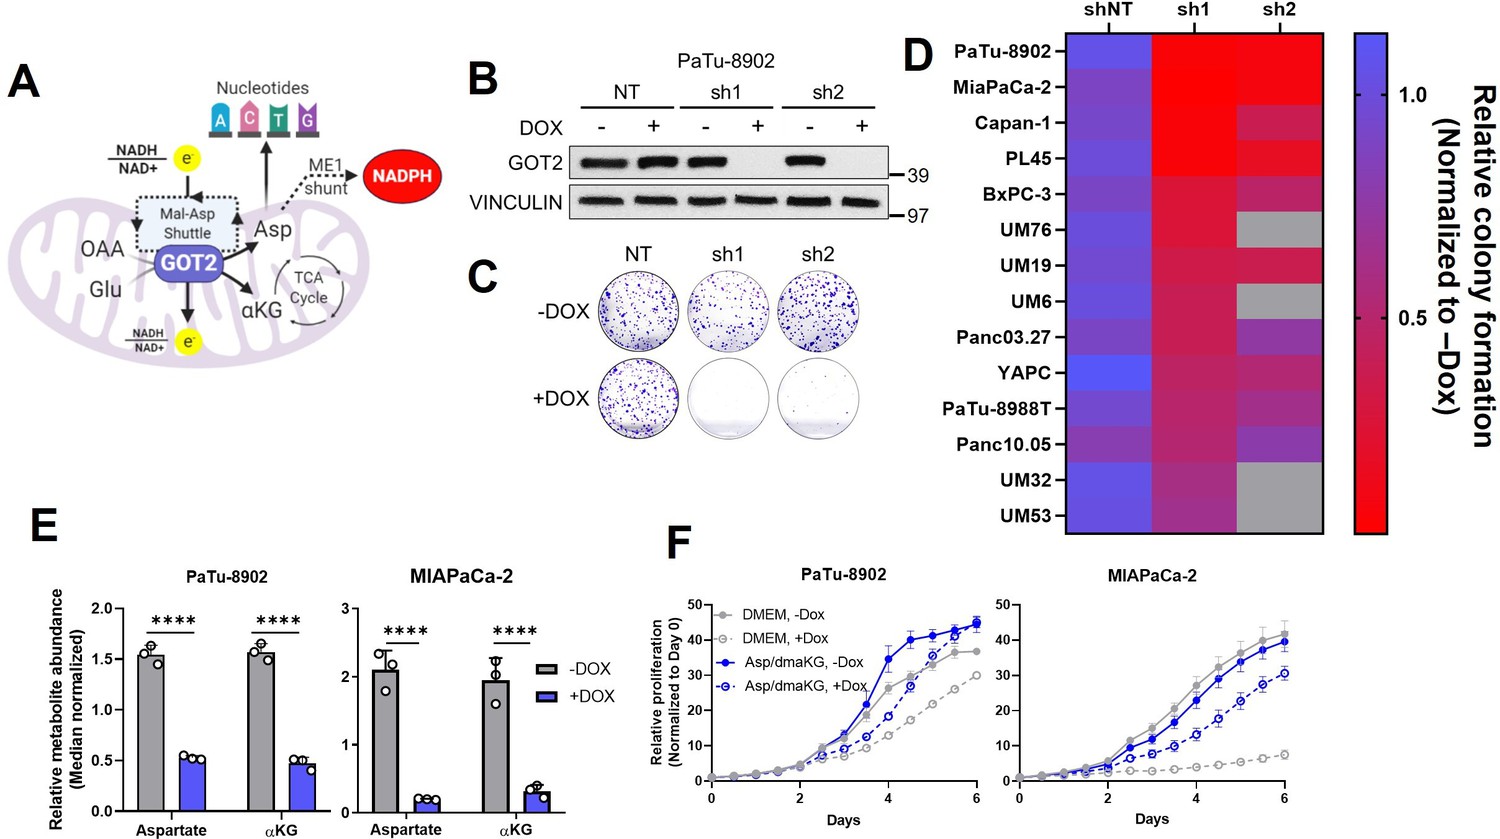
Glutamate-oxaloacetate transaminase 2 (GOT2) knockdown (KD) impairs in vitro pancreatic ductal adenocarcinoma (PDA) proliferation.
(A) The metabolic roles of mitochondrial GOT2. OAA: oxaloacetate; Glu: glutamate; Mal: malate; Asp: aspartate; αKG: α-ketoglutarate; ME1: malic enzyme 1; TCA: tricarboxylic acid. (B) Immunoblot of GOT2 and VINCULIN loading control in PaTu-8902 cells after 1 µg/mL doxycycline (DOX) induction of two independent GOT2 (sh1, sh2) and non-targeting (NT) shRNAs for 3 days. (C) Representative images from colony formation assays in ishRNA PaTu-8902 cells −Dox (n=3) or +Dox (n=3). (D) Heatmap summarizing the relative colony formation ishRNA PDA cell lines −Dox (n=3) or +Dox (n=3), normalized to −Dox for each indicated shRNA. Representative images from colony formation assays and western blots presented in Figure 1—figure supplement 1. (E) Relative abundances of Asp and αKG in PaTu-8902 (left) and MIAPaCa-2 (right) ishGOT2.1 −Dox (n=3) or +Dox (n=3). (F) Relative proliferation of PaTu-8902 (left) and MIAPaCa-2 (right) ishGOT2.1 −Dox (n=3) or +Dox (n=3) cultured in normal media (Dulbecco’s modified Eagle medium, DMEM) or supplemented with 20 mM Asp and 1 mM dimethyl-αKG (dmαKG). For all panels, data represent mean ± SD. *p<0.05, **p<0.01, ***p<0.001, and ****p<0.0001.
-
Figure 1—source data 1
Full western blot images for Figure 1B.
- https://cdn.elifesciences.org/articles/73245/elife-73245-fig1-data1-v2.zip
Figure 1—figure supplement 1

GOT2 knockdown (KD) impairs in vitro colony formation and proliferation of pancreatic cancer cell lines.
(A) Immunoblots of glutamate-oxaloacetate transaminase 2 (GOT2) and VINCULIN loading control in pancreatic ductal adenocarcinoma (PDA) cell lines after 1 µg/mL doxycycline (Dox) induction of the indicated shRNAs (ishRNA) for 3 days. NT: non-targeting shRNA. Westerns for data in Figure 1D. (B) Immunoblot of GOT1, GOT2, and VINCULIN in PaTu-8902 ishRNA −Dox or +Dox after 3 days. (C) Representative images from colony formation assays in PDA ishRNA cell lines −Dox (n=3) or +Dox (n=3) for the data in Figure 1D. (D) Relative proliferation of PDA ishRNA cell lines −Dox (n=3) or +Dox (n=3), normalized to Day 0 cell number for each condition. (E) Immunoblots of GOT2 and VINCULIN in human cancer-associated fibroblast cell line human pancreatic stellate cells (hPSC) and human pancreatic nestin expressing cells (HPNE) ishRNA cells. (F) Relative proliferation of hPSC (left) and HPNE (right) ishRNA −Dox (n=3) or +Dox (n=3). For all panels, data represent mean ± SD. *p<0.05, **p<0.01, ***p<0.001, and ****p<0.0001.
-
Figure 1—figure supplement 1—source data 1
Full western blot images for Figure 1—figure supplement 1B,E.
- https://cdn.elifesciences.org/articles/73245/elife-73245-fig1-figsupp1-data1-v2.zip
Figure 1—figure supplement 2
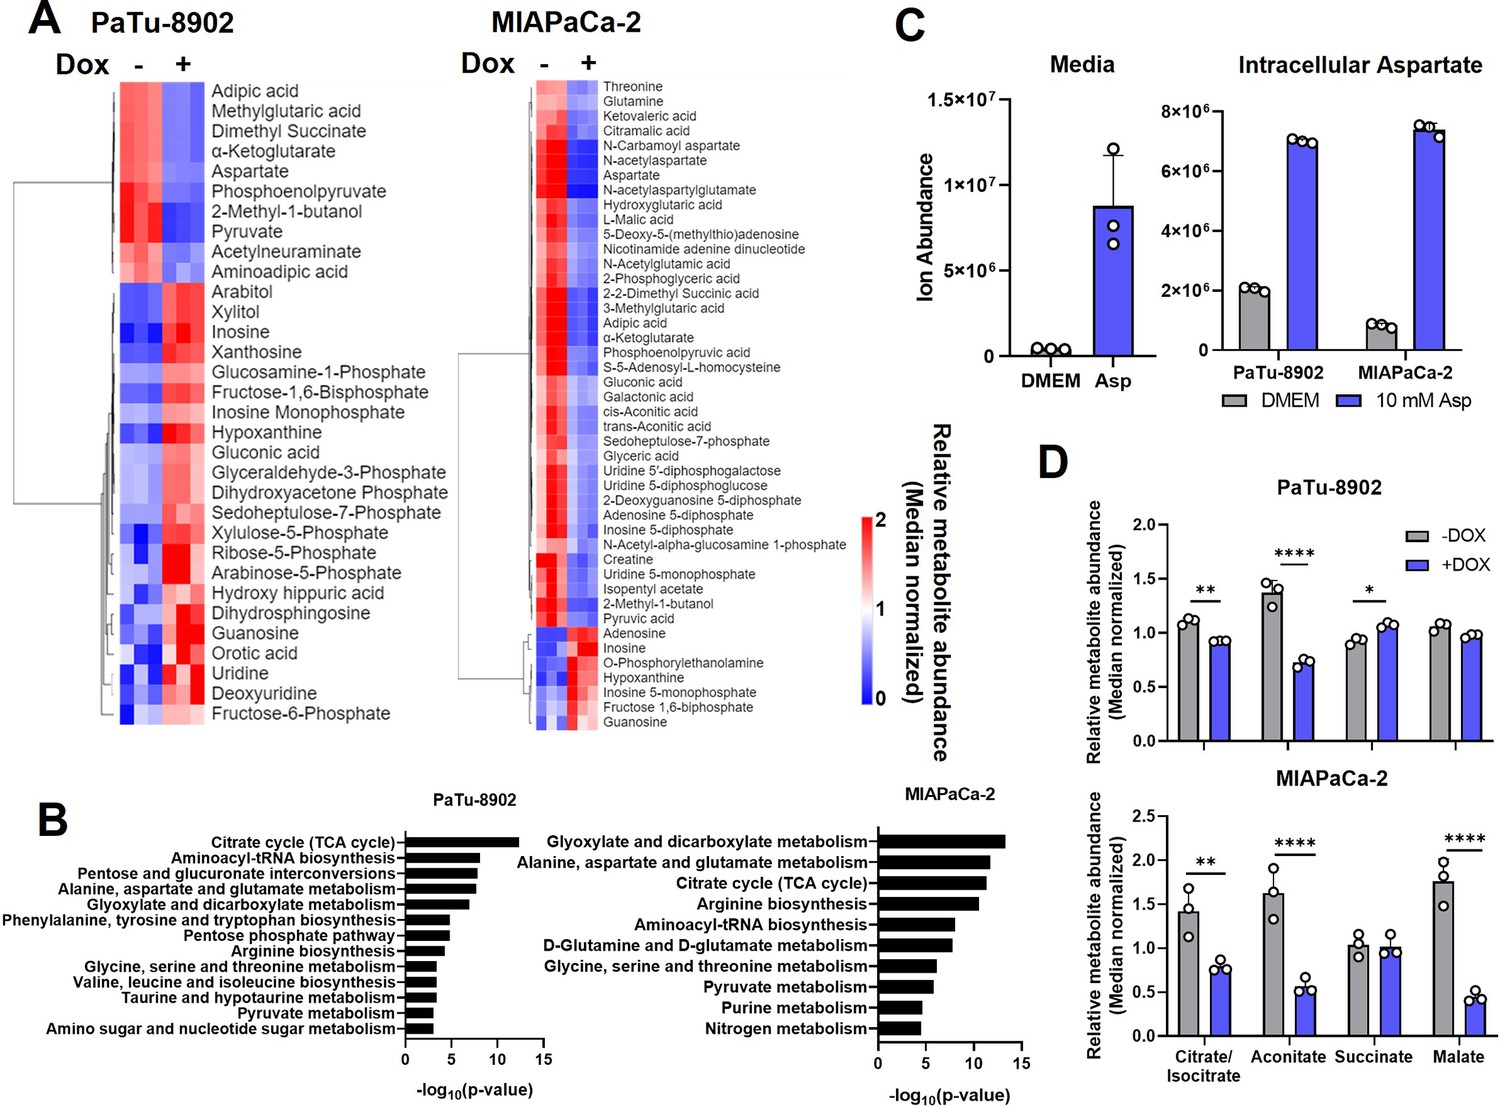
Metabolic effect of GOT2 KD in vitro in pancreatic cancer cell lines.
(A) Heatmaps of the relative abundances of metabolites significantly (p<0.05) different between −Dox (n=3) and +Dox (n=3) PaTu-8902 (left) and MIAPaCa-2 (right) ishGOT2.1 cells. (B) Metabolic pathway analysis of the data presented in (A). (C) Ion abundances of aspartate (Asp) in normal media or media with 10 mM Asp (left) and intracellular abundances in PaTu-8902 and MIAPaCa-2 cultured in normal media or media with 10 mM Asp (right). (D) Relative abundances of tricarboxylic acid (TCA) cycle metabolites in PaTu-8902 (top) or MIAPaCa-2 (bottom) ishGOT2.1 −Dox (n=3) or +Dox (n=3). For all panels, data represent mean ± SD. *p<0.05, **p<0.01, ***p<0.001, and ****p<0.0001.
Figure 2 with 3 supplements
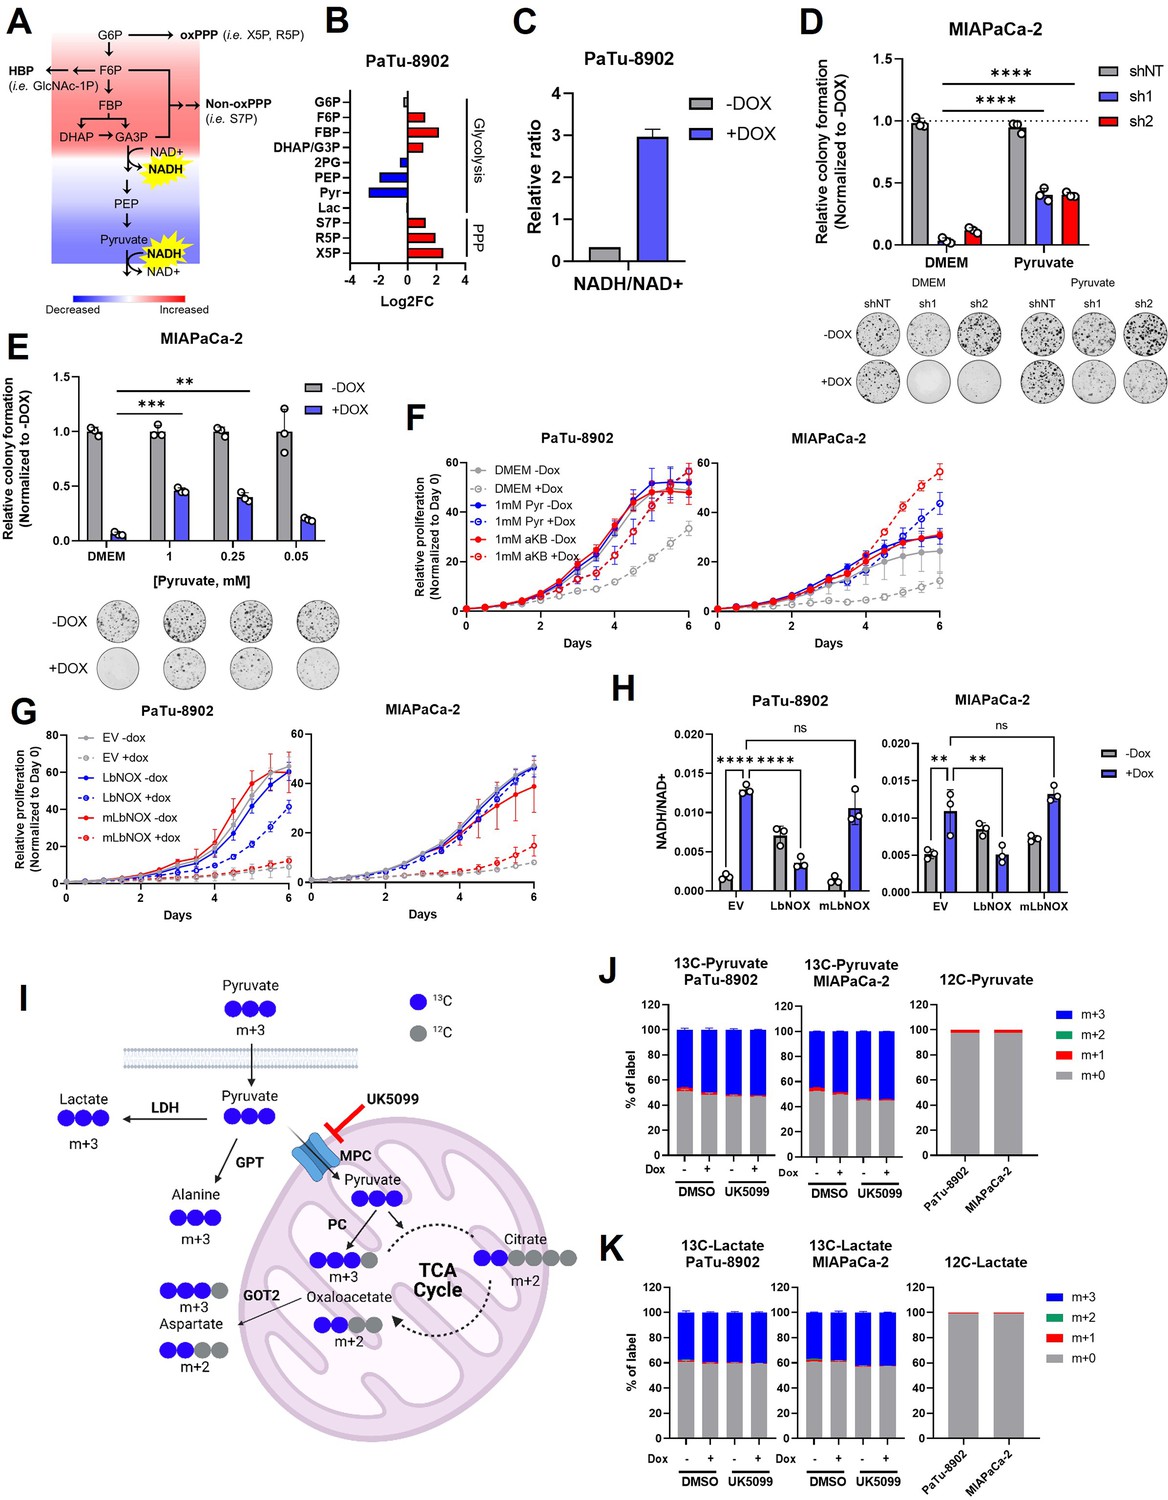
Glutamate-oxaloacetate transaminase 2 (GOT2) knockdown (KD) induces reductive stress, which can be ameliorated by NADH turnover.
(A) Schematic of glycolytic signature induced by GOT2 KD-mediated NADH buildup and reductive stress. G6P: glucose-6-phosphate; F6P: fructose-6-phosphate; FBP: fructose-1,6-bisphosphate; DHAP: dihydroxyacetone phosphate; GA3P: glyceraldehyde-3-phosphate; PEP: phosphoenol pyruvate; oxPPP: oxidative pentose phosphate pathway; non-oxPPP: non-oxidative pentose phosphate pathway; X5P: xylulose-5-phosphate; R5P: ribose-5-phosphate; S7P: seduoheptulose-7-phosphate; HBP: hexosamine biosynthesis pathway; and GlcNAc-1P: N-acetylglucosamine 1-phosphate. (B) Relative fold changes in the indicated metabolites between PaTu-8902 ishGOT2.1 −Dox (n=3) and +Dox (n=3). 2PG: 2-phosphoglycerate; Pyr: pyruvate; and Lac: lactate. (C) Relative NADH/NAD+ ratio in PaTu-8902 ishGOT2.1 −Dox (n=3) and +Dox (n=3). (D) Relative colony formation of MIAPaCa-2 ishRNA −Dox (n=3) or +Dox (n=3) cultured in normal media (Dulbecco’s modified Eagle medium, DMEM) or DMEM with 1 mM pyruvate, normalized to −Dox for each condition. (E) Relative colony formation of MIAPaCa-2 ishGOT2.1 −Dox (n=3) or +Dox (n=3) cultured in normal media (DMEM) or DMEM with the indicated concentrations of pyruvate (mM), normalized to −Dox for each condition. (F) Relative proliferation of PaTu-8902 (left) and MIAPaCa-2 (right) ishGOT2.1 −Dox (n=3) or +Dox (n=3) cultured in normal media (DMEM) or DMEM with 1 mM Pyr or α-ketobutyrate (αKB), normalized to Day 0 for each condition. (G) Relative proliferation of PaTu-8902 (left) and MIAPaCa-2 (right) ishGOT2.1 −Dox (n=3) or +Dox (n=3) expressing doxycycline-inducible empty vector (EV), cytosolic Lactobacillus NADH oxidase (LbNOX), or mitochondrial LbNOX (mLbNOX), normalized to Day 0 for each condition. (H) Relative NADH/NAD+ ratio of PaTu-8902 (left) and MIAPaCa-2 (right) ishGOT2.1 −Dox (n=3) or +Dox (n=3) expressing EV, LbNOX, or mLbNOX. (I) Schematic of 13C3-pyruvate into relevant metabolic pathways. 13C-carbon labels in blue, non-labeled carbon in gray. LDH: lactate dehydrogenase; GPT: glutamate-pyruvate transaminase; MPC: mitochondrial pyruvate carrier; and PC: pyruvate carboxylase. (J–K) Fractional labeling of intracellular pyruvate (J) or lactate (K) in PaTu-8902 and MIAPaCa-2 ishGOT2.1 −Dox (n=3) or +Dox (n=3) cultured in 1 mM 13C3-pyruvate and treated with DMSO vehicle control or 5 µM UK5099 (MPC inhibitor). Unlabeled controls presented at right. For all panels, data represent mean ± SD. *p<0.05, **p<0.01, ***p<0.001, and ****p<0.0001.
Figure 2—figure supplement 1
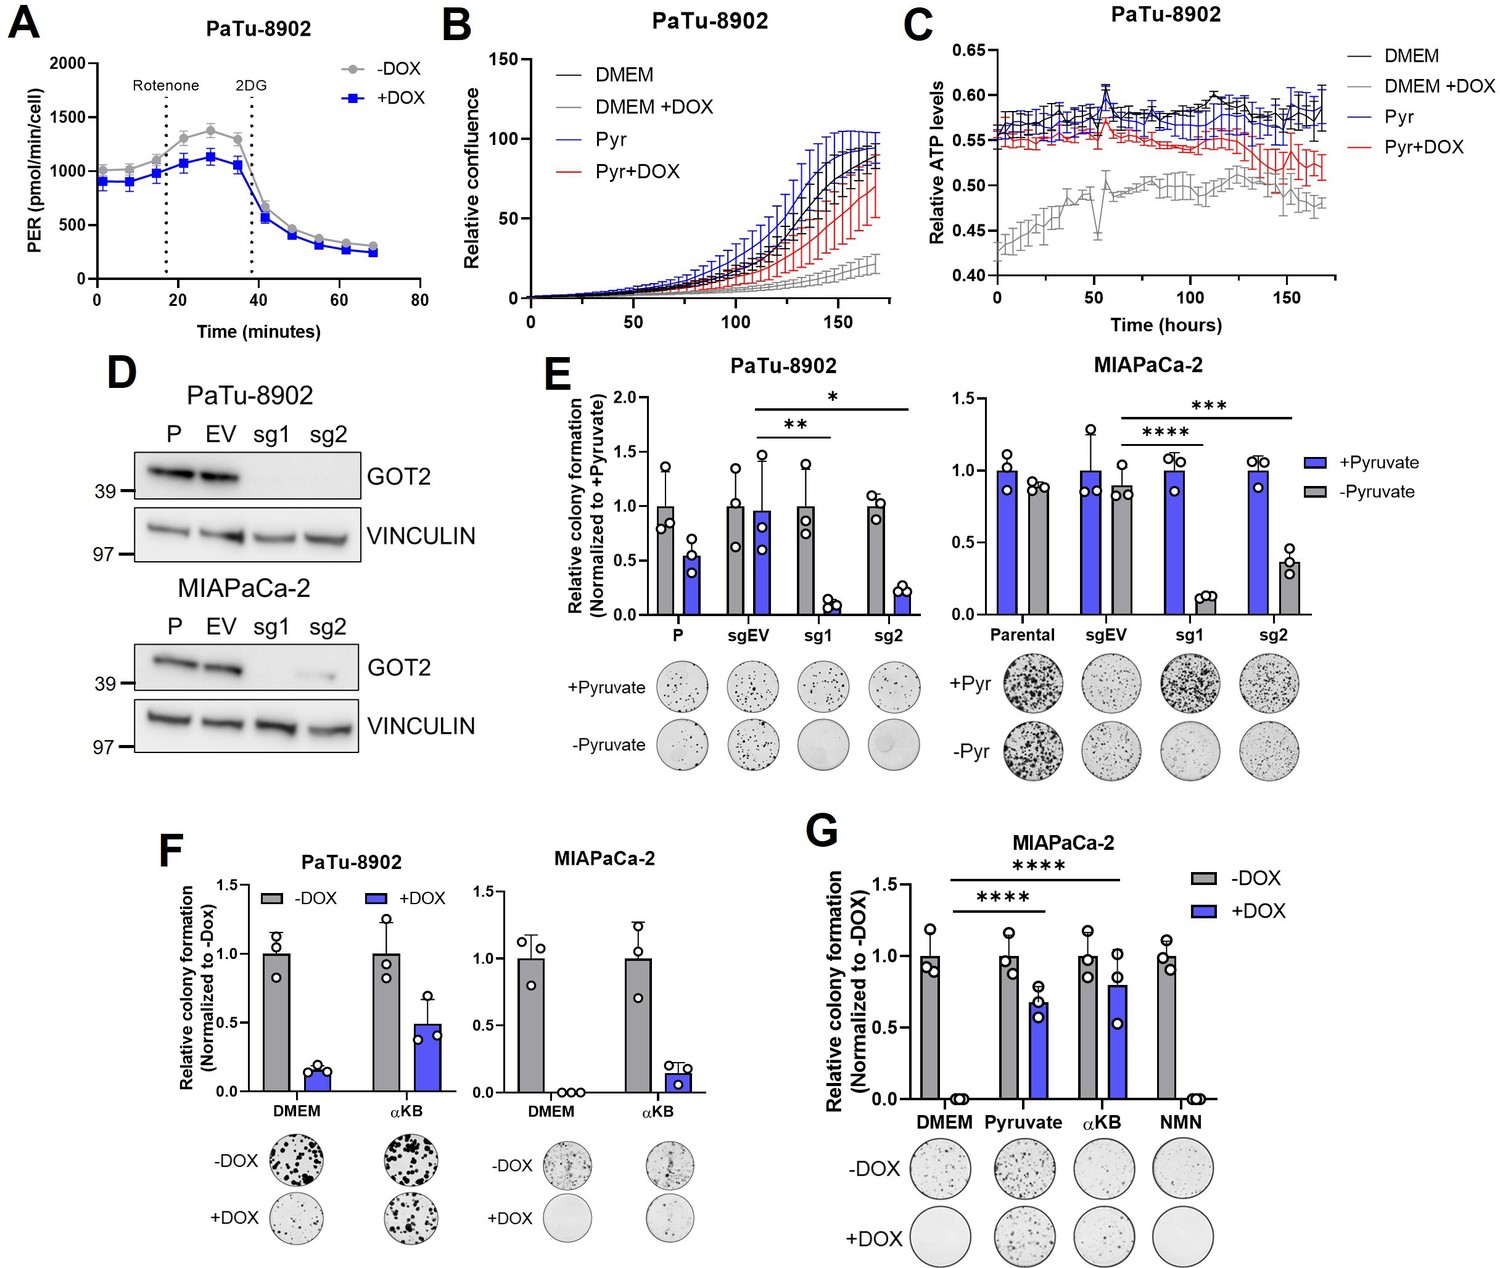
GOT2 loss in vitro slows glycolysis and can be rescued by exogenous electron acceptors.
(A) Glycolytic rate assay showing the proton efflux rate (PER) of PaTu-8902 ishGOT2.1 −Dox (n=4) or +Dox (n=4). (B–C) Relative proliferation (B) and ATP levels (C) of PaTu-8902 ishGOT2.1 −Dox (n=3) or +Dox (n=3) cultured in normal Dulbecco’s modified Eagle medium (DMEM) or DMEM with 1 mM pyruvate (Pyr). (D) Immunoblots of GOT2 and VINCULIN loading control in PaTu-8902 (top) and MIAPaCa-2 (bottom) parental (P), empty vector (EV), or two sgRNAs targeting GOT2 (sg1, sg2). (E) Relative colony formation of PaTu-8902 (left) and MIAPaCa-2 (right) P, EV, sgGOT2.1, or sgGOT2.2 cultured in normal DMEM (−Pyr, n=3) or DMEM with 1 mM pyruvate (+Pyr, n=3), normalized to +Pyr for each condition. (F) Relative colony formation of PaTu-8902 (left) and MIAPaCa-2 (right) ishGOT2.1 −Dox (n=3) or +Dox (n=3) cultured in normal media (DMEM) or DMEM with 1 mM α-ketobutyrate (αKB), normalized to −Dox for each condition. (G) Relative colony formation of MIAPaCa-2 ishGOT2.1 −Dox (n=3) or +Dox (n=3) cultured in normal media (DMEM) or DMEM with 1 mM Pyr, αKB, or nicotinaminde mononucleotide (NMN), normalized to −Dox for each condition. For all panels, data represent mean ± SD. *p<0.05, **p<0.01, ***p<0.001, and ****p<0.0001.
-
Figure 2—figure supplement 1—source data 1
Full western blot images for Figure 2—figure supplement 1D.
- https://cdn.elifesciences.org/articles/73245/elife-73245-fig2-figsupp1-data1-v2.zip
Figure 2—figure supplement 2
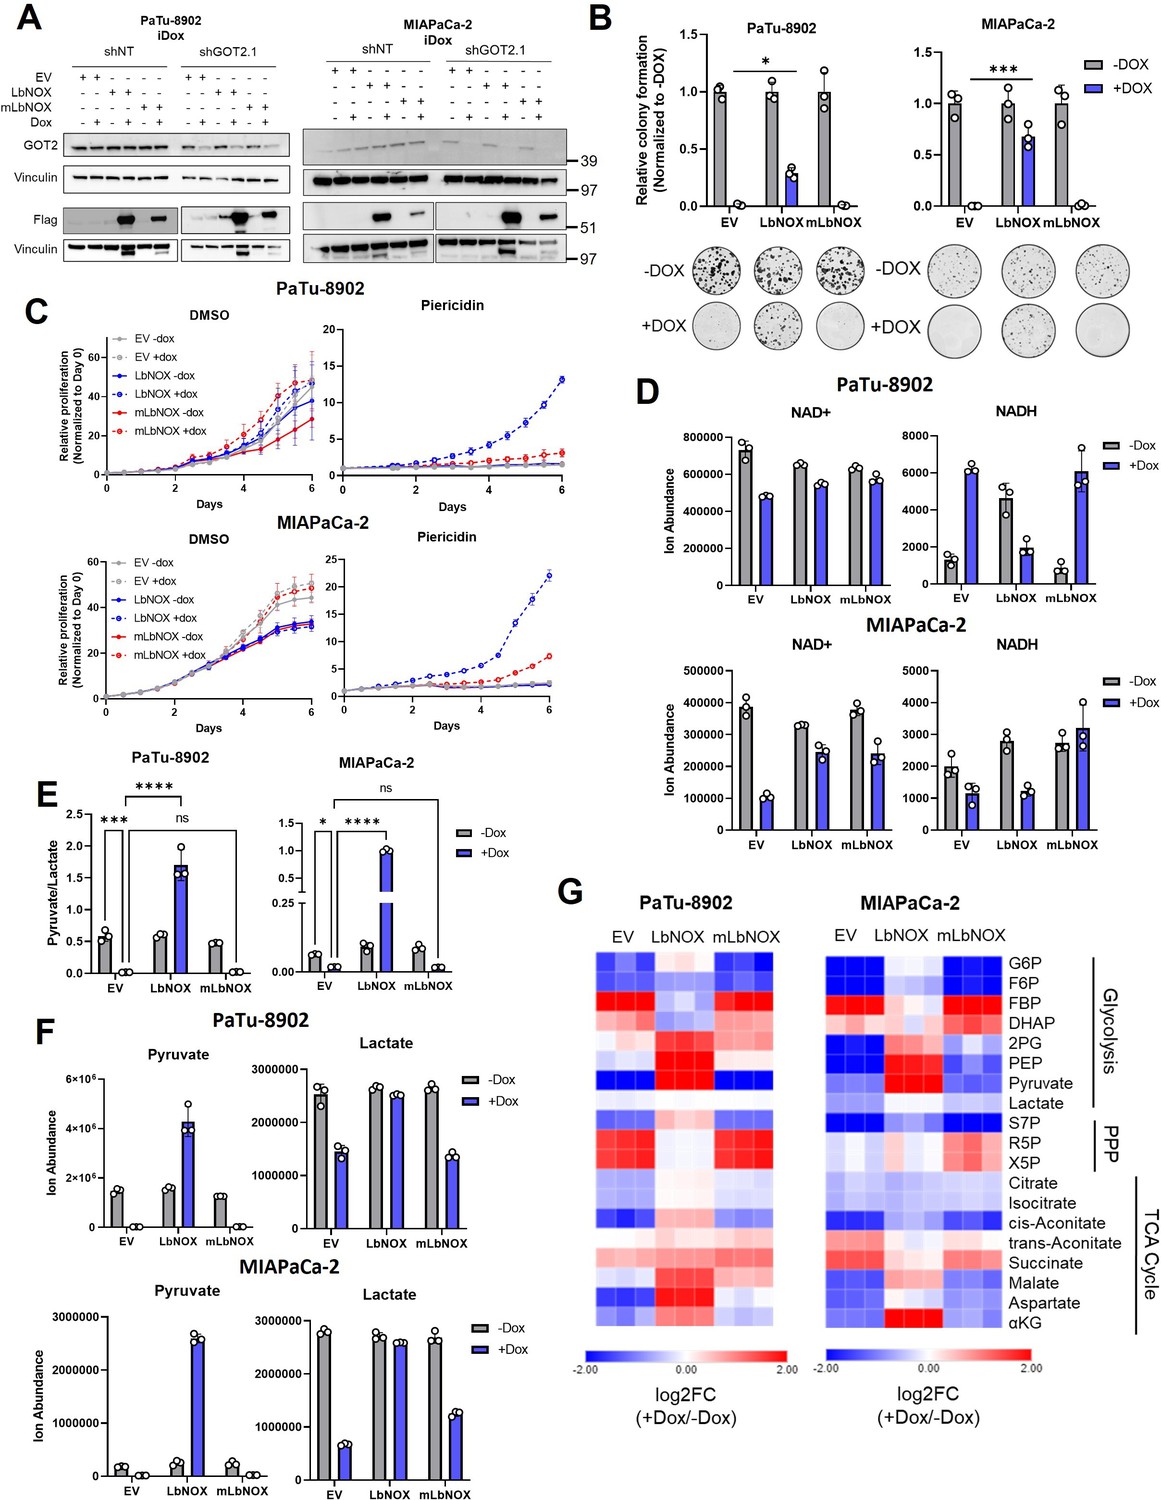
GOT2 KD can be rescued by cytosolic, but not mitochondrial, expression of LbNOX.
(A) Immunoblots of glutamate-oxaloacetate transaminase 2 (GOT2), FLAG, and VINCULIN loading controls from PaTu-8902 (left) or MIAPaCa-2 (right) ishNT or GOT2.1 cells expressing doxycycline-inducible expression of empty vector (EV) or FLAG-tagged cytosolic Lactobacillus NADH oxidase (LbNOX) or mitochondrial LbNOX (mLbNOX). (B) Relative colony formation of PaTu-8902 (left) and MIAPaCa-2 (right) ishGOT2.1 −Dox (n=3) or +Dox (n=3) expressing EV, LbNOX, or mLbNOX, normalized to −Dox for each condition. (C) Relative proliferation of PaTu-8902 (top) and MIAPaCa-2 (bottom) ishNT −Dox (n=3) or +Dox (n=3) expressing EV, LbNOX, or mLbNOX and treated with dimethyl sulfoxide (DMSO) vehicle control (left) or 1 µM piericidin (right), normalized to Day 0 for each condition. (D) Ion abundances of NAD+ (left) and NADH (right) in PaTu-8902 (top) and MIAPaCa-2 (bottom) ishGOT2.1 −Dox (n=3) and +Dox (n=3). (E) Relative extracellular pyruvate/lactate ratios in PaTu-8902 (left) and MIAPaCa-2 (right) ishGOT2.1 −Dox (n=3) and +Dox (n=3). (F) Ion abundances of extracellular pyruvate (left) and lactate (right) in PaTu-8902 (top) and MIAPaCa-2 (bottom) ishGOT2.1 −Dox (n=3) and +Dox (n=3). (G) Heatmap of log2 fold changes in metabolite abundances between PaTu-8902 (left) and MIAPaCa-2 (right) ishGOT2.1 −Dox (n=3) and +Dox (n=3) expressing EV, LbNOX, or mLbNOX. G6P: glucose-6-phosphate; F6P: fructose-6-phosphate; FBP: fructose-1,6-bisphosphate; DHAP: dihydroxyacetone phosphate; 2PG: 2-phosphoglycerate; PEP: phosphoenol pyruvate; X5P: xylulose-5-phosphate; R5P: ribose-5-phosphate; S7P: seduoheptulose-7-phosphate; αKG: α-ketoglutarate; and P: pentose phosphate pathway. For all panels, data represent mean ± SD. *p<0.05, **p<0.01, ***p<0.001, and ****p<0.0001.
-
Figure 2—figure supplement 2—source data 1
Full western blot images for Figure 2—figure supplement 2A.
- https://cdn.elifesciences.org/articles/73245/elife-73245-fig2-figsupp2-data1-v2.zip
Figure 2—figure supplement 3

Cytosolic reduction of pyruvate to lactate is necessary for GOT2 KD.
(A) Relative proliferation of PaTu-8902 (left) and MIAPaCa-2 (right) ishGOT2.1 −Dox (n=3) or +Dox (n=3) cultured in 1 mM glucose Dulbecco’s modified Eagle medium (DMEM) with 1 mM pyruvate (Pyr) normalized to Day 0 for each condition. (B–D) Fractional labeling of intracellular citrate (B), aspartate (C), or alanine (D) from 13C3-pyruvate (1 mM) in PaTu-8902 and MIAPaCa-2 ishGOT2.1 −Dox (n=3) or +Dox (n=3) treated with DMSO vehicle control or 5 µM UK5099 (mitochondrial pyruvate carrier (MPC) inhibitor). Unlabeled controls presented at right. (E) Relative cell number of MIAPaCa-2 ishGOT2.1 −Dox (n=3) or +Dox (n=3) cultured in normal DMEM or DMEM with 1 mM Pyr, treated with DMSO vehicle control or 5 µM UK5099, and normalized to DMSO for each condition. (F) Relative colony formation of MIAPaCa-2 ishGOT2.1 −Dox (n=3) or +Dox (n=3) cultured in normal DMEM or DMEM with 1 mM Pyr or lactate (Lac), normalized to −Dox for each condition. (G) Relative colony formation of PaTu-8902 (left) and MIAPaCa-2 (right) ishGOT2.1 −Dox (n=3) or +Dox (n=3) cultured in normal DMEM or DMEM with 1 mM alanine, normalized to −Dox for each condition. (H) Relative colony formation of MIAPaCa-2 ishGOT2.1 −Dox (n=3) or +Dox (n=3) cultured in normal DMEM or DMEM with either 1 mM Pyr or 100 µM of the indicated combinations of adenine (A), guanine (G), thymidine (T), and cytidine (C), normalized to −Dox for each condition. For all panels, data represent mean ± SD. *p<0.05, **p<0.01, ***p<0.001, and ****p<0.0001.
Figure 3 with 1 supplement
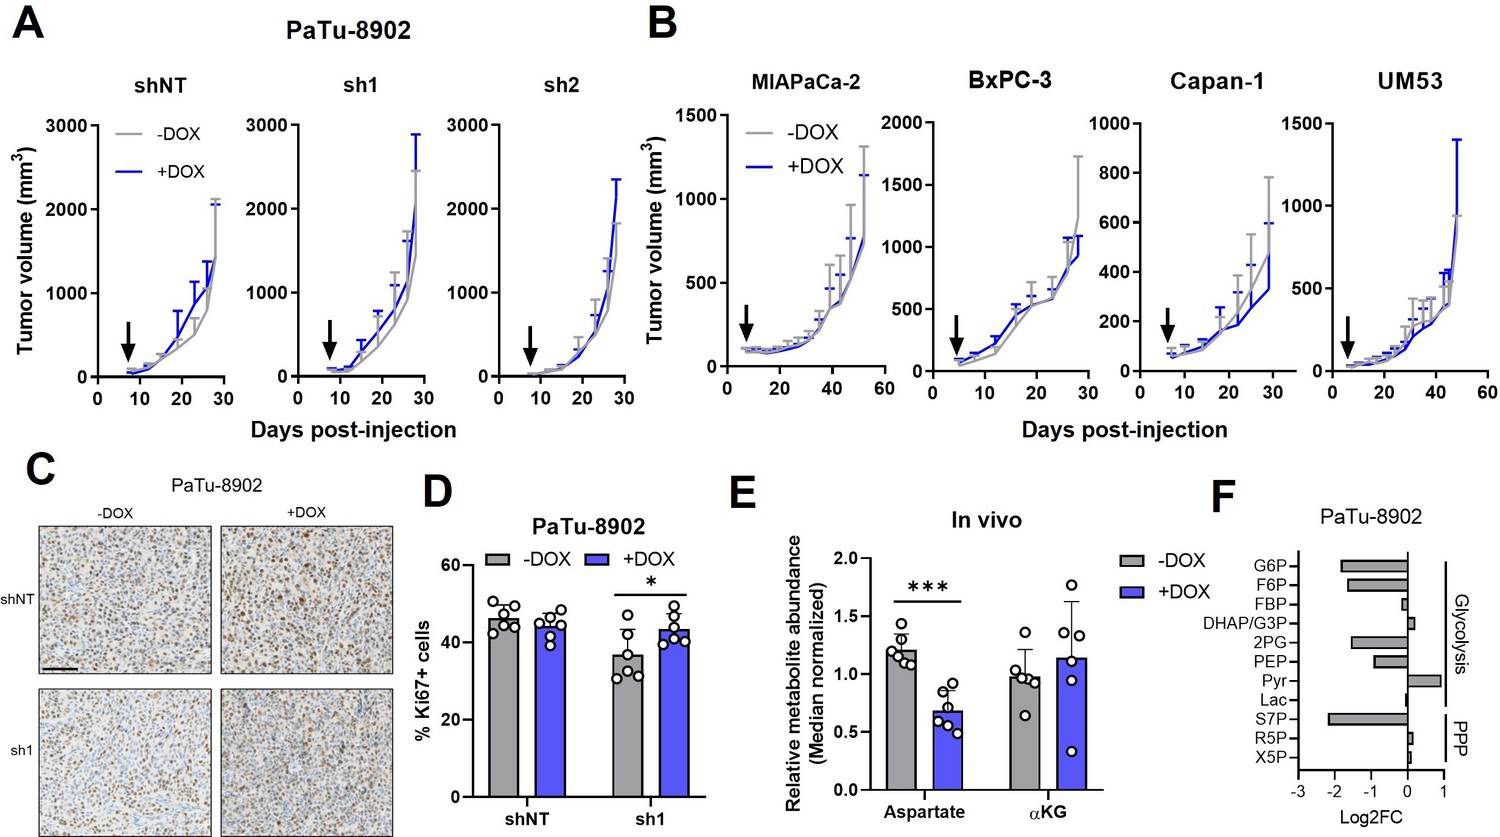
Glutamate-oxaloacetate transaminase 2 (GOT2) is not required for in vivo growth of pancreatic ductal adenocarcinoma (PDA) xenografts.
(A) Tumor volumes of PaTu-8902 ishRNA flank xenografts in NOD scid gamma (NSG) mice fed normal chow (−Dox, n=6) or doxycycline chow (+Dox, n=6). Arrows indicate administration of Dox chow 1 week after PDA cell injection. (B) Tumor volumes of four additional PDA cell line ishGOT2.1 flank xenografts in NSG mice fed normal chow (−Dox, n=6) or doxycycline chow (+Dox, n=6). Arrows indicate administration of Dox chow 1 week after PDA cell injection. (C) Immunohistochemistry for Ki67 in flank xenograft tissue from PaTu-8902 ishRNA −Dox (n=6) or +Dox (n=6). Scale bar is 100 µm. (D) Quantification of Ki67+ cells in tissue depicted in (C). (E) Relative abundances of Asp and αKG in PaTu-8902 ishGOT2.1 −Dox (n=6) or +Dox (n=6) flank xenografts. (F) Relative fold changes in the indicated metabolites between PaTu-8902 ishGOT2.1 −Dox (n=6) and +Dox (n=6) flank xenografts. G6P: glucose-6-phosphate; F6P: fructose-6-phosphate; FBP: fructose-1,6-bisphosphate; DHAP: dihydroxyacetone phosphate; GA3P: glyceraldehyde-3-phosphate; 2PG: 2-phosphoglycerate; PEP: phosphoenol pyruvate; Pyr: pyruvate; Lac: Lactate; X5P: xylulose-5-phosphate; R5P: ribose-5-phosphate; S7P: seduoheptulose-7-phosphate; and P: pentose phosphate pathway. For all panels, data represent mean ± SD. *p<0.05, **p<0.01, ***p<0.001, and ****p<0.0001.
Figure 3—figure supplement 1
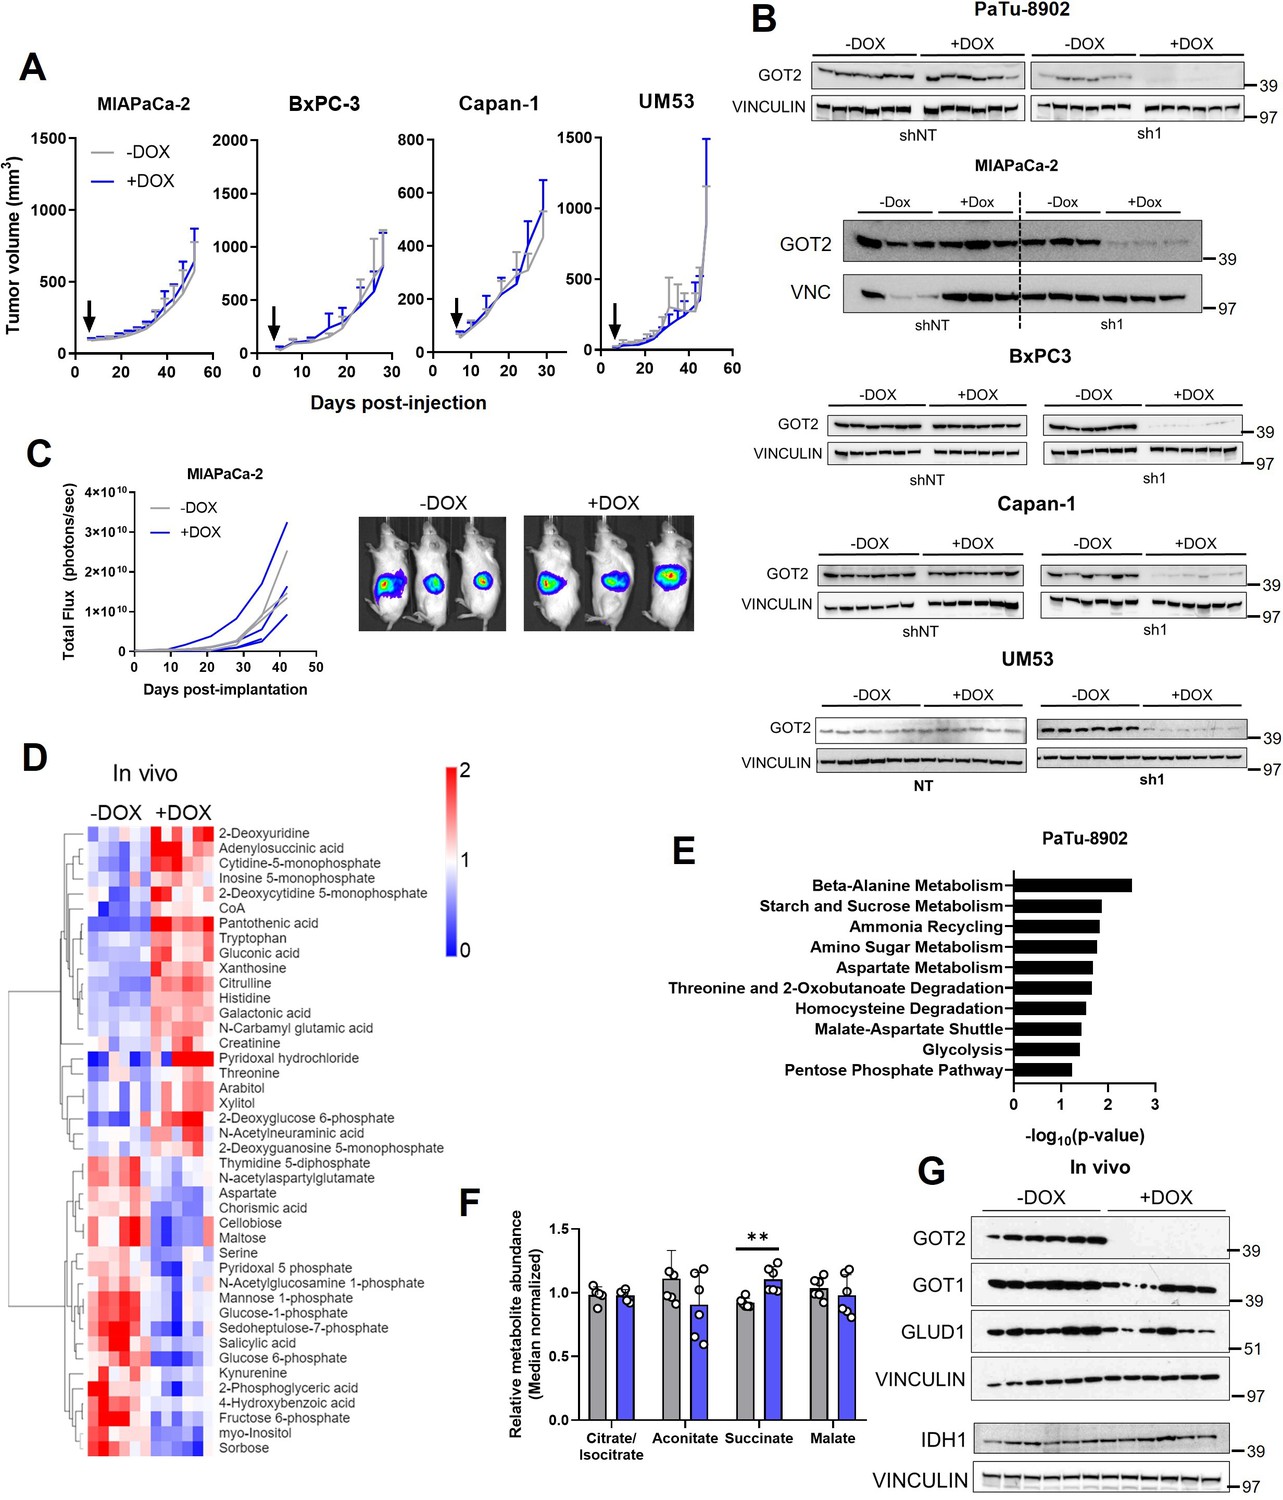
GOT2 KD does not impede tumor growth or metabolism in vivo.
(A) Tumor volumes of pancreatic ductal adenocarcinoma (PDA) cell line ishNT flank xenografts in NOD scid gamma (NSG) mice fed normal chow (−Dox, n=6) or doxycycline chow (+Dox, n=6). Arrows indicate administration of Dox chow 1 week after PDA cell injection. (B) Immunoblots for glutamate-oxaloacetate transaminase 2 (GOT2) and VINCULIN loading control in PDA ishRNA −Dox or +Dox xenografts at endpoint. Each lane represents an independent xenograft. (C) Bioluminescence of MIAPaCa-2 GFP-Luc ishGOT2.1 −Dox (n=3) or +Dox (n=3) orthotopic xenografts. (D) Heatmaps of the relative abundances of metabolites significantly (p<0.05) different between PaTu-8902 ishGOT2.1 −Dox (n=6) and +Dox (n=6) flank xenografts. (E) Metabolic pathway analysis of the data presented in (D). (F) Relative abundances of tricarboxylic acid cycle metabolites in PaTu-8902 ishGOT2.1 −Dox (n=6) or +Dox (n=6) flank xenografts. (G) Immunoblots for GOT2, GOT1, GLUD1, IDH1, and VINCULIN in PaTu-8902 ishGOT2.1 −Dox or +Dox flank xenografts at endpoint. For all panels, data represent mean ± SD. *p<0.05, **p<0.01, ***p<0.001, and ****p<0.0001.
-
Figure 3—figure supplement 1—source data 1
Full western blot images for Figure 3—figure supplement 1B,G.
- https://cdn.elifesciences.org/articles/73245/elife-73245-fig3-figsupp1-data1-v2.zip
Figure 4 with 1 supplement
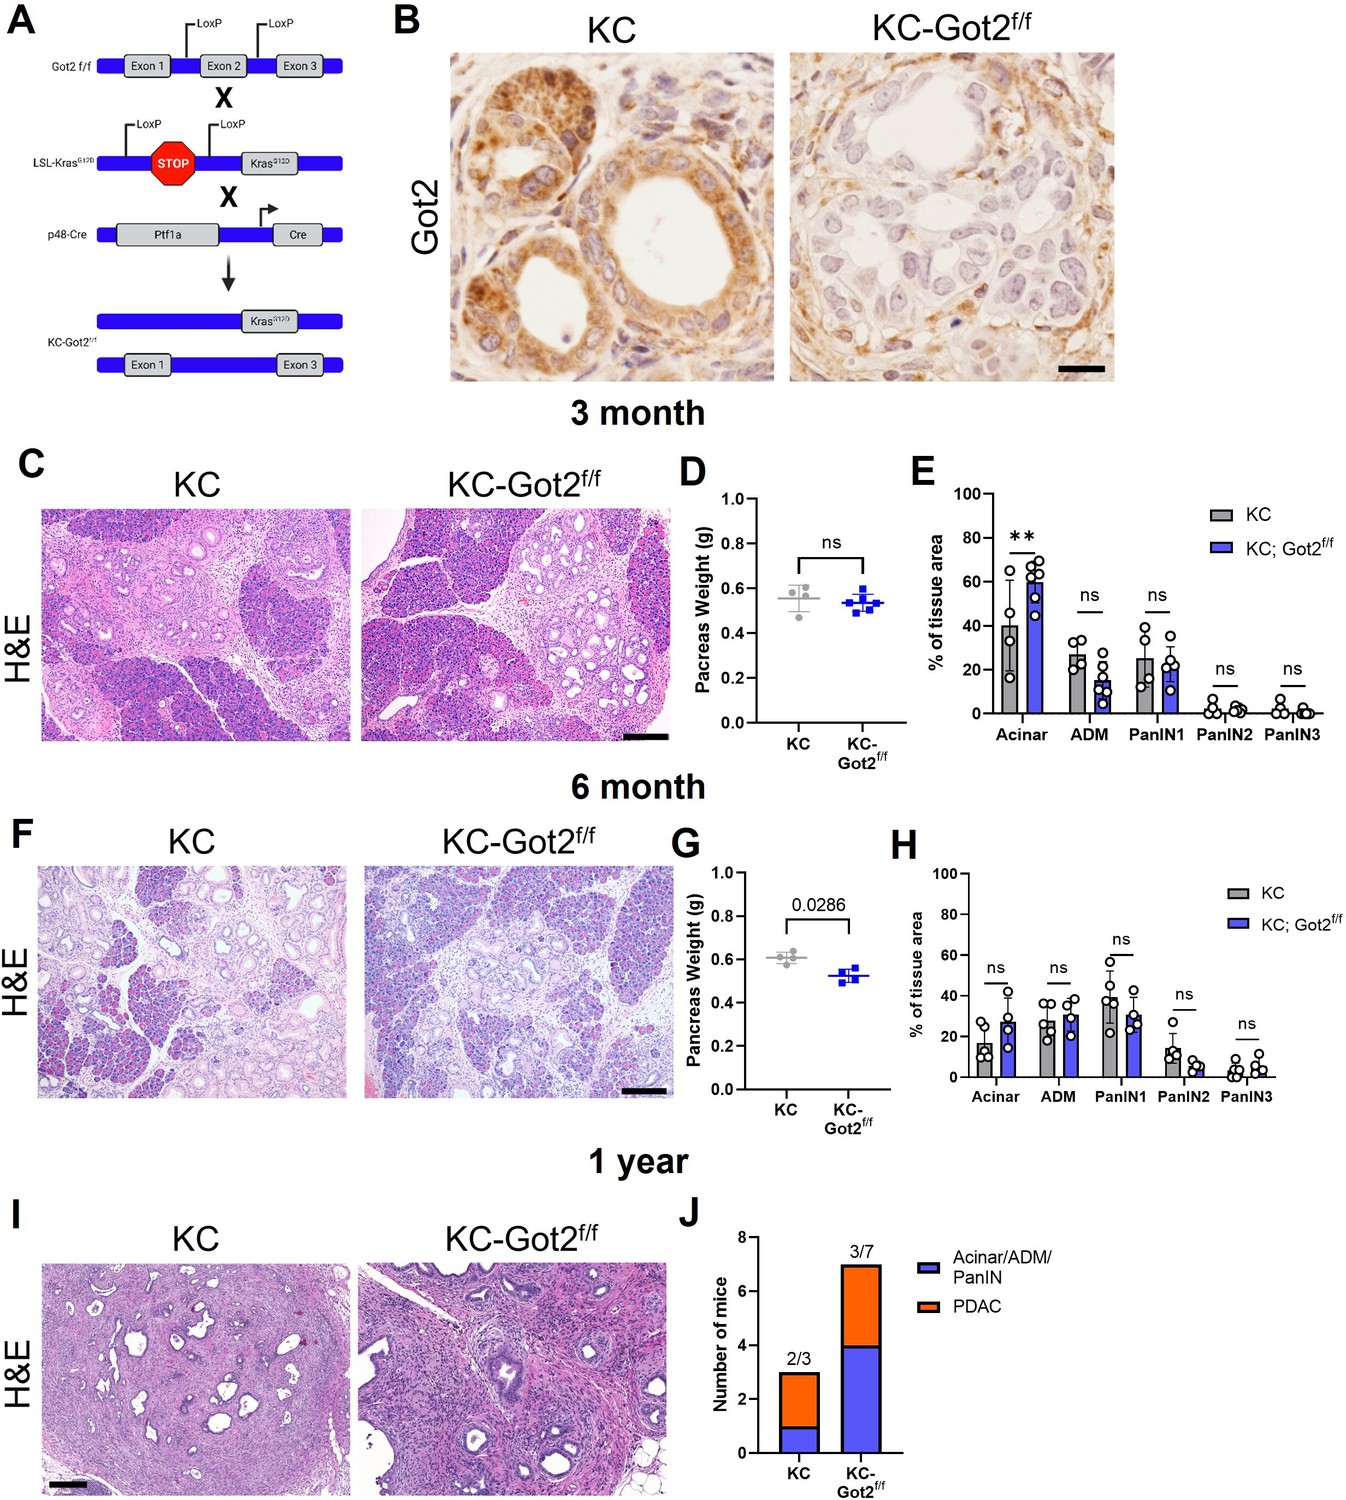
Glutamate-oxaloacetate transaminase 2 (GOT2) deletion does not impact on pancreatic ductal adenocarcinoma (PDA) tumorigenesis in an autochthonous model.
(A) Got2 deletion (floxed exon 2) with expression of mutant Kras (LSL-KrasG12D) driven by epithelial pancreas-specific Cre recombinase (p48-Cre) on an immunocompetent (C57B/6) background (KC-Got2). (B) Representative immunohistochemistry (IHC) for Got2 in pancreata from 3-month-old KC-Got2 or age-matched KC historic controls. Scale bar is 50 µM. (C) Representative hematoxylin and eosin (H&E) staining of pancreata from 3-month KC (n=4) or KC-Got2 (n=6) mice. Scale bar is 200 µM. (D) Pancreas weights of 3-month KC (n=4) or KC-Got2 (n=6) mice. (E) Quantitation of H&E staining from (C) of tissue area with healthy acinar cells, acinar-ductal metaplasia (ADM), or pancreatic intraepithelial (PanIN) lesion severity. (F) Representative H&E staining of pancreata from 6-month KC (n=5) or KC-Got2 (n=4) mice. Scale bar is 200 µM. (G) Pancreas weights of 6-month KC (n=4) or KC-Got2 (n=4) mice. (H) Quantitation of H&E staining from (F) of tissue area with healthy acinar cells, ADM, or PanIN lesion severity. (I) Representative H&E staining of pancreata from 1-year KC (n=3) or KC-Got2 (n=7) mice. Scale bar is 100 µM. (J) Number of KC or KC-Got2 tissue that had progressed to carcinoma at 1 year. For all panels, data represent mean ± SD. *p<0.05, **p<0.01, ***p<0.001, and ****p<0.0001.
Figure 4—figure supplement 1
Validation of Got2 loss in an autochthonous model of pancreatic tumorigenesis.
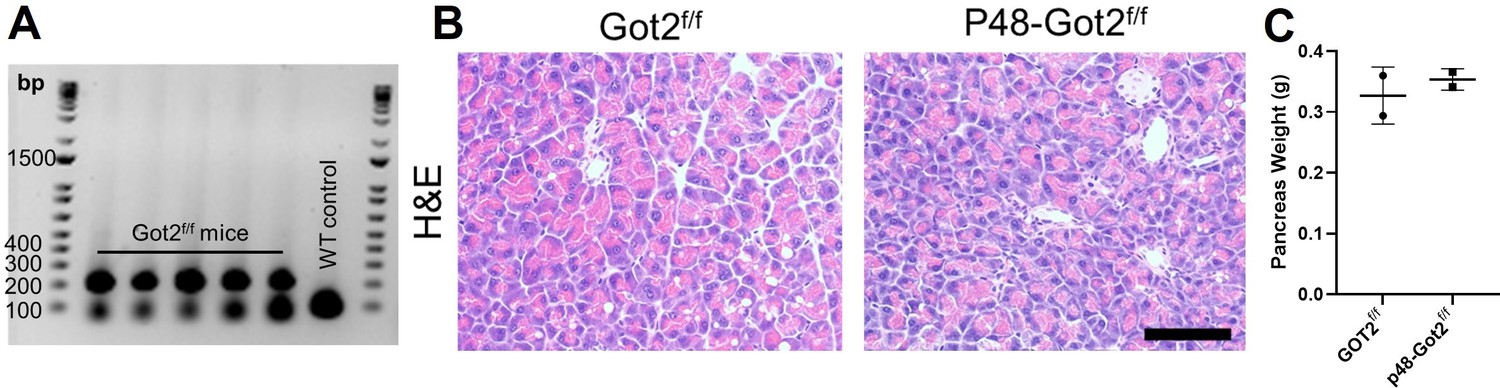
(A) DNA gel showing representative genotyping of DNA isolated from tails of Got2f/f mice or wild-type (WT) control. (B) Representative hematoxylin and eosin (H&E) staining of pancreata from 3 month WT (Got2 f/f, n=2) or p48-Got2 f/f (n=2) mice. Scale bar is 200 µM. (C) Pancreas weights of 3 month Got2 f/f (n=2) or p48-Got2 f/f (n=2) mice. For all panels, data represent mean ± SD. *p<0.05, **p<0.01, ***p<0.001, and ****p<0.0001.
Figure 5 with 2 supplements
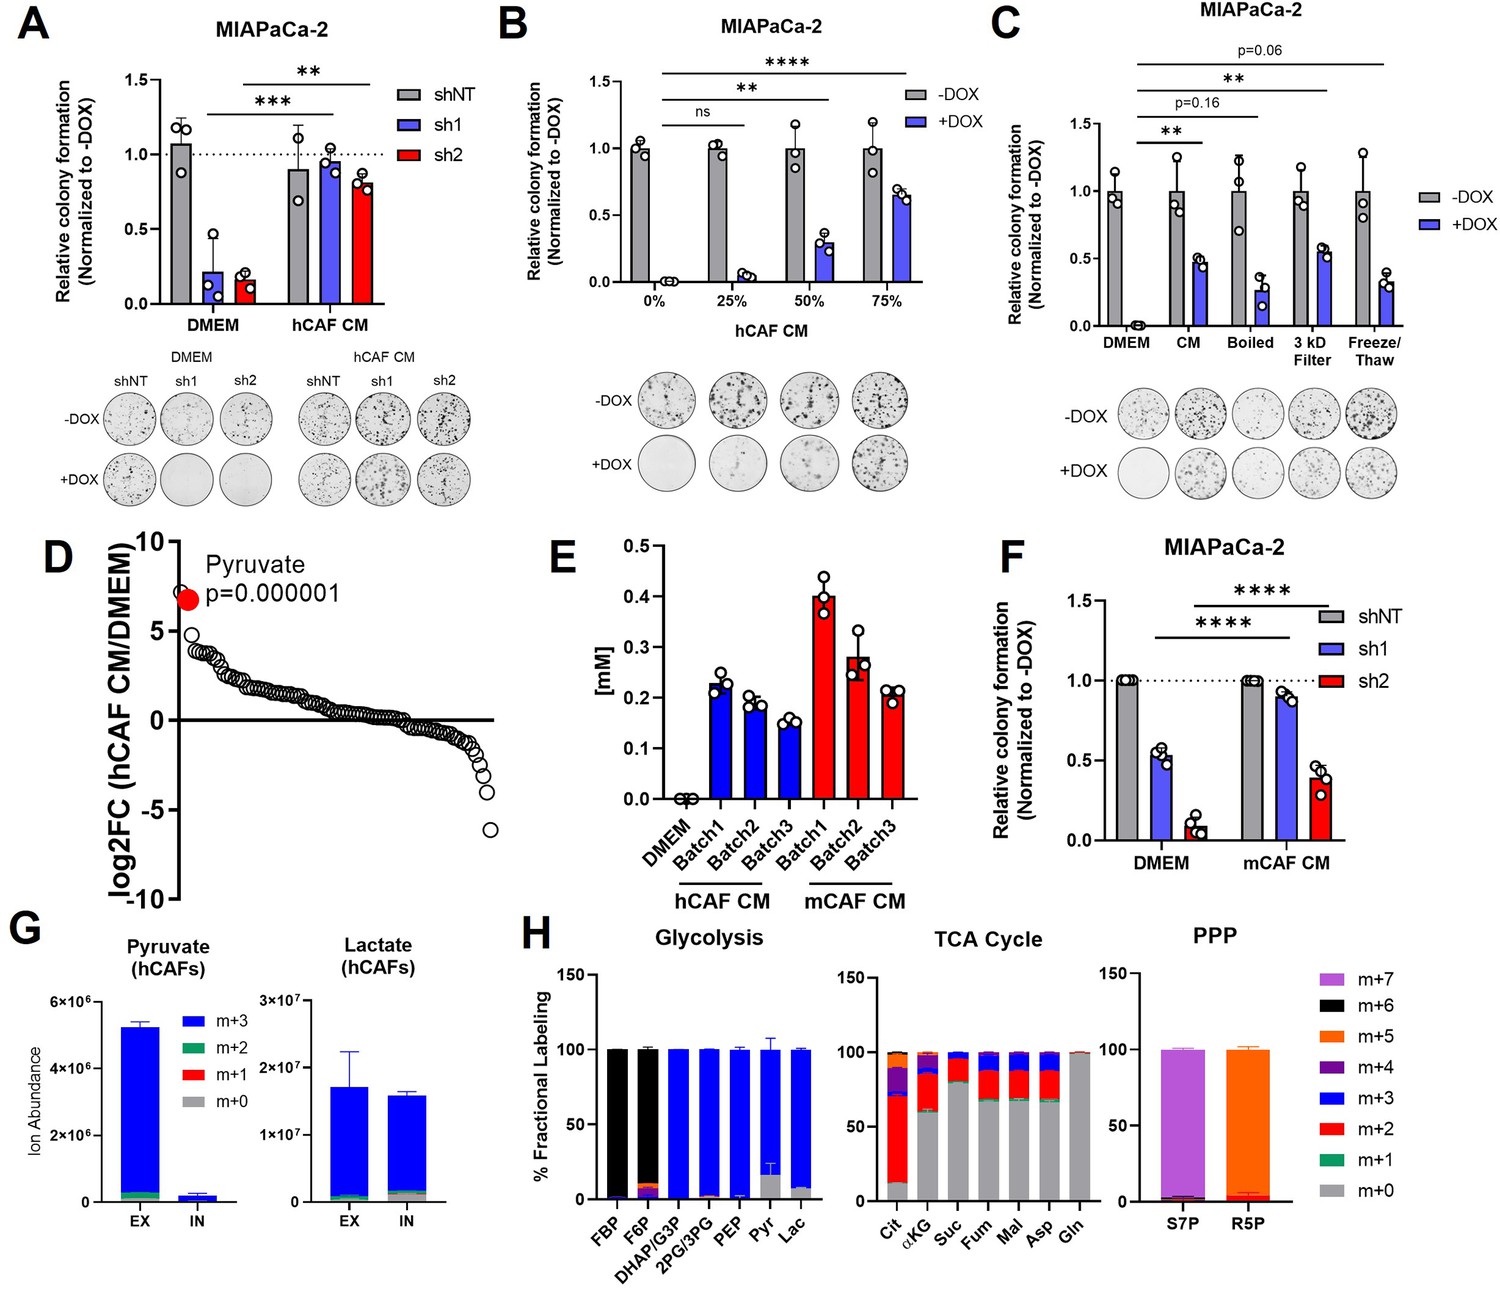
Pancreatic cancer-associated fibroblasts (CAFs) release pyruvate and compensate for loss of glutamate-oxaloacetate transaminase 2 (GOT2) in vitro.
(A) Relative colony formation of MIAPaCa-2 ishGOT2.1 −Dox (n=3) or +Dox (n=3) cultured in normal media (Dulbecco’s modified Eagle medium, DMEM) or human CAF (hCAF) conditioned media (CM) generated after 72 hr of conditioning, normalized to −Dox for each condition. (B) Relative colony formation of MIAPaCa-2 ishGOT2.1 −Dox (n=3) or +Dox (n=3) cultured in DMEM or indicated dilutions of hCAF CM, normalized to −Dox for each condition. (C) Relative colony formation of MIAPaCa-2 ishGOT2.1 −Dox (n=3) or +Dox (n=3) cultured in DMEM, mock-treated hCAF CM, boiled, 3 kDa filtered, or that subjected to freeze/thaw cycles. Data normalized to −Dox for each condition. (D) Ranked log2 fold changes of metabolite abundances in hCAF CM compared to pyruvate-free normal DMEM. (E) Absolute quantitation of pyruvate concentrations (mM) in three independently generated batches of hCAF or mouse CAF (mCAF) CM, including a pyruvate-free DMEM control. (F) Relative colony formation of MIAPaCa-2 ishGOT2.1 −Dox (n=3) or +Dox (n=3) cultured in normal media (DMEM) or mCAF CM, normalized to −Dox for each condition. (G) Ion abundance of extracellular (EX) or intracellular (IN) pyruvate (left) or lactate (right) isotopologues from hCAFs cultured with 25 mM 13C6-glucose. (H) Fractional labeling of intracellular glycolysis (left), tricarboxylic acid (TCA) cycle (middle), and pentose phosphate pathway (PPP, right) metabolites in hCAFs cultured with 25 mM 13C6-glucose. F6P: fructose-6-phosphate; FBP: fructose-1,6-bisphosphate; DHAP: dihydroxyacetone phosphate; G3P : glyceraldehyde-3-phosphate; 2PG: 2-phosphoglycerate; 3PG: 3-phosphoglycerate; PEP: phosphoenol pyruvate; Cit: citrate; αKG: α-ketoglutarate; Suc: succinate; Fum: fumarate; Mal: malate; Gln: glutamine; Asp: aspartate; S7P: seduoheptulose-7-phosphate; and R5P: ribose-5-phosphate. For all panels, data represent mean ± SD. *p<0.05, **p<0.01, ***p<0.001, and ****p<0.0001.
Figure 5—figure supplement 1
CAF metabolism supports GOT2 KD pancreatic cancer cells in vitro.
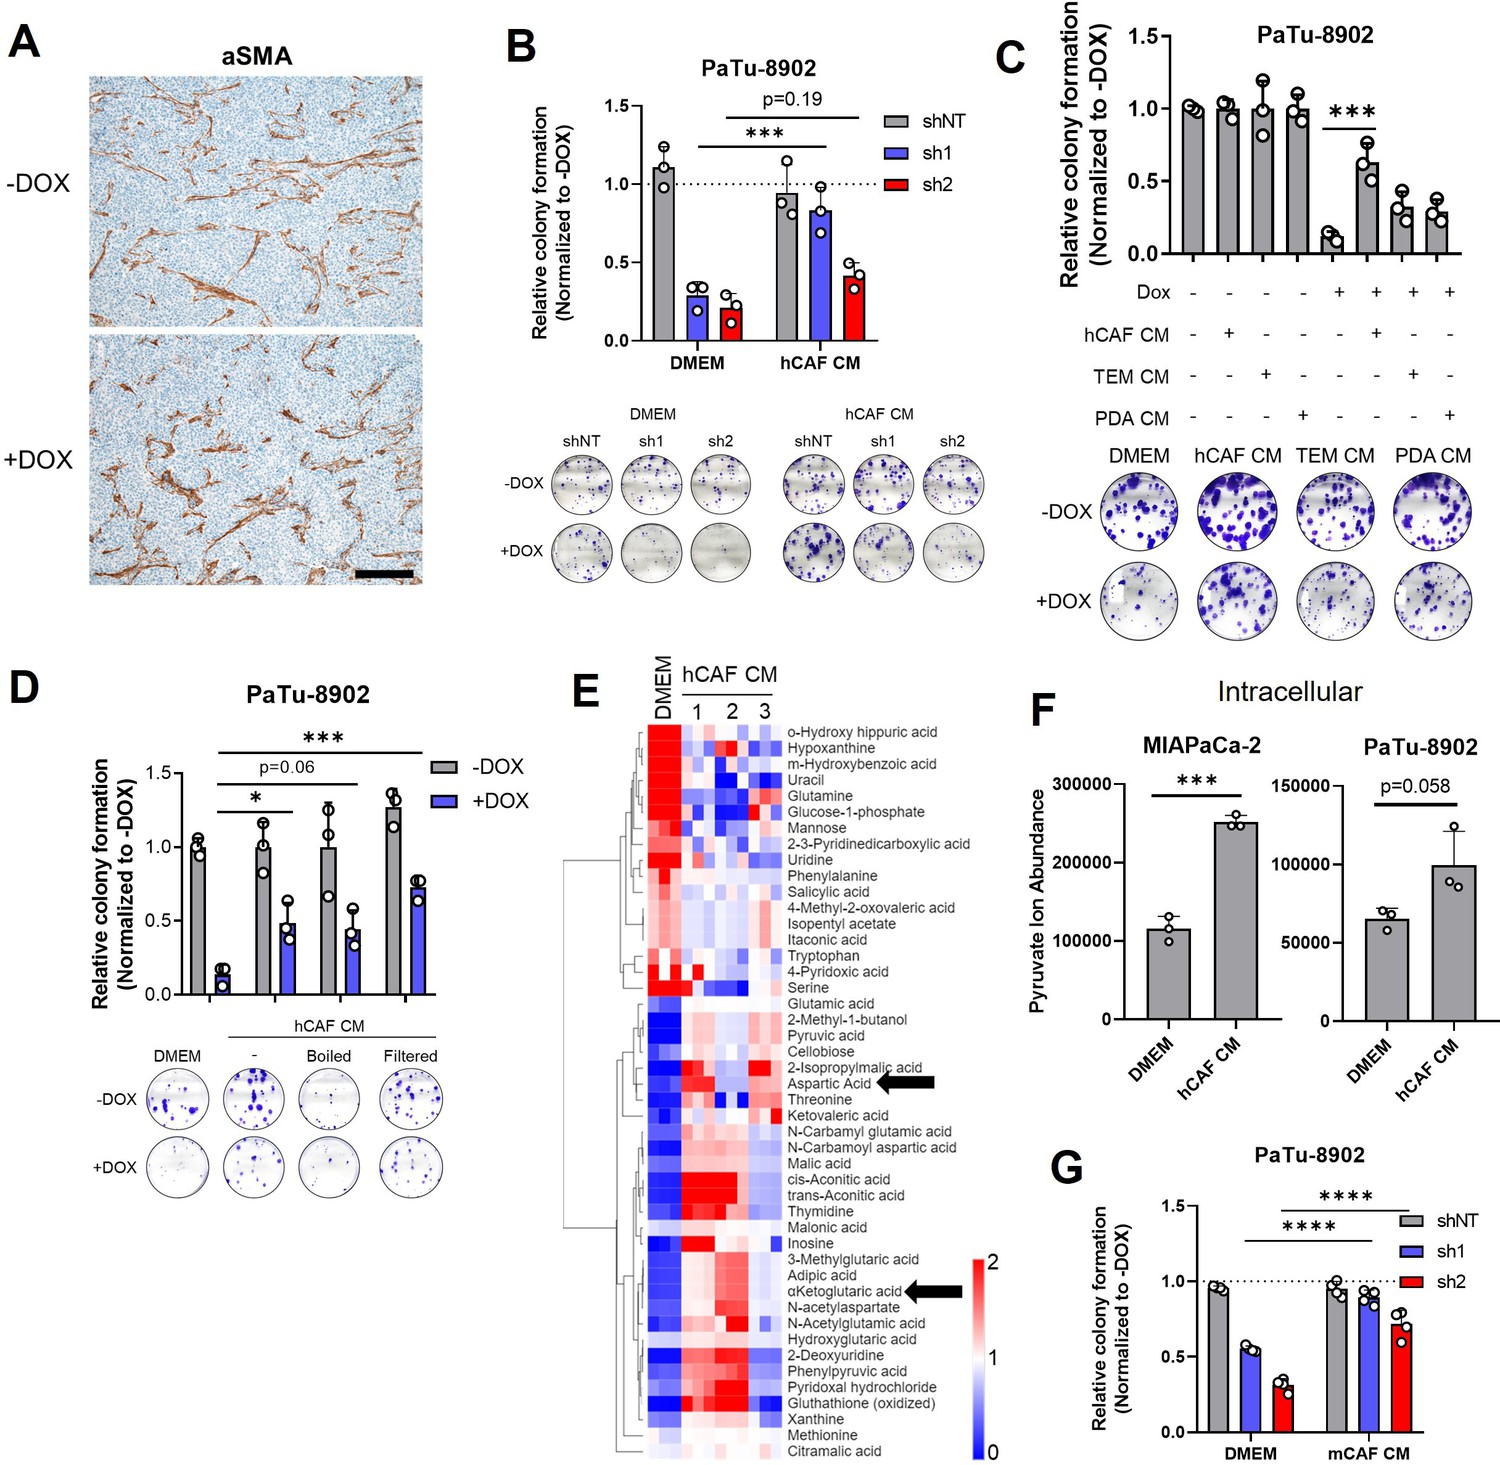
(A) Immunohistochemistry (IHC) for α-smooth muscle actin (αSMA) in PaTu-8902 ishGOT2.1 −Dox or +Dox flank xenografts. Scale bar is 200 µM. (B) Relative colony formation of PaTu-8902 ishGOT2.1 −Dox (n=3) or +Dox (n=3) cultured in normal media (Dulbecco’s modified Eagle medium, DMEM) or human cancer-associated fibroblasts (hCAF) conditioned media (CM), normalized to −Dox for each condition. (C) Relative colony formation of PaTu-8902 ishGOT2.1 −Dox (n=3) or +Dox (n=3) cultured in DMEM, hCAF CM, pancreatic ductal adenocarcinoma (PDA) CM, or tumor-educated macrophage (TEM) CM, normalized to −Dox for each condition. (D) Relative colony formation of PaTu-8902 ishGOT2.1 −Dox (n=3) or +Dox (n=3) cultured in DMEM, hCAF CM, or hCAF CM boiled, 3 kDa filtered, or subjected to freeze/thaw cycles, normalized to −Dox for each condition. (E) Heatmap of the relative abundances of metabolites significantly (p<0.05) different between normal pyruvate-free DMEM and three independently generated batches of hCAF CM. Black arrows highlight Asp and αKG. (F) Ion abundances of intracellular pyruvate in MIAPaCa-2 (left) or PaTu-8902 (right) cultured in normal DMEM media or hCAF CM. (G) Relative colony formation of PaTu-8902 ishGOT2.1 −Dox (n=3) or +Dox (n=3) cultured in normal media (DMEM) or mCAF CM, normalized to −Dox for each condition. For all panels, data represent mean ± SD. *p<0.05, **p<0.01, ***p<0.001, and ****p<0.0001.
Figure 5—figure supplement 2

CAF-derived pyruvate confers resistance to complex I inhibitors in vitro.
(A) Absolute quantitation of aspartate (Asp) (left) and α-ketoglutarate concentrations (µM) in human cancer-associated fibroblasts (hCAF) or mouse CAF (mCAF) conditioned media (CM), relative to Dulbecco’s modified Eagle medium (DMEM) control. (B) Relative proliferation of MIAPaCa-2 ishGOT2.1 −Dox (n=3) or +Dox (n=3) cultured in normal DMEM, 250 µM pyruvate, or a combination of 50 µM Asp and 500 µM dimethyl-α-ketoglutarate (dmαKG). (C) Relative cell number of PaTu-8902 treated with the indicated concentrations of rotenone (left), phenformin (middle), or IACS-010759 (right), and cultured in normal DMEM, hCAF CM, or 1 mM pyruvate. For all panels, data represent mean ± SD. *p<0.05, **p<0.01, ***p<0.001, and ****p<0.0001.
Figure 6 with 3 supplements
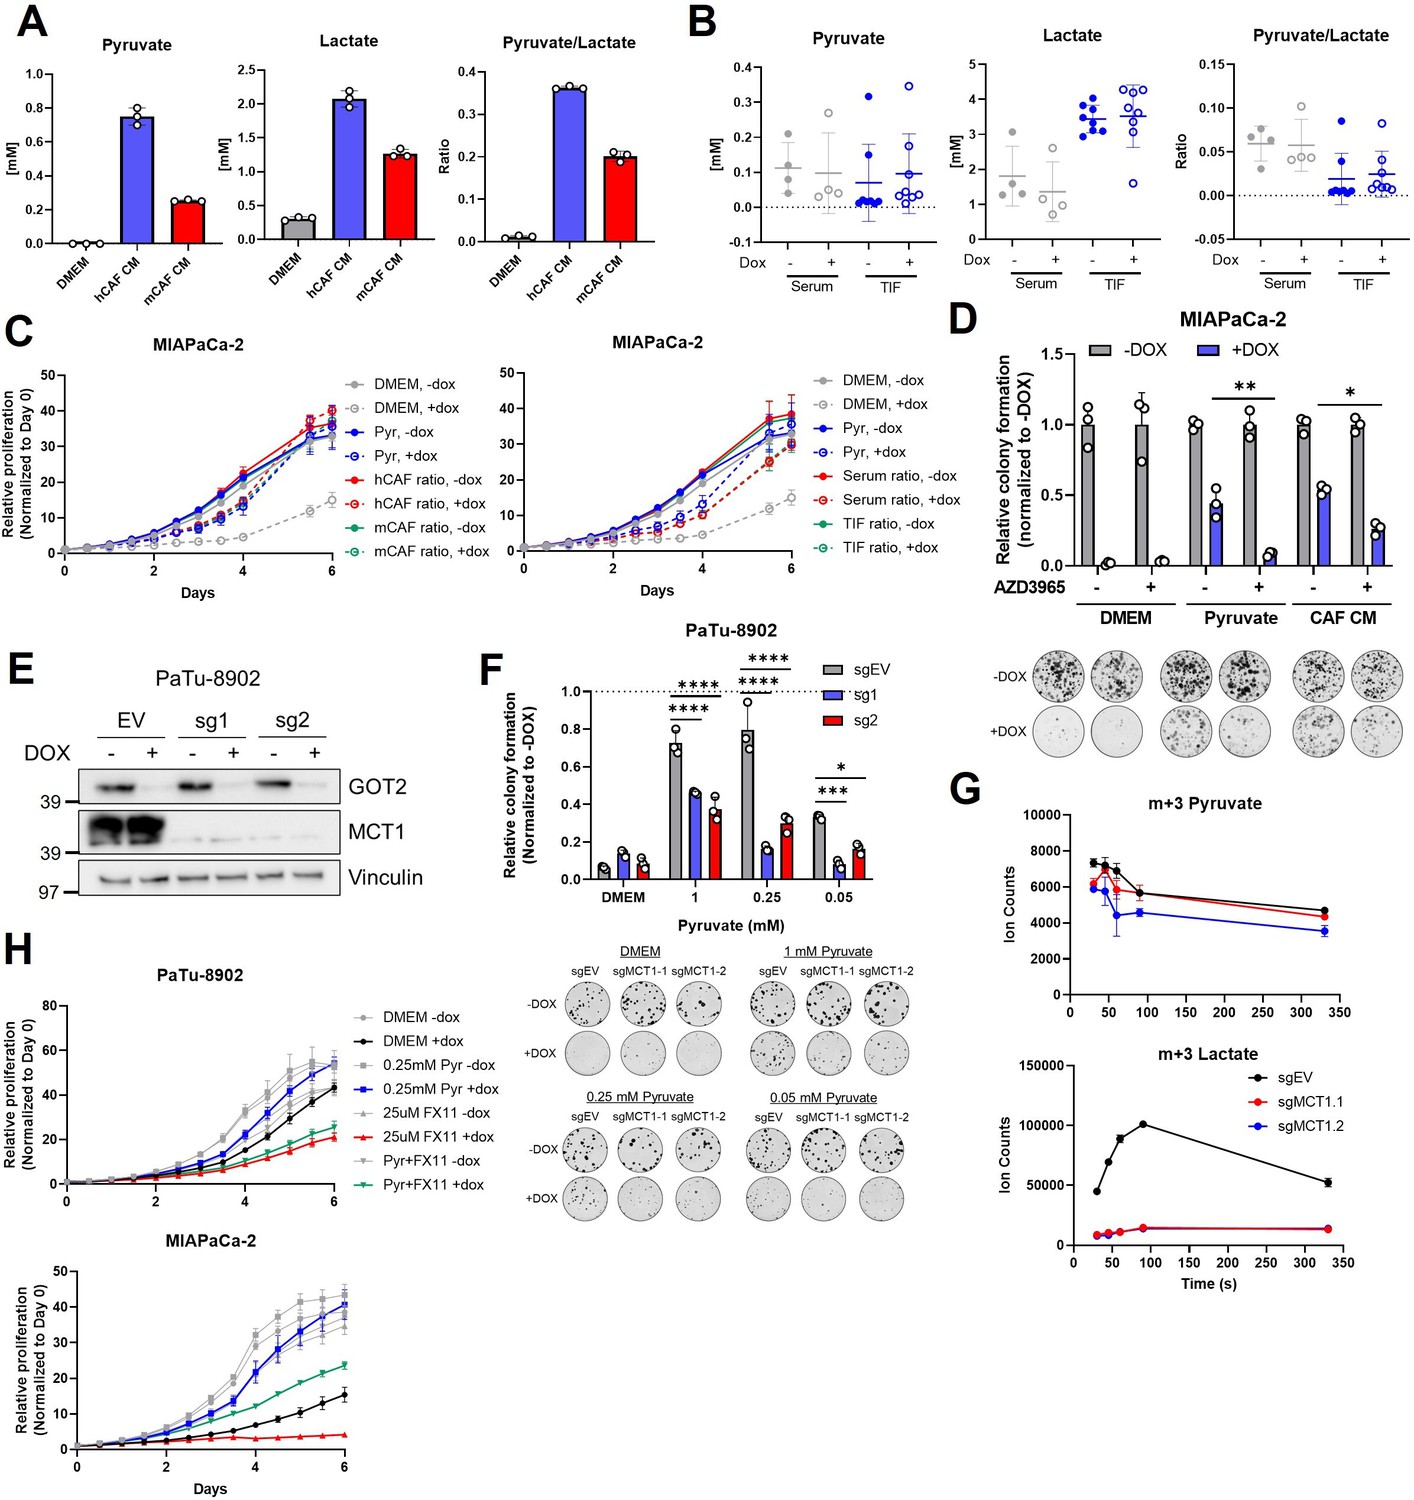
MCT1 inhibition prevents pyruvate-mediated restoration of redox balance in vitro after loss of glutamate-oxaloacetate transaminase 2 (GOT2).
(A) Absolute quantitation of pyruvate (left) and lactate (middle), and the relative pyruvate/lactate ratio (right) in normal Dulbecco’s modified Eagle medium (DMEM), human cancer-associated fibroblasts (hCAF) conditioned media (CM), and mouse CAF (mCAF) CM. (B) Absolute quantitation of pyruvate (left) and lactate (middle), and the relative pyruvate/lactate ratio (right) in serum or the tumor interstitial fluid (TIF) from NOD scid gamma (NSG) mice harboring PaTu-8902 ishGOT2.1 −Dox (n=8 tumors, 4 mice) or +Dox (n=8 tumors, 4 mice) flank xenografts. (C) Relative proliferation of MIAPaCa-2 ishGOT2.1 −Dox (n=3) or +Dox (n=3) cultured with the absolute levels and relative ratios of pyruvate/lactate in hCAF and mCAF CM (left) or serum/TIF (right) from (A) and (B), normalized to Day 0 for each condition. (D) Relative colony formation of MIAPaCa-2 ishGOT2.1 −Dox (n=3) or +Dox (n=3) cultured in normal media (DMEM), 1 mM pyruvate, or hCAF CM, and treated with DMSO control or 100 nM AZD3965, normalized to −Dox for each condition. (E) Immunoblots of GOT2, MCT1, and VINCULIN loading control in PaTu-8902 ishGOT2.1 expressing empty vector (EV), or two sgRNAs targeting MCT1 (sg1, sg2). (F) Relative colony formation of PaTu-8902 ishGOT2.1 −Dox (n=3) or +Dox (n=3) expressing EV, or two sgRNAs targeting MCT1 (sg1, sg2) and cultured in the indicated doses of pyruvate, normalized to −Dox for each condition. (G) Ion counts of intracellular m+3 pyruvate (top) and lactate (bottom) in PaTu-8902 expressing EV, or two sgRNAs targeting MCT1 (sg1, sg2) and cultured in 1 mM 13C3-pyruvate for the indicated time points. (H) Relative proliferation of PaTu-8902 (top) and MIAPaCa-2 (bottom) ishGOT2.1 −Dox (n=3) or +Dox (n=3) cultured in normal DMEM or 0.25 mM pyruvate and treated with DMSO vehicle control or 25 µM FX11, normalized to Day 0 for each condition. For all panels, data represent mean ± SD. *p<0.05, **p<0.01, ***p<0.001, and ****p<0.0001.
-
Figure 6—source data 1
Full western blot images for Figure 6E.
- https://cdn.elifesciences.org/articles/73245/elife-73245-fig6-data1-v2.zip
Figure 6—figure supplement 1
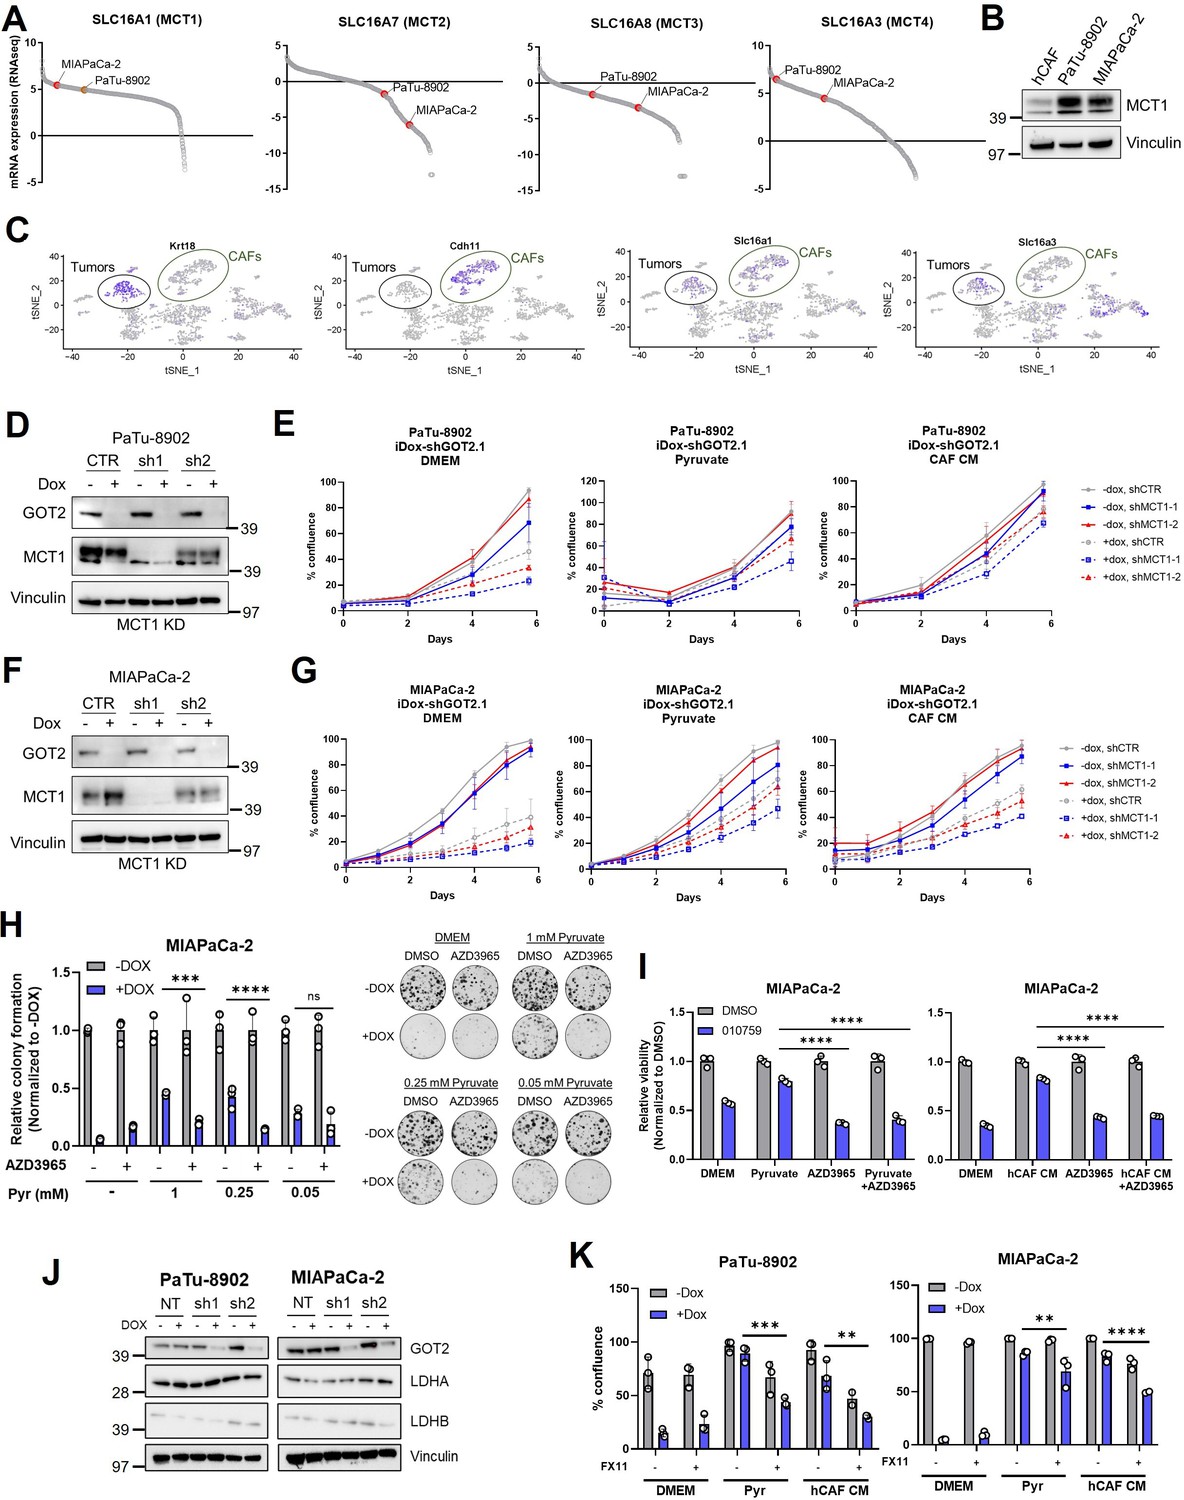
MCT1 and LDHA inhibition dampen pyruvate rescue of GOT2 KD in vitro.
(A) Relative Cancer Cell Line Encyclopedia (CCLE) mRNA expression of the indicated SLC16 family members in PaTu-8902 and MIAPaCa-2. (B) Immunoblot for MCT1 and VINCULIN loading control the indicated cell lines. (C) Single-cell RNA sequencing data from murine syngeneic orthotopic tumors showing expression of Slc16a1 (MCT1) and Slc16a3 (MCT4) in cancer-associated fibroblasts (CAF; marked by CDH11 expression) and epithelial (marked by Krt18 expression) populations. (D,F) Immunoblots for glutamate-oxaloacetate transaminase 2 (GOT2), MCT1, and VINCULIN in PaTu-8902 (D) and MIAPaCa-2 (F) ishGOT2.1 −Dox or +Dox expressing the indicated control (CTR) or constitutive MCT1-targeting shRNAs (sh1, sh2). (E,G) Relative proliferation of PaTu-8902 (E) and MIAPaCa-2 (G) ishGOT2.1 −Dox (n=3) or +Dox (n=3) expressing the indicated shRNAs and cultured in normal Dulbecco’s modified Eagle medium (DMEM; left), 0.25 mM pyruvate (middle), or human CAF (hCAF) CM (right), normalized to Day 0 for each condition. (H) Relative colony formation of MIAPaCa-2 ishGOT2.1 −Dox (n=3) or +Dox (n=3) cultured in normal media (DMEM) or the indicated doses of pyruvate, and treated with DMSO control or 100 nM AZD3965, normalized to −Dox for each condition. (I) Relative viability of MIAPaCa-2 cultured in normal media (DMEM), 0.25 mM pyruvate (left), or hCAF CM (right) and treated with DMSO vehicle control or 100 nM IACS-010759, alone or in combination with 100 nM AZD3965, normalized to −Dox for each condition. (J) Immunoblots for GOT2, LDHA, LDHB, and VINCULIN in PaTu-8902 and MIAPaCa-2 ishRNA. (K) Relative number of PaTu-8902 (left) and MIAPaCa-2 (right) ishGOT2.1 −Dox (n=3) or +Dox (n=3) cultured in normal DMEM, 0.25 mM pyruvate, or hCAF CM, and treated with DMSO vehicle control or 25 µM FX11, normalized to −Dox for each condition. For all panels, data represent mean ± SD. *p<0.05, **p<0.01, ***p<0.001, and ****p<0.0001.
-
Figure 6—figure supplement 1—source data 1
Full western blot images for Figure 6—figure supplement 1B,D,F,J.
- https://cdn.elifesciences.org/articles/73245/elife-73245-fig6-figsupp1-data1-v2.zip
Figure 6—figure supplement 2
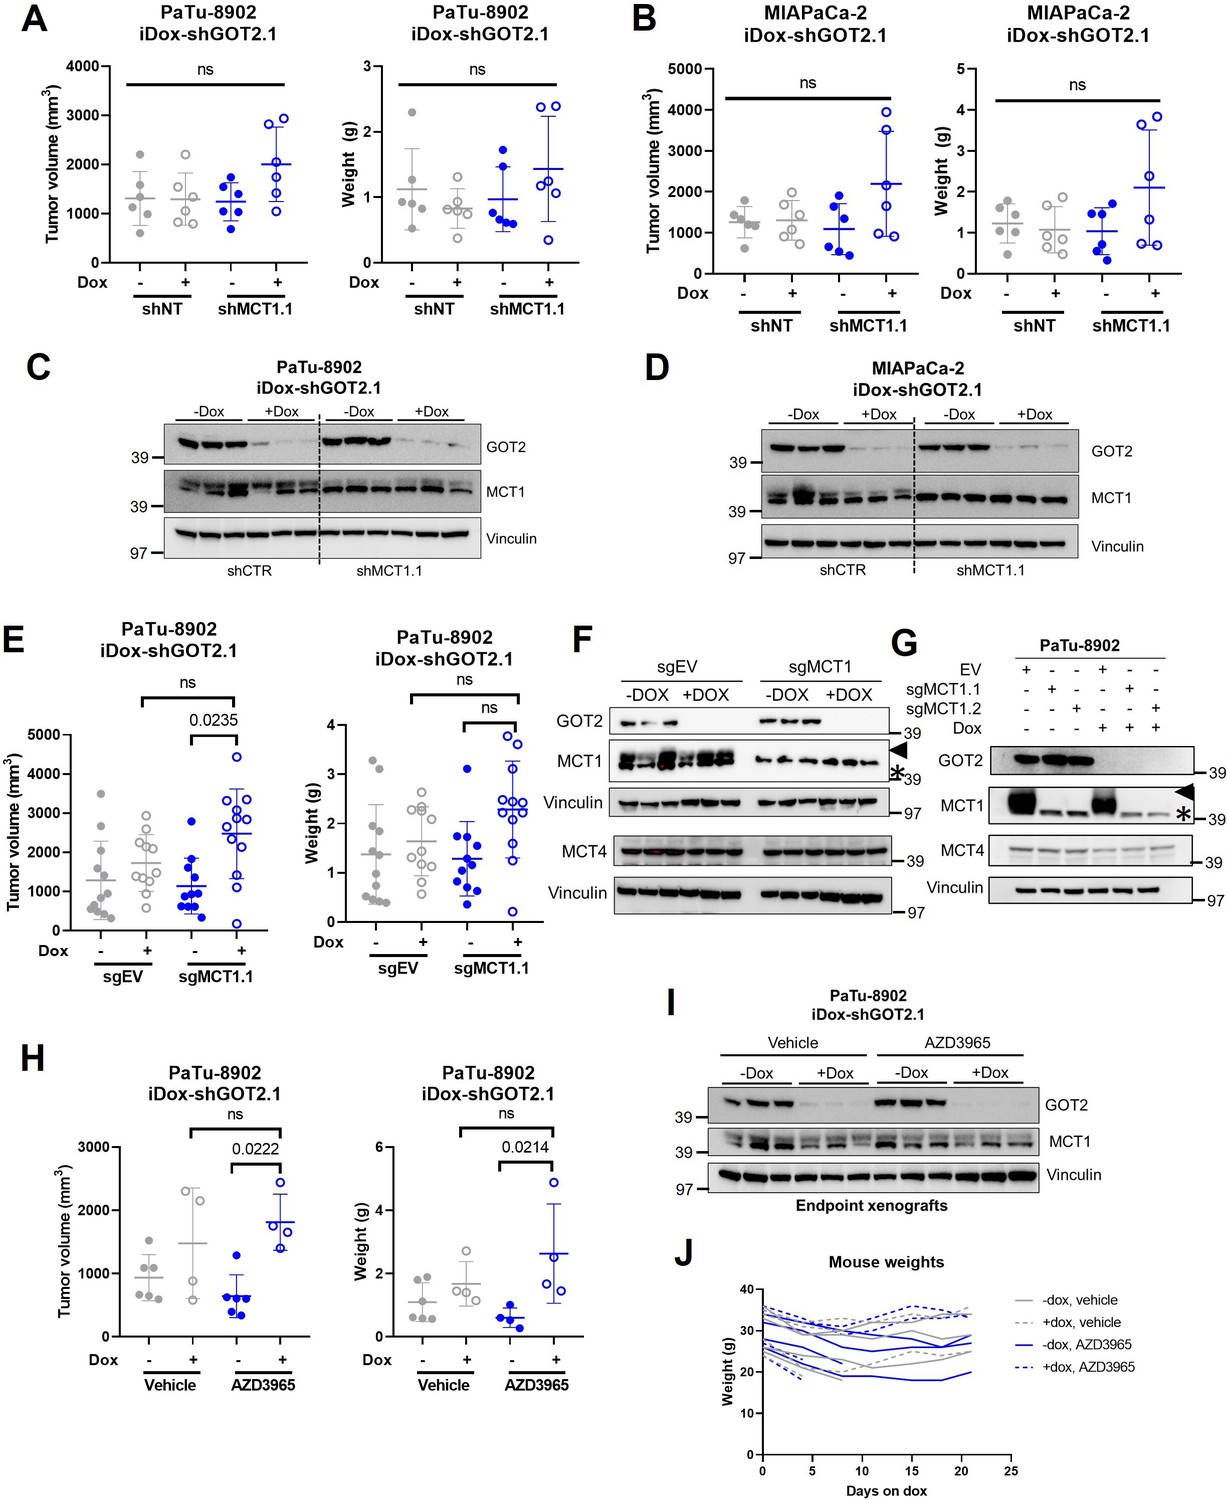
MCT1 inhibition does not sensitize tumors to GOT2 KD in vivo.
(A,B) Tumor volume (left) and weight (right) of PaTu-8902 (A) and tumor volume of MIAPaCa-2 (B) ishGOT2.1 flank xenografts in NOD scid gamma (NSG) mice fed normal chow (−Dox, n=6) or doxycycline chow (+Dox, n=6) expressing control (shNT) or shMCT1.1. (C,D) Immunoblots for GOT2, MCT1, and VINCULIN in representative tumors from PaTu-8902 (C) or MIAPaCa-2 (D) ishGOT2.1 −Dox (n=3) or +Dox (n=3) flank xenografts with shNT or shMCT1.1. Each lane represents an individual tumor. (E) Tumor volume (left) and weight (right) of PaTu-8902 flank xenografts in NSG mice fed normal chow (−Dox, n=6) or doxycycline chow (+Dox, n=6) expressing control (sgEV) or sgMCT1.1. (F) Immunoblot for GOT2, MCT1, MCT4, and VINCULIN in representative, independent tumors from PaTu-8902 ishGOT2.1 −Dox (n=3) or +Dox (n=3) flank xenografts with sgEV or sgMCT1.1. (G) Immunoblot for GOT2, MCT1, MCT4, and VINCULIN in PaTu-8902 ishGOT2.1 −Dox or +Dox cell lines with sgEV or sgMCT1.1. For (F, G) blots, arrow = MCT1 band, asterisk = non-specific band. (H) Tumor volume (left) and weight (right) of PaTu-8902 flank xenografts in NSG mice fed normal chow (−Dox, n=6) or doxycycline chow (+Dox, n=6) treated with PBS control or 100 mg/kg AZD3965. (I) Immunoblot for GOT2, MCT1, and VINCULIN in representative, independent tumors of PaTu-8902 ishGOT2.1 −Dox (n=3) or +Dox (n=3) flank xenografts. (J) Weights of mice treated in (H). For all panels, data represent mean ± SD. *p<0.05, **p<0.01, ***p<0.001, and ****p<0.0001.
-
Figure 6—figure supplement 2—source data 1
Full western blot images for Figure 6—figure supplement 2C,D,F,G,I.
- https://cdn.elifesciences.org/articles/73245/elife-73245-fig6-figsupp2-data1-v2.zip
Figure 6—figure supplement 3
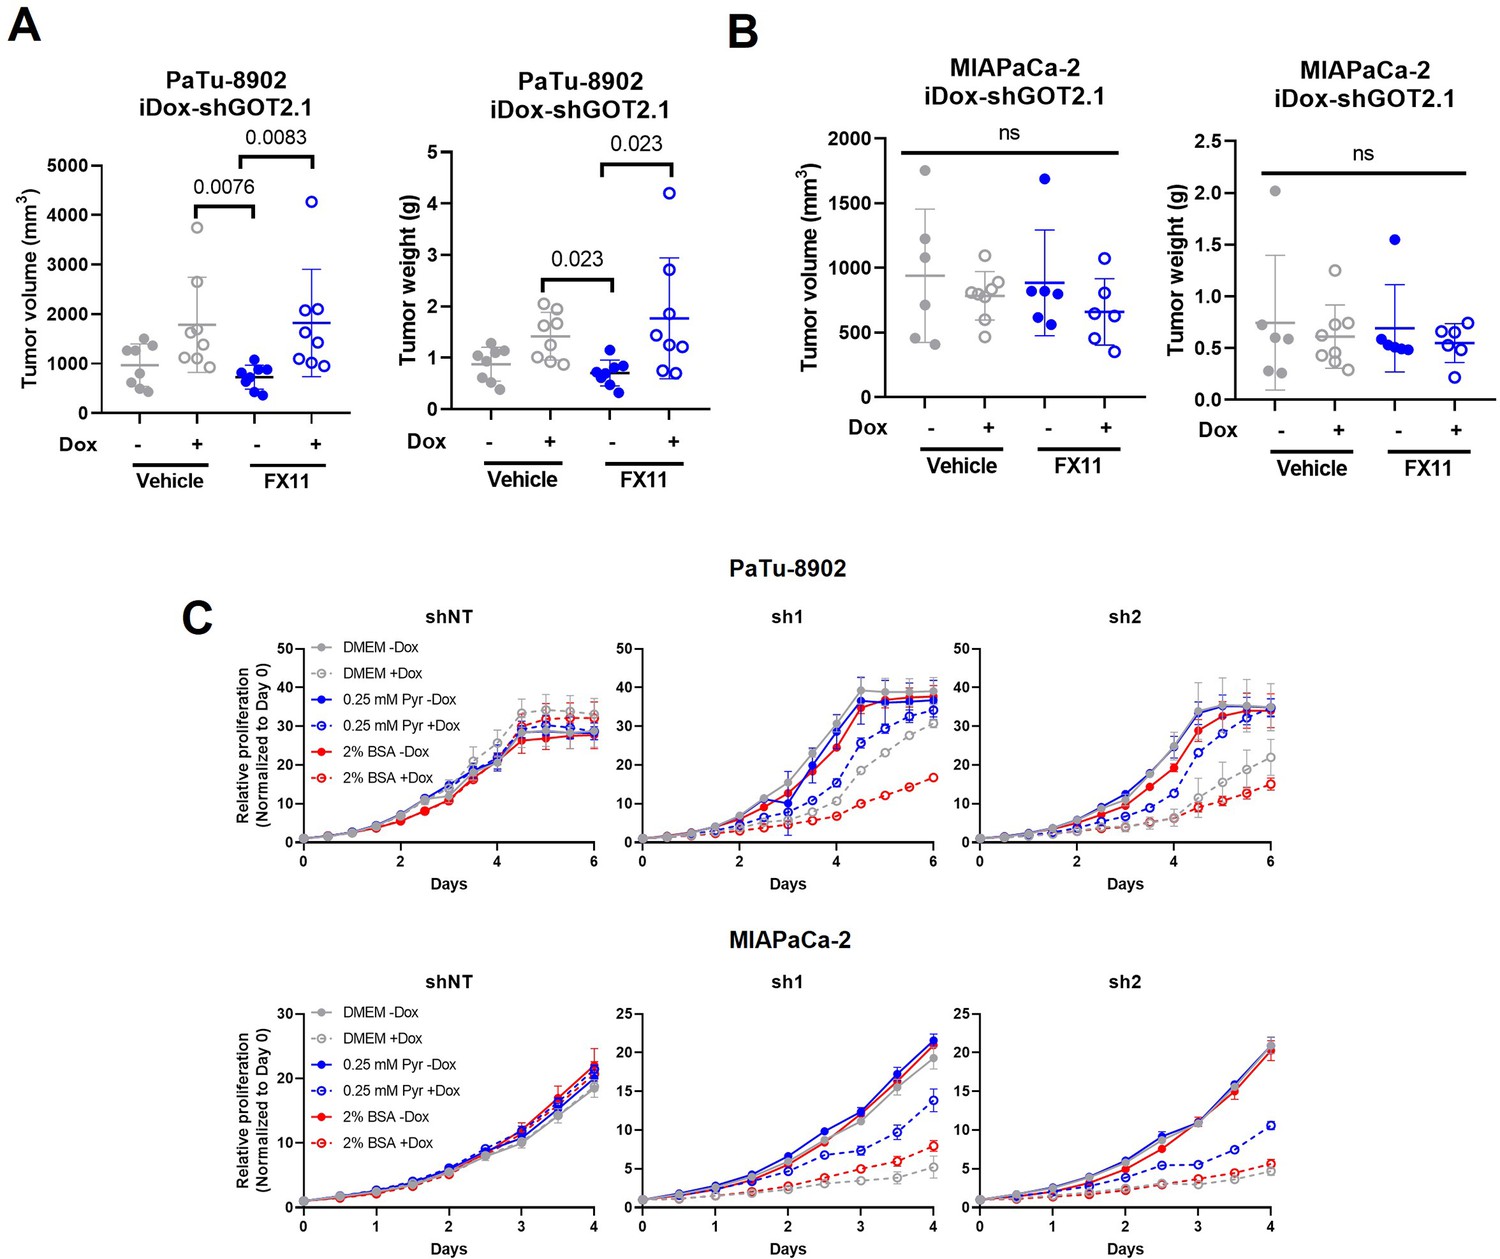
LDHA inhibition does not sensitize tumors to GOT2 KD in vivo.
(A,B) Tumor volume (left) and weight (right) of PaTu-8902 (A) and MIAPaCa-2 (B) ishGOT2.1 flank xenografts in NOD scid gamma (NSG) mice fed normal chow (−Dox, n=6) or doxycycline chow (+Dox, n=6) and treated with PBS control or 2 mg/kg FX11. (C) Relative proliferation of PaTu-8902 (top) and MIAPaCa-2 (bottom) ishRNA −Dox (n=3) or +Dox (n=3) cultured in normal Dulbecco’s modified Eagle medium (DMEM), 0.25 mM pyruvate, or 2% BSA, normalized to Day 0 for each condition.
Additional files
-
Supplementary file 1
Metabolomics data from Figure 1—figure supplement 2A, Figure 3—figure supplement 1D, and Figure 5—figure supplement 1E.
- https://cdn.elifesciences.org/articles/73245/elife-73245-supp1-v2.xlsx
-
Transparent reporting form
- https://cdn.elifesciences.org/articles/73245/elife-73245-transrepform1-v2.docx
Download links
A two-part list of links to download the article, or parts of the article, in various formats.
Downloads (link to download the article as PDF)
Open citations (links to open the citations from this article in various online reference manager services)
Cite this article (links to download the citations from this article in formats compatible with various reference manager tools)
Metabolic requirement for GOT2 in pancreatic cancer depends on environmental context
eLife 11:e73245.
https://doi.org/10.7554/eLife.73245


