A DCL3 dicing code within Pol IV-RDR2 transcripts diversifies the siRNA pool guiding RNA-directed DNA methylation
- Department of Biology and Department of Molecular and Cellular Biochemistry, Indiana University Bloomington, United States
- Howard Hughes Medical Institute, Indiana University, United States
Figures
Figure 1 with 1 supplement
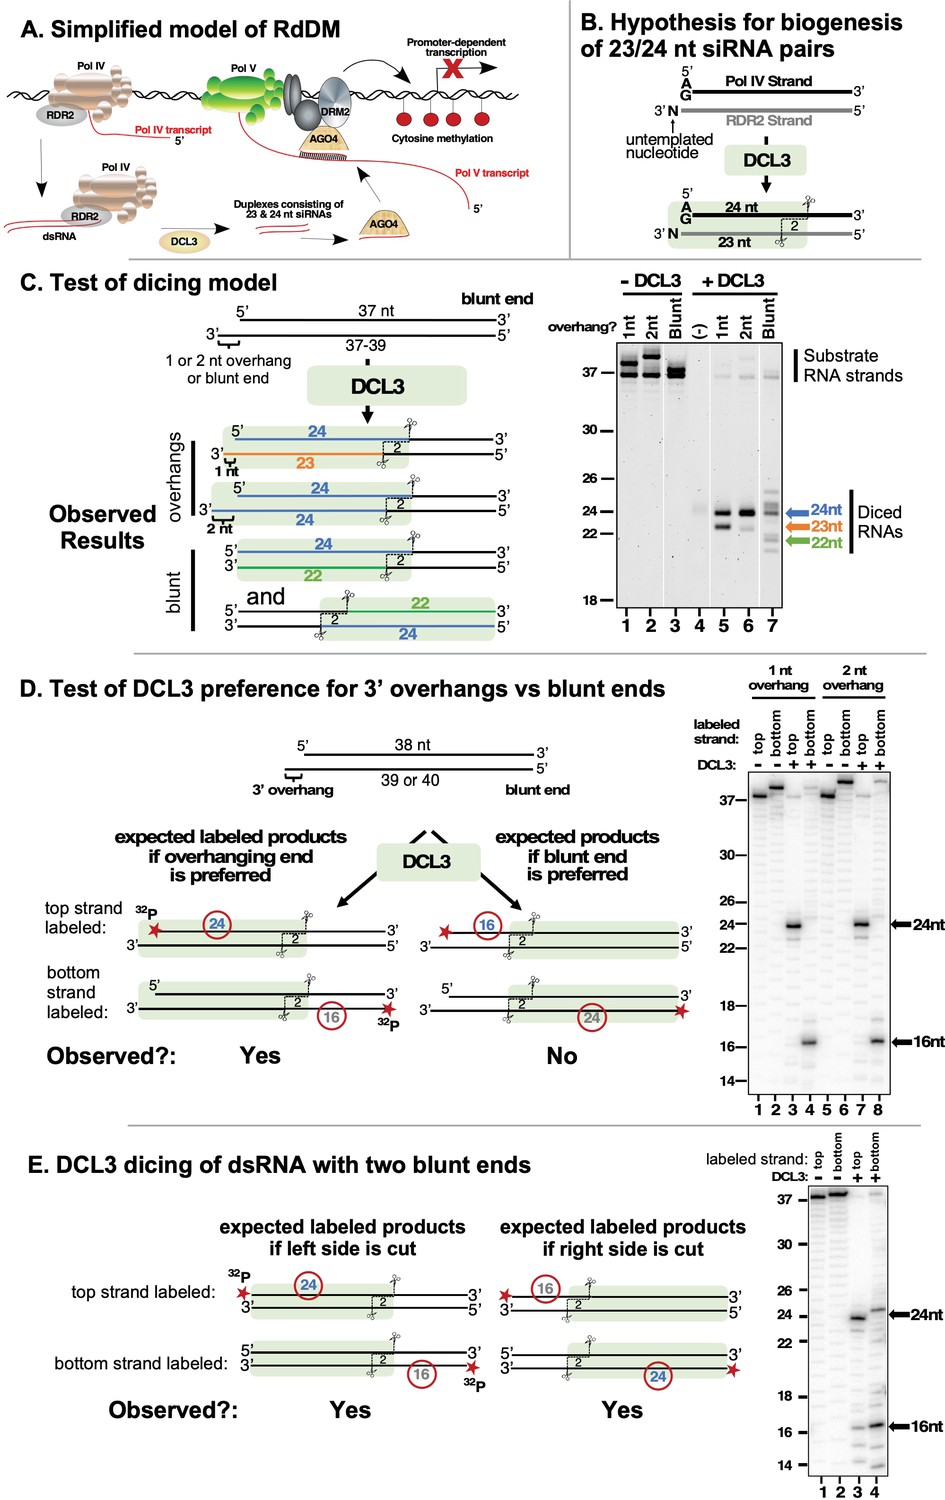
DCL3 preferentially dices double-stranded RNAs with 3′ overhangs.
(A) A simplified model of RNA-directed DNA methylation (RdDM) highlighting the roles of Pol IV, Pol V, RDR2, DCL3, and AGO4. (B) Model depicting the hypothesis that DCL3 dicing of dsRNA precursors can yield a 24 nt siRNA from the 5′ end of the Pol IV transcript paired to a 23 nt siRNA from the RDR2 3′ end. Pol IV transcripts tend to begin with A or G and RDR2 transcripts often have an untemplated nucleotide (N) at their 3′ termini. Green shading depicts DCL3 and its interaction with the left side of the dsRNA precursor. (C) A test of the model shown in (B). A 37 nt top strand was annealed to 37, 38, or 39 nt bottom strand to form dsRNA substrates with two blunt ends or a left-side 1 or 2 nt 3′ overhang on the bottom strand (see Supplementary file 1 for RNA strand sequences). Resulting dsRNAs (50 nM) were then incubated with 25 nM of affinity purified recombinant DCL3 (see Figure 1—figure supplement 1 – (A)). RNAs were then resolved by denaturing polyacrylamide gel electrophoresis (PAGE) and visualized using SYBR Gold staining. Lane 4 is a control that includes DCL3 but no RNA. (D) DCL3 prefers 3′ overhangs. Dicing reactions were conducted as in (C), but with either the top strand (37 nt) or bottom strand (38 or 39 nt) 5′ end-labeled with 32P and the final concentration of dsRNAs being 25 nM. In each case, a non-radioactive monophosphate is also present at the 5′ end of the complementary strand. Following incubation with (lanes 3, 4, 7, and 8) or without (lanes 1, 2, 5, and 6) DCL3, RNAs were resolved by denaturing PAGE and visualized by phosphorimaging. A related experiment comparing time courses of DCL3 cleavage for substrates with 1 or 2 nt overhangs is shown in Figure 1—figure supplement 1 – (B). (E) DCL3 cuts from both ends of precursors that have two blunt ends. Dicing reactions of 5′ end-labeled dsRNAs were conducted as in (E) but with precursors that lack a 3′ overhang at one end.
-
Figure 1—source data 1
Gel images for Figure 1C.
Raw gel images are provided next to annotated gel images showing the portions of the images used in the various panels of Figure 1C. The asterisk denotes a lanes containing size markers. Numbers indicate the lanes of Figure 1C. The images show SYBR Gold-stained RNAs resolved by denaturing polyacrylamide gel electrophoresis (PAGE) and imaged using a Bio-Rad Laboratories ChemiDoc MP Imaging System.
- https://cdn.elifesciences.org/articles/73260/elife-73260-fig1-data1-v2.pdf
-
Figure 1—source data 2
Gel images for Figure 1D.
Raw gel images are provided next to annotated gel images showing the portions of the images used in the various panels of Figure 1D. The asterisk denotes a lane containing size markers. The images were obtained by phosphorimaging of dried polyacrylamide gels on which 32P-labeled RNA species were resolved by denaturing PAGE.
- https://cdn.elifesciences.org/articles/73260/elife-73260-fig1-data2-v2.pdf
-
Figure 1—source data 3
Gel images for Figure 1E.
Raw gel images are provided next to annotated gel images showing the portions of the images used in the various panels of Figure 1E. Asterisks denote lanes containing size markers. The images were obtained by phosphorimaging of dried polyacrylamide gels on which 32P-labeled RNA species were resolved by denaturing PAGE.
- https://cdn.elifesciences.org/articles/73260/elife-73260-fig1-data3-v2.pdf
Figure 1—figure supplement 1
Affinity purification of recombinant DCL3.
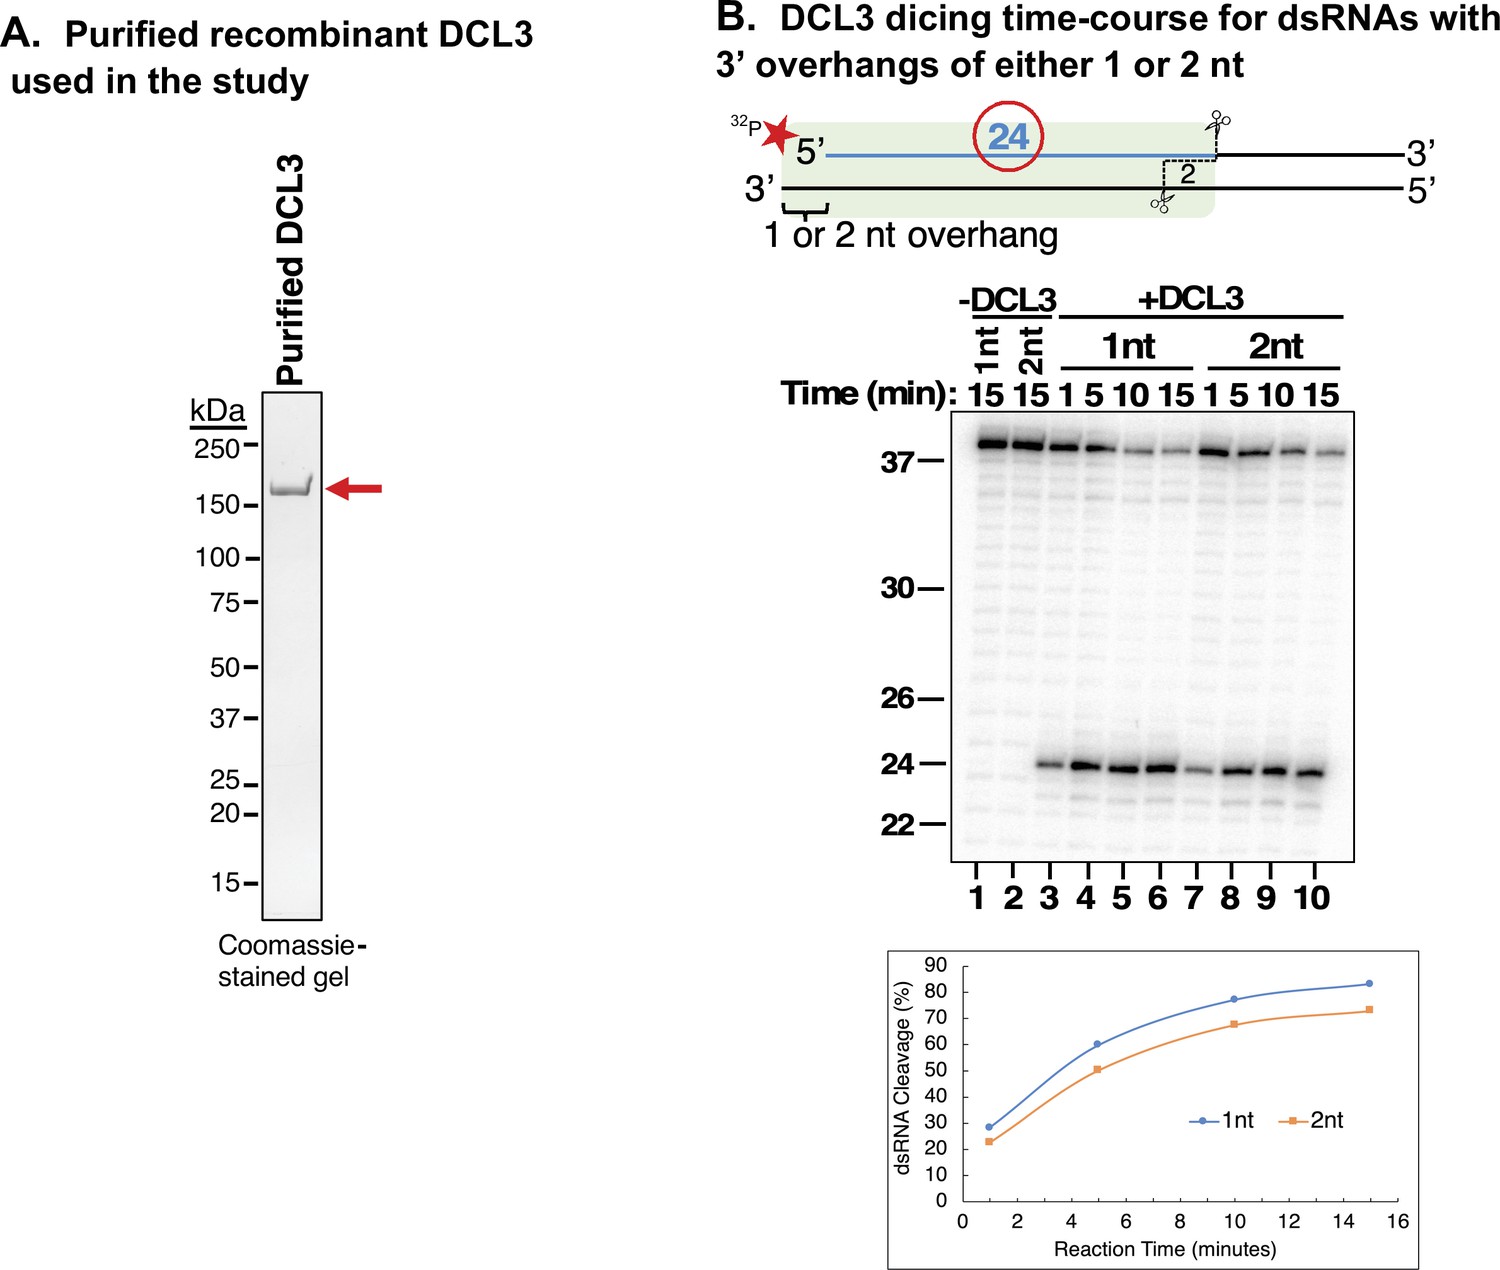
(A) Recombinant wild-type (WT) DCL3 bearing a C-terminal FLAG tag was produced in insect cells and affinity purified using anti-FLAG resin. The purified protein was analyzed by SDS-PAGE and Coomassie Blue staining. (B) Time course comparison of DCL3 dicing of substrates with either 1 or 2 nt 3′ overhangs. An end-labeled 37 nt top strand was annealed to 38 or 39 nt bottom strands to form dsRNA substrates with either 1 or 2 nt 3′ overhangs. Resulting dsRNAs (50 nM) were then incubated with 25 nM of affinity purified recombinant DCL3 for 1, 5, 10, or 15 min. RNAs were then resolved by denaturing polyacrylamide gel electrophoresis (PAGE) and visualized using SYBR Gold staining. Lanes 1 and 2 are controls that contain the different dsRNAs but no protein.
-
Figure 1—figure supplement 1—source data 1
Source data for Figure 1—figure supplement 1A.
Duplicate digital images of a 4%–15% gradient SDS-PAGE gel stained with Coomassie Brilliant Blue. The red rectangle in the image on the right shows the portion of the raw image used in Figure 1—figure supplement 1A. The text above the right image indicates the fractions obtained during affinity purification of DCL3. The lane marked by an asterisk includes protein standards, with masses indicated in kilodaltons (kDa).
- https://cdn.elifesciences.org/articles/73260/elife-73260-fig1-figsupp1-data1-v2.pdf
-
Figure 1—figure supplement 1—source data 2
Source data for Figure 1—figure supplement 1B.
Duplicate images obtained by phosphorimaging of a dried denaturing PAGE gel on which 32P-labeled RNA species were resolved. The red rectangle in the image on the right shows the portion of the raw image used in Figure 1—figure supplement 1B. The lane marked by an asterisk contains RNA size standards whose lengths are shown in nucleotides (nt).
- https://cdn.elifesciences.org/articles/73260/elife-73260-fig1-figsupp1-data2-v2.pdf
Figure 2
DCL3 measures 24 nt from the recessed 5′ end of a dsRNA with a 3′ overhang.
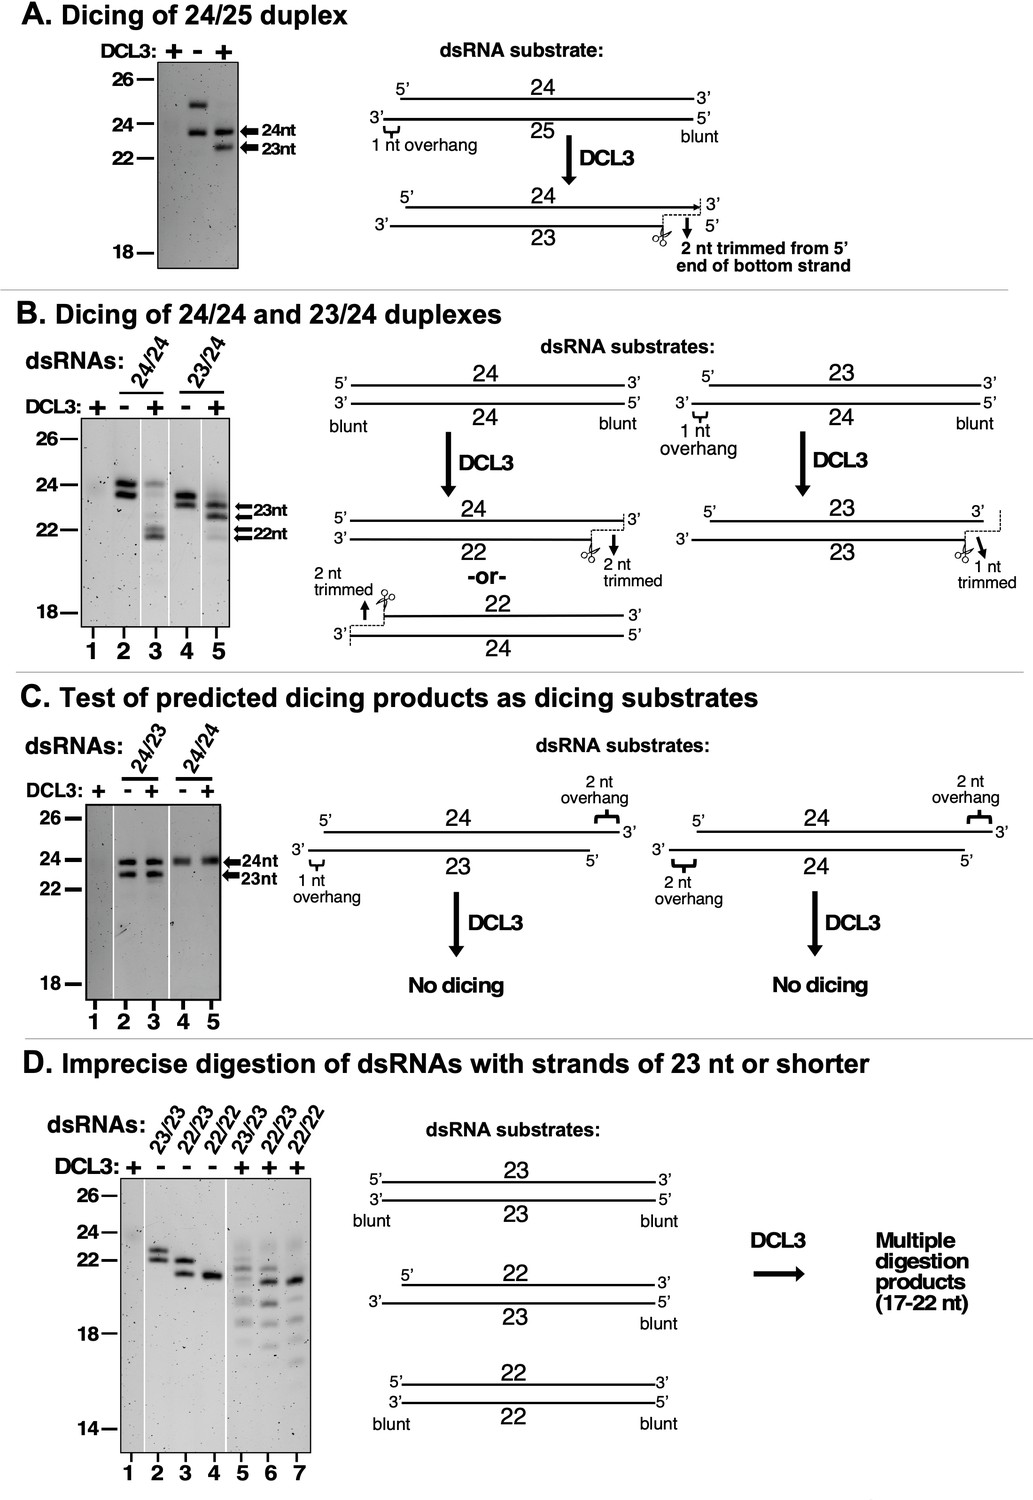
In the experiments shown in each panel of the figure, RNA strands ranging in size from 22 to 25 nt were annealed in various permutations to form dsRNA substrates that were then tested for DCL3 dicing. RNA substrates and dicing products were then resolved by denaturing polyacrylamide gel electrophoresis and visualized by SYBR Gold staining. (A) Precursors as short as 24 and 25 nt can give rise to siRNAs. In this experiment, RNAs of 24 and 25 nt were annealed and tested for dicing. The diagram summarizes DCL3’s trimming of 2 nt from the 3′ end of the 25 nt RNA strand to generate a 24/23 nt dsRNA. (B) A recessed 5′ end allows a 23 nt RNA to guide dicing consistent with the 24 nt measurement rule. RNAs of 24 or 23 nt RNAs were annealed to form a 24/24 nt (top strand/bottom strand) dsRNA with two blunt ends or a 23/24 nt dsRNA with a left-side 3′ overhang. The diagram summarizes DCL3’s trimming of 2 nt from the 5′ end of either strand of 24/24 nt dsRNAs but trimming of 1 nt from the 24 nt strand of the 23/24 nt dsRNA substrate. (C) Predicted dicing products are not diced further by DCL3. Double-stranded RNAs with strands of 23 or 24 nt were annealed to generate 3′ overhangs of 1 or 2 nt at each end. The 24/23 nt dsRNA mimics the digestion product introduced in Figure 1B. The 24/24 nt dsRNA mimics a product that might result from sequential dicing events or internal initiation by RDR2. (D) Duplexes in which both strands are 23 nt or shorter are not precisely diced but are digested by DCL3 into 17–22 nt products. Test substrates were 23/23 and 22/22 nt duplexes with two blunt ends, or a 22/23 nt duplex with a 1 nt 3′ overhang on the bottom strand.
-
Figure 2—source data 1
Source data for Figure 2A and C.
- https://cdn.elifesciences.org/articles/73260/elife-73260-fig2-data1-v2.pdf
-
Figure 2—source data 2
Source data for Figure 2B and D.
Duplicate digital images of a denaturing PAGE gel showing RNA species stained with SYBR Gold. The red rectangles in the image on the right show the portions of the raw image used in lanes of Figure 2 panels B or D, as indicated. Lane 1 of Figure 2B is also lane 1 of Figure 2D. The lane marked by an asterisk contains RNA size standards, with lengths shown in nucleotides (nt).
- https://cdn.elifesciences.org/articles/73260/elife-73260-fig2-data2-v2.pdf
Figure 3 with 1 supplement
Strand cutting specificities of DCL3’s RNase III domains.
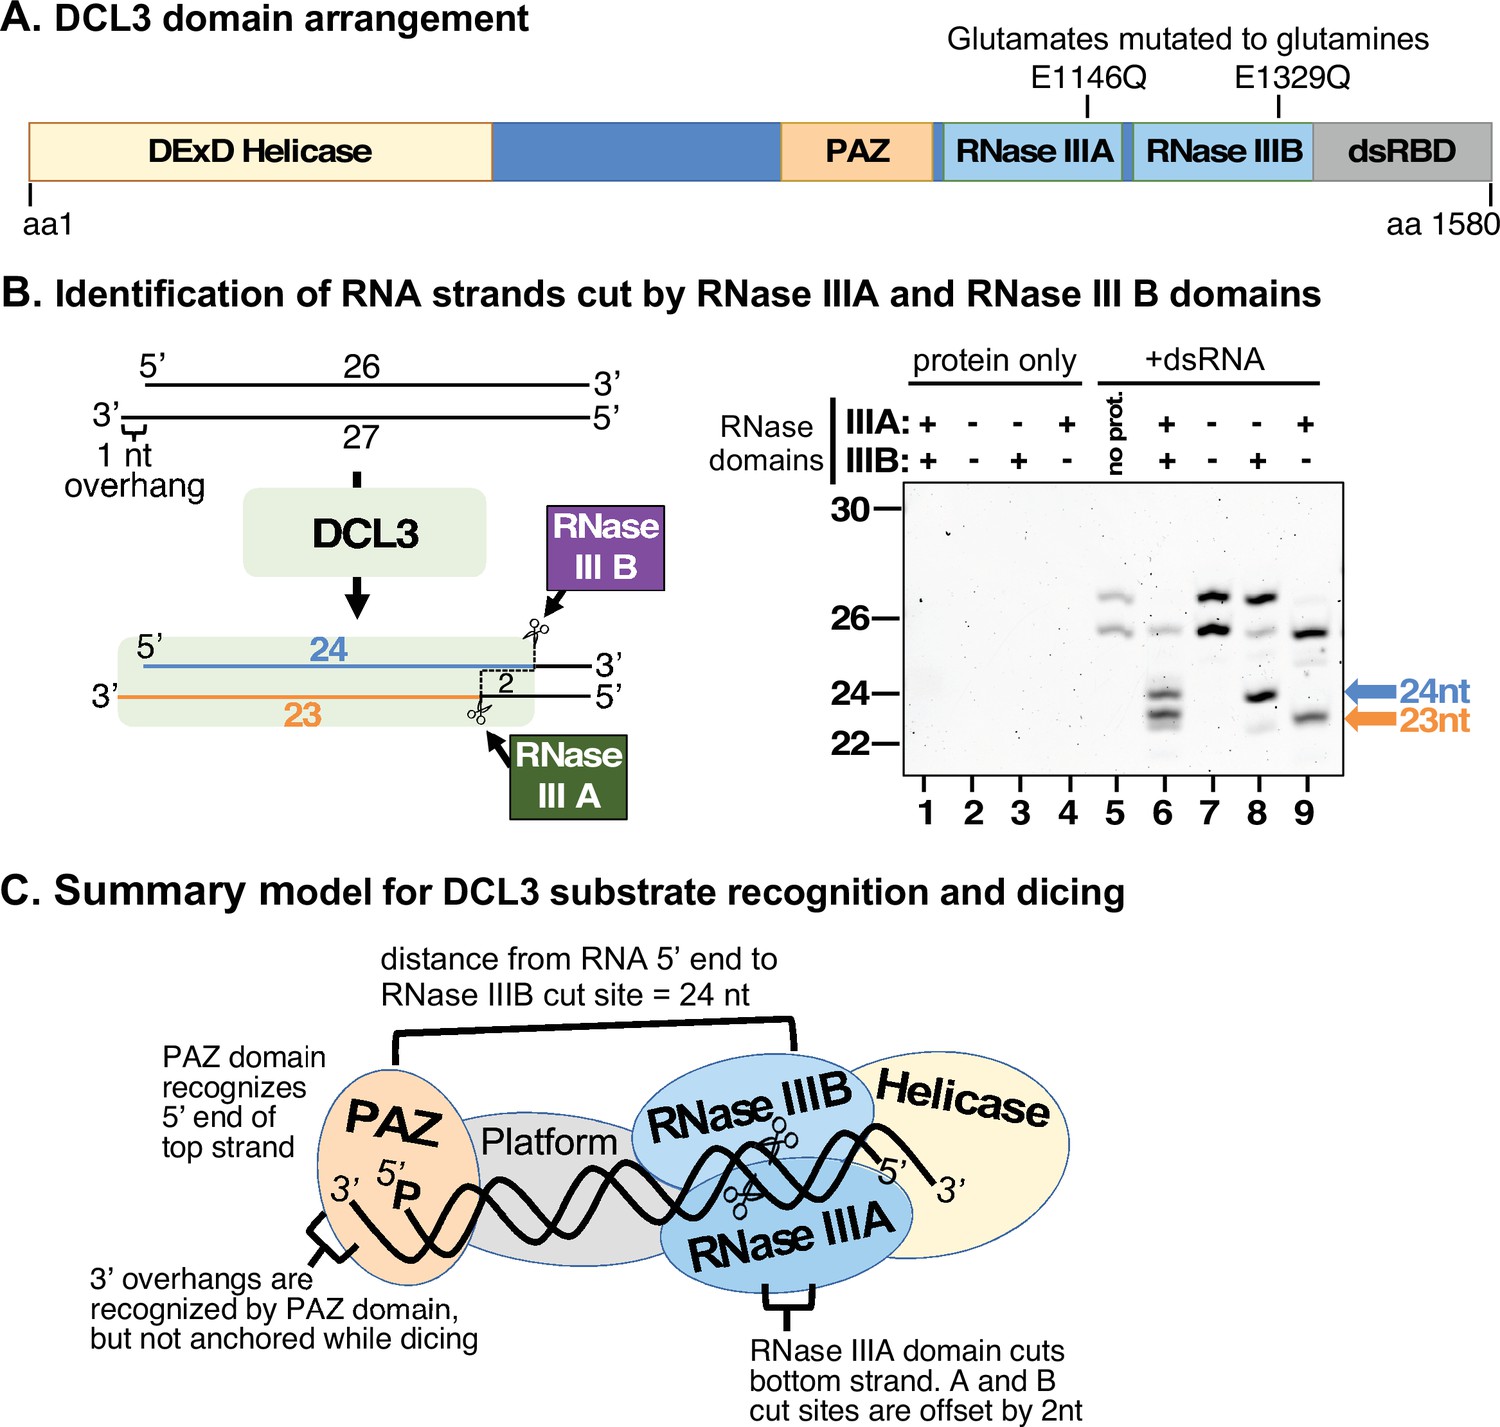
(A) Relative positions of helicase, PAZ, RNase III, and dsRNA binding domains within the 1580 amino acid sequence of DCL3. Positions of catalytic glutamate residues of RNase III domain A (E1146) and RNase III domain B (E1329) are highlighted. These glutamates were mutated to glutamine to generate catalytically inactive versions of DCL3. (B) Identification of dsRNA strands cut by the RNase IIIA and RNase III B domains of DCL3. A 26/27 nt dsRNA substrate, possessing a 1 nt 3′ overhang, was subjected to dicing using wild-type DCL3 or the E1146Q and/or E1329Q mutant versions of DCL3. Lanes 1–4 are DCL3-only controls and lane 5 is a RNA-only control. DCL3 with wild-type RNase III domains A and B (denoted as +, +) was tested in lanes 1 and 6. DCL3 mutants with both RNase III domains mutated (denoted as −, −) were tested in lanes 2 and 7. Mutants with only wild-type RNase III domain were tested in lanes 3, 4, 8, and 9. (C) Model for DCL3 substrate recognition, 24 nt strand measurement, and dicing.
-
Figure 3—source data 1
Source data for Figure 3B.
Duplicate digital images of a denaturing PAGE gel with RNA species stained with SYBR Gold. The red rectangle in the image on the right shows the portions of the raw image used in Figure 3B, with corresponding lane numbers. The lane marked by an asterisk contains RNA size standards whose length is shown in nucleotides (nt).
- https://cdn.elifesciences.org/articles/73260/elife-73260-fig3-data1-v2.pdf
Figure 3—figure supplement 1

Strand cutting specificities of DCL3’s two RNase III domains tested using a dsRNA substrate with a 2 nt 3′ overhang.
This experiment was performed as in Figure 3 except that the dsRNA substrate has a 2 nt overhang rather than a 1 nt overhang. In this case, a dsRNA formed by annealing 26 and 28 nt RNAs was subjected to dicing using wild-type DCL3 or the E1146Q and/or E1329Q mutant versions of DCL3. Lanes 1–4 are DCL3-only controls and lane 5 is a RNA-only control. DCL3 with wild-type RNAse III domains A and B (denoted as +, +) was tested in lanes 1 and 6. DCL3 mutants with both RNase III domains mutated (denoted as −, −) were tested in lanes 2 and 7. Mutants with only wild-type RNase III domain were tested in lanes 3, 4, 8, and 9.
-
Figure 3—figure supplement 1—source data 1
Source data for Figure 3—figure supplement 1.
Duplicate digital images of a denaturing PAGE gel showing RNA species stained with SYBR Gold. The red rectangles in the image on the right show the portions of the raw image used in Figure 3—figure supplement 1, with the corresponding lane numbers. The lane marked by an asterisk contains RNA size standards whose length is shown in nucleotides (nt).
- https://cdn.elifesciences.org/articles/73260/elife-73260-fig3-figsupp1-data1-v2.pdf
Figure 4

DCL3 substrate recognition is influenced by 5′ terminal nucleotide and phosphorylation status.
(A) Test of top strand 5′ nucleotide preference on dicing efficiency. Top strands of 37 nt that differ by having either A, U, C, or G at their 5′ termini were 5′ end-labeled with 32P and annealed to complementary 38 nt bottom strand RNAs to generate 1 nt 3′ overhangs on the left side, as drawn. Following incubation with DCL3 for 1, 5, or 10 min, reaction products were resolved by non-denaturing PAGE and visualized by autoradiography. The diagram highlights the position of the labeled 24 nt dicing product measured in the assay. (B) Test of bottom strand 3′ terminal nucleotide on dicing efficiency. This experiment was conducted as in (A) except that bottom strands had either A, U, C, or G at their 3′ termini, which overhang the top strand (5′ A) by 1 nt. (C) Test of top strand 5′ end phosphorylation on dicing efficiency. Two 37 nt RNA strands with adenosines at their 5′ termini were annealed to generate dsRNAs with 3′ overhangs of 1 nt at either end, encouraging DCL3 to dice from either end. The top strand was end-labeled with a 32P monophosphate group whereas the 5′-terminal adenosine of the bottom strand had either a hydroxyl group (OH), a monophosphate (P) or a triphosphate (PPP). Left-side versus right-side dicing was then assessed by the ratio of labeled 24 or 16 nt dicing products following non-denaturing PAGE and autoradiography.
-
Figure 4—source data 1
Gel image used in Figure 4A.
Duplicate digital images obtained by phosphorimaging of 32P-labeled RNAs resolved by denaturing PAGE are shown, with red rectangles showing the portion of the raw image used in Figure 4A.
- https://cdn.elifesciences.org/articles/73260/elife-73260-fig4-data1-v2.pdf
-
Figure 4—source data 2
Gel image of replicate experiment providing quantitative data for Figure 4A.
- https://cdn.elifesciences.org/articles/73260/elife-73260-fig4-data2-v2.pdf
-
Figure 4—source data 3
Gel image of replicate experiment providing quantitative data for Figure 4A.
- https://cdn.elifesciences.org/articles/73260/elife-73260-fig4-data3-v2.pdf
-
Figure 4—source data 4
Source quantitative data for triplicate experiments of Figure 4A.
Data was obtained using Image Lab version 6.0 software. The 38 nt substrate and 24 nt diced RNA bands were boxed and % dsRNA substrate cleavage was calculated as the percentage of total signal (substrate + product) represented by the 24 nt product RNA band. Means for the triplicate reactions were calculated as well as the standard error of the mean.
- https://cdn.elifesciences.org/articles/73260/elife-73260-fig4-data4-v2.xlsx
-
Figure 4—source data 5
Gel image used in Figure 4B.
Duplicate digital images obtained by phosphorimaging of 32P-labeled RNA resolved by denaturing PAGE are shown, with red rectangles showing the portion of the raw image used in Figure 4B.
- https://cdn.elifesciences.org/articles/73260/elife-73260-fig4-data5-v2.pdf
-
Figure 4—source data 6
Gel image of replicate experiment providing quantitative data for Figure 4B.
- https://cdn.elifesciences.org/articles/73260/elife-73260-fig4-data6-v2.pdf
-
Figure 4—source data 7
Gel image of replicate experiment providing quantitative data for Figure 4B.
- https://cdn.elifesciences.org/articles/73260/elife-73260-fig4-data7-v2.pdf
-
Figure 4—source data 8
Source quantitative data for triplicate experiments of Figure 4B.
Data was obtained using Image Lab version 6.0 software. The 38 nt substrate and 24 nt diced RNA bands were boxed and % dsRNA substrate cleavage was calculated as the percentage of total signal (substrate + product) represented by the 24 nt product RNA band. Means for the triplicate reactions were calculated as well as the standard error of the mean.
- https://cdn.elifesciences.org/articles/73260/elife-73260-fig4-data8-v2.xlsx
-
Figure 4—source data 9
Source data for Figure 4C.
Duplicate gel images obtained by phosphorimaging of 32P-labeled RNA resolved by denaturing PAGE. The red rectangle in the image on the right shows the portion of the raw image used in the figure.
- https://cdn.elifesciences.org/articles/73260/elife-73260-fig4-data9-v2.pdf
Figure 5 with 2 supplements
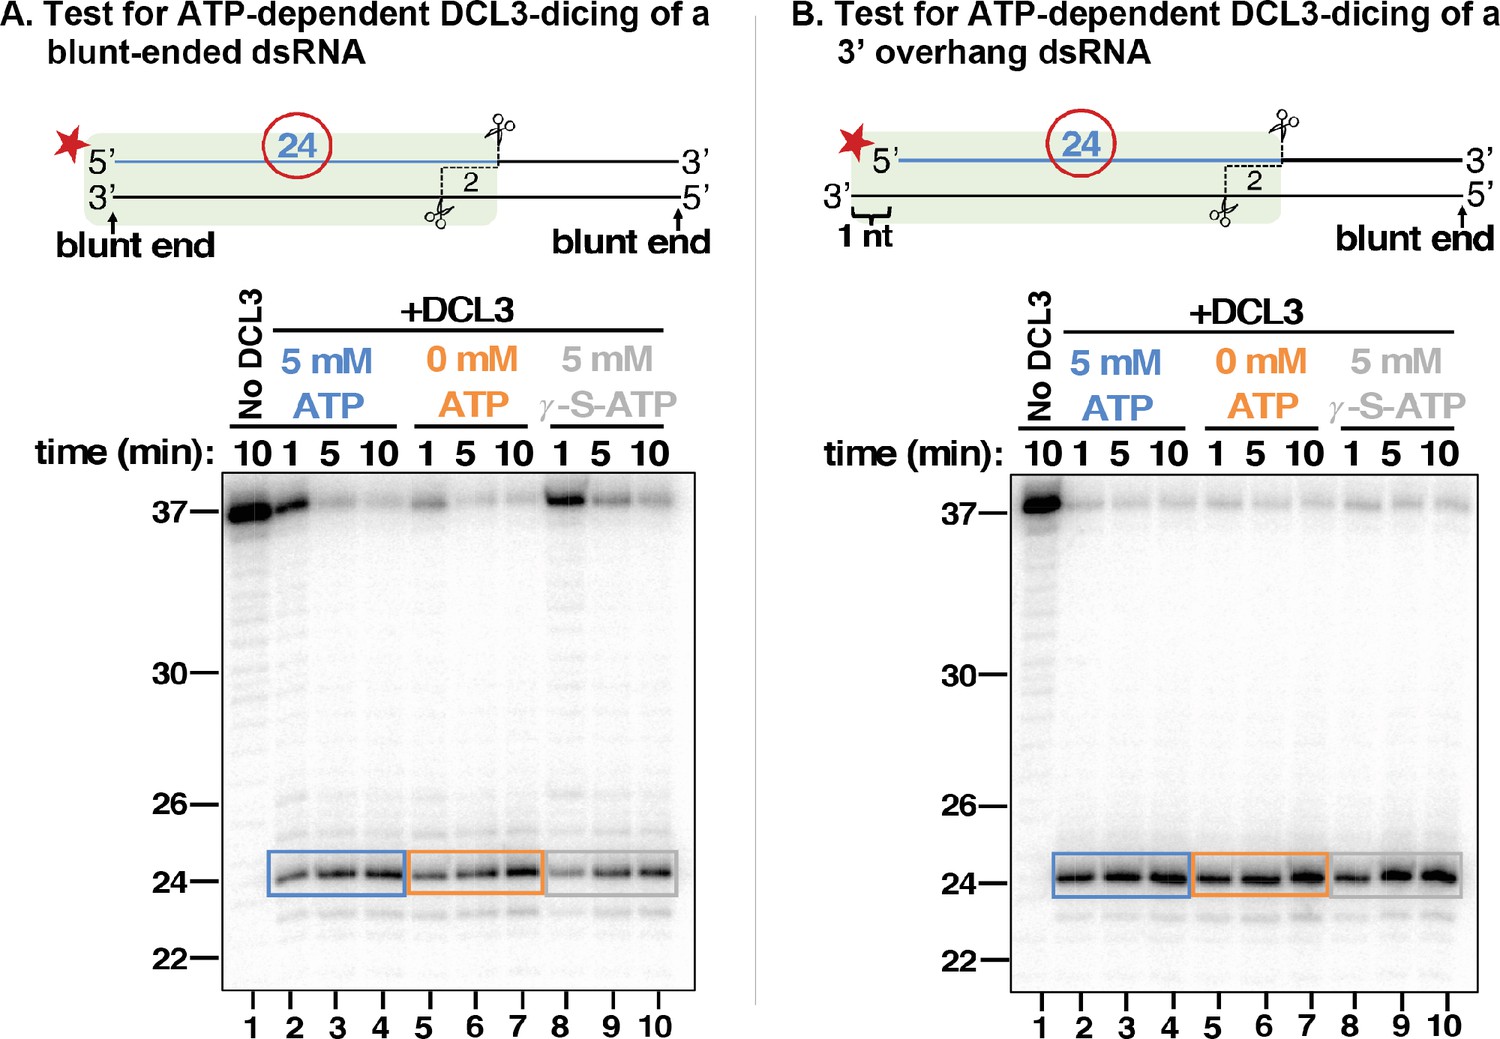
DCL3 dicing does not require ATP.
(A) 37 nt top strands end-labeled with 32P were annealed to 37 nt bottom strands to generate dsRNAs with blunt ends. Resulting dsRNAs at a concentration of 25 nM were then incubated with 5 nM of apyrase-treated DCL3 in the presence or absence of ATP or the non-hydrolyzable ATP analog, ATP-γ-S. DCL3 dicing was assayed at 1, 5, and 10 min. Production of labeled 24 nt dicing products was then assessed by denaturing PAGE and autoradiography. (B) 37 nt top strands end-labeled with 32P were annealed to 38 nt bottom strands to generate dsRNAs with a blunt end on the right side and a 3′ overhang of 1 nt on the left side. DCL3 dicing assays were then performed as in (A).
-
Figure 5—source data 1
Raw gel image for Figure 5A.
Gel images were obtained by phosphorimaging of 32P-labeled RNAs resolved by denaturing PAGE.
- https://cdn.elifesciences.org/articles/73260/elife-73260-fig5-data1-v2.pdf
-
Figure 5—source data 2
Raw gel image for Figure 5B.
Gel images were obtained by phosphorimaging of 32P-labeled RNAs resolved by denaturing PAGE.
- https://cdn.elifesciences.org/articles/73260/elife-73260-fig5-data2-v2.pdf
Figure 5—figure supplement 1
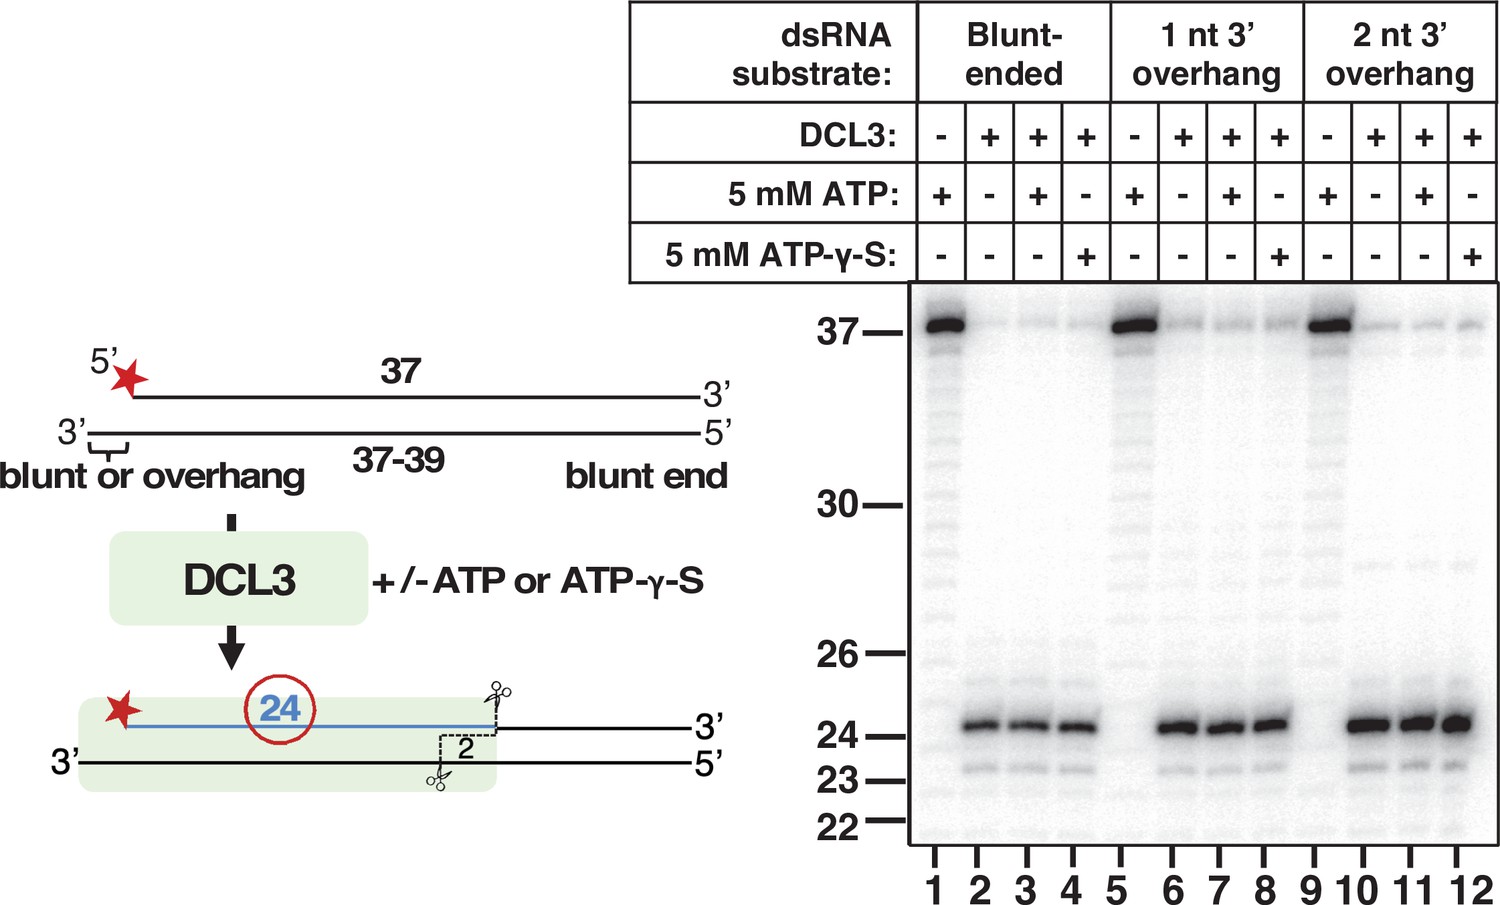
Additional evidence that ATP is not required for DCL3 dicing.
Assays like those of Figure 5 were conducted but included an additional dsRNA substrate that has a 3′ overhang of 2 nt. Reactions were incubated for 30 min.
-
Figure 5—figure supplement 1—source data 1
Raw gel image and the portion of the image used for Figure 5—figure supplement 1.
The gel image was obtained by phosphorimaging of 32P-labeled RNAs resolved by denaturing PAGE.
- https://cdn.elifesciences.org/articles/73260/elife-73260-fig5-figsupp1-data1-v2.pdf
Figure 5—figure supplement 2
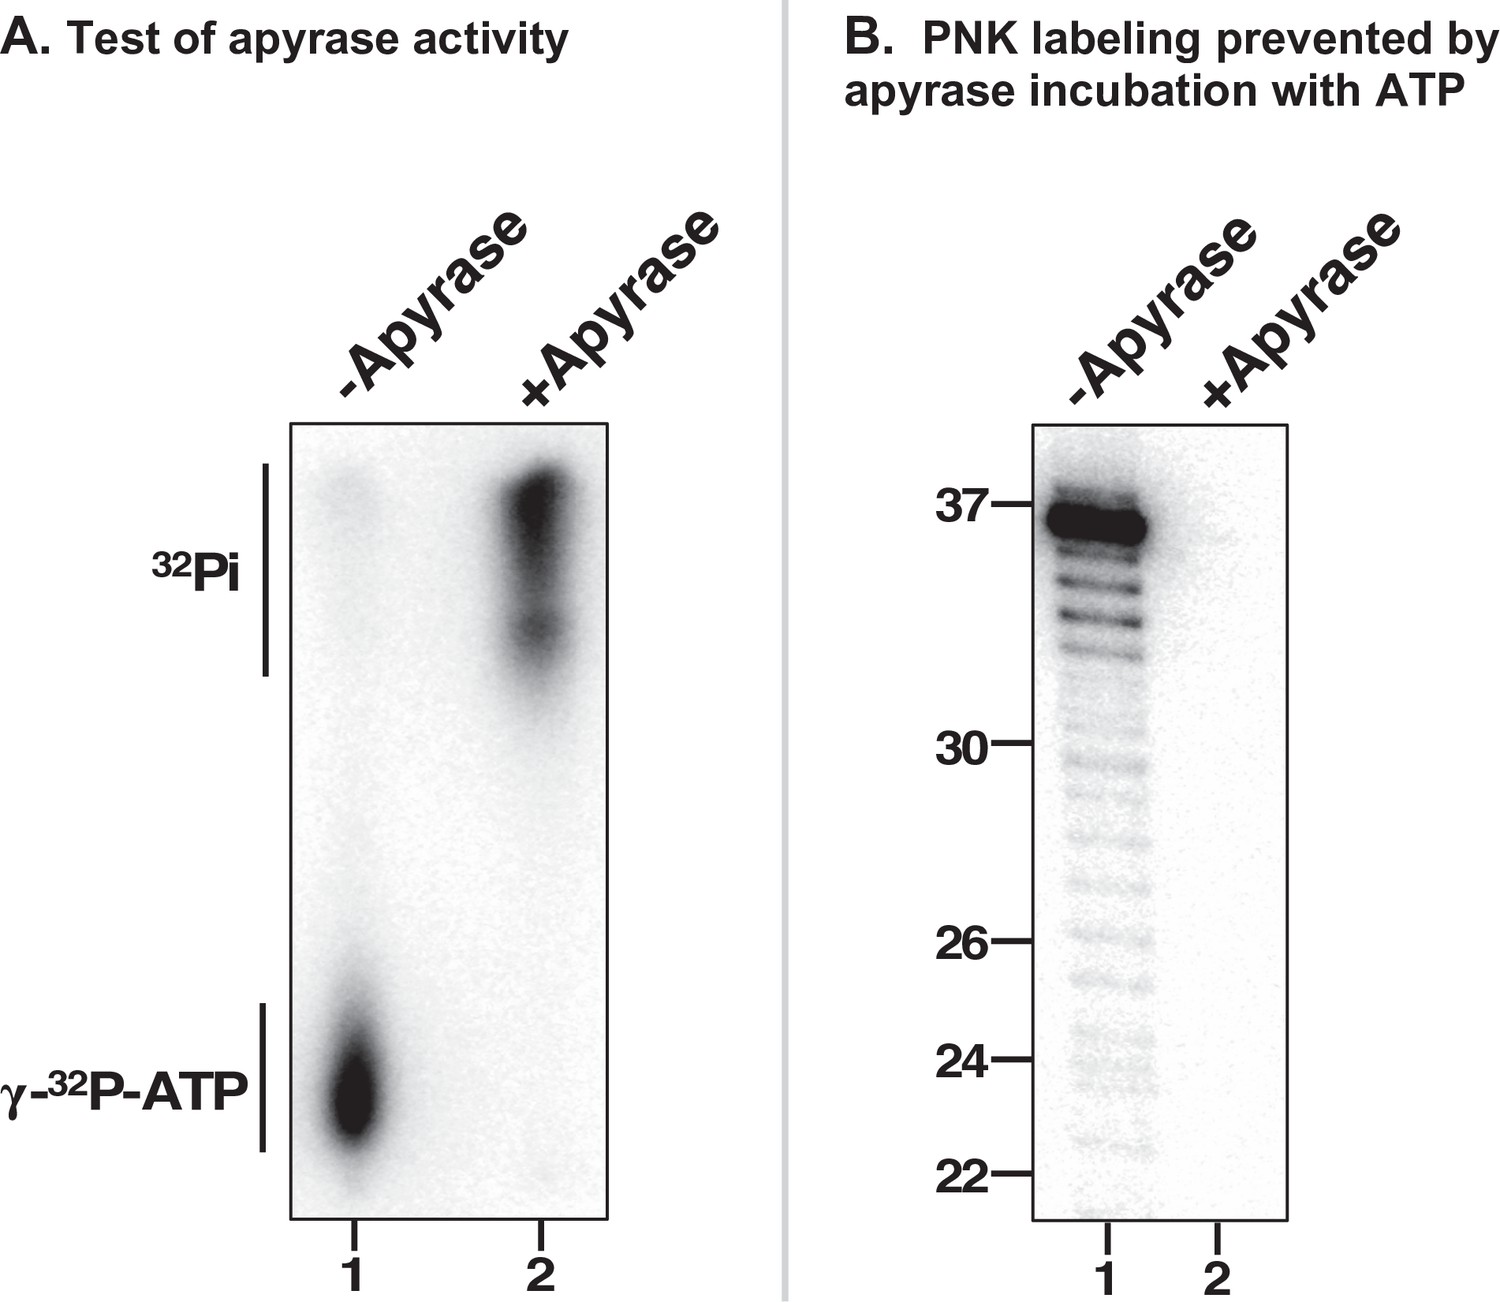
Controls demonstrating ATP destruction by Apyrase.
(A) Apyrase was incubated with gamma-32P-ATP then heat-inactivated. Aliquots of the apyrase reaction (lane 2) and the mock apyrase reaction (lane 1) were then subjected to thin-layer chromatography (TLC). Following buffer migration, the dried TLC plate was imaged using phosphorimaging. (B) T4 polynucleotide kinase (PNK)-mediated RNA end-labeling is prevented by apyrase-mediated hydrolysis of ATP. Using a 37 nt substrate RNA mixed with gamma-32P-ATP in PNK reaction buffer, reactions were incubated with buffer (lane 1) or apyrase (lane 2) for 10 min. PNK was then added and reactions were incubated for 30 min. The RNA was then subjected to denaturing PAGE and phosphorimaging.
-
Figure 5—figure supplement 2—source data 1
Raw image of a thin-layer chromatogram on which 32P-ATP is resolved from 32P phosphate (Pi) following apyrase treatment, and the rectangle denotes the portion of the raw image used for Figure 5—figure supplement 2A.
- https://cdn.elifesciences.org/articles/73260/elife-73260-fig5-figsupp2-data1-v2.pdf
-
Figure 5—figure supplement 2—source data 2
Gel image and portion used for Figure 5—figure supplement 2B.
The image was obtained by phosphorimaging of a 32P-end-labeling reaction using a 37 nt RNA, followed by denaturing PAGE.
- https://cdn.elifesciences.org/articles/73260/elife-73260-fig5-figsupp2-data2-v2.pdf
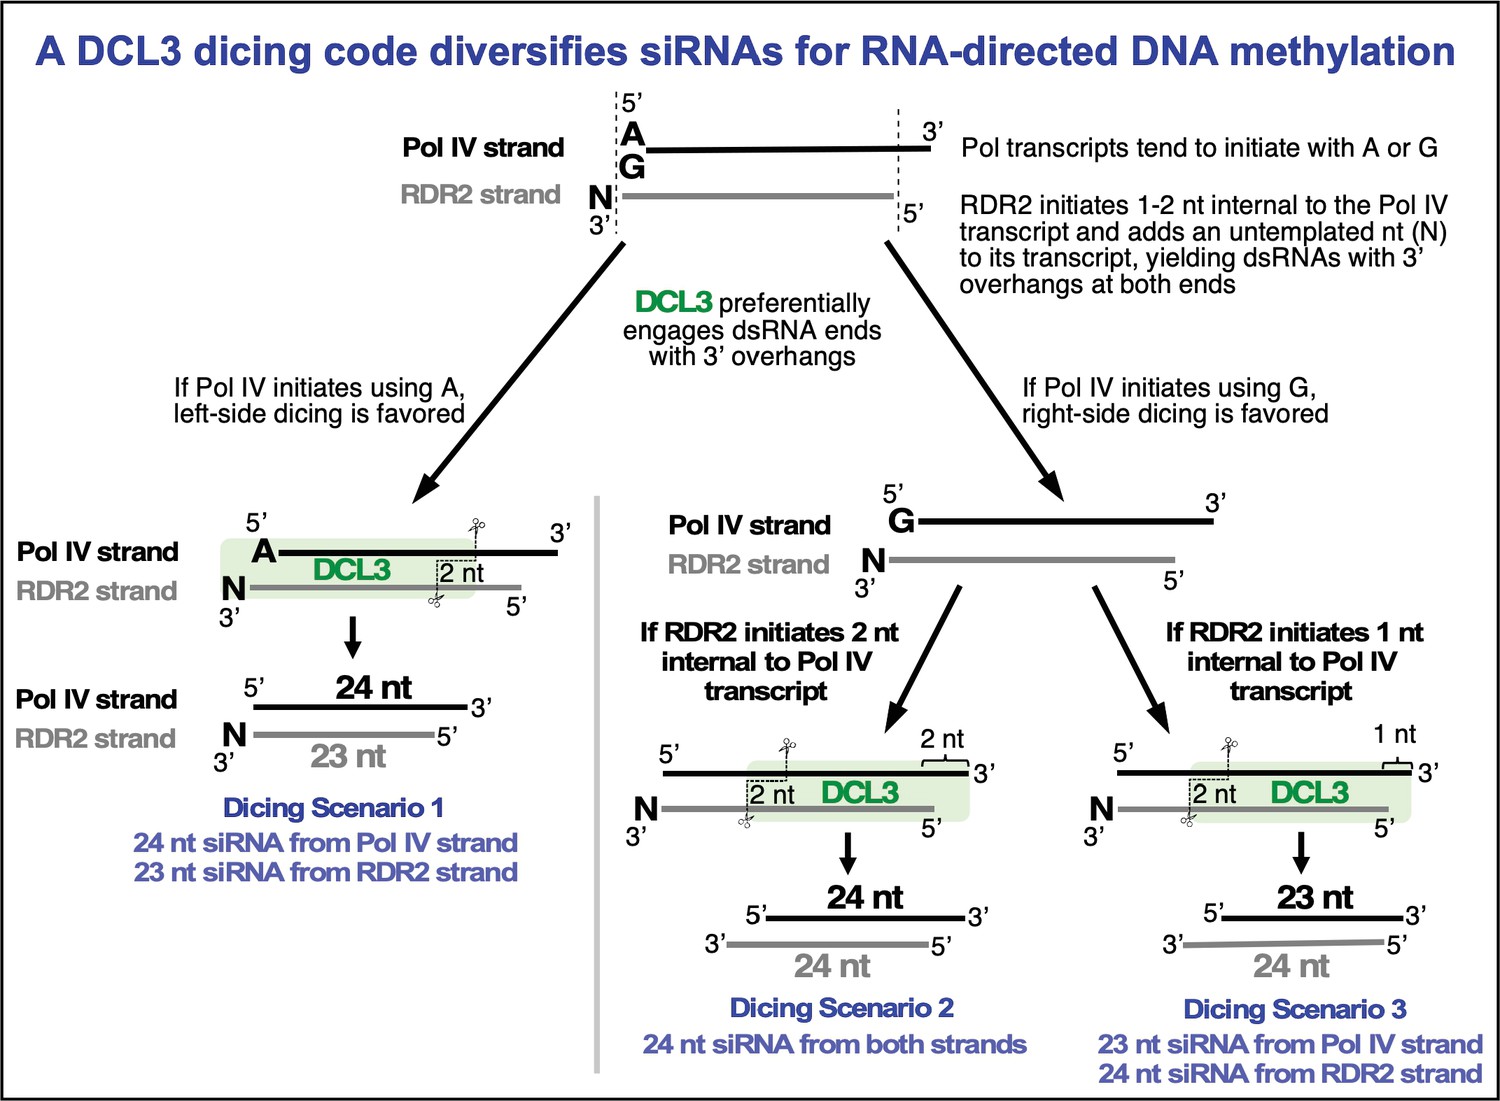
Figure 6

Overhangs at both ends of DCL3 substrates explain 24 and 23 nt siRNA biogenesis from both strands.
(A) Hypotheses to account for 24 and 23 nt siRNAs derived from both the Pol IV and RDR2-transcribed strands of diced dsRNAs. Scenario 1 is the hypothesis of Figure 1B and Singh et al., 2019, accounting for 23 nt RDR2-strand siRNAs bearing an untemplated 3′ terminal nucleotide paired with 24 nt siRNAs corresponding to the 5′ end of Pol IV transcripts. Scenarios 2 and 3 show how RDR2 transcription initiating either 1 or 2 nt internal to the 3′ end of Pol IV transcripts could generate 3′ overhangs of 1 or 2 nt, respectively, promoting right-side dicing. In scenario 2, a 23 nt siRNA can be generated from the Pol IV strand and a 24 nt siRNA can be produced from the RDR2 strand. In scenario 3, 24 nt siRNAs are generated from both strands. (B) 3′ overhangs are present at both termini of Pol IV-RDR2 transcribed dsRNAs. Pol IV-RDR2 transcription reactions were performed in either of two ways to selectively label either the Pol IV or RDR2 strand. To label Pol IV transcripts, a 32P-end-labeled RNA primer was used to initiate Pol IV transcription of a DNA template lacking thymidines (lanes 1–4). The presence of non-template DNA annealed to the template induces Pol IV arrest and RDR2 initiation of the complementary strand which can be selectively body-labeled using alpha-32P-ATP (lanes 5–8). Overhangs present in the dsRNA products generated by the coupled reactions of Pol IV and RDR2 are sensitive to digestion by S1 nuclease treatment (see diagram), generating the shorter labeled products observed for both Pol IV (lanes 2–4) and RDR2 (lanes 6–8) transcripts. Mock S1 nuclease treatment negative controls are shown in lanes 1 and 2. RNAs were resolved by denaturing PAGE and visualized by autoradiography. (C) RDR2 initiates transcription 1 or 2 nt internal to the 3′ end of the template RNA strand. A 37 nt RNA labeled with 32P at its 5′ end (50 nM) was used as template for second-strand synthesis by recombinant RDR2 (280 nM) (lanes 1 and 2). Half of the transcription reaction was then subjected to S1 nuclease digestion (lane 2). In parallel, controls in which the end-labeled template was hybridized with strands whose complementarity begins at the very end of the template or 1 or 2 nt internal were also generated and subjected to S1 nuclease digestion (lanes 3–8). RNAs were resolved by denaturing PAGE and visualized by autoradiography. (D) 24 nt siRNAs are diced from the 5′ ends of Pol IV and RDR2 transcripts and 23 nt siRNAs are diced from their 3′ ends. In vitro transcription reactions using the template, non-template, and primer diagrammed in (B) (see Supplementary file 1 for their sequences) were conducted in several ways in order to specifically end-label or body-label Pol IV or RDR2 transcripts. The reactions of lanes 1 and 2 were conducted with end-labeled primer in order to specifically label the 5′ ends of Pol IV transcripts. The labeled band of ~25 nt in both lanes 1 and 2 is an RDR2-dependent, Pol IV- and DCL3-independent background RNA. In lanes 3–6, unlabeled primer was used to initiate dsRNA synthesis from the T-less DNA template, with Pol IV or RDR2 transcripts body-labeled with either 32P-UTP or 32P-ATP, respectively. In the reactions of lanes 7–10, an unlabeled primer with a 5′ hydroxyl group was used to initiate Pol IV transcription from the T-less DNA template. In the reactions of lanes 7 and 8, RDR2-transcripts were body labeled using 32P-ATP (as in lanes 5 and 6). For the reactions in lanes 9 and 10, no labeled nucleotide was incorporated during transcription, but transcripts (lane 9) or dicing reactions (lane 10) were subsequently incubated with capping enzyme and alpha-32P-GTP to label the 5′ end of RDR2 transcripts by capping.
-
Figure 6—source data 1
Raw gel image and the portion used for Figure 6B.
The image is that of a sheet of X-ray filmdeveloped after exposure to a dried denaturing PAGE gel on which 32P- labelledRNA species were resolved.
- https://cdn.elifesciences.org/articles/73260/elife-73260-fig6-data1-v2.pdf
-
Figure 6—source data 2
Raw gel image and the portion used for Figure 6C.
Duplicate images were obtained by phosphorimaging of a dried polyacrylamide gel on which 32P- labelled RNA species were resolved by denaturing gel electrophoresis. The red rectangle in the image on the right shows the portion of the raw image used in the figure.
- https://cdn.elifesciences.org/articles/73260/elife-73260-fig6-data2-v2.pdf
-
Figure 6—source data 3
Raw gel images and the portions used for Figure 6D.
In the top and bottom rows are duplicated images of two X-ray films developed after exposure to dried polyacrylamide gels on which 32P- labelled RNA species were resolved by denaturing gel electrophoresis. In the top and bottom rows are duplicated images of two X-ray films developed after exposure to dried polyacrylamide gels on which 32P- labelled RNA species were resolved by denaturing gel electrophoresis. The red rectangles in the bottom row show the groups of lanes used in the left, central and right portions of Figure 6D.
- https://cdn.elifesciences.org/articles/73260/elife-73260-fig6-data3-v2.pdf
Figure 7
Summary model for a DCL3 dicing code that diversifies the siRNA pool guiding RNA-directed DNA methylation.
Tables
Key resources table
| Reagent type (species) or resource | Designation | Source or reference | Identifiers | Additional information |
|---|---|---|---|---|
| Gene (Arabidopsis thaliana) | FLAG-DCL3 | Singh et al., 2019 | Synthetic gene codon-optimized for insect cells | |
| Cell line (Trichoplusia ni) | High Five Cells in Express Five Medium | Thermo Fisher Scientific | Cat # B85502 | For baculovirus replication and expression |
| Transfected construct (Escherichia coli) | pUC57-DCL3 (synthetic DCL3, codon optimized for insect cells) | Singh et al., 2019 | N/A | Strain carrying cloned FLAG-DCL3 gene |
| Transfected construct (T. ni) | pFastBacHT B-DCL3 | Singh et al., 2019 | N/A | Construct for baculovirus expression |
| Transfected construct (T. ni) | pFastBacHT B-DCL3_E1146Q_E1329Q | This paper | N/A | RNase III domain A/B double mutant |
| Transfected construct (T. ni) | pFastBacHT B-DCL3_E1146Q | This paper | N/A | RNase III domain mutant |
| Transfected construct (T. ni) | pFastBacHT B-DCL3_E1329Q | This paper | N/A | RNase III domain mutant |
| Chemical compound, drug | PMSF | Sigma-Aldrich | Cat # P7626 | Protease inhibitor |
| Chemical compound, drug | GlycoBlue | Thermo Fisher Scientific | Cat # AM9515 | |
| Chemical compound, drug | Ribolock RNase Inhibitor | Thermo Fisher Scientific | Cat # EO0384 | |
| Chemical compound, drug | RNase Inhibitor (Murine) | NEB | Cat # M0314 | |
| Chemical compound, drug | S1 nuclease | Promega | Cat # M5761 | |
| Chemical compound, drug | Proteinase K, RNA grade | Invitrogen | Cat # 25530049 | |
| Chemical compound, drug | T4 Polynucleotide Kinase | NEB | Cat # M0201S | Enzyme for end-labeling RNA |
| Chemical compound, drug | Adenosine 5′-triphosphate magnesium salt | Sigma-Aldrich | Cat # A9187 | |
| Chemical compound, drug | [γ32P]-ATP, 6000 Ci/mmol | PerkinElmer | Cat #BLU002Z250UC | Used for end-labeling RNA |
| Chemical compound, drug | Apyrase | NEB | Cat # M0398L | Hydrolyzes ATP; used in Figure 5 |
| Chemical compound, drug | SYBR Gold Nucleic Acid Gel Stain (10,000×) | Invitrogen | Cat # S11494 | |
| Chemical compound, drug | RNA Loading Dye (2×) | NEB | Cat # B0363S | |
| Chemical compound, drug | 2× TBE-Urea Sample Buffer | Invitrogen | Cat # LC6876 | |
| Chemical compound, drug | IPEGAL CA-630 | Sigma-Aldrich | Cat # I8896 | Dete |
| Chemical compound, drug | Set of rATP, rUTP, rCTP, and rGTP | Sigma-Aldrich | Cat # A1388 | Used for Pol IV-RDR2 transcription |
| Chemical compound, drug | Anti-FLAG M2 affinity gel | Sigma-Aldrich | Cat # A2220 | |
| Commercial assay or kit | Vaccinia capping system | NEB | Cat # M2080S | 5′ end-capping in Figure 6 |
| Software, algorithm | Image Lab 6.0.1 | Bio-Rad | Cat # 12012931 | |
| Other | Express FiveSFM | Thermo Fisher Scientific | Cat # 10486025 | Serum-free medium for High Five cells |
| Other | Macherey-Nagel Polygram CEL 300 PEI/UV254 Polyester Sheets | Thermo Fisher Scientific | Cat # 10013021 | For TLC assay of ATP hydrolysis |
Additional files
-
Supplementary file 1
Oligonucleotides used in the study.
(a) RNA oligonucleotides used for DCL3 dicing assays. (b) Oligonucleotides used for Pol IV and RDR2 transcription assays.
- https://cdn.elifesciences.org/articles/73260/elife-73260-supp1-v2.docx
-
Transparent reporting form
- https://cdn.elifesciences.org/articles/73260/elife-73260-transrepform1-v2.docx
Download links
A two-part list of links to download the article, or parts of the article, in various formats.
Downloads (link to download the article as PDF)
Open citations (links to open the citations from this article in various online reference manager services)
Cite this article (links to download the citations from this article in formats compatible with various reference manager tools)
A DCL3 dicing code within Pol IV-RDR2 transcripts diversifies the siRNA pool guiding RNA-directed DNA methylation
eLife 11:e73260.
https://doi.org/10.7554/eLife.73260


