Predicting progression-free survival after systemic therapy in advanced head and neck cancer: Bayesian regression and model development
- UCL Cancer Institute, Paul O'Gorman Building, University College London, United Kingdom
- Comprehensive Cancer Centre, School of Cancer & Pharmaceutical Sciences, King’s College London, United Kingdom
- Richard Dimbleby Laboratory of Cancer Research, School of Cancer & Pharmaceutical Sciences, King's College London, United Kingdom
- Breast Cancer Now Research Unit, School of Cancer & Pharmaceutical Sciences, King’s College London, United Kingdom
- Tumor Immunology Group, School of Cancer & Pharmaceutical Sciences, King’s College London, United Kingdom
- Centre for Clinical, Oral & Translational Science, King’s College London, United Kingdom
- Systems Cancer Immunology, School of Cancer & Pharmaceutical Sciences, King’s College London, United Kingdom
- Daiichi Sankyo Incorporated, United States
- The Institute of Cancer Research, United Kingdom
- Institute for Mathematical and Molecular Biomedicine, King’s College London, United Kingdom
- Saddle Point Science Ltd, United Kingdom
Figures
Figure 1 with 2 supplements
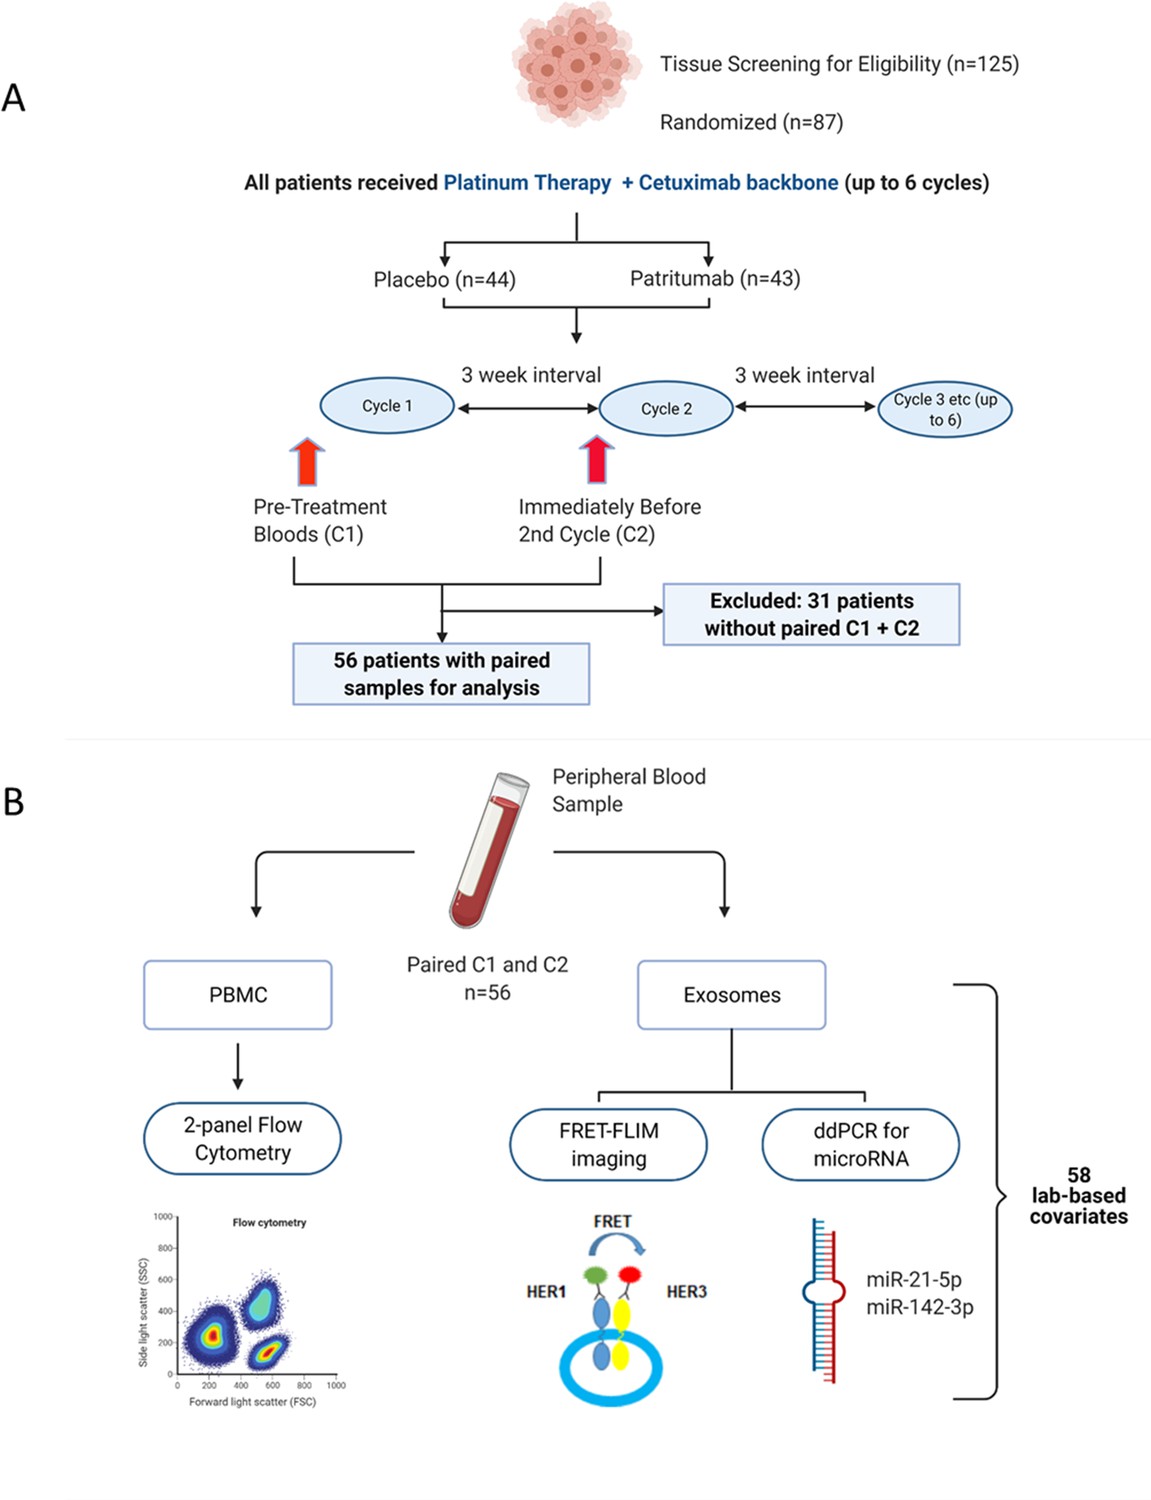
Peripheral blood samples from the clinical trial were prospectively analysed using a multimodality platform.
(A) Schematic of clinical trial design and timepoints at which peripheral blood was obtained. (B) Fifty-six (n=56) paired blood samples, obtained pre-treatment (C1) and after one cycle of treatment (C2) were subjected to flow cytometry, Förster resonance energy transfer-fluorescence lifetime imaging microscopy (FRET-FLIM) imaging, and droplet digital polymerase chain reaction (ddPCR) analysis.
Figure 1—figure supplement 1

Kaplan-Meier curve of progression-free survival in study cohort.
Progression-free survival data was obtained from 53 patients and stratified according to patients who received patritumab and the cohort which received placebo.
Figure 1—figure supplement 2
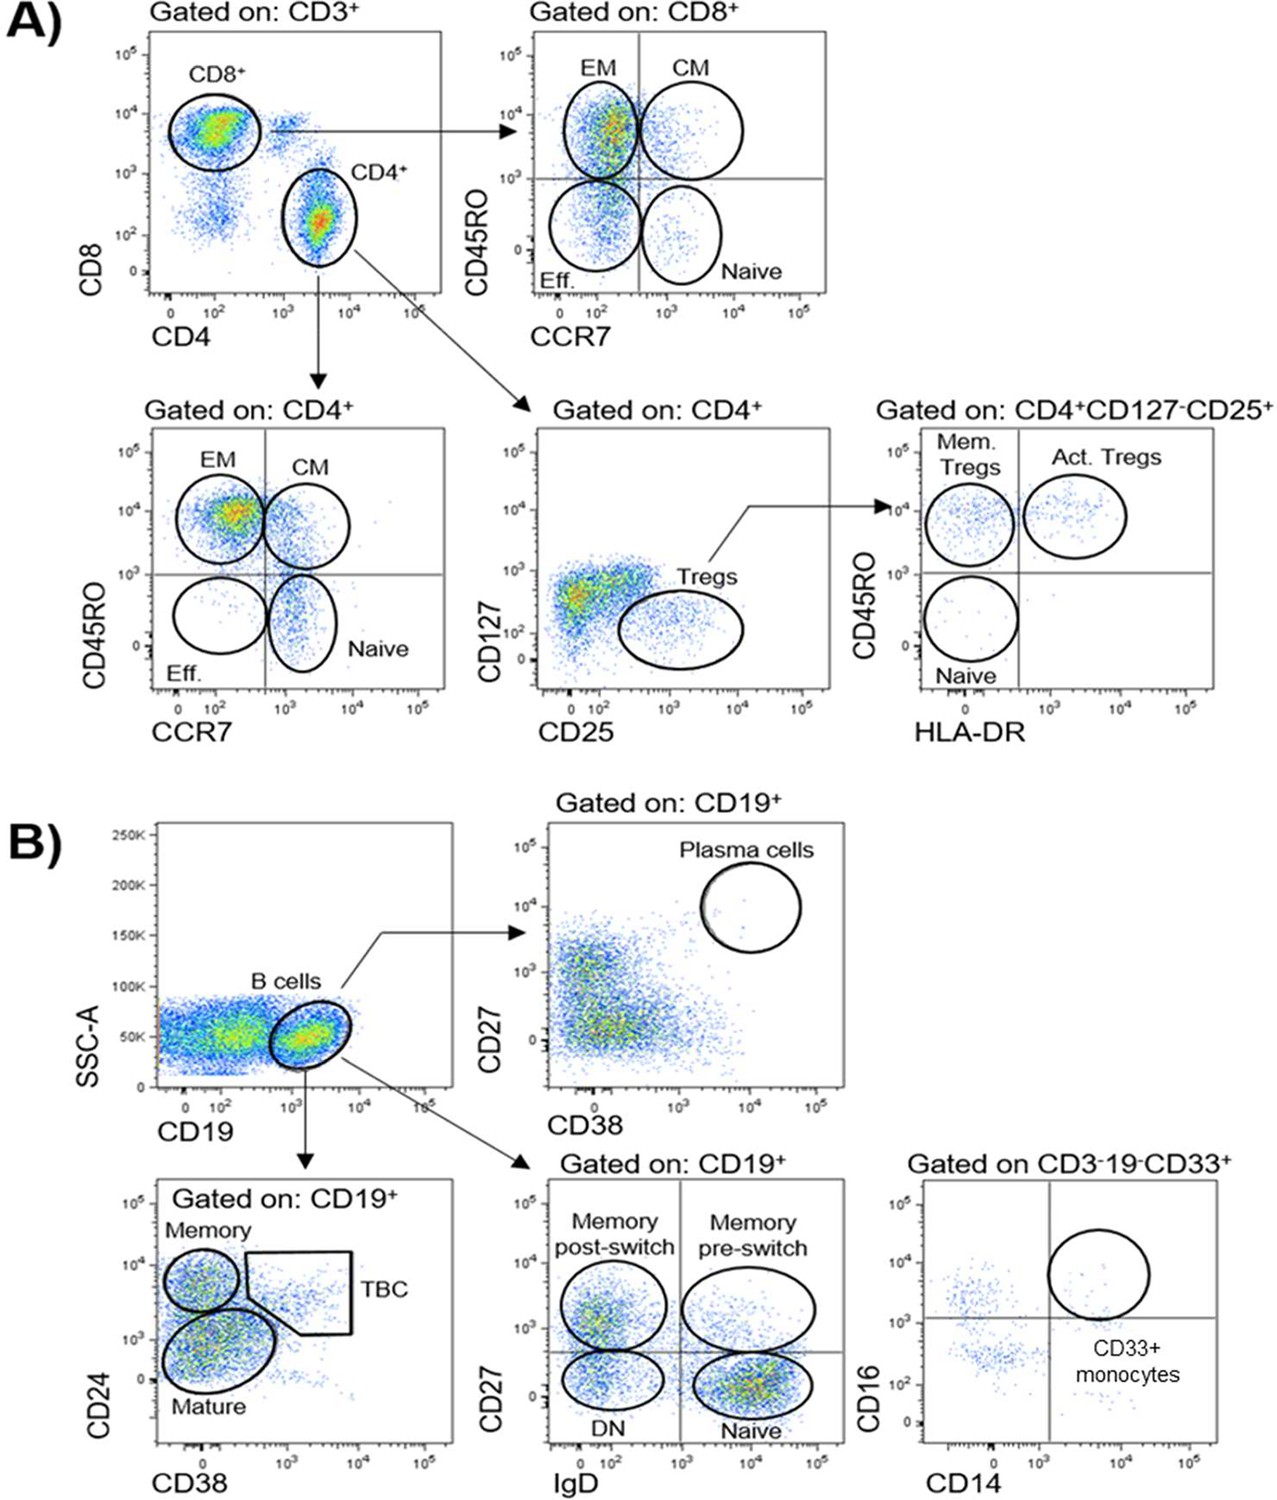
Gating strategies for definition of peripheral blood immune populations.
Peripheral immune cell populations analysed in this study are indicated in corresponding gates. (A) Subpopulations of CD3+CD4+and CD3+CD8+T cells were further identified by using markers CCR7 and CD45RO as effector (Eff., CD45RO-CCR7-), naïve (CD45RO- CCR7+), central memory (CM, CD45RO+CCR7+), and effector memory (EM, CD45RO+CCR7-). The activation status of CD4+ regulatory T cells (Tregs, CD127-/lo CD25hi) was defined by markers CD45RO and HLA-DR as indicated: naïve Tregs (HLA-DR-CD45RO), activated Tregs (Act. Tregs, HLA-DR+CD45RO+), and memory Tregs (Mem. Tregs, HLA-DR-CD45RO+). (B) CD19+ B cell subpopulations were identified with markers CD24, CD38, and CD27: plasma cells (CD38+CD27+); mature (CD24loCD38lo), memory (CD24hiCD38-), transitional (TBC, CD24hiCD38hi); or a combination of IgD and CD27: naïve (IgD+CD27-), memory pre-switch (IgD+CD27+), memory post-switch (IgD-CD27+), or double-negative B cells (DN, IgD-CD27-). CD33+ CD14+ monocytes were defined as CD3-CD19-CD33+CD16+CD14+.
Figure 2
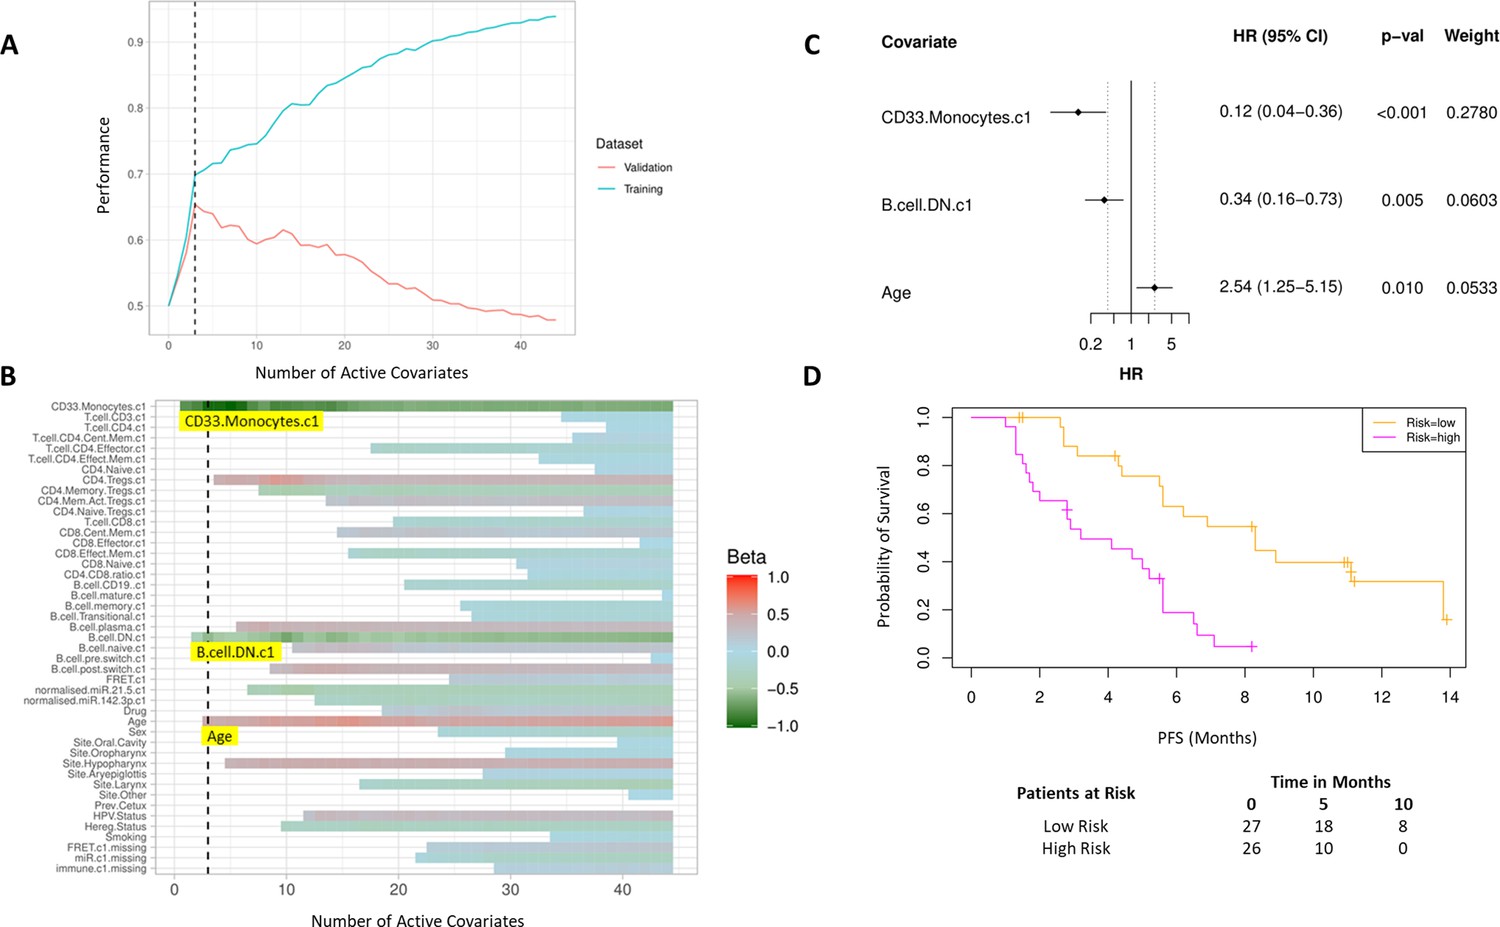
High baseline CD33+CD14+ monocytes and double negative B cells predict progression-free survival (PFS).
(A) Covariates were ranked for importance and selected by a proportional hazards regression model with cross-validation. (B) Proportional hazards regression revealed three covariates which exceed the beta critical value – CD33+CD14+ monocytes, double negative B cells, and age. (C) Forest plot of the three covariates within PFS risk score with dotted line indicating the range, around 1, of typical random covariates. (D) PFS risk signature performance, low risk score (n=27) and high-risk score (n=26). Log rank p-value = 6.0e-5, with numbers at risk demonstrated under Kaplan-Meier curve. The multivariate analysis resulted in risk signatures that are linear combinations of weighted covariates. Their ability to predict outcome is demonstrated with data split by signature value.
Figure 3
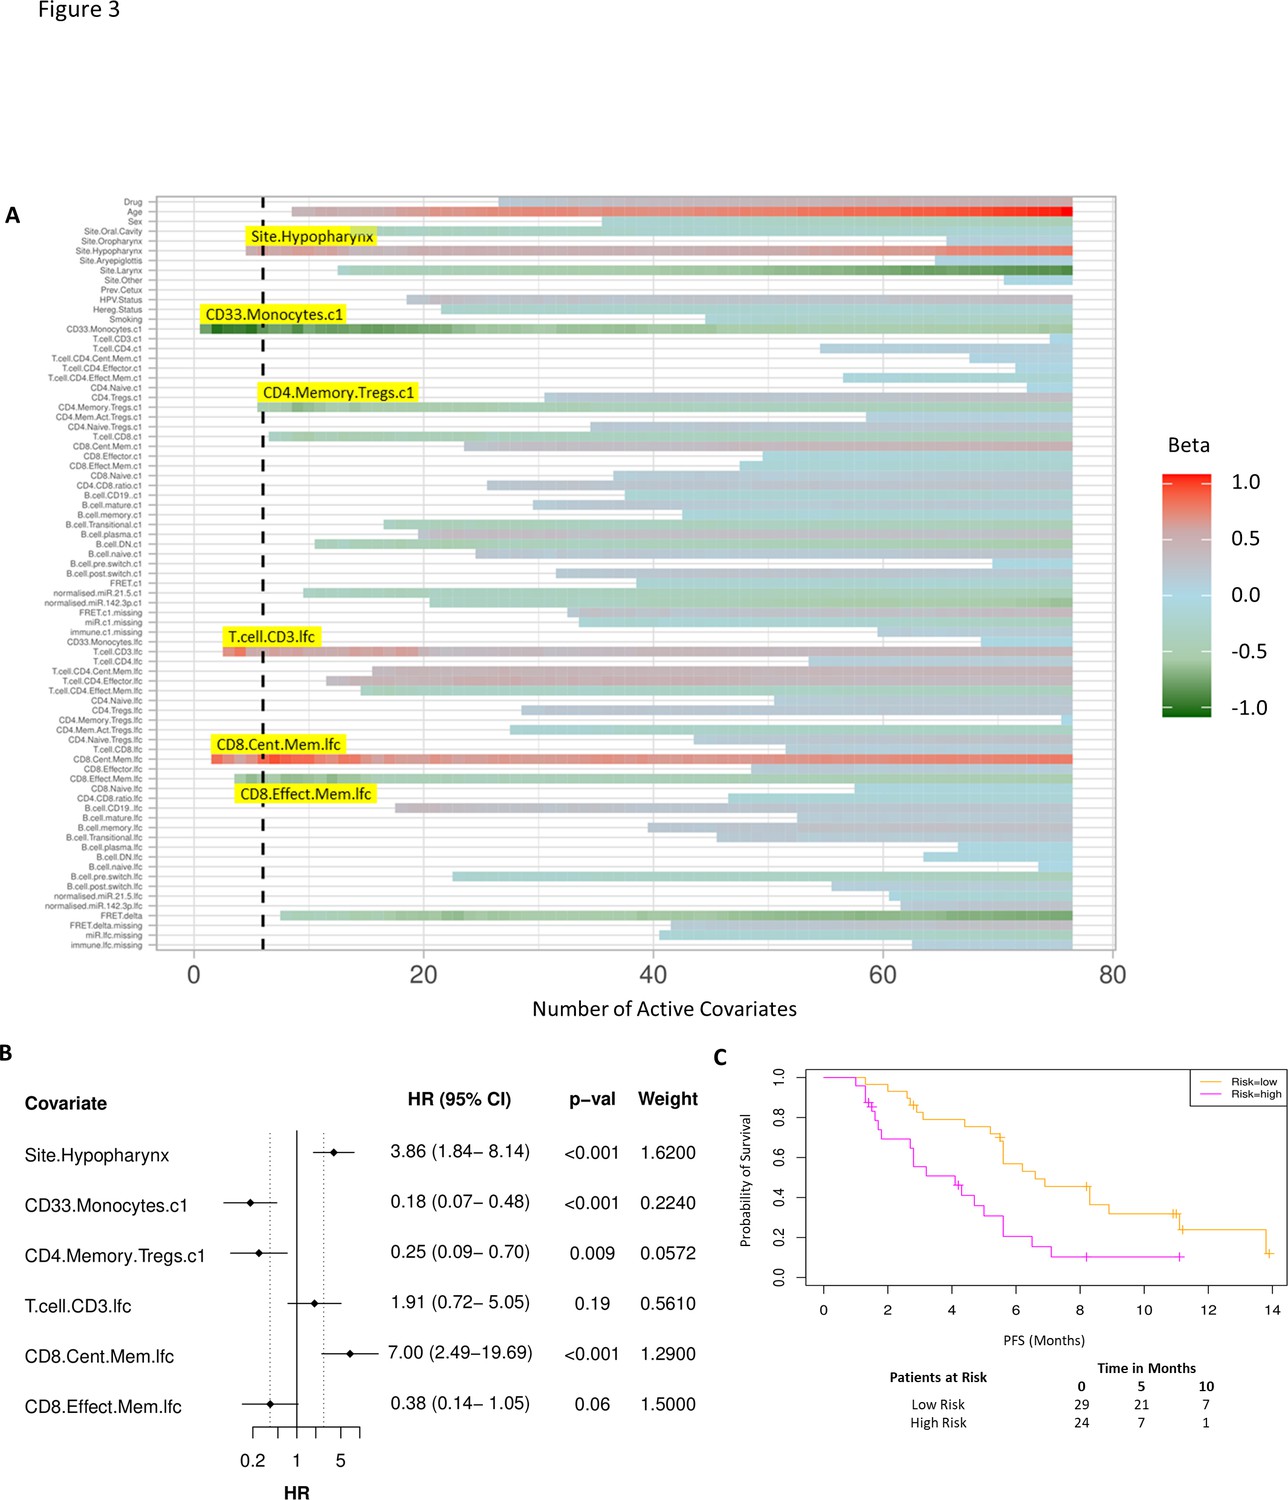
Model incorporating laboratory changes after one cycle of treatment exhibit improved predictive value.
(A) Proportional hazards regression revealed five immune subpopulations which exceed the beta critical value – baseline CD33+CD14+ monocytes, baseline CD4+ memory regulatory T cells, log2-fold change (lfc) of CD8+ effector memory T cells, lfc of CD8+ central memory T cells, and lfc of CD3+ T cells. The primary tumour site of hypopharynx also featured in the signature. A negative beta value is associated with lower risk score and hence better progression-free survival. (B) Forest plot of the three covariates within progression-free survival risk score. (C) Progression-free survival risk signature performance, low risk score (n=29) and high-risk score (n=24). Log rank p-value = 0.004, with numbers at risk demonstrated under Kaplan-Meier curve.
Figure 4 with 1 supplement
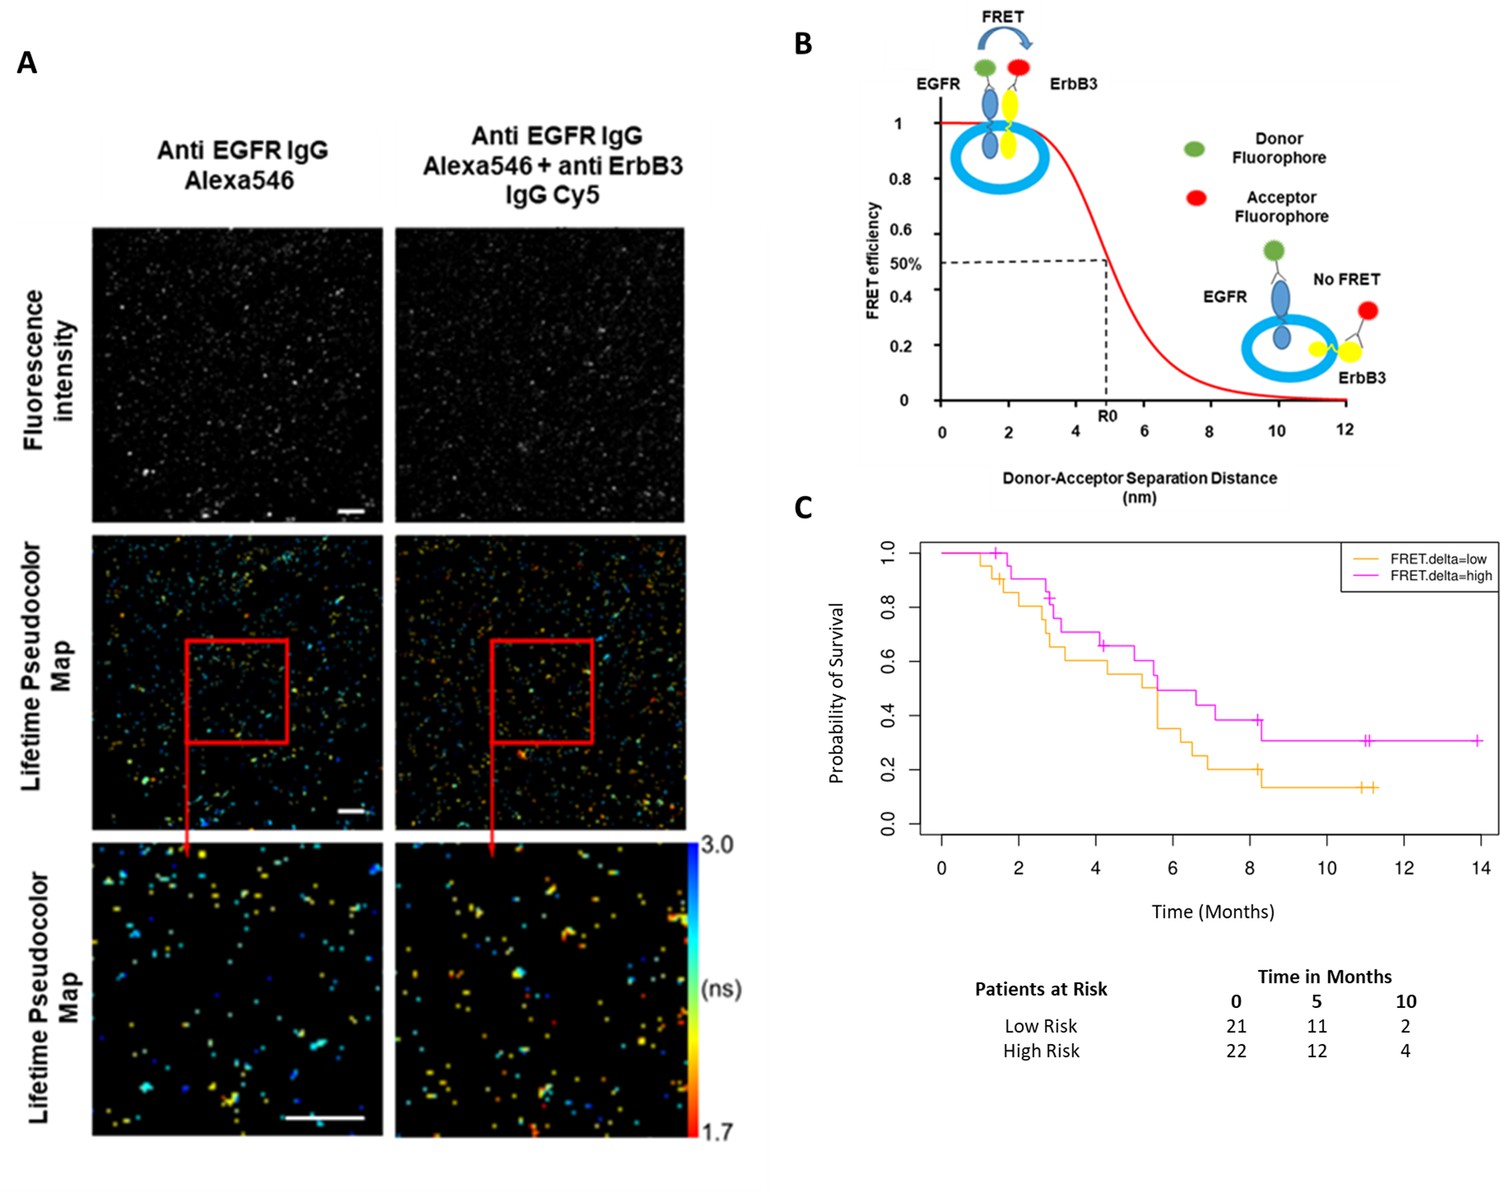
Förster resonance energy transfer/fluorescence lifetime imaging microscopy (FRET/FLIM) assay of circulating exosomes extracted from patients.
(A) Time-resolved fluorescence intensity images and donor lifetime map of exosomes labelled with Anti-EGFR-IgG-Alexa 546 and Anti-ErbB3-IgG-Cy5 extracellular antibodies. (B) Schematic illustration of the fluorescent labelling geometry on exosomes and distance dependence of FRET efficiency. (C) Progression-free survival of subpopulations divided by median FRET difference, FRET.delta low (n=21) and FRET.delta high (n=22). Log rank p-value = 0.2, with numbers at risk demonstrated under Kaplan-Meier curve.
Figure 4—figure supplement 1

Correlation between miRNA-21 fold change and CD33+CD14+monocyte fold change after one cycle of treatment.
τ=0.43, p=0.02. miR21: MicroRNA-21-5p, lfc: log2-fold change.
Figure 5 with 3 supplements
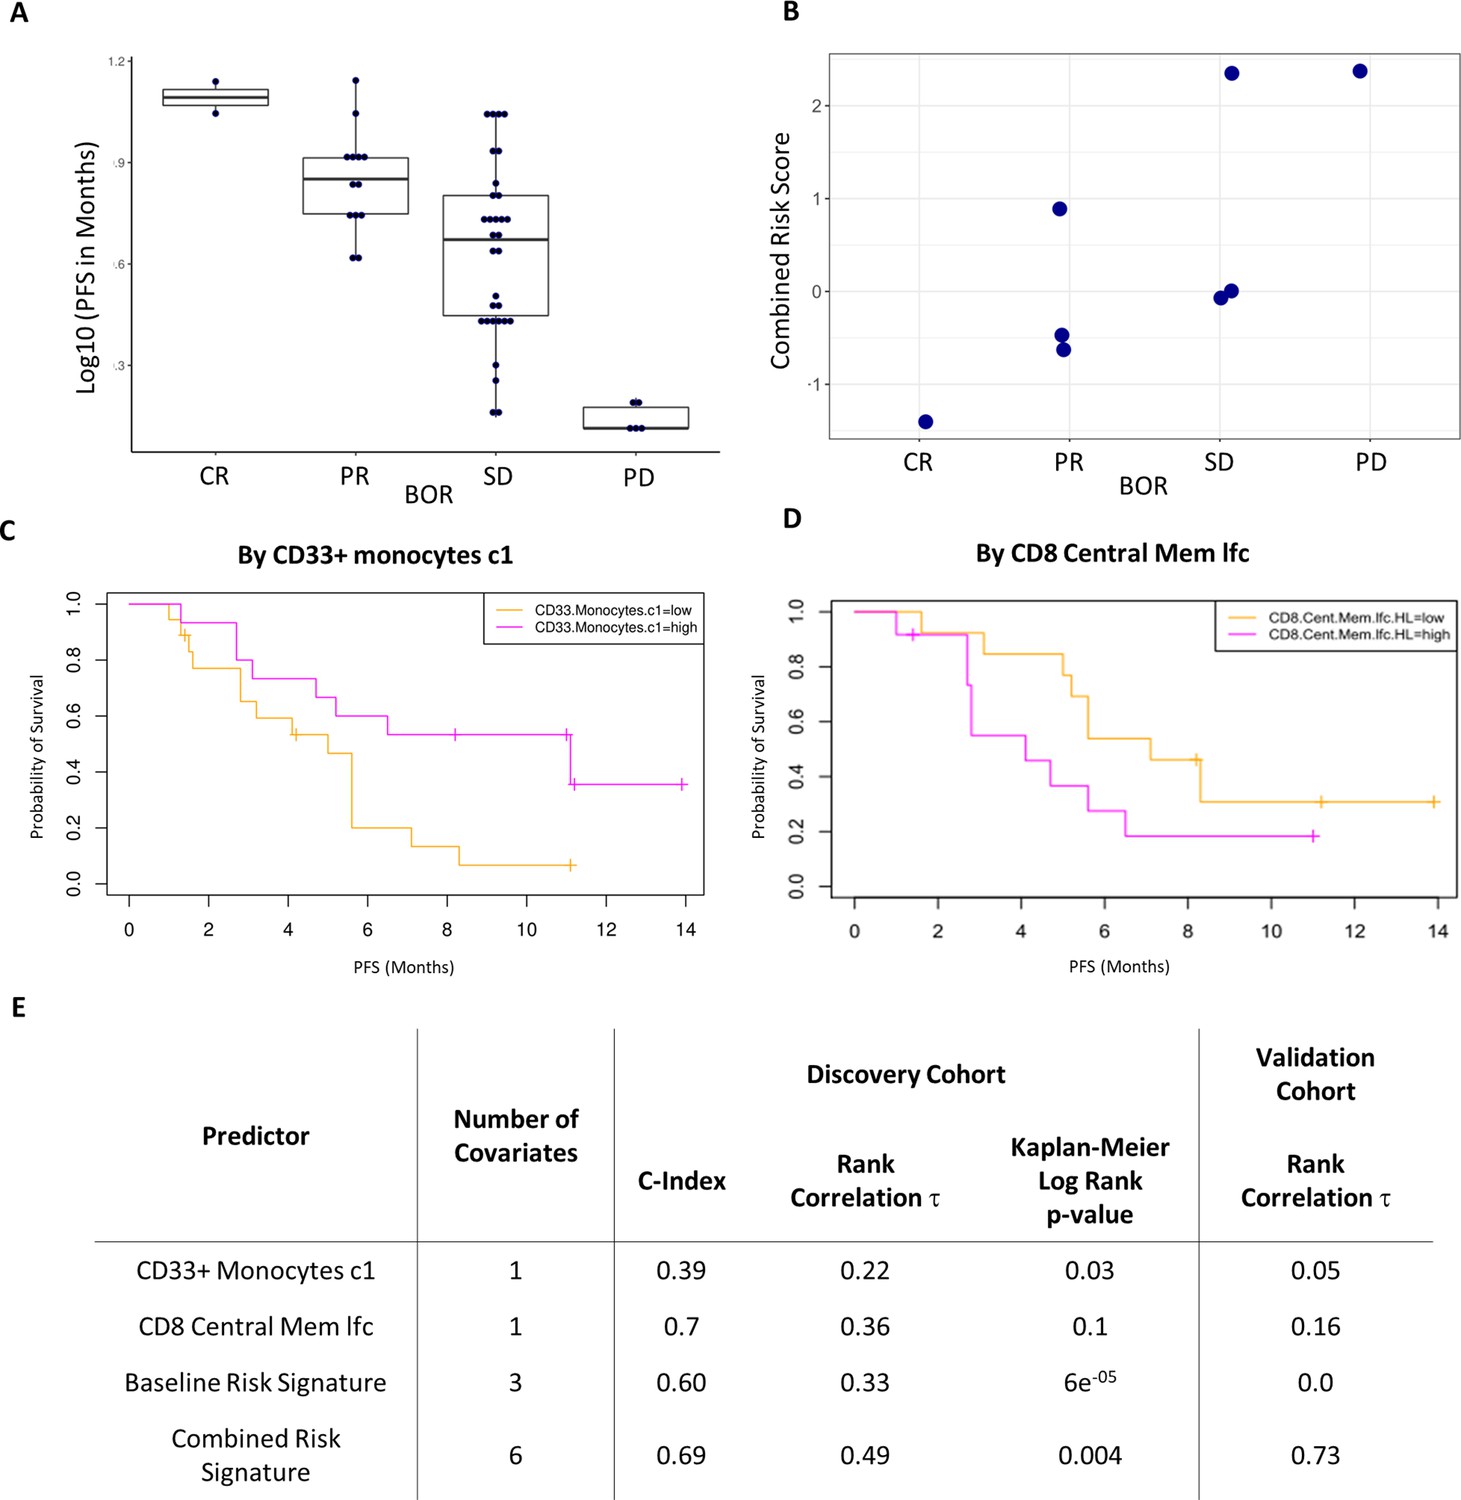
Validation of the combined risk score in the EACH cohort.
(A) Correlation between progression-free survival (PFS) and best objective response (BOR) in the original cohort (τ=−0.52, p=3e-6). (B) Correlation between the combined risk signature and the BOR of the patients in the validation cohort (τ=0.74, p=0.02). (C) Kaplan-Meier curves of PFS split by median percentage of baseline CD33+CD14+ value. (D) Kaplan-Meier curves of PFS split by median value of on treatment fold change of CD8+ central memory T cells relative to baseline. lfc: log2-fold change. (E) Table summarizes C-index, rank correlation, and log rank p-value based on type and number of covariates in both cohorts.
Figure 5—figure supplement 1

The validation EACH trial.
(A) Schematic representation of the trial design. Blood samples were collected at the indicated timepoints. For the validation cohort we assessed the PBMCs obtained before the first cycle of cetuximab treatment and just before second cycle of therapy which was a combination of cetuximab and avelumab. (B) Histogram showing frequency distribution of the viability of the thawed patient PBMCs. Dashed line indicates the viability cut-off used for the validation cohort.
Figure 5—figure supplement 2
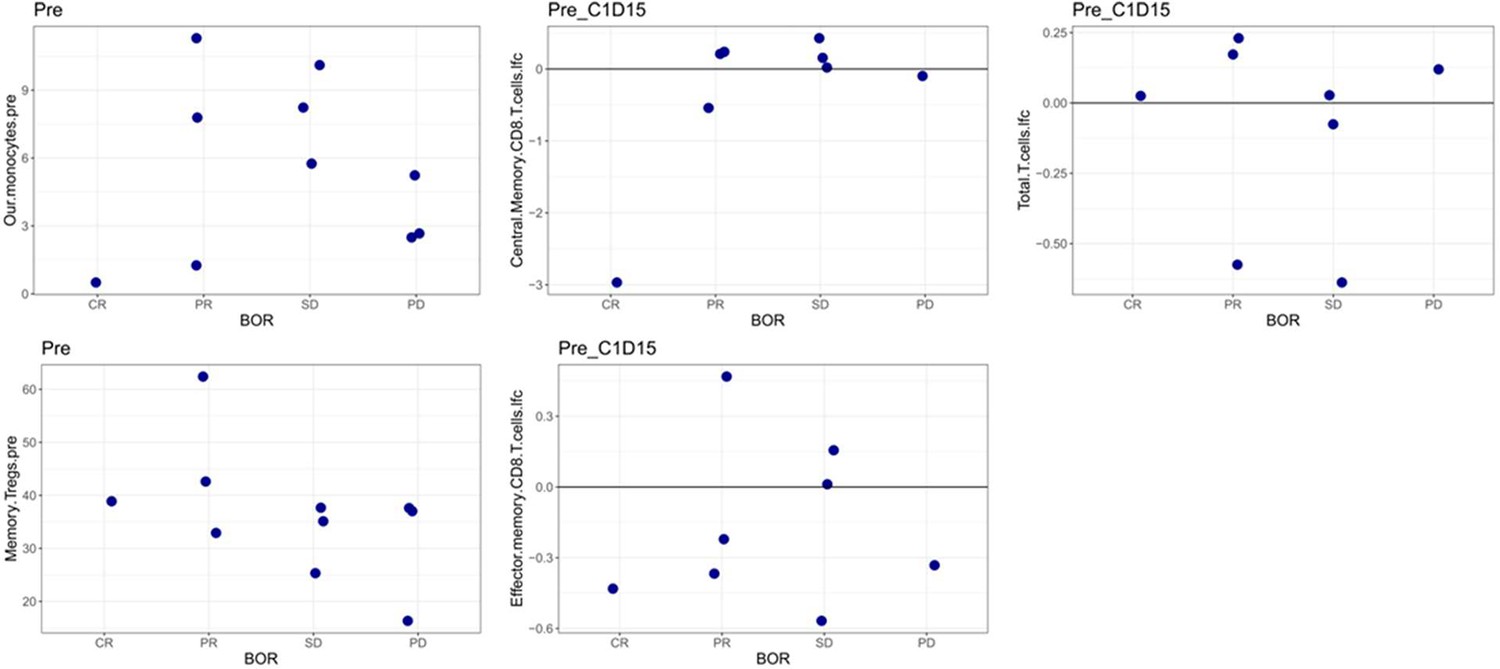
Correlation between each of the significant covariates derived in the combined risk signature with treatment outcome in the EACH cohort.
Figure 5—figure supplement 3

Gating strategy for further characterization of CD33+CD14+ monocytic population using new patient cohort.
CD14+CD16lowCD33+CD11b+ monocytes also express high levels of HLA-DR and CD11c.
Figure 6 with 1 supplement
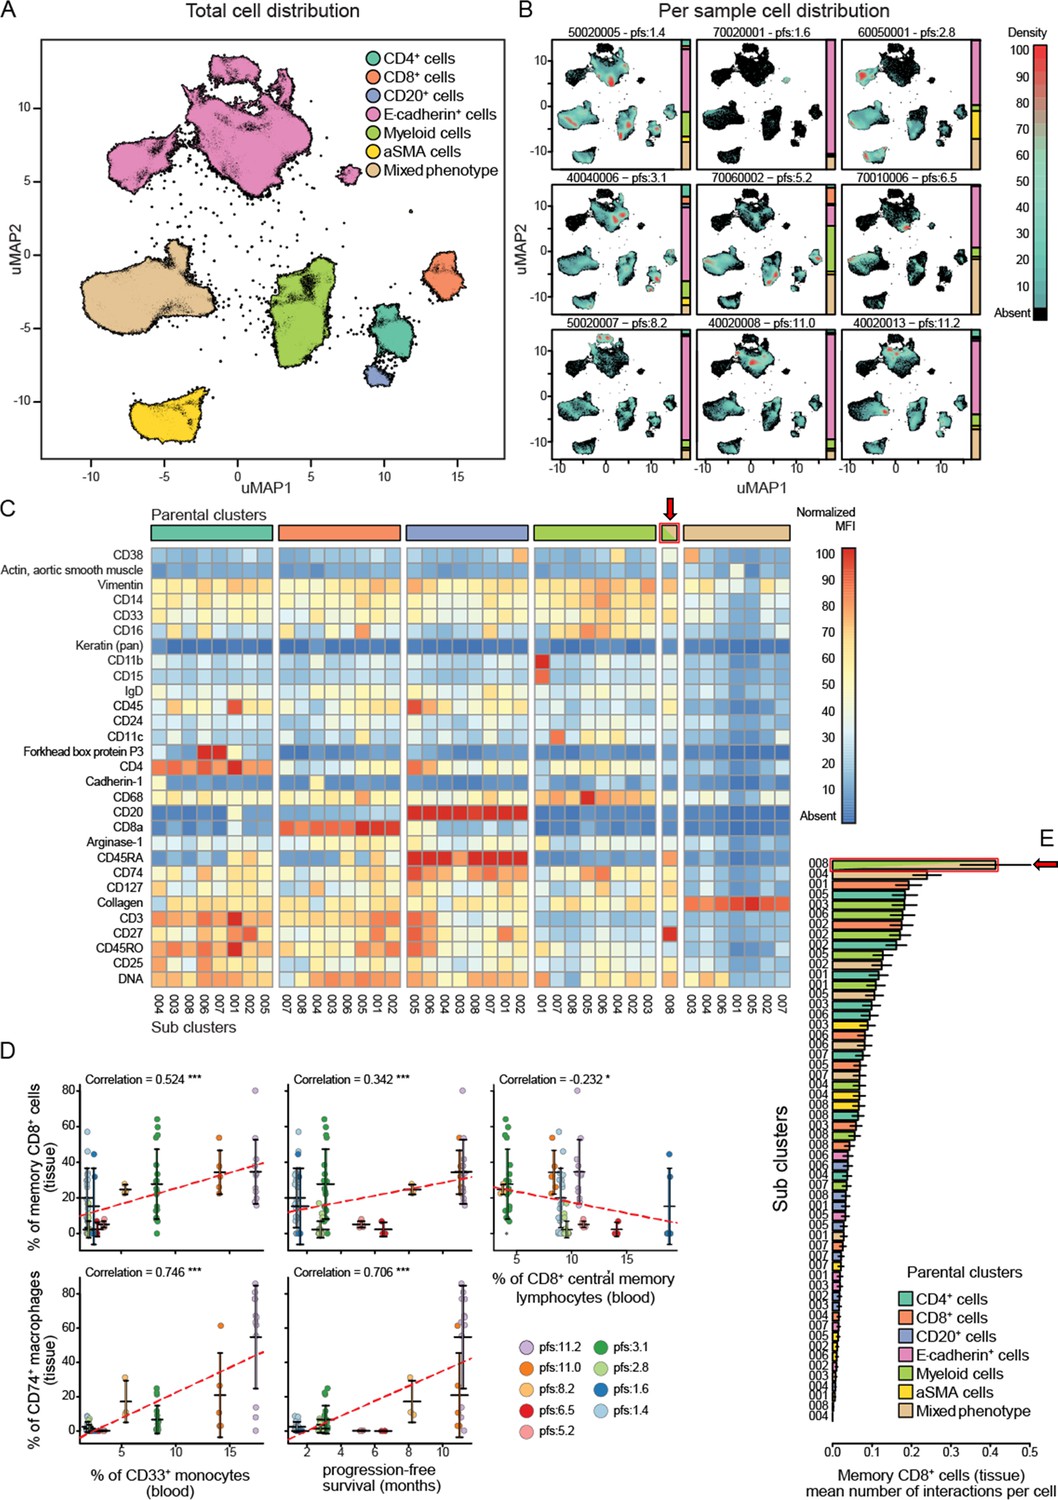
Imaging mass cytometry analysis on tissue sections from nine patients.
(A) Uniform manifold approximation and projections (UMAP) of the segmented cells from the combined patient sections showing their distribution across the superpopulations. (B) Relative abundance of the cells across the patient samples arranged in increasing order of progression-free survival (PFS). (C) Marker expression pattern across each of the clustered subpopulations. (D) Correlations between peripheral PBMC populations and tissue immune populations or between tissue immune populations and PFS. (E) Average number of interactions between the CD8+ tissue resident memory T cells and each of the clustered subpopulations. Arrow indicates the population of tissue macrophage that corresponds to peripheral CD33+CD14+monocyte.
Figure 6—figure supplement 1
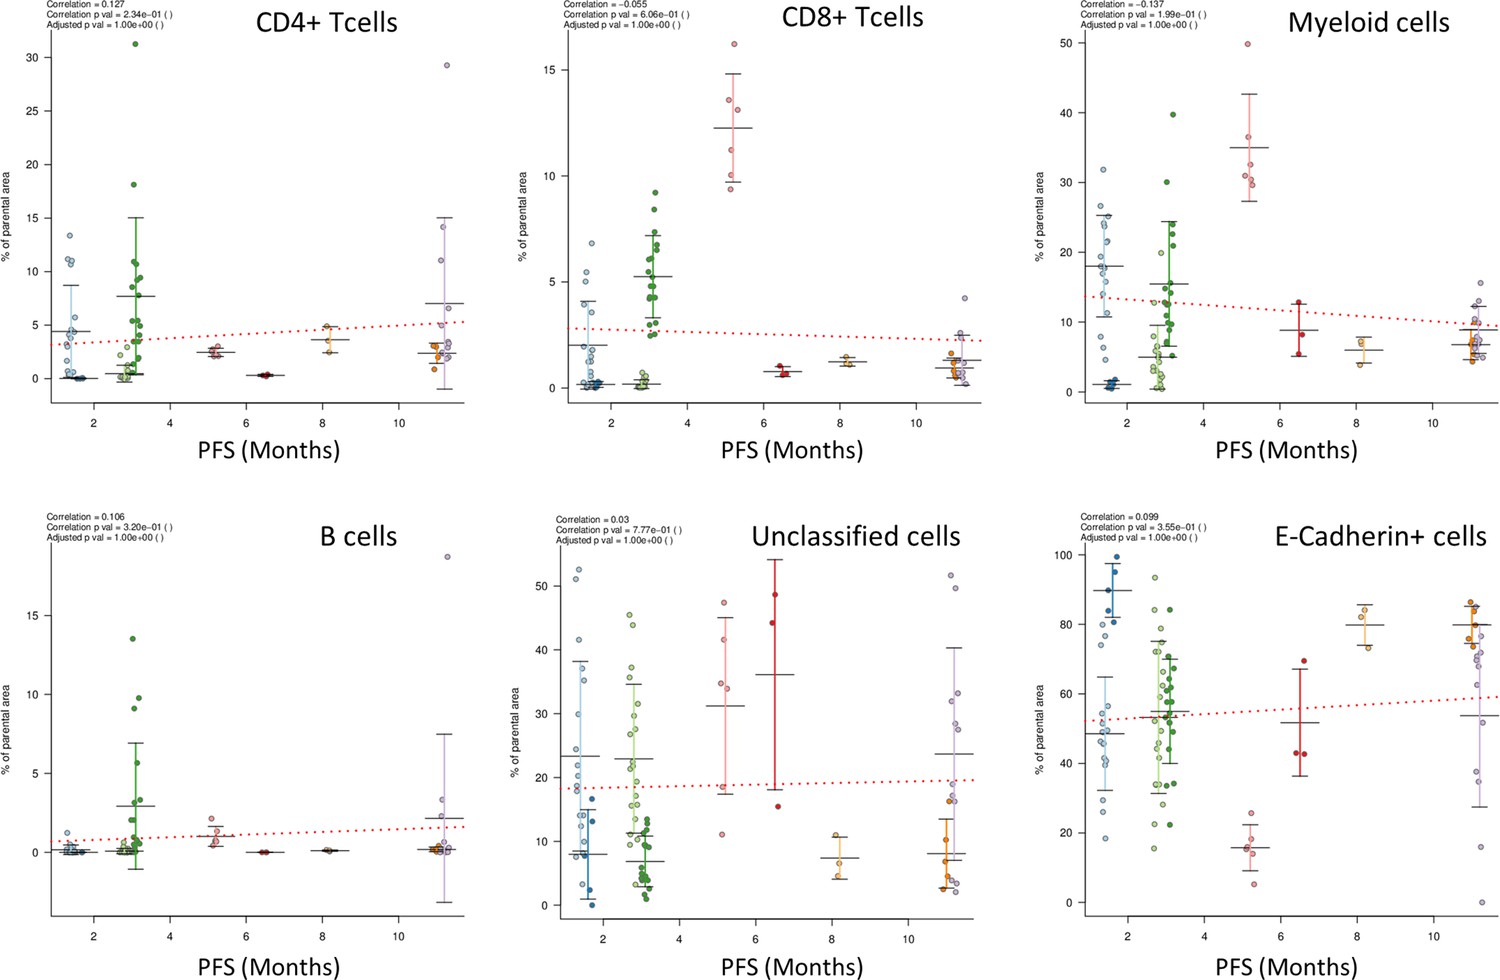
Correlations of the clustered superpopulations with progression-free survival (PFS).
Additional files
-
Supplementary file 1
Demographic and laboratory-based values of patients in the discovery and validation cohorts, and a comparison of the discovery cohort to the whole parent trial.
- https://cdn.elifesciences.org/articles/73288/elife-73288-supp1-v2.xlsx
-
Supplementary file 2
List of covariates for Bayesian multivariate analysis.
Twenty-nine laboratory-based covariates were used (obtained at baseline and after one cycle of treatment), and combined with 13 baseline clinical covariates.
- https://cdn.elifesciences.org/articles/73288/elife-73288-supp2-v2.xlsx
-
Supplementary file 3
Demographic and laboratory-based values of patients in the discovery cohort separated by arm of treatment on trial (placebo vs. patritumab).
- https://cdn.elifesciences.org/articles/73288/elife-73288-supp3-v2.csv
-
Supplementary file 4
List of antibodies used in T cell panel and B cell-monocyte panel for analyses of immune cell populations by flow cytometry in the discovery cohort.
Antibodies were purchased from BD Biosciences and BioLegend as indicated.
- https://cdn.elifesciences.org/articles/73288/elife-73288-supp4-v2.xlsx
-
Supplementary file 5
List of antibodies used in T cell panel and B cell-monocyte panel for analyses of immune cell populations by flow cytometry in the validation cohort.
Antibodies were purchased from BD Biosciences and BioLegend as indicated.
- https://cdn.elifesciences.org/articles/73288/elife-73288-supp5-v2.xlsx
-
Supplementary file 6
List of antibodies used in mass cytometry (CyToF) imaging analyses for definition of immune cell subpopulations in tissue.
- https://cdn.elifesciences.org/articles/73288/elife-73288-supp6-v2.xlsx
-
Supplementary file 7
Risk score signature equations for use with raw covariate values, with missing data imputed with the study mean.
These equations were used to calculate the risk score for each patient.
- https://cdn.elifesciences.org/articles/73288/elife-73288-supp7-v2.txt
-
Transparent reporting form
- https://cdn.elifesciences.org/articles/73288/elife-73288-transrepform1-v2.docx
Download links
A two-part list of links to download the article, or parts of the article, in various formats.
Downloads (link to download the article as PDF)
Open citations (links to open the citations from this article in various online reference manager services)
Cite this article (links to download the citations from this article in formats compatible with various reference manager tools)
Predicting progression-free survival after systemic therapy in advanced head and neck cancer: Bayesian regression and model development
eLife 11:e73288.
https://doi.org/10.7554/eLife.73288


