A test of the pioneer factor hypothesis using ectopic liver gene activation
- Edison Center for Genome Sciences and Systems Biology, Washington University in St. Louis, United States
- Department of Genetics, Washington University in St. Louis, United States
- Medical Scientist Training Program, Washington University in St. Louis, United States
Figures
Figure 1 with 2 supplements
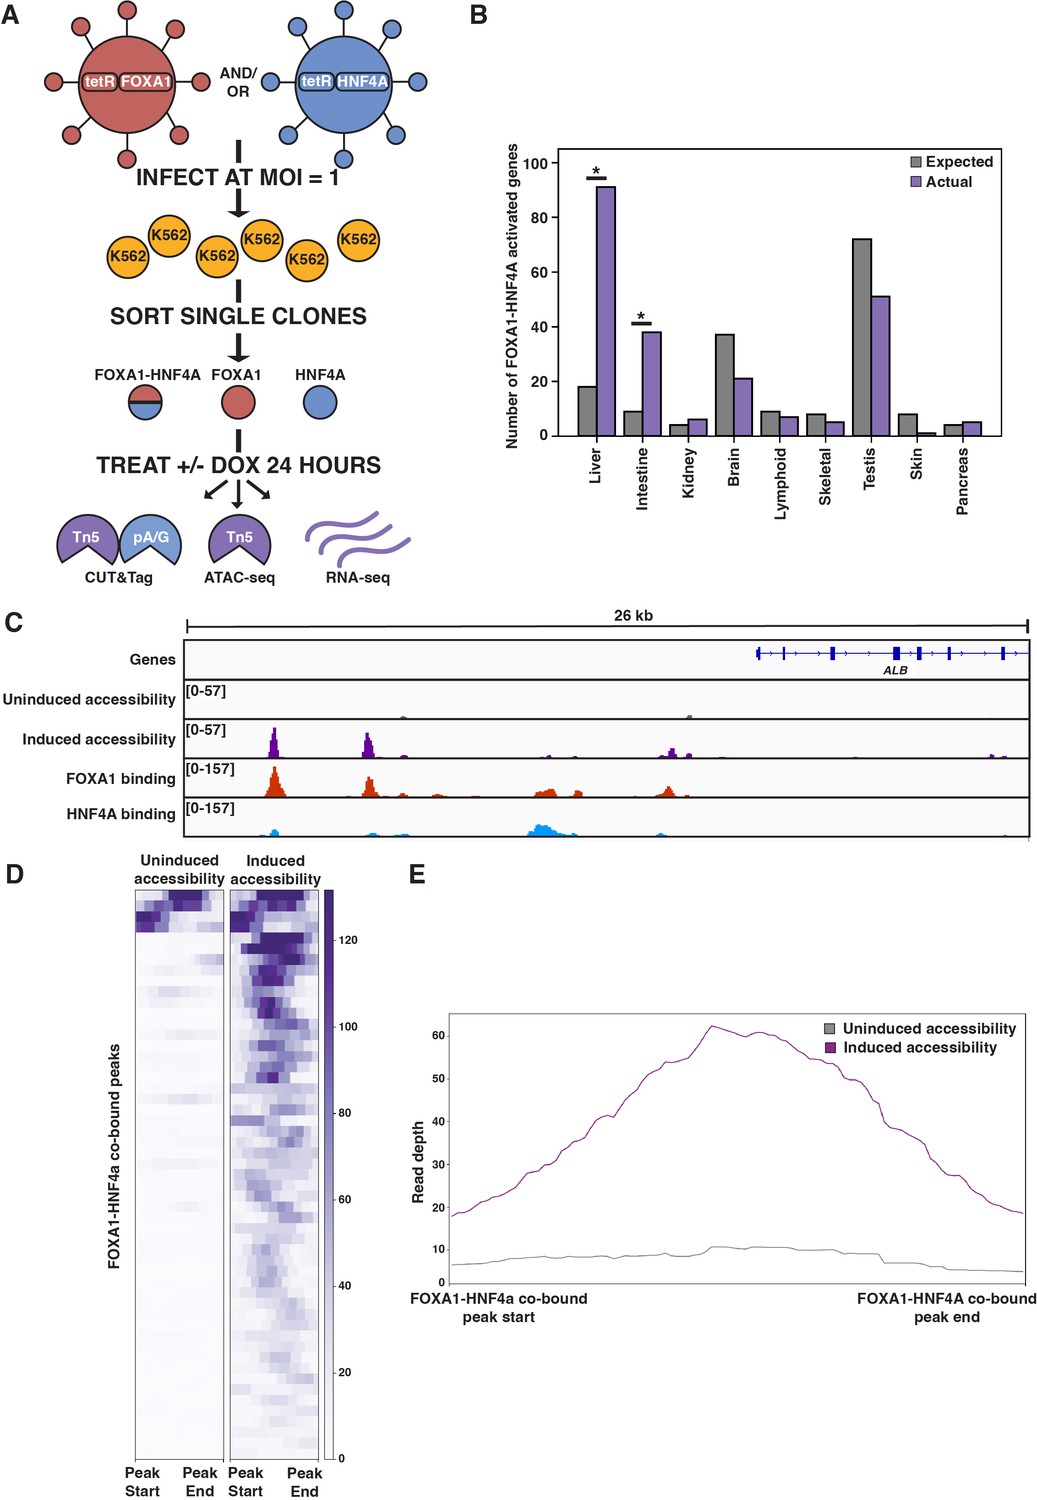
FOXA1-HNF4A pioneers liver-specific loci in K562 cells.
(A) Schematic of experimental design to infect K562 cells with FOXA1- or HNF4A-lentivirus and then perform functional assays on dox-induced cells. In CUT&Tag, a protein A-protein G fusion (pA/G) increases the binding spectrum for Fc-binding and allows Tn5 recruitment to antibody-labeled transcription factor (TF) binding sites. In ATAC-seq, Tn5 homes to any accessible site. And in RNA-seq, polyA RNA is captured and sequenced. (B) The number of tissue-specific genes predicted from the hypergeometric distribution to be activated by FOXA1-HNF4A compared to the number actually activated. Both liver- (p<10–38) and intestinal enrichment (p<10–13) are significant. There are 242 total liver-enriched genes and 122 total intestine-enriched genes. (C) Genome browser view of a representative liver-specific locus (ALB) in FOXA1-HNF4A clonal line that shows uninduced and induced accessibility, FOXA1 binding, and HNF4A binding. (D) Heatmap showing uninduced and induced accessibility at all FOXA1-HNF4A co-bound sites within 50 kb of each FOXA1-HNF4A-activated liver-specific gene (n = 53). (E) Meta plot showing average signal across each site from (D).
Figure 1—figure supplement 1
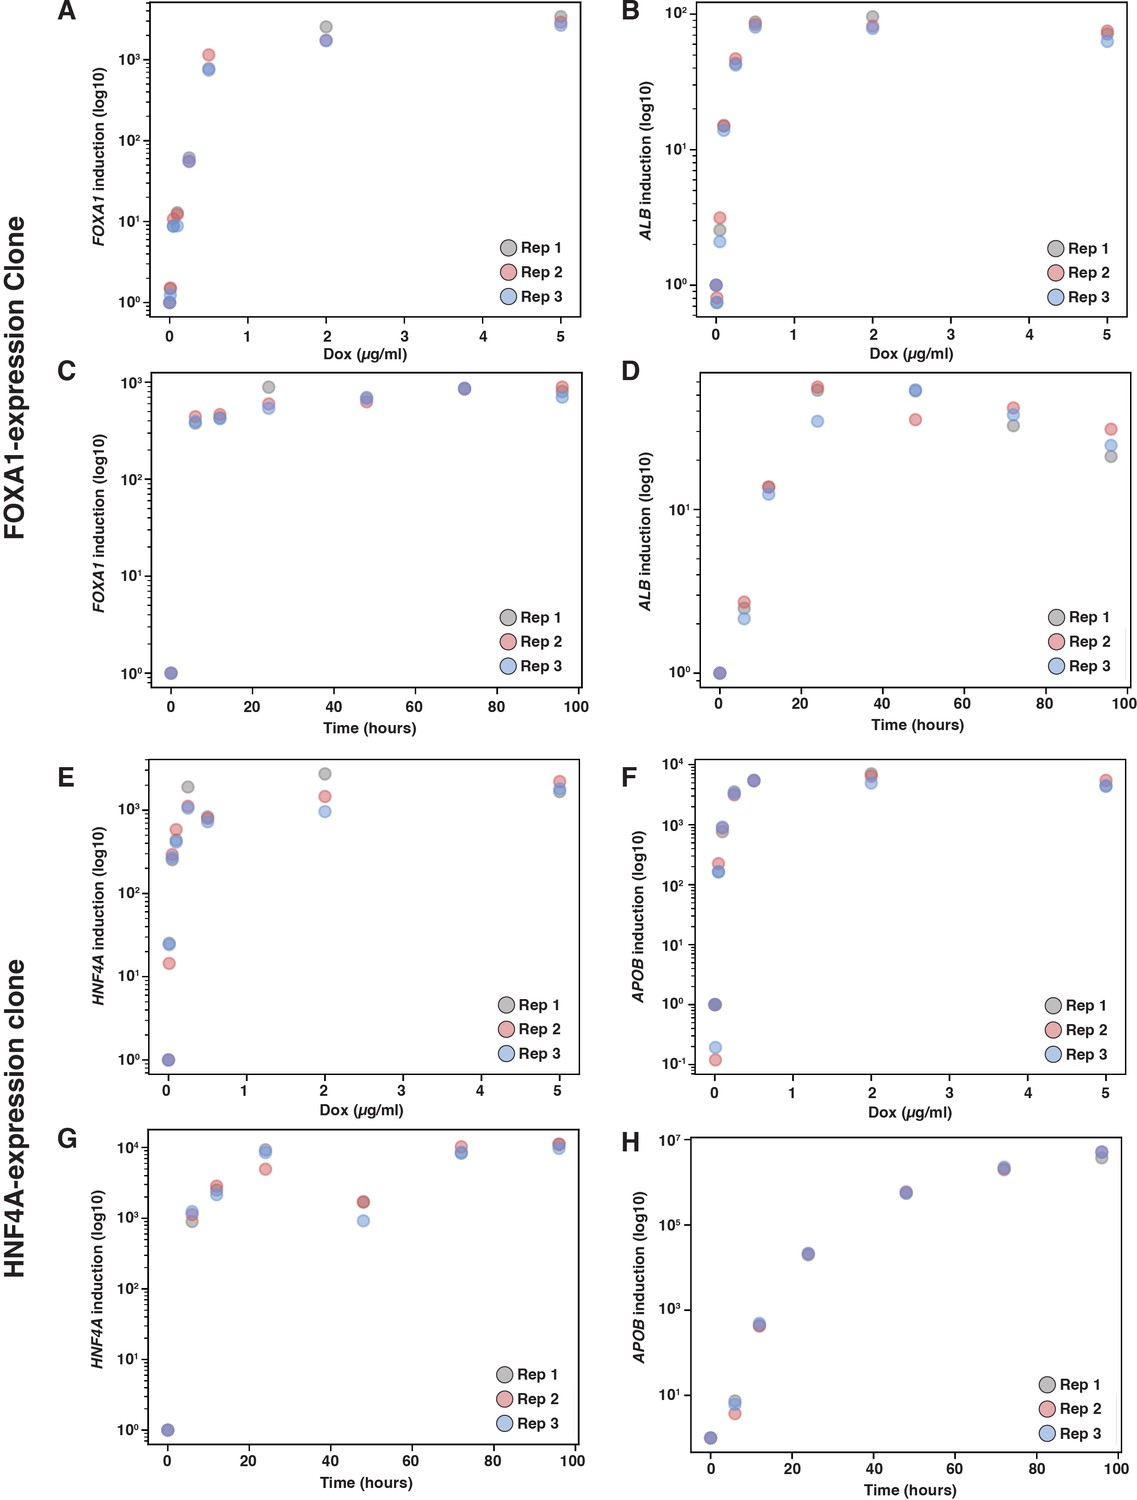
Titration of doxycycline concentration and treatment time for transcription factor (TF) and target gene induction.
qPCR measurements made from RNA extracted from either the FOXA1 clonal line (A–D) or the HNF4A clonal line (E–H) that was treated with either increasing doxycycline concentrations or longer time periods. Expression is displayed as log10 fold induction over either 0 µg/ml doxycycline control (for concentration titration) or time 0 (for time titration). Each sample primer was normalized to the HPRT housekeeping gene. Doxycycline concentration titration measurements were made at 0, 0.01, 0.05, 0.1, 0.5, 2, and 5 µg/ml. Doxycycline treatment time measurements were made at 0, 6, 12, 24, 48, 72, and 96 hr.
Figure 1—figure supplement 2
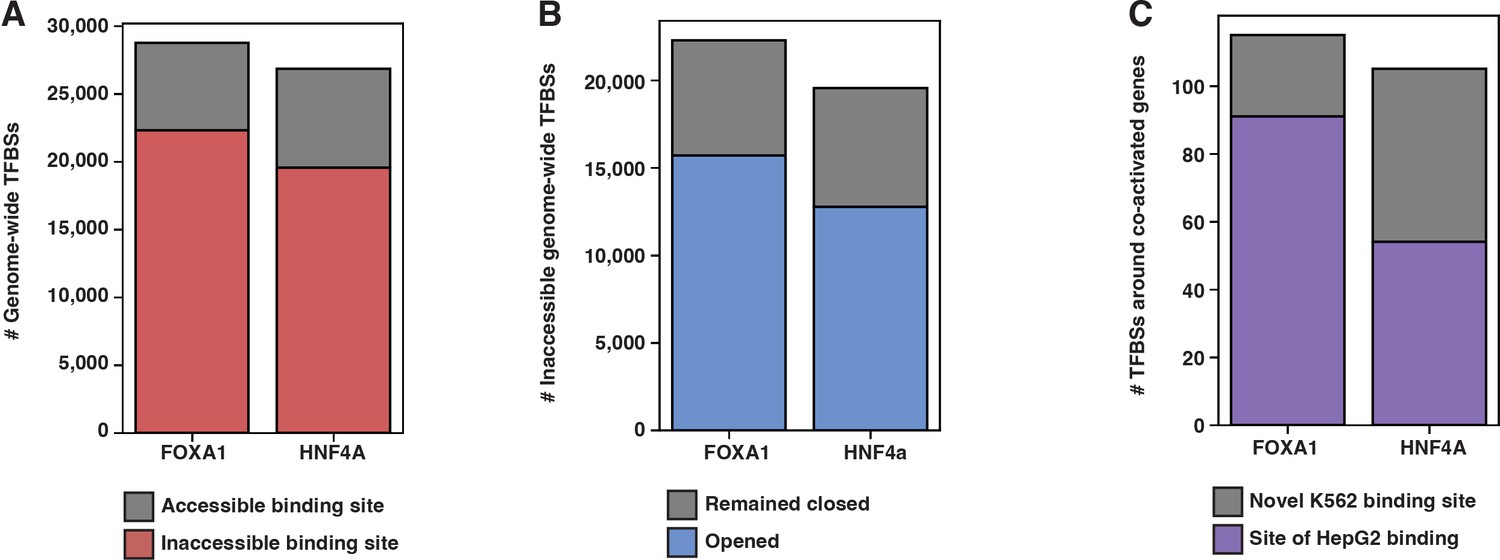
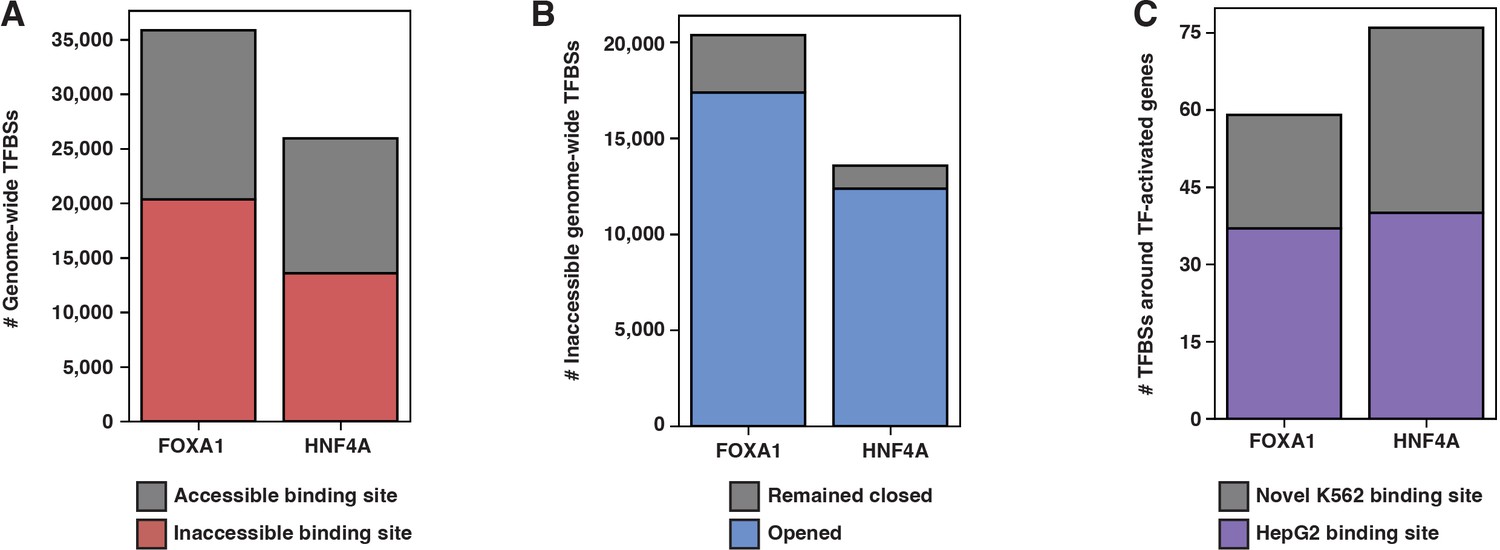
Characterization of FOXA1 and HNF4A binding patterns in FOXA1-HNF4A clone.
(A) The number of genome-wide FOXA1 or HNF4A transcription factor binding sites (TFBS) in the induced (+dox) cells that overlap with an ATAC-seq peak in the uninduced (-dox) cells (‘accessible binding site’) or that do not overlap with an ATAC-seq peak in the uninduced (-dox) cells (‘inaccessible binding site’). (B) The number of inaccessible binding sites from (A) that overlap with an ATAC-seq peak in the induced (+dox) cells (‘opened’) or that do not overlap with an ATAC-seq peak (‘remained closed’). (C) The number of FOXA1 or HNF4A binding sites within 50 kb of each FOXA1-HNF4A co-activated gene characterized as either a ‘HepG2 binding site,’ where the TFBS overlaps a TFBS of FOXA1 or HNF4A in HepG2 liver cells, or as a ‘Novel K562 binding site,’ where the TFBS does not overlap with a HepG2 binding site.
Figure 2
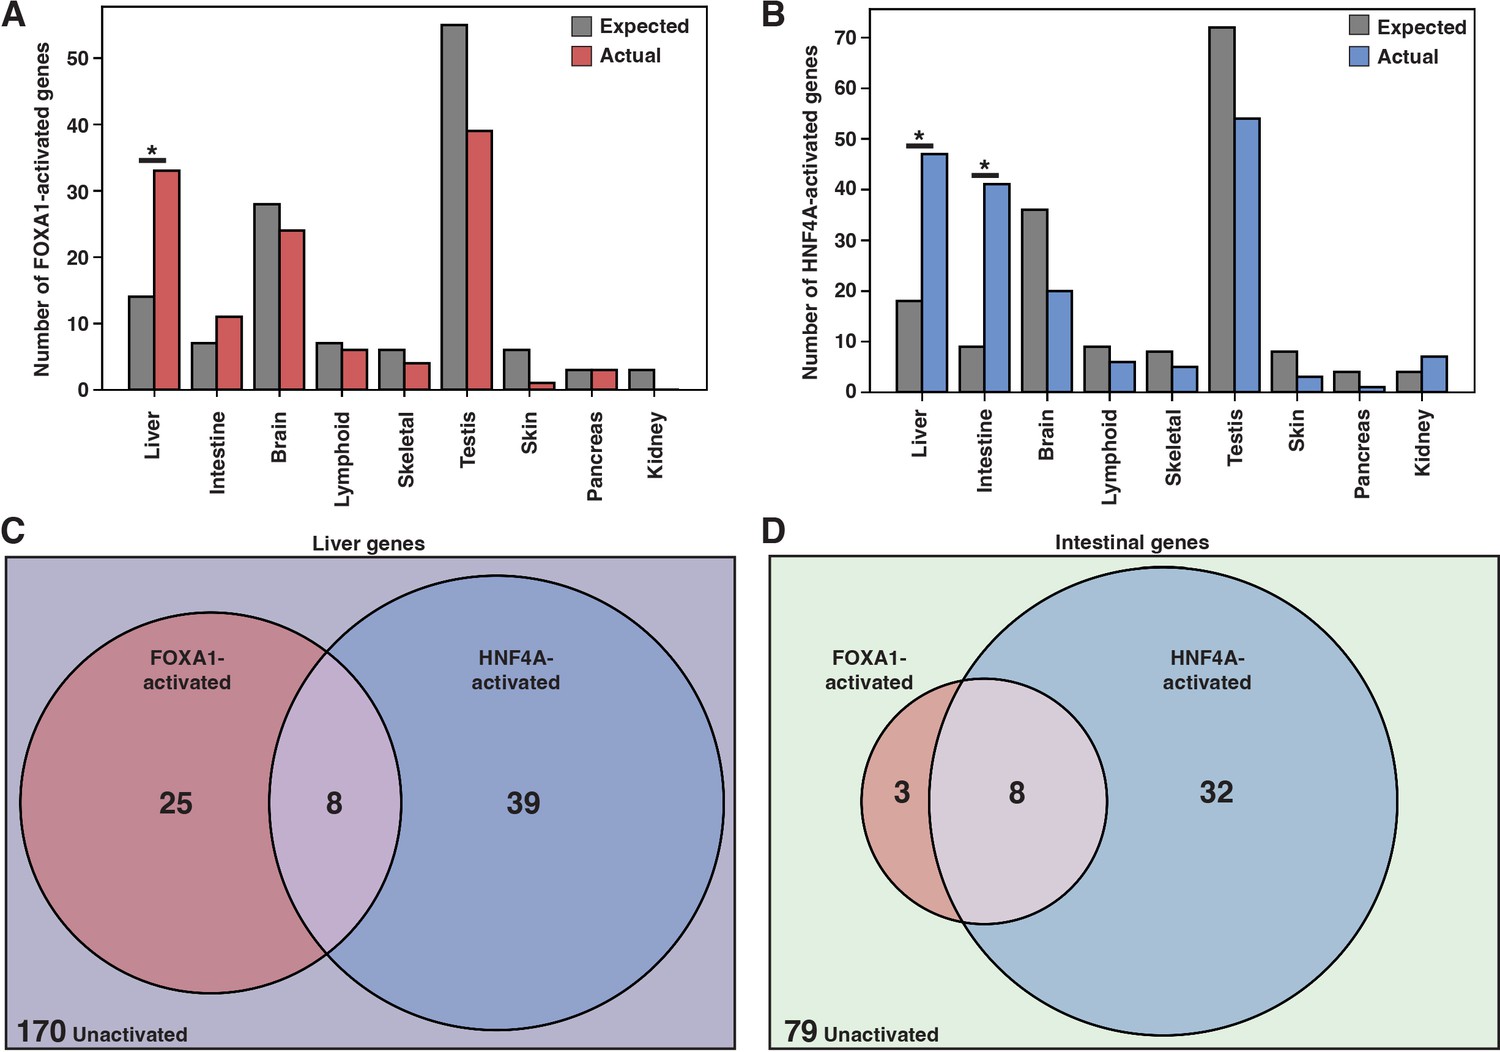
FOXA1 and HNF4A activate independent liver- and intestine-specific genes.
(A) The number of tissue-specific genes predicted from the hypergeometric distribution to be activated by FOXA1 compared to the number actually activated. Liver enrichment (p<10–4) is significant. There are 242 total liver-enriched genes. (B) The number of tissue-specific genes predicted from the hypergeometric distribution to be activated by HNF4A compared to the number actually activated. Liver- (p<10–8) and intestine enrichment (p<10–15) are significant. There are 242 total liver-enriched genes and 122 total intestine-enriched genes. (C) 242 liver genes characterized as activated by Foxa1, HNF4A, both, or neither. (D) 122 intestine genes characterized as activated by FOXA1, HNF4A, both, or neither.
Figure 3 with 4 supplements

Both FOXA1 and HNF4A can pioneer liver-specific loci.
(A) Genome browser view of a representative liver-specific locus (ARG1) in FOXA1 clonal line showing uninduced and induced accessibility and FOXA1 binding. (B) Genome browser view of a representative liver-specific locus (APOC3) in HNF4A clonal line showing uninduced and induced accessibility and HNF4A binding. (C) Heatmap of uninduced and induced accessibility at all FOXA1 binding sites within 50 kb of each FOXA1-activated liver-specific genes (n = 59). (D) Heatmap of uninduced and induced accessibility at all HNF4A binding sites within 50 kb of each HNF4A-activated liver-specific genes (n = 76). (E) Meta plot showing average signal across each site from (C). (F) Meta plot showing average signal across each site from (D). (G) Human FOXA1 and HNF4A sequence logo from JASPAR. (H) FOXA1 or HNF4A motif count within 500 bp centered upon FOXA1 or HNF4A binding sites within 50 kb of each FOXA1- or HNF4A-activated liver-specific genes, respectively. Motifs were called with FIMO using 1e-3 a p-value threshold. For each boxplot, the center line represents the median, the box represents the first to third quartiles, and the whiskers represent any points within 1.5× the interquartile range.
Figure 3—figure supplement 1
Characterization of FOXA1 and HNF4A binding patterns in FOXA1 or HNF4A individual clones.
(A) The number of genome-wide FOXA1 or HNF4A transcription factor binding sites (TFBS) in the induced (+dox) cells that overlap with an ATAC-seq peak in the uninduced (-dox) cells (‘aAccessible binding site’) or that do not overlap with an ATAC-seq peak in the uninduced (-dox) cells (‘inaccessible binding site’). (B) The number of inaccessible binding sites from (A) that overlap with an ATAC-seq peak in the induced (+dox) cells (‘opened’) or that do not overlap with an ATAC-seq peak (‘remained closed’). (C) The number of FOXA1 or HNF4A binding sites within 50 kb of each FOXA1- or HNF4A-activated gene characterized as either a ‘HepG2 binding site,’ where the TFBS overlaps a TFBS of FOXA1 or HNF4A in HepG2 liver cells, or as a ‘Novel K562 binding site,’ where the TFBS does not overlap with a HepG2 binding site.
Figure 3—figure supplement 2
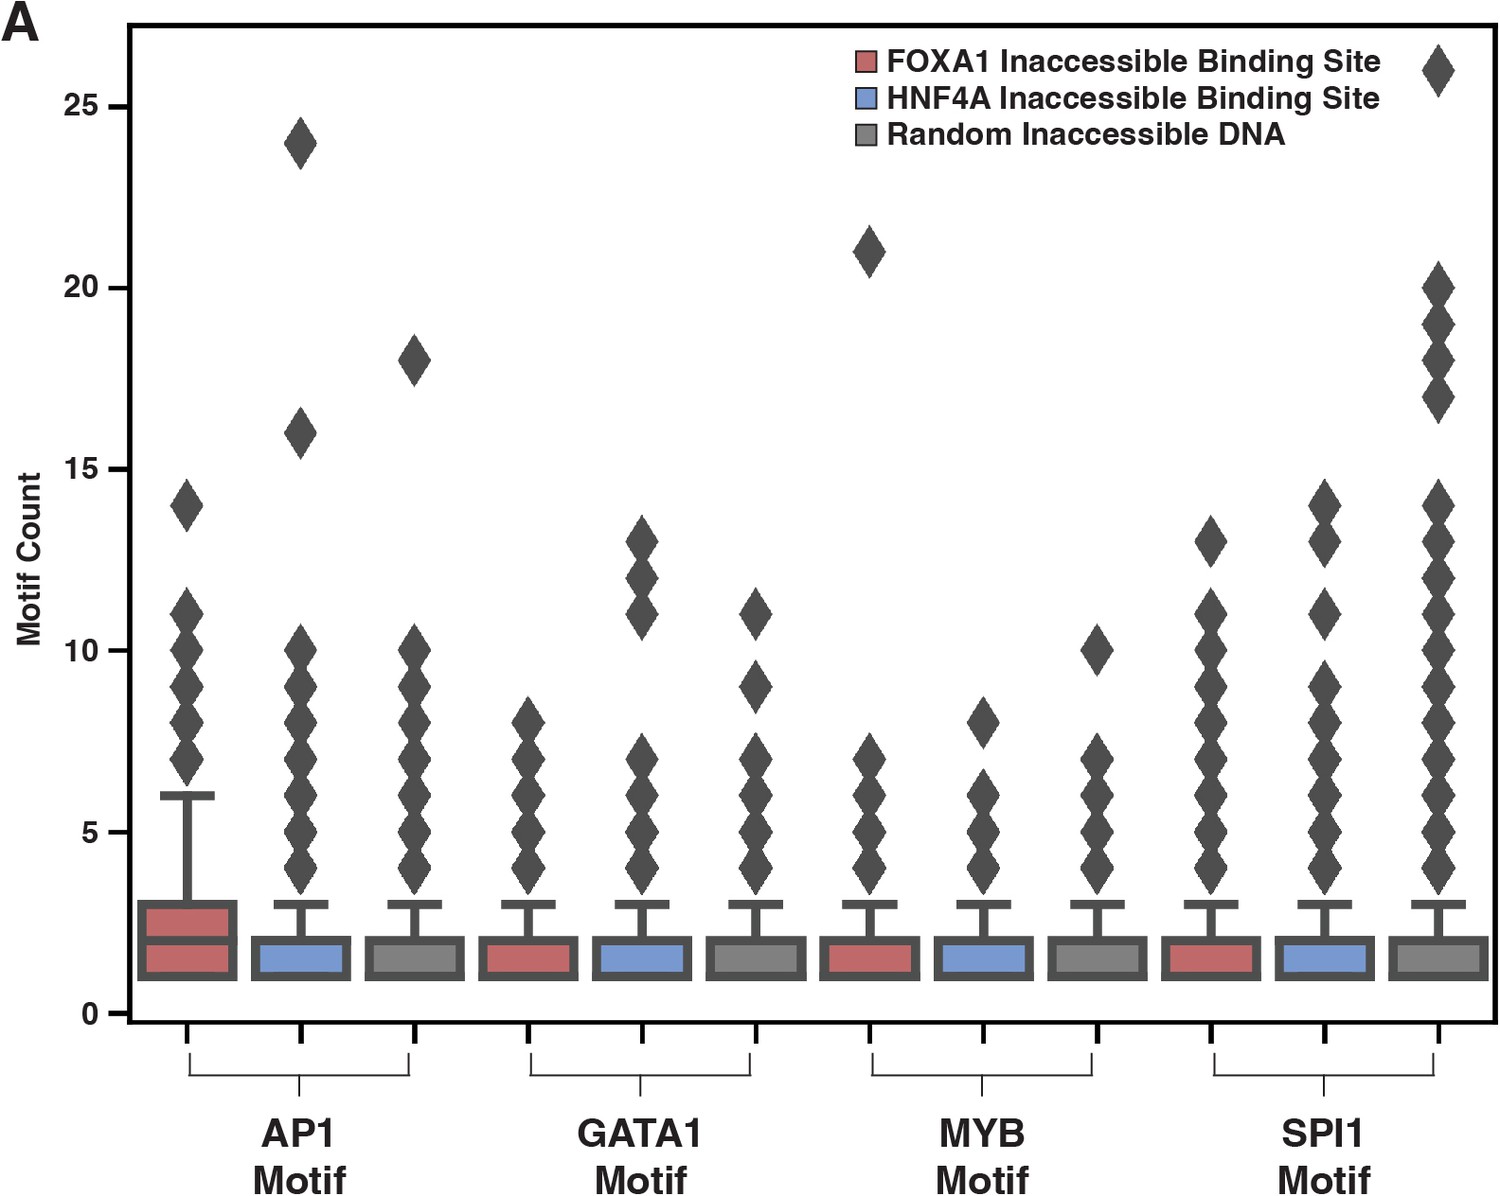
K562 transcription factor (TF) motif content in binding sites.
(A) FIMO scans at p-value threshold 1e-3 for four most common proposed K562 pioneer factors (PFs) in either FoxA1 inaccessible binding sites (red), Hnf4a inaccessible binding sites (blue), or random equally lengthed binding sites (gray).
Figure 3—figure supplement 3
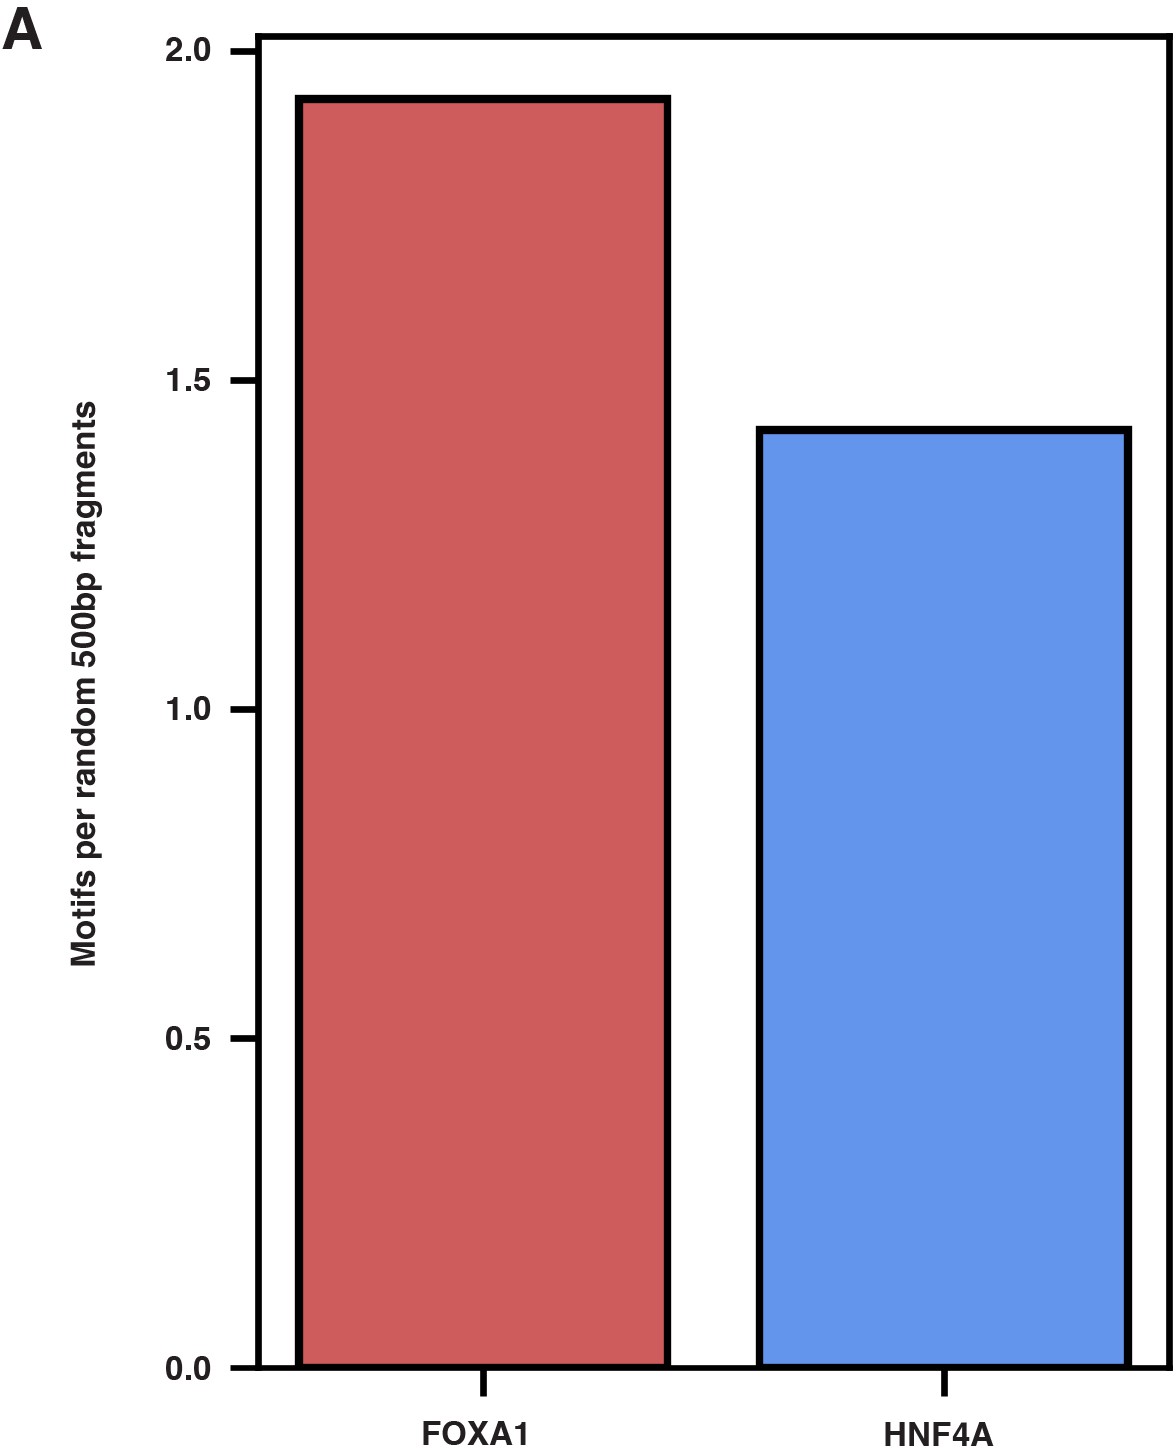
FOXA1 and HNF4A motif scanning.
(A) 1000 random 200 bp fragments were generated using BEDTools and then scanned for FOXA1 and HNF4A motifs with FIMO using 1e-3 a p-value threshold. Total motif count was divided by the number of non-N-containing random sequences (924) to identify motifs per random 200 bp fragment.
Figure 3—figure supplement 4
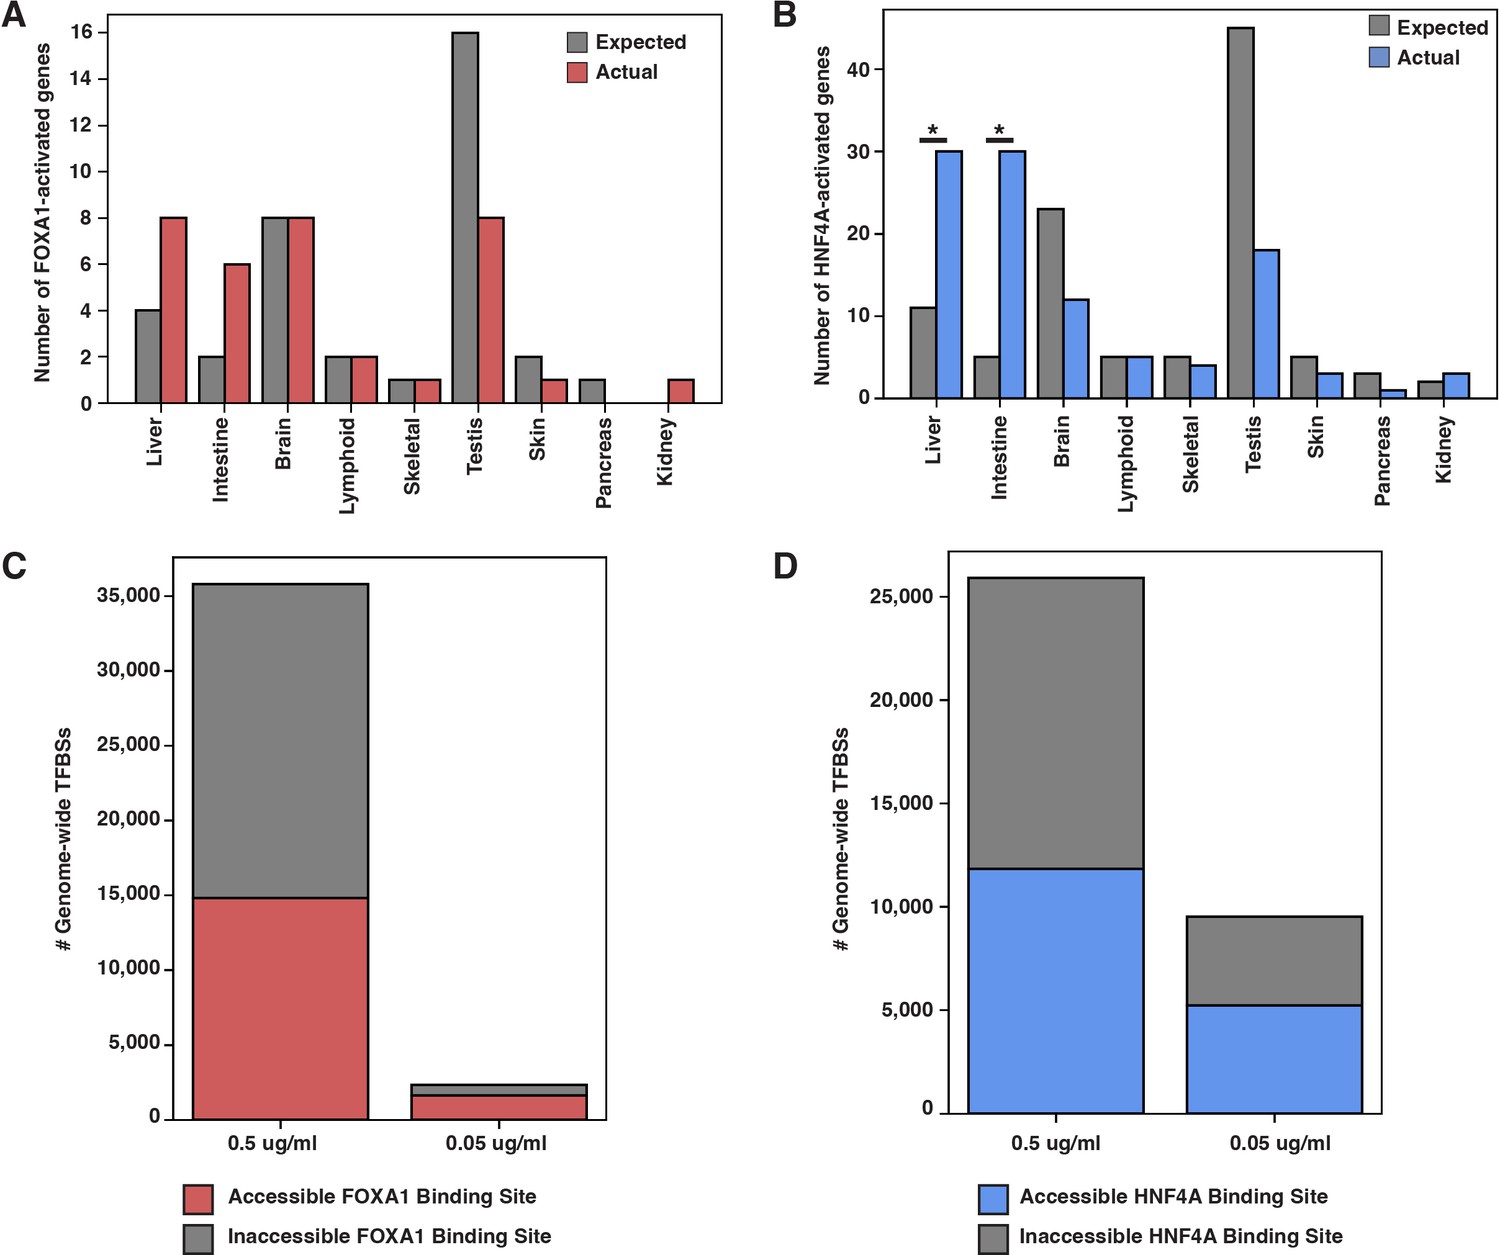
Expression and binding at lower doxycycline induction.
(A) The number of tissue-specific genes predicted from the hypergeometric distribution to be activated by FOXA1 at a lower doxycycline concentration (0.05 µg/ml) compared to the number actually activated. There are 242 total liver-enriched genes. (B) The number of tissue-specific genes predicted from the hypergeometric distribution to be activated by HNF4A at a lower doxycycline concentration (0.05 µg/ml) compared to the number actually activated. Liver- (p<10–5) and intestine enrichment (p<10–14) are significant. There are 242 total liver-enriched genes and 122 total intestine-enriched genes. (C, D) Genome-wide FOXA1 (C) or HNF4A (D) binding sites classified as either events that occurred at sites that were accessible or inaccessible in the uninduced (-dox) state at 0.5 and 0.05 µg/ml doxycycline induction.
Figure 4 with 1 supplement

FOXA1 and HNF4A both pioneer and cooperative at liver-specific sites.
(A) Venn diagram of all liver genes categorized as either activated by FOXA1, HNF4A, FOXA1-HNF4A, some combination, or by none of the three cocktails. (B) Genome browser view of a representative liver-specific locus (AMDHD1) showing examples of a co-bound site that is ‘FOXA1 pioneered’ (FP), ‘HNF4A pioneered’ (HP), and ‘cooperatively bound’ (CB). The first two tracks are FOXA1 and HNF4A binding in the FOXA1-HNF4A co-expression clone, and the last two tracks are FOXA1 and HNF4A binding in their individual expression clones. (C) List of the 31 liver genes that are only activated by FOXA1-HNF4A co-expression. The columns indicate how many co-bound FP, HP, or CB peaks exist within 100 kb of the gene. (D) Venn diagram of all genome-wide co-bound peaks categorized as either bound by FOXA1 individually (FP), HNF4A individually (HP), by both, or by neither (CB). (E) Overlap of FP, HP, and CB sites from (D) with ChromHMM annotations showing the fraction of each co-binding site type in each chromatin region.
Figure 4—figure supplement 1
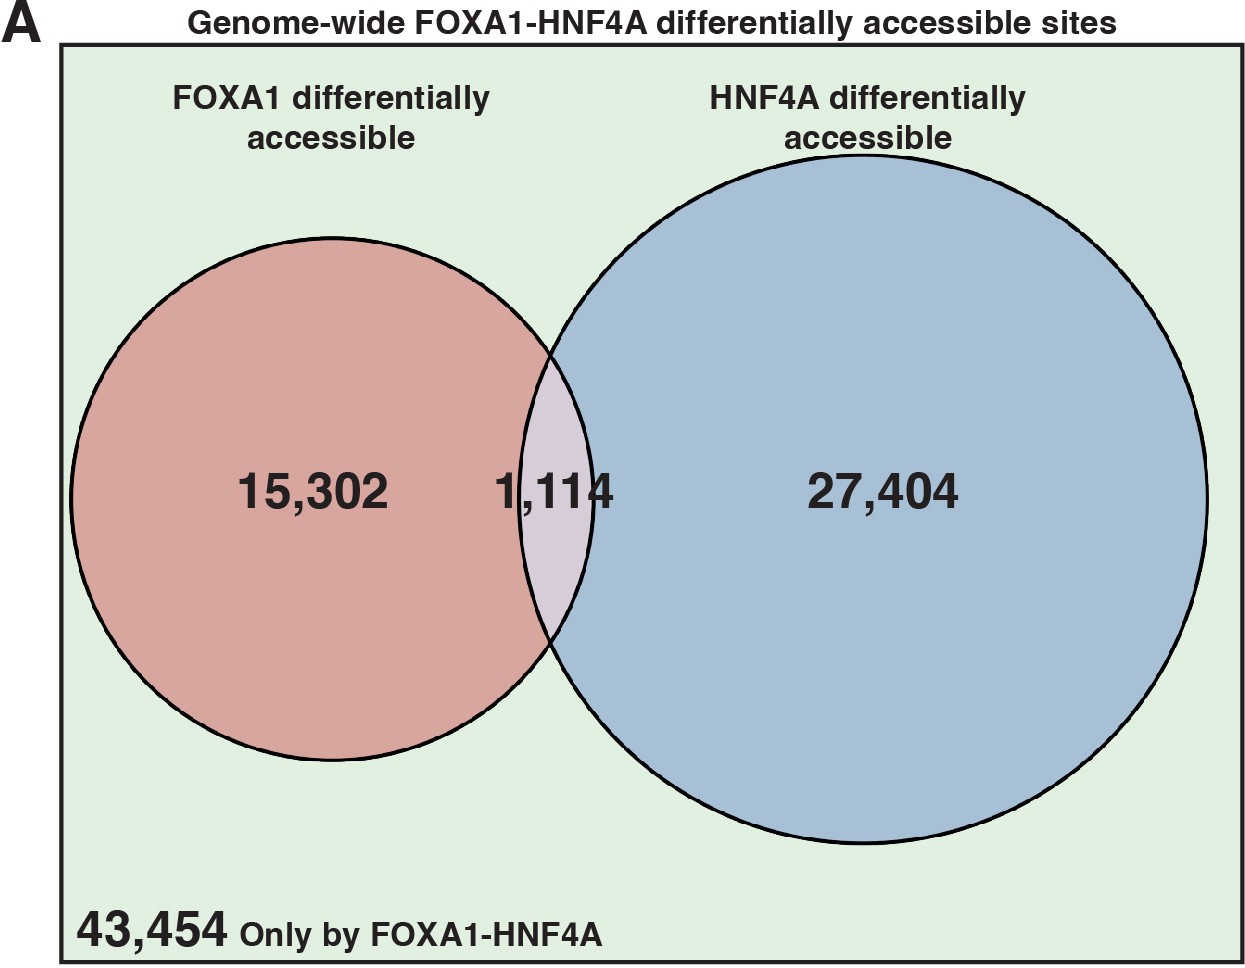
Characterization of FOXA1-HNF4A differential accessibility.
(A) Venn diagram of all FOXA1-HNF4A-induced differentially accessible peaks categorized by whether the peak was also induced in the FOXA1 clone, HNF4A clone, neither, or both.
Figure 5
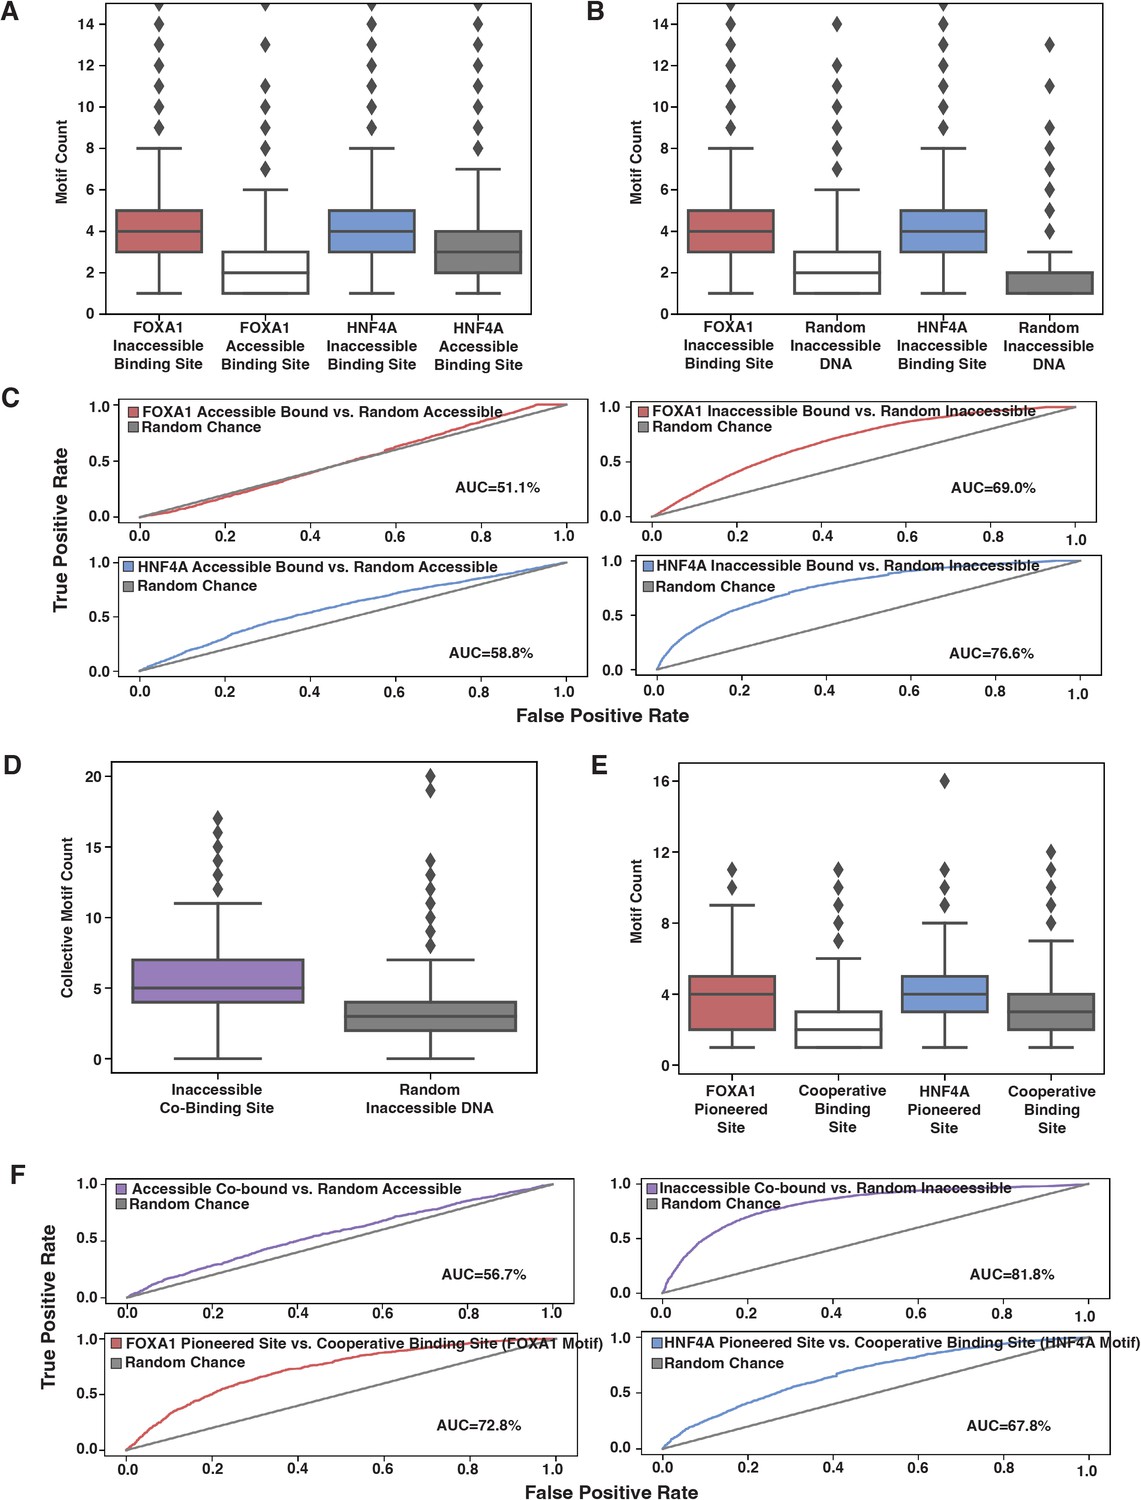
Affinity model predicts binding events.
(A) FOXA1 or HNF4A motif count at all genomic occurrences of the respective transcription factor’s (TF’s) accessible or inaccessible binding sites. (B) FOXA1 or HNF4A motif count in genome-wide inaccessible binding sites versus length-matched random inaccessible DNA sequences. (C) Receiver operating characteristic (ROC) curves for predictive power of using sequence motif content to predict accessible (left panels) or inaccessible (right panels) binding sites from random sequence. (D) Total FOXA1 and HNF4A motif count at all genomic occurrences of inaccessible co-binding versus length-matched random inaccessible DNA sequences. (E) FOXA1 or HNF4A motif count in respective FOXA1 or HNF4A pioneered sites versus in cooperative binding sites (where neither TF bound individually). (F) ROC curves for predictive power of using sequence motif content to predict accessible or inaccessible co-binding events from random sequence (top panels) or to predict FOXA1 or HNF4A pioneered events from cooperative binding events. All FIMO scans used 1e-3 as p-value threshold and were conducted on 500 bp of sequence centered upon the binding site.
Tables
Key resources table
| Reagent type (species) or resource | Designation | Source or reference | Identifiers | Additional information |
|---|---|---|---|---|
| Strain, strain background (Homo sapiens) | FOXA1 | K562 | Cat# CCL-243 (ATCC); RRID:CVCL_0004 | Infected with pINDUCER21 lentiviral vector (Meerbrey et al., 2011) (Addgene#46948) carrying FOXA1 ORF (Addgene#120438) |
| Strain, strain background (H. sapiens) | HNF4A | K562 | Cat# CCL-243 (ATCC); RRID:CVCL_0004 | Infected with pINDUCER21 lentiviral vector (Meerbrey et al., 2011) (Addgene#46948) carrying HNF4A ORF (Addgene#120450) |
| Strain, strain background (H. sapiens) | FOXA1-HNF4A | K562 | Cat# CCL-243 (ATCC); RRID:CVCL_0004 | Infected with pINDUCER21 lentiviral vector (Meerbrey et al., 2011) (Addgene#46948) carrying FOXA1 ORF and then HNF4A ORF |
| Chemical compound, drug | Doxycycline | Sigma | Cat# D9891-1G | Treated at 0.5 and 0.05 µg/ml |
| Chemical compound, drug | Polybrene | Sigma | Cat# TR1003G | Treated at 10 µg/ml |
| Commercial assay or kit | PureLink RNA Mini | Invitrogen | Cat# 12183020 | |
| Commercial assay or kit | PureLink DNase | Invitrogen | Cat# 12185010 | |
| Commercial assay or kit | ReadyScript cDNA Synthesis Mix | Sigma | Cat# RDRT-100RXN | |
| Commercial assay or kit | SYBR Green PCR Master Mix | Applied Biosystems | Cat# 4301955 | |
| Commercial assay or kit | NEBNext Ultra II Directional RNA Library Prep Kit | NEB | Cat# E7765S | |
| Commercial assay or kit | AMPure XP beads | Beckman Coulter | Cat# A63880 | |
| Commercial assay or kit | pAG-TN5 | EpiCypher | Cat# 15-1017 | |
| Commercial assay or kit | Concanavalin A paramagnetic beads | EpiCypher | Cat# 21-1401 | |
| Commercial assay or kit | HiFi DNA assembly | NEB | Cat# E2621L | |
| Antibody | Anti-FOXA1 (Rabbit monoclonal) | Cell Signaling | Cat# 53528; RRID:AB_2799438 | (1:100) |
| Antibody | Anti-HNF4A (mouse monoclonal) | Invitrogen | Cat# MA1-199; RRID:AB_2633309 | (1:100) |
| Antibody | Anti-H3K4me3 (Rabbit polyclonal) | EpiCypher | Cat# 13-0041 | (1:50) |
| Antibody | Anti-rabbit (goat polyclonal) | EpiCypher | Cat# 13-0047 | (1:100) |
| Antibody | Anti-mouse (goat polyclonal) | EpiCypher | Cat# 13-0048 | (1:100) |
| Software, algorithm | Salmon | https://combine-lab.github.io/salmon/getting_started/ | https://doi.org/10.1038/nmeth.4197; RRID:SCR_017036 | |
| Software, algorithm | DESeq2 | https://bioconductor.org/packages/release/bioc/html/DESeq2.html | https://doi.org/10.1186/s13059-014-0550-8; RRID:SCR_015687 | |
| Software, algorithm | deepTools2 | https://deeptools.readthedocs.io/en/develop/ | https://doi.org/10.1093/nar/gkw257; RRID:SCR_016366 | |
| Software, algorithm | bowtie2 | http://bowtie-bio.sourceforge.net/bowtie2/index.shtml | https://doi.org/10.1038/nmeth.1923; RRID:SCR_016368 | |
| Software, algorithm | MACS2 | https://pypi.org/project/MACS2/ | https://doi.org/10.1186/gb-2008-9-9-r137; RRID:SCR_013291 | |
| Software, algorithm | featureCounts | https://www.rdocumentation.org/packages/Rsubread/versions/1.22.2/topics/featureCounts | https://doi.org/10.1093/bioinformatics/btt656; RRID:SCR_012919 | |
| Software, algorithm | IDR | https://www.encodeproject.org/software/idr/ | https://doi.org/10.1214/11-AOAS466; RRID:SCR_017237 | |
| Software, algorithm | DiffBind | https://bioconductor.org/packages/release/bioc/html/DiffBind.html | https://doi.org/10.18129/B9.bioc.DiffBind; RRID:SCR_012918 | |
| Software, algorithm | BEDTools | https://bedtools.readthedocs.io/en/latest/ | https://doi.org/10.1093/bioinformatics/btq033; RRID:SCR_006646 | |
| Software, algorithm | STREME | https://meme-suite.org/meme/tools/streme | https://doi.org/10.1093/bioinformatics/btab203; RRID:SCR_001783 | |
| Software, algorithm | FIMO | https://meme-suite.org/meme/tools/fimo | https://doi.org/10.1093/bioinformatics/btr064; RRID:SCR_001783 |
Additional files
-
Supplementary file 1
FOXA1 gene ontology analysis.
Gene ontology terms, representative genes, and FDR values for liver-specific genes activated by FOXA1.
- https://cdn.elifesciences.org/articles/73358/elife-73358-supp1-v2.xlsx
-
Supplementary file 2
HNF4A gene ontology analysis.
Gene ontology terms, representative genes, and FDR values for liver-specific genes activated by HNF4A.
- https://cdn.elifesciences.org/articles/73358/elife-73358-supp2-v2.xlsx
-
Supplementary file 3
Primer sequences.
Primer sequences used for plasmid construction and qPCR analysis.
- https://cdn.elifesciences.org/articles/73358/elife-73358-supp3-v2.xlsx
-
Supplementary file 4
ATAC-sequencing quality summary statistics.
Sequencing statistics for each ATAC-sequencing run, including the read length, read count, peak count, and Fraction of Reads in Peaks (FRiP).
- https://cdn.elifesciences.org/articles/73358/elife-73358-supp4-v2.xlsx
-
Supplementary file 5
CUT&Tag sequencing quality summary statistics.
Sequencing statistics for each CUT&Tag run, including the read length, read count, peak count, and Fraction of Reads in Peaks (FRiP).
- https://cdn.elifesciences.org/articles/73358/elife-73358-supp5-v2.xlsx
-
Transparent reporting form
- https://cdn.elifesciences.org/articles/73358/elife-73358-transrepform1-v2.docx
Download links
A two-part list of links to download the article, or parts of the article, in various formats.
Downloads (link to download the article as PDF)
Open citations (links to open the citations from this article in various online reference manager services)
Cite this article (links to download the citations from this article in formats compatible with various reference manager tools)
A test of the pioneer factor hypothesis using ectopic liver gene activation
eLife 11:e73358.
https://doi.org/10.7554/eLife.73358


