Low-affinity integrin states have faster ligand-binding kinetics than the high-affinity state
- Program in Cellular and Molecular Medicine, Boston Children’s Hospital, United States
- Department of Biological Chemistry and Molecular Pharmacology and Department of Pediatrics, Harvard Medical School, United States
Figures
Figure 1
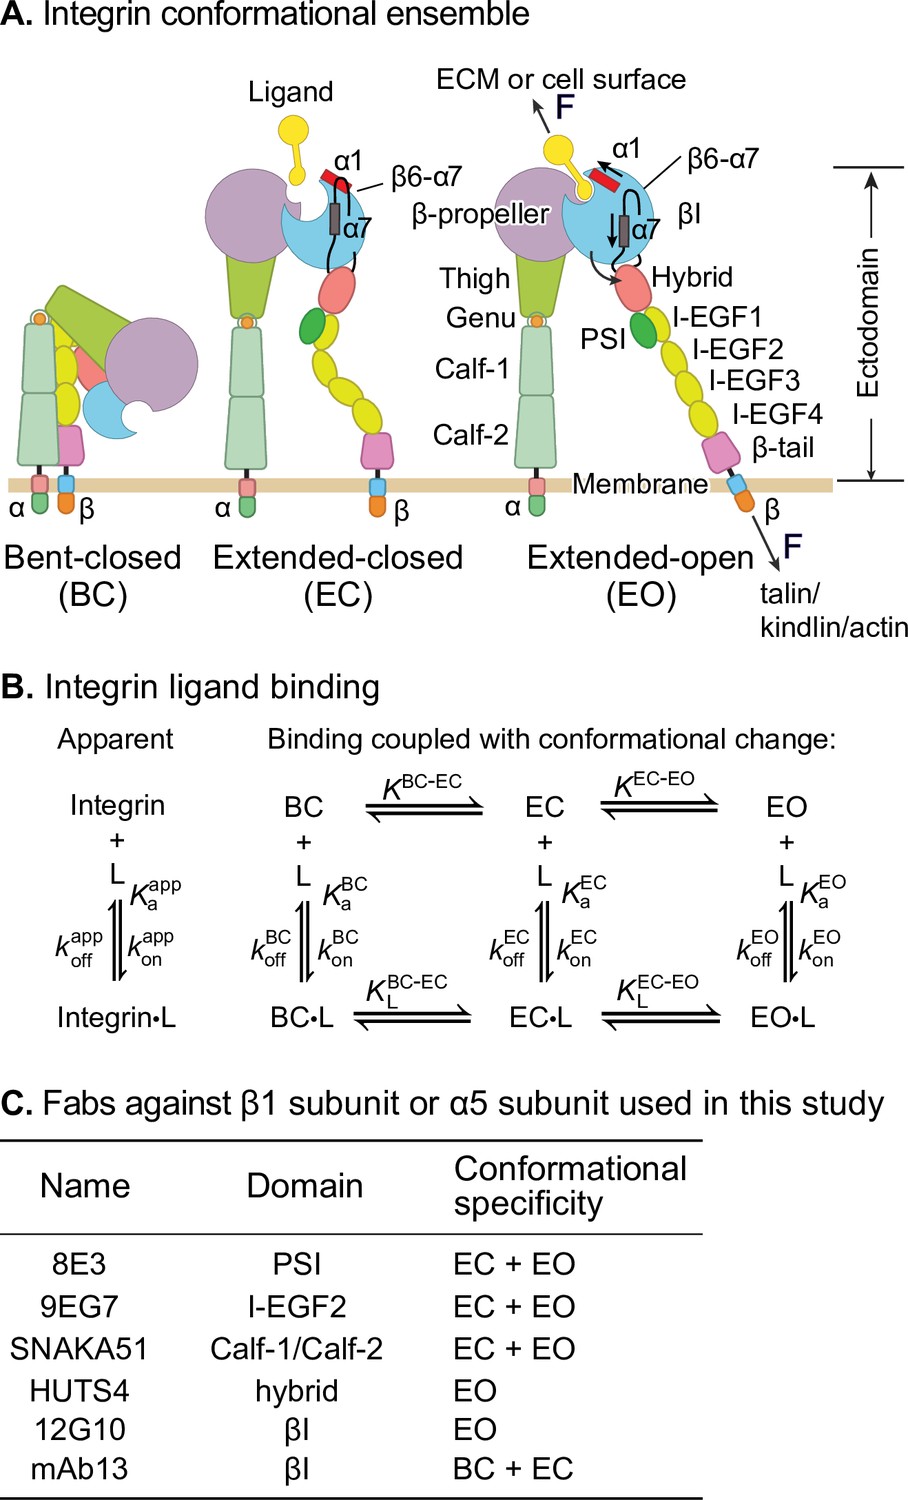
Ligand-interaction kinetics of integrin ensembles.
(A) Three overall integrin conformational states (Luo et al., 2007). Individual domains are labeled next to the extended-open (EO) state. The structural motifs that move during opening (α1-helix, α7-helix, and β6-α7 loop) are labeled in the βI domain of the extended-closed (EC) and EO state. F represents tensile force exerted across ligand–integrin–adaptor complexes by the cytoskeleton and resisted by immobilized ligand. (B) Reaction scheme showing the apparent 1 vs. 1 kinetics of integrin and ligand binding (left) and the scheme taking into account conformational change (right). (C) Fabs utilized in this study, the integrin domains they bind, and their conformational specificities.
Figure 2 with 2 supplements
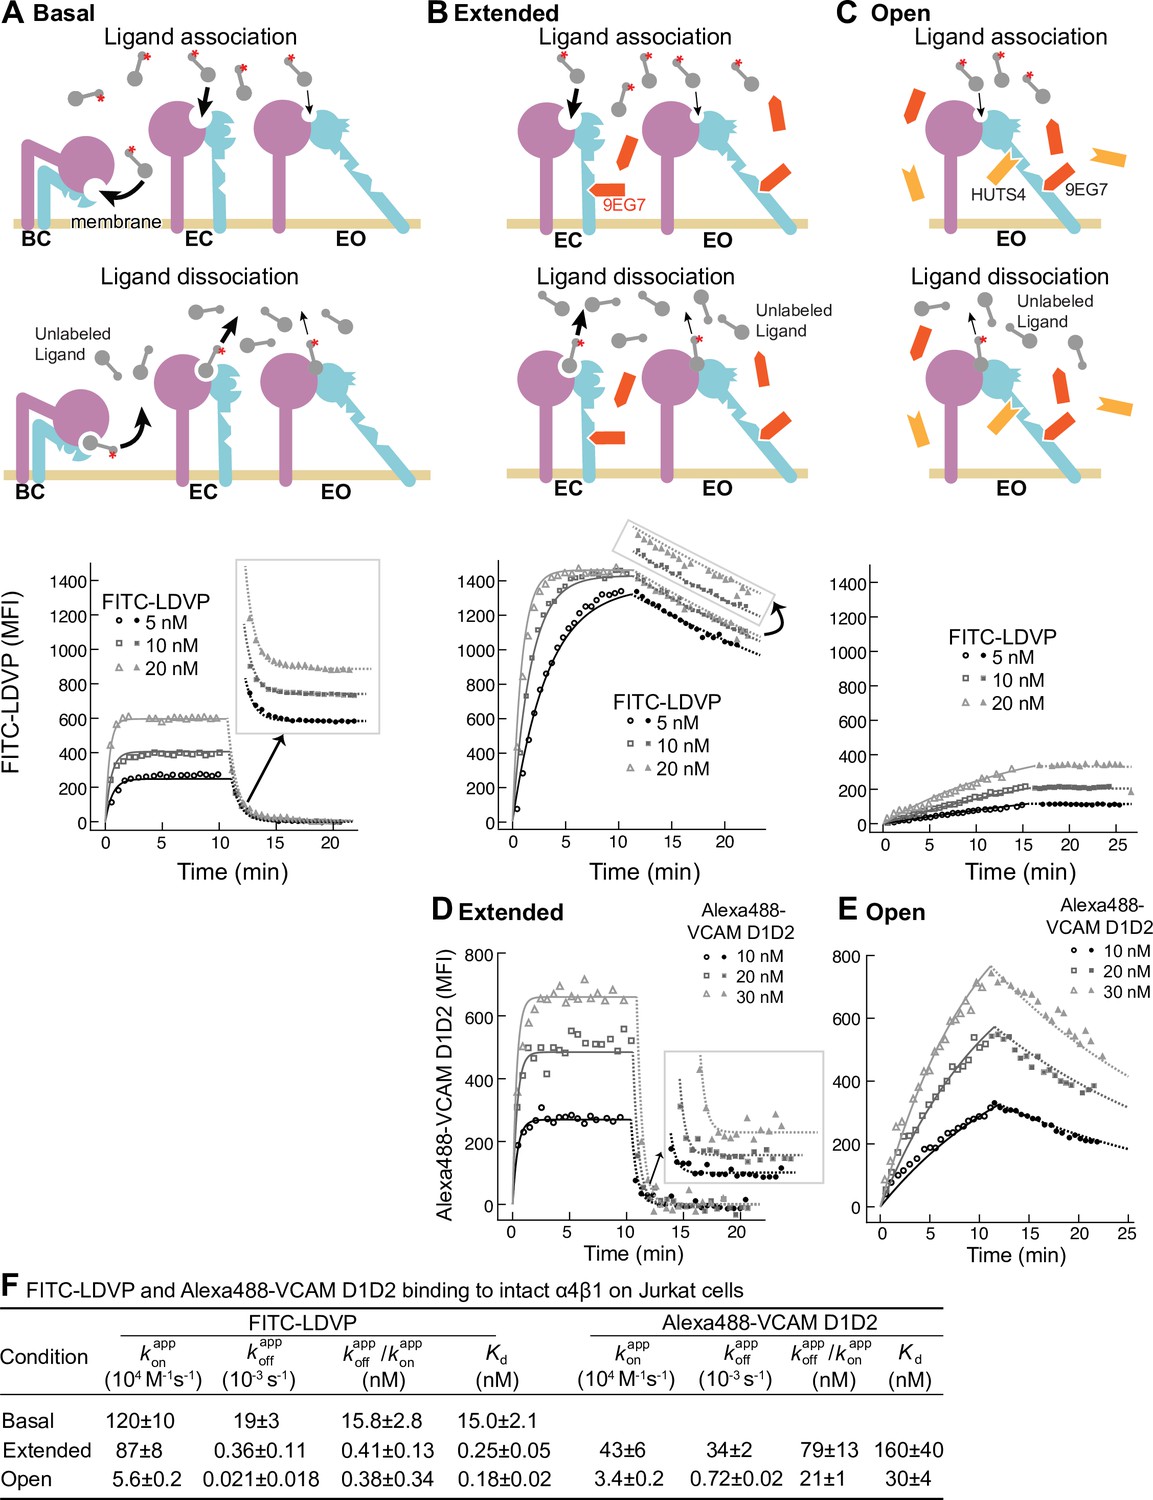
Binding kinetics of ligands to intact α4β1 on Jurkat cells.
(A–E) Binding and dissociation of FITC-LDVP (A–C) and Alexa488-VCAM D1D2 (D, E) to α4β1 on Jurkat cells measured by flow cytometry. Cartoons in panels A–C show the schemes for measuring kon in the association phase and koff in the dissociation phase in the basal ensemble (A), the extended ensemble stabilized with Fab 9EG7 (8 μM) (B, D), and the open ensemble stabilized with Fabs 9EG7 (4 μM) and HUTS4 (2 μM) (C, E). Specific mean fluorescence intensity (MFI) with the MFI in EDTA (Figure 2—figure supplement 1) subtracted is shown as open (association) or filled (dissociation) symbols; fits are shown as thin lines. (F) Tabulation of results. and are from global fits of data at all ligand concentrations. is also shown and compared to the equilibrium Kd measurements shown in Figure 4A and D of our previous work (Li and Springer, 2018), except for Alexa488-VCAM D1D2 binding to extended states, which was measured here (Figure 2—figure supplement 2). Errors for Kd values are SD from three independent experiments. Kinetic constants were determined multiple times. Kinetic constants determined in a preliminary experiment were used to determine the range of concentrations and times used in the experiment shown. Each of the three concentrations in the experiment shown is an independent experiment capable of determining the reported kinetics. By globally fitting kinetic constants to all three analyte concentrations, we obtained single on- and off-rates that combine the measurements in the three independent determinations and at the same time report errors in concentrations used and model assumptions about concentration dependence. Errors for and values are standard error (SE) from global nonlinear least-square fitting of data at all ligand concentrations. From SE, the 95% confidence interval for the fitting parameter can be computed as [fitting value – 2 * SE, fitting value + 2 * SE]. Errors for are propagated from errors of and .
-
Figure 2—source data 1
Source data for Figure 2A.
- https://cdn.elifesciences.org/articles/73359/elife-73359-fig2-data1-v2.txt
-
Figure 2—source data 2
Source data for Figure 2B.
- https://cdn.elifesciences.org/articles/73359/elife-73359-fig2-data2-v2.txt
-
Figure 2—source data 3
Source data for Figure 2C.
- https://cdn.elifesciences.org/articles/73359/elife-73359-fig2-data3-v2.txt
-
Figure 2—source data 4
Source data for Figure 2D.
- https://cdn.elifesciences.org/articles/73359/elife-73359-fig2-data4-v2.txt
-
Figure 2—source data 5
Source data for Figure 2E.
- https://cdn.elifesciences.org/articles/73359/elife-73359-fig2-data5-v2.txt
Figure 2—figure supplement 1
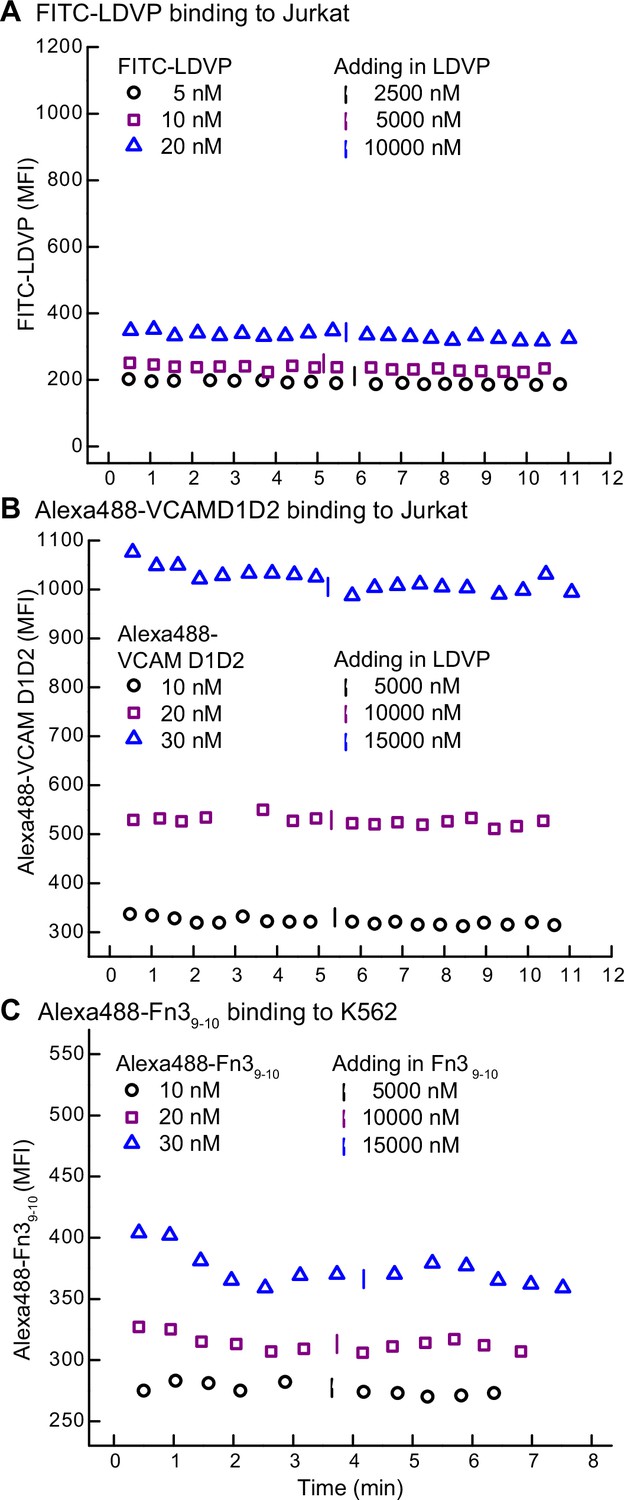
Background binding of fluorescent ligands in the presence of 10 mM EDTA.
Mean fluorescent intensity (MFI) of FITC-LDVP (A) or Alexa488-VCAMD1D2 (B) on Jurkat cells and Alexa488-Fn39-10 on K562 cells (C) was recorded before and after adding an excess of unlabeled ligand in the presence of 10 mM EDTA.
Figure 2—figure supplement 2

Binding of Alexa488-VCAM D1D2 to Jurkat cells under extension-stabilizing Fabs monitored by FACS.
Jurkat cells at 2 million/mL were incubated with indicated concentrations of Alexa488-VCAMD1D2 and 8μM 9EG7 Fab in L15 medium with 1% BSA for 1 hr at 22°C, and then subjected to flow cytometry without washing. Binding was measured as mean fluorescence intensity (MFI); background MFI was determined under the same condition with 10 mM EDTA present. Data were fitted to dose–response curve to determine the Kd value; error represents the standard error from the nonlinear least-square fit.
Figure 3
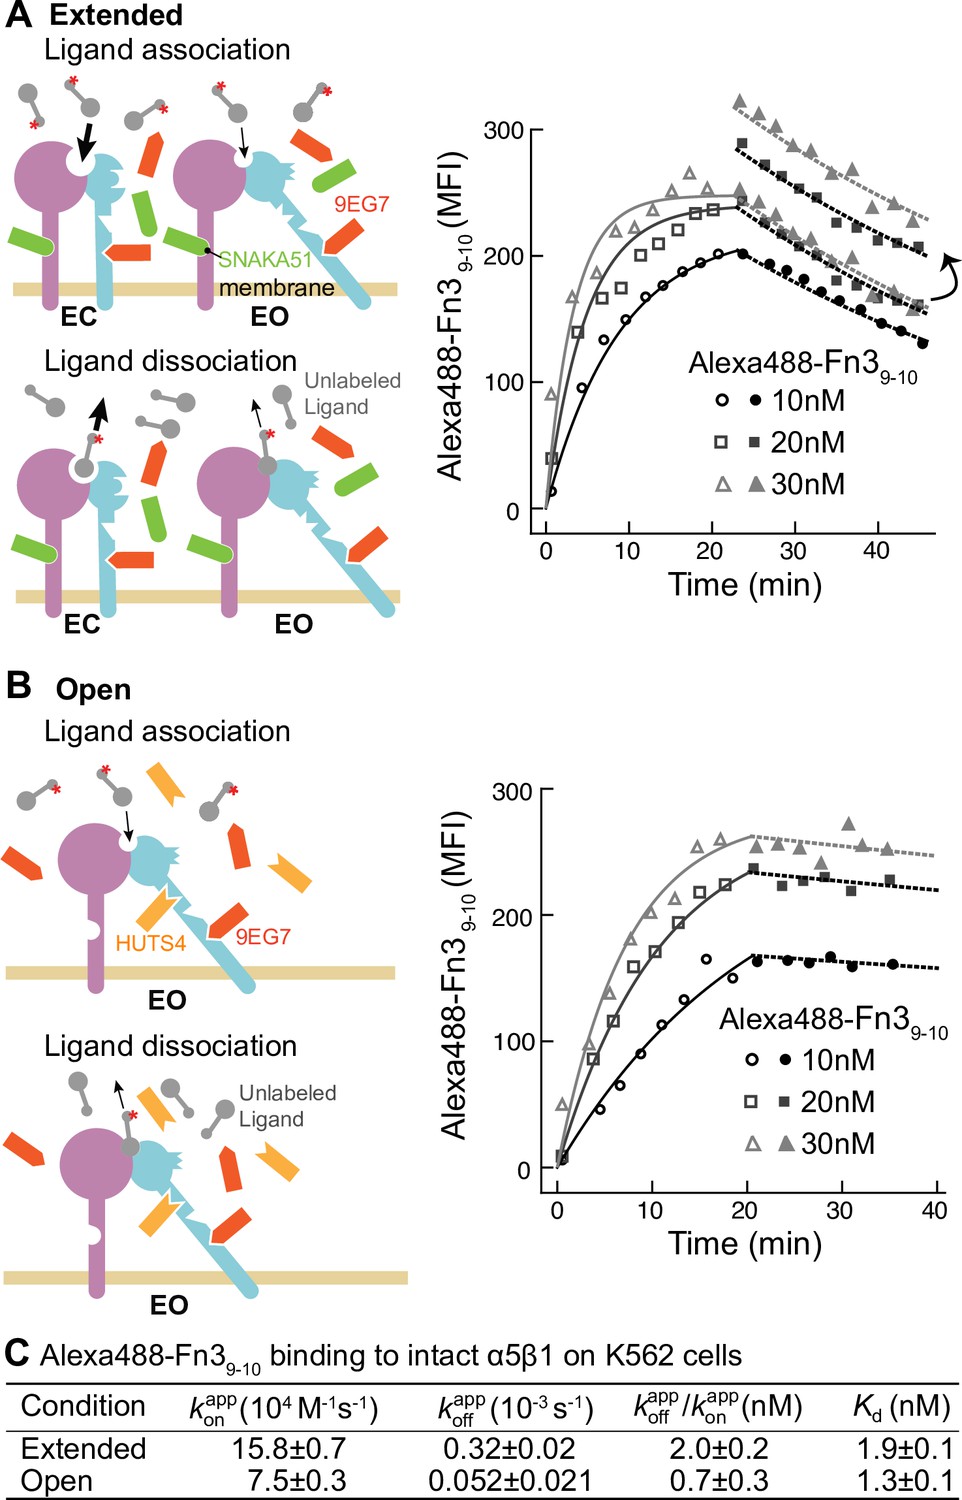
Binding kinetics of Alexa488-Fn39-10 to α5β1 on K562 cells.
(A, B) Binding of Alexa488-Fn39-10 to α5β1 on K562 cells measured by flow cytometry. Measurements were on integrins in extended ensembles (EC + EO ) in the presence of Fabs 9EG7 (6 μM) and SNAKA51 (2 μM) (A) or in the open (EO state) in the presence of Fabs 9EG7 (6 μM) and HUTS4 (2 μM) (B), as illustrated in the cartoons. Mean fluorescence intensity (MFI) with background in EDTA subtracted (Figure 2—figure supplement 1) is shown as symbols and fits are shown as lines; the association phase has open symbols and solid lines, and the dissociation phase has filled symbols and dashed lines. (C) Tabulation of results. Details about experimental repeats and kinetic parameter uncertainty, including errors and confidence intervals, are as described in Figure 2 legend. is also shown with propagated error and compared to equilibrium Kd measurements shown in Figure 7B of our previous study (Li et al., 2017).
-
Figure 3—source data 1
Source data for Figure 3A.
- https://cdn.elifesciences.org/articles/73359/elife-73359-fig3-data1-v2.txt
-
Figure 3—source data 2
Source data for Figure 3B.
- https://cdn.elifesciences.org/articles/73359/elife-73359-fig3-data2-v2.txt
Figure 4
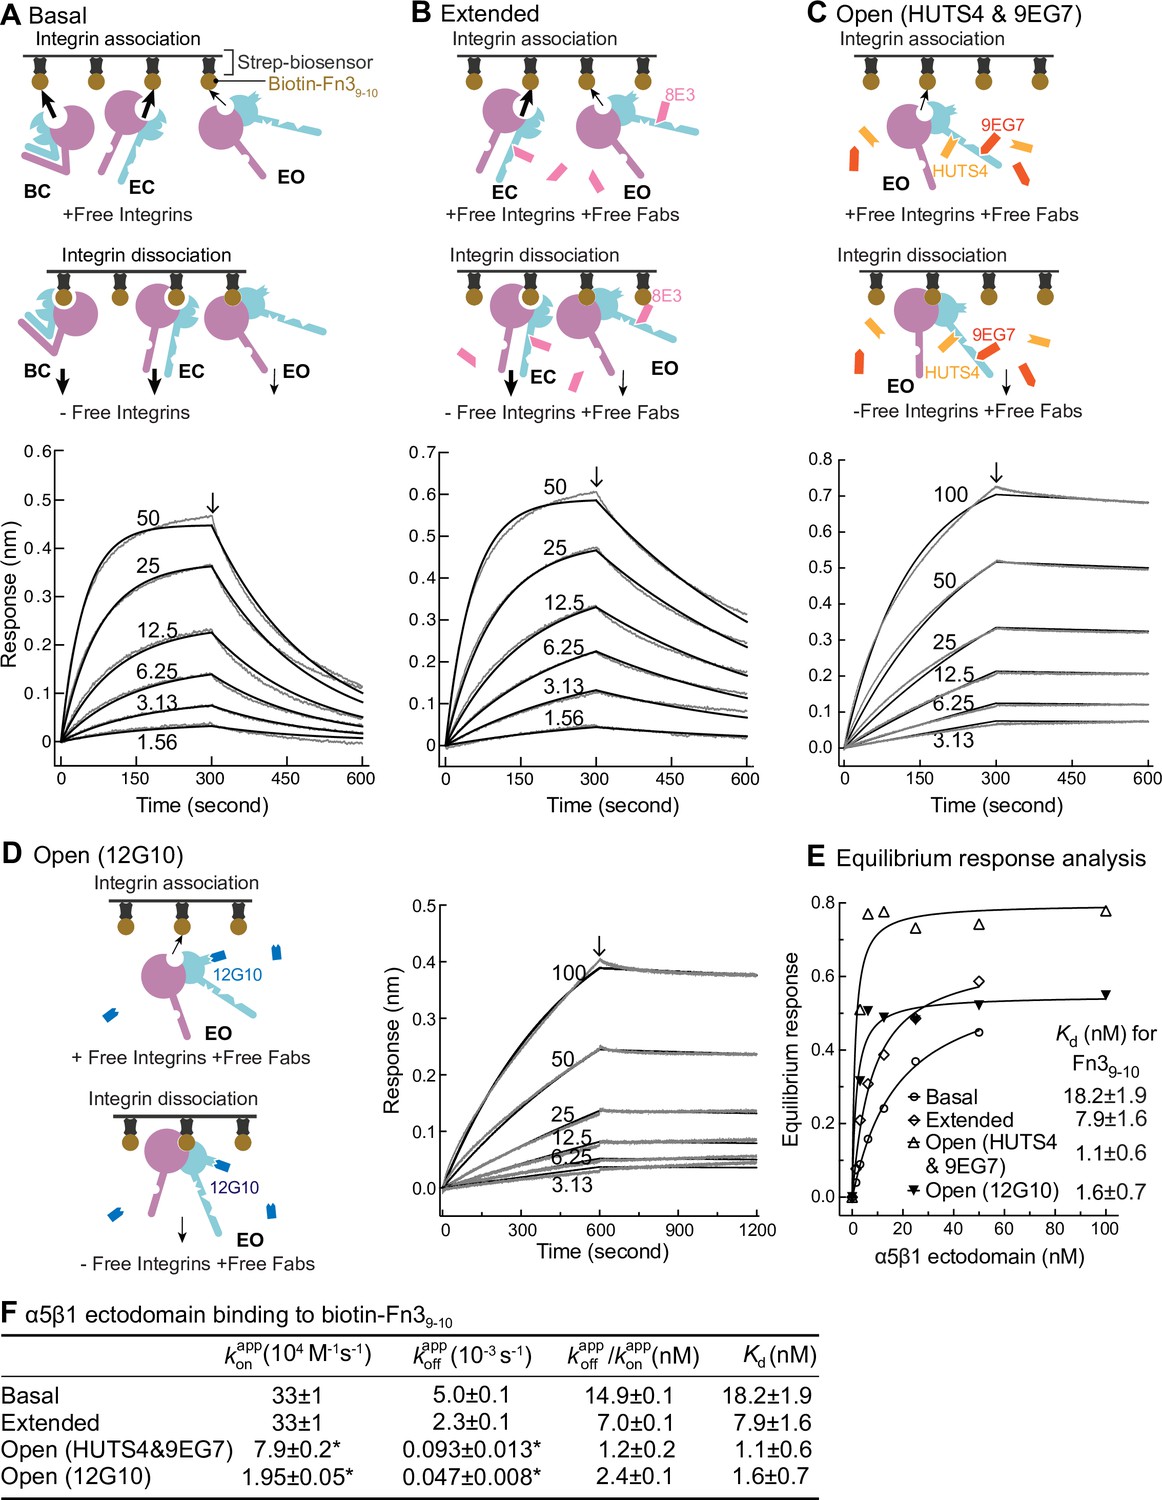
Binding kinetics of α5β1 ectodomain to Fn39-10.
(A–D) Binding of unclasped high-mannose α5β1 ectodomain measured with biolayer interferometry (BLI). Schemes for measuring ligand binding and dissociation in the association phase and dissociation phase are shown in each panel. α5β1 ectodomain (analyte) at the indicated concentrations in nM was bound to biotin-Fn39-10 immobilized on streptavidin biosensors without Fab (A), with 2 μM Fab 8E3 (B), with 2 μM 9EG7 and 5 μM HUTS4 Fabs (C), or with 1 μM Fab 12G10 (D). Arrows mark the start of the dissociation phase. Response curves are in gray and fitting curves in black. (E) The equilibrium binding (response) was calculated from and values at each α5β1 ectodomain concentration and fit to a dose–response curve to calculate Kd values. These values serve as a check on the values in (F). (F) and values from nonlinear least-square fit of data in panels (A–D) and Kd values from equilibrium response analysis in panel (E) with 1 vs. 1 Langmuir binding model, and values. Errors with * are difference from the mean of two measurements at the same concentrations of α5β1 ectodomain from two independent purifications. Errors without * for , , and Kd are SE from nonlinear least-square fits with single and as global parameters fitting to all analyte concentrations. Details about experimental repeats and uncertainties for and , including errors and confidence intervals, are as described in Figure 2 legend. Errors for are propagated from errors of and .
-
Figure 4—source data 1
Source data for Figure 4A.
- https://cdn.elifesciences.org/articles/73359/elife-73359-fig4-data1-v2.txt
-
Figure 4—source data 2
Source data for Figure 4B.
- https://cdn.elifesciences.org/articles/73359/elife-73359-fig4-data2-v2.txt
-
Figure 4—source data 3
Source data for Figure 4C.
- https://cdn.elifesciences.org/articles/73359/elife-73359-fig4-data3-v2.txt
-
Figure 4—source data 4
Source data for Figure 4D.
- https://cdn.elifesciences.org/articles/73359/elife-73359-fig4-data4-v2.txt
Figure 5
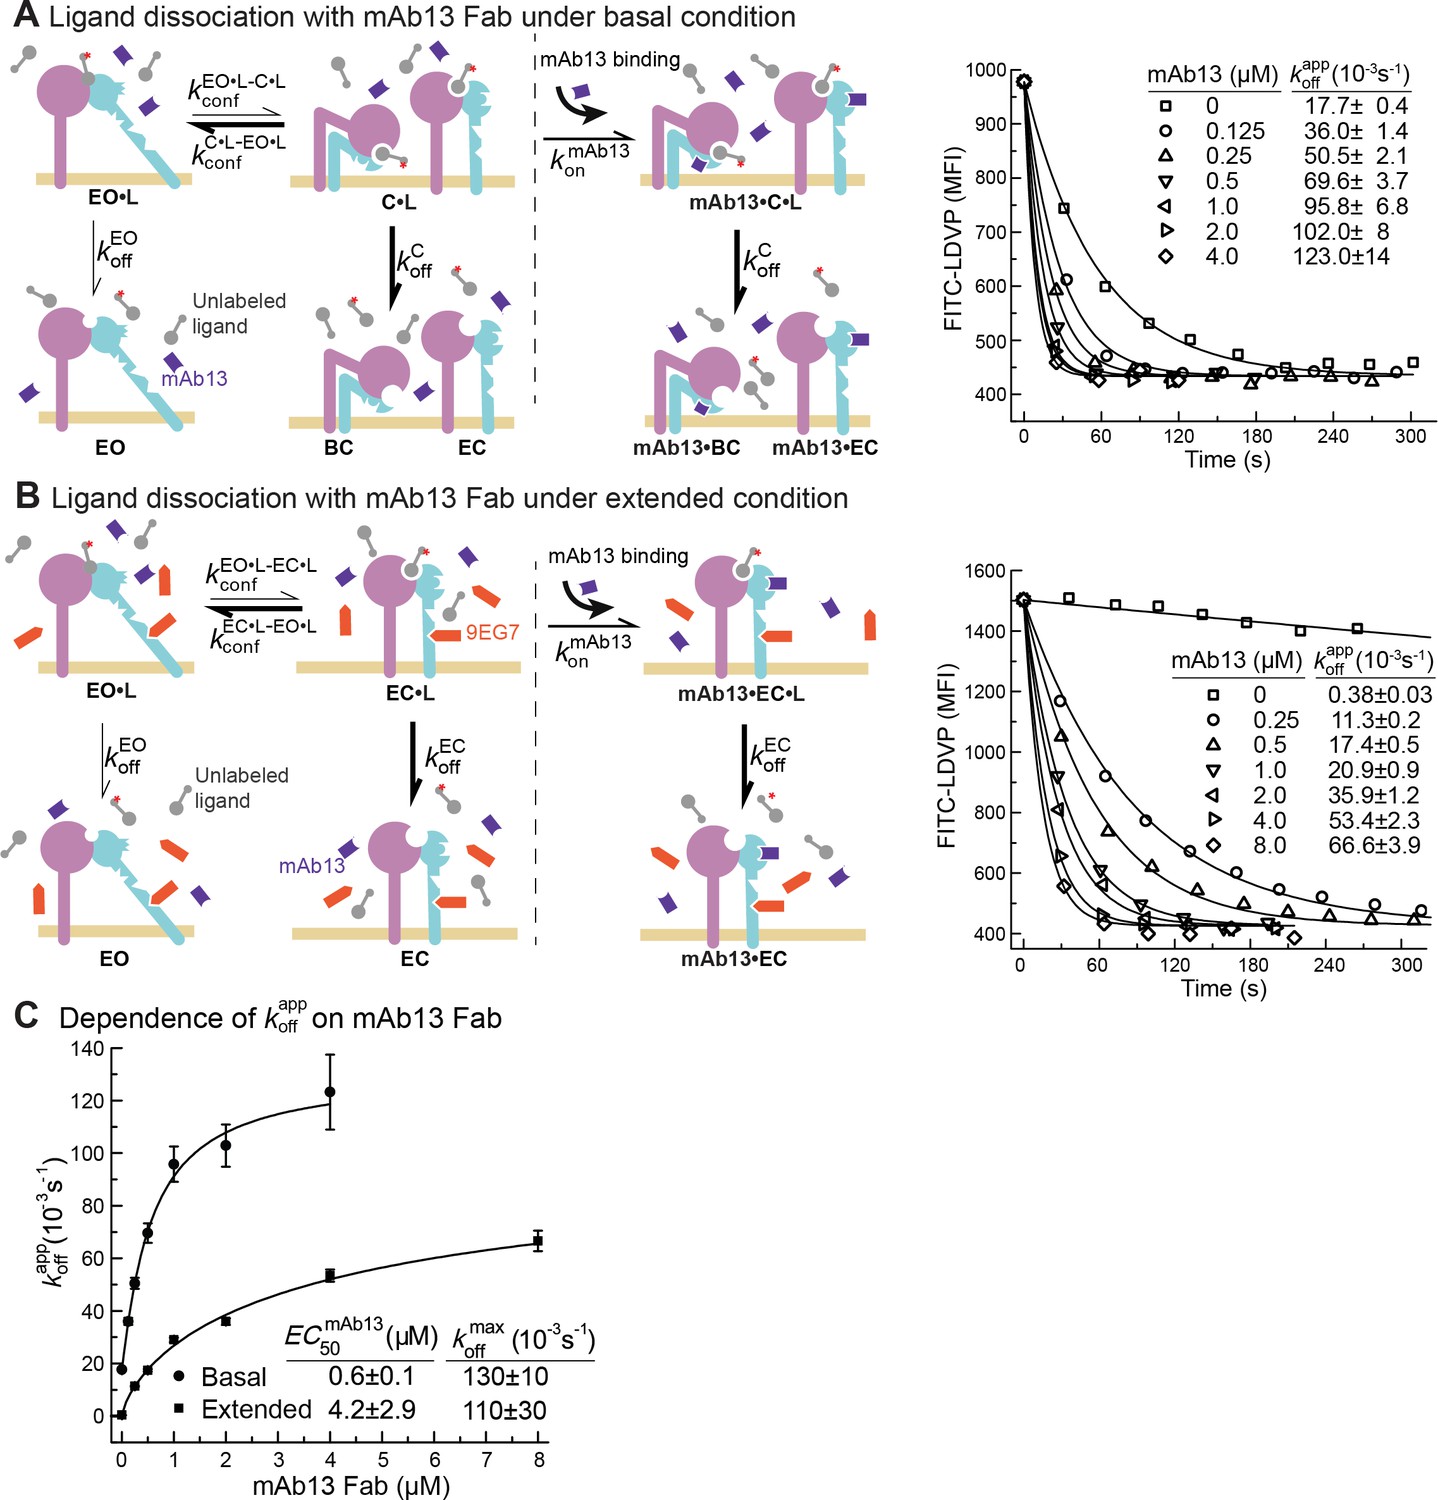
Dissociation of FITC-LDVP from α4β1 on Jurkat cells in the presence of closure-stabilizing Fab.
(A, B) FITC-LDVP dissociation from basal or extended ensembles of intact α4β1 on Jurkat cells measured using flow cytometry. FITC-LDVP (20 nM) was incubated with Jurkat cells in the absence (A) or in the presence of extension-stabilizing Fab 9EG7 (4 μM) (B) for 10 min to reach steady state. Then, 10 μM unlabeled LDVP, together with indicated concentrations of mAb13 Fab, were added. Observed mean fluorescence intensity () values as a function of time at indicated mAb13 Fab concentrations were globally fitted to , with MFI at the start of dissociation () and background MFI () as shared parameters and as the individual fitting parameter at each mAb13 Fab concentration. (C) Dependence of on mAb13 Fab concentration. at each mAb13 Fab concentration in panels (A) and (B) were fitted to dose–response curves to determine the maximum off-rate at saturating mAb13 Fab concentration, , and the mAb13 Fab concentration when the off-rate reaches half of the maximum, . Experiments in panels (A) and (B) were carried out twice, first with 0, 1, 2, and 4 μM mAb13 Fab for 120 s, and then with the conditions shown, with similar values in each experiment. All errors are SE from nonlinear least-square fits.
-
Figure 5—source data 1
Source data for Figure 5A.
- https://cdn.elifesciences.org/articles/73359/elife-73359-fig5-data1-v2.txt
-
Figure 5—source data 2
Source data for Figure 5B.
- https://cdn.elifesciences.org/articles/73359/elife-73359-fig5-data2-v2.txt
Figure 6
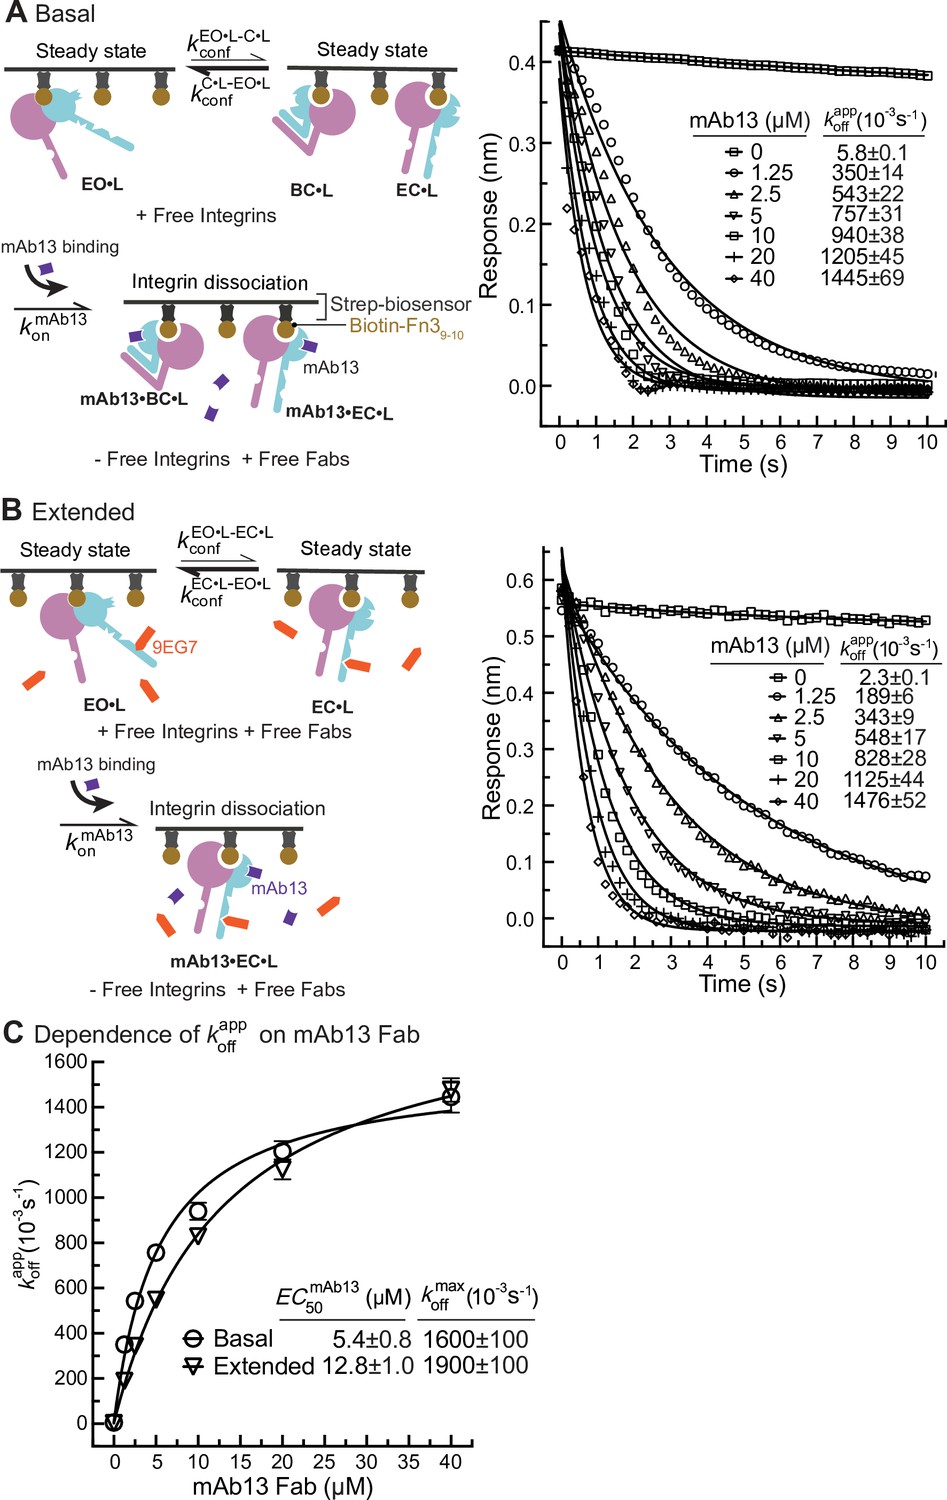
Dissociation of α5β1 ectodomain from biotin-Fn39-10 in the presence of closure-stabilizing Fab.
(A, B) Unclasped high-mannose α5β1 ectodomain dissociation from biotin-Fn39-10 immobilized on streptavidin biosensors was monitored by biolayer interferometry (BLI). Reaction schemes are illustrated in each panel. 50 nM α5β1 ectodomain was incubated with biotin-Fn39-10 biosensors for 10 min to reach steady-state binding in the absence (A) or the presence of 2 μM 9EG7 Fab (B). Biosensors were then transferred into wells lacking the α5β1 ectodomain in the presence or absence of 9EG7 Fab as before and also containing the indicated concentrations of mAb13 Fab for measurement of dissociation. The observed response () at each mAb13 Fab concentration as a function of time was individually fitted to the single exponential, , for the initial response at the start of dissociation () and . (C) Determination of at saturating mAb13 Fab concentration. was fit to mAb13 Fab concentration using a dose–response curve for the maximum off-rate at saturating mAb13 Fab concentration to determine . The mAb13 Fab concentration when the off-rate reaches half of the maximum, , was also determined. Experiments in panels (A) and (B) were carried out twice, first with 0, 2, 5, and 10 mAb13 Fab for 120 s, and then with the conditions shown, with similar values in each experiment. Errors are SE from nonlinear least-square fits.
-
Figure 6—source data 1
Source data for Figure 6A.
- https://cdn.elifesciences.org/articles/73359/elife-73359-fig6-data1-v2.txt
-
Figure 6—source data 2
Source data for Figure 6B.
- https://cdn.elifesciences.org/articles/73359/elife-73359-fig6-data2-v2.txt
Figure 7 with 1 supplement

Ligand-binding kinetics of each integrin state.
(A) Integrin α4β1 and α5β1 ensembles utilized in this study to measure ligand-interaction kinetics and equations to relate the apparent on- and off-rates with the on- and off-rates for each conformational state. (B) Conformational state populations in the absence of ligand and when saturably bound to ligand. Previously reported populations for integrins in the absence of ligand and their affinities for ligand were used with Eqs. S5–S10 in Figure 7—figure supplement 1B to calculate the populations in saturating ligand of ligand-bound integrin states in each type of ensemble studied here. The population of intact α4β1 on Jurkat cell surface in the absence of ligand is reported in Figure 4D of Li and Springer, 2018; population of intact α5β1 on K562 cell surface and α5β1 ectodomain in the absence of ligand is reported in Figure 7 and Figure 4, respectively, in Li et al., 2017. The fold-difference in ligand-binding affinity for the open and closed states that was used to calculate the populations for the ligand-saturated states is described in Figure 7—figure supplement 1. (C) Values of kon and koff for conformational states of four integrin-ligand pairs. As discussed in the text and ‘Materials and methods,’ kinetic measurements on the extended-open (EO) state and the extended and basal ensembles were used with equations in panel (A) to calculate kinetics of the bent-closed (BC) and extended-closed (EC) states. The errors for directly measured values were fitting errors from nonlinear least-square fit; the errors for calculated BC and EC values were propagated. aIntrinsic rates of EO state were from measurements in the presence of HUTS4 and 9EG7 Fabs in Figures 2—4, and intrinsic rates for BC and EC states were calculated with Eqs. 1–4 in panel (A). bFrom previous equilibrium measurements described in the legends for Figures 2 and 3. cCalculated as shown from the product of equilibrium Kd and kon. (D) Comparison of Asp-binding pocket in the open state (PDB: 3ze2 chains C + D) and closed state (PDB: 3zdy chains C + D) of integrin αIIBβ3 (Zhu et al., 2013). The pocket in the β3 βI domain is shown with backbone and nearby sidechains in blue stick and blue dot surfaces and the MIDAS Mg2+ ion as a silver sphere. The ligand backbone loop is shown in yellow and its sidechain in stick with yellow carbons and red carboxyl oxygens. The Asp sidechain Cβ carbon and carboxyl oxygens are shown as yellow and red dot surfaces, respectively.
Figure 7—figure supplement 1
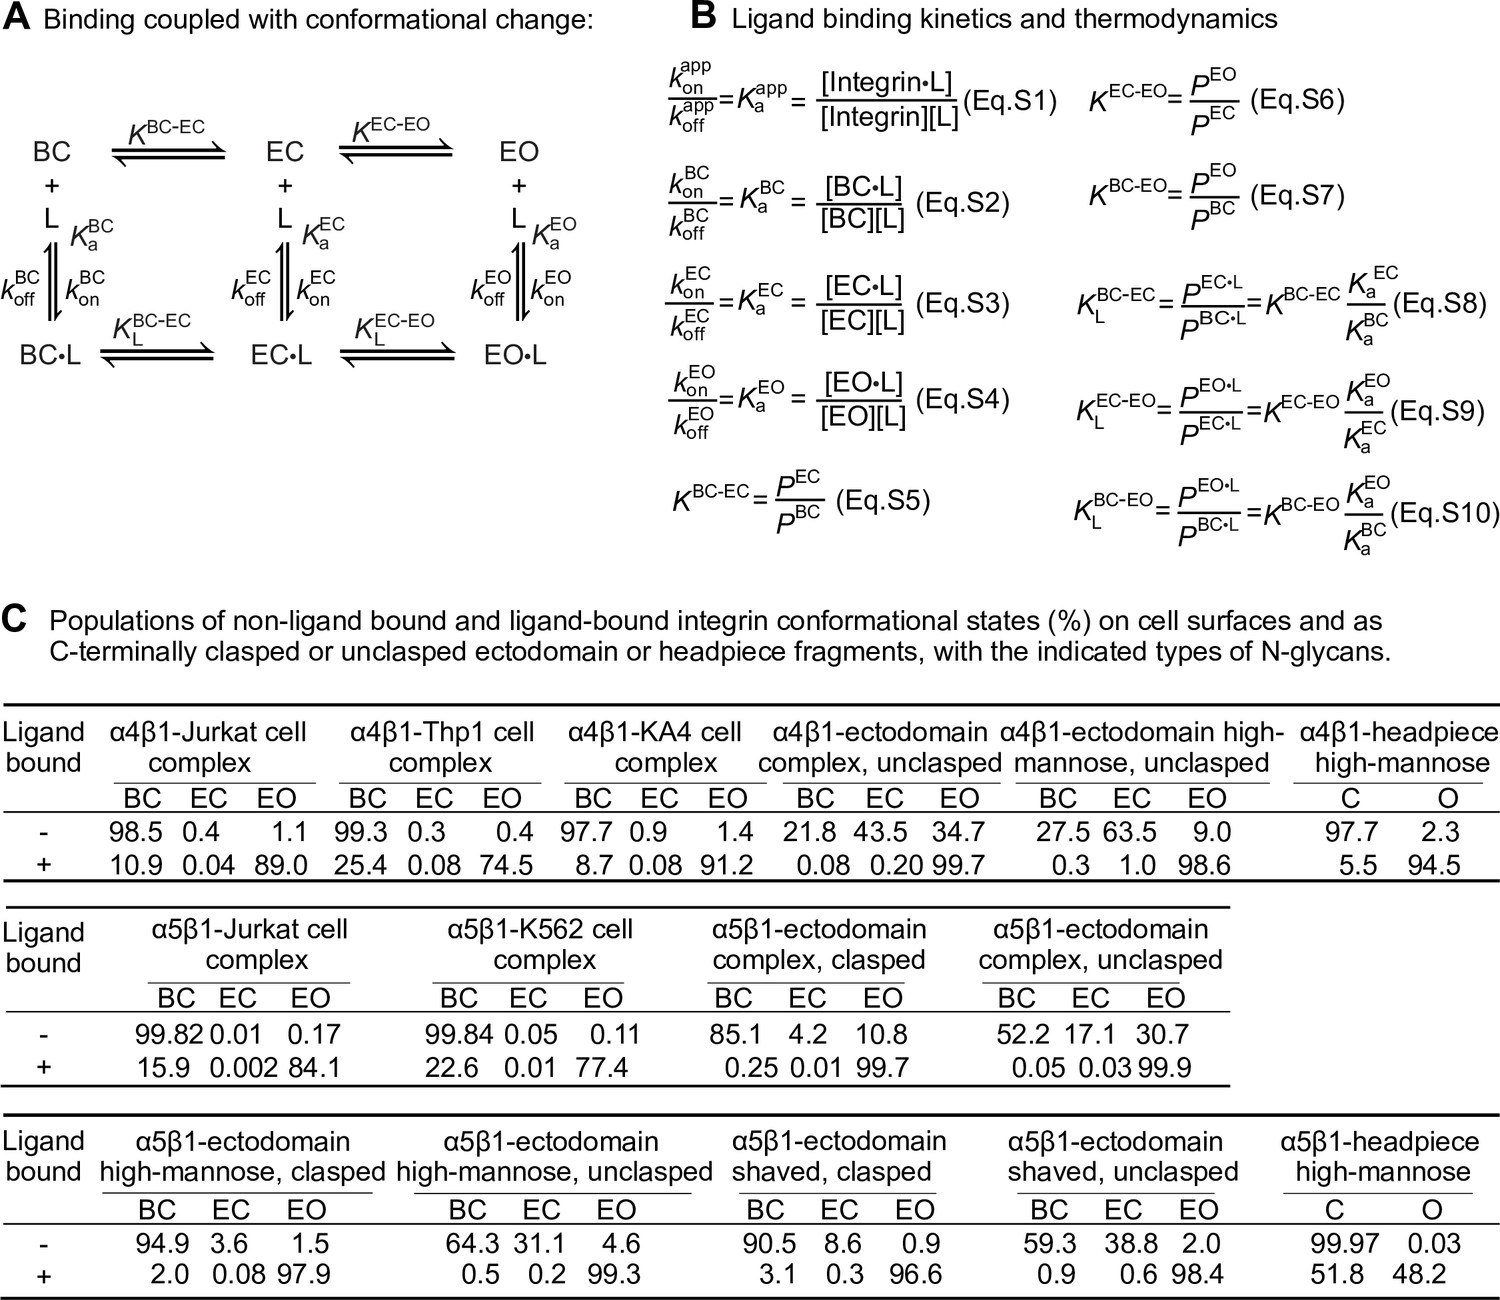
Ligand-interaction kinetics of integrin ensembles.
(A) Reaction scheme showing two linked thermodynamic cycles. (B) Equations relating thermodynamic parameters and ligand-binding kinetics for reactions in panel A. Equations S8–S10 are based on thermodynamic cycles for ligand binding and conformational change shown in panel A. (C) Population of each state in the absence of ligand and in the presence of saturating concentration of ligand for integrins α4β1 and α5β1 on the cell surface and in preparations of purified integrin fragments, based on previous measurements (Li and Springer, 2018; Li et al., 2017). The data are for integrins on cells in suspension or for purified integrin fragments binding to soluble ligands. When a fraction x of integrins is bound to ligand, the population percentages may be multiplied by x to give ligand-bound integrin populations and by (1-x) to give the unbound populations. Data on integrins on intact cells will be affected by basal binding of other cellular components including intracellular cytoskeletal adaptors. During adhesion to ligands on substrates, engagement of adaptors and the cytoskeleton, and application of tensile force to ligand-bound integrins, the populations will be shifted as described (Li and Springer, 2017) Data for intact α4β1 on cells were determined in Figure 4 and data for α4β1 unclasped ectodomains and headpiece were determined in Figure 3 in Li and Springer, 2018. Data for intact α5β1 on cells were determined in Figure 7 and data for α5β1 ectodomains and headpiece were determined in Figures 5 and 6, respectively, in Li et al., 2017. Populations of ligand-bound states were calculated from Eqs. S5–S10 shown in panel (B). In Eqs. S8–S10, the ratios are used of intrinsic affinities of the extended-open (EO) to the bent-closed (BC) and extended-closed (EC) states. For integrin α4β1, the ratios were averaged to 729 ± 211 from six α4β1 preparations shown in the table in Li and Springer, 2018; for integrin α5β1, ratios were averaged to 3106 ± 1,689 from eight soluble α5β1 preparations, including the affinities of cRGD peptide for six ectodomain preparations either clasped or unclasped and with three different N-glycosylation forms (Figure 5), the affinities of cRGD peptide for high-mannose headpiece and semi-truncated ectodomain (Figure 6C), as well as the affinity of Fn39-10 to unclasped ectodomain with high mannose N-glycans (Figure 4D) in Li et al., 2017.
Additional files
Download links
A two-part list of links to download the article, or parts of the article, in various formats.
Downloads (link to download the article as PDF)
Open citations (links to open the citations from this article in various online reference manager services)
Cite this article (links to download the citations from this article in formats compatible with various reference manager tools)
Low-affinity integrin states have faster ligand-binding kinetics than the high-affinity state
eLife 10:e73359.
https://doi.org/10.7554/eLife.73359


