Cryo-EM structures of CTP synthase filaments reveal mechanism of pH-sensitive assembly during budding yeast starvation
- Department of Biochemistry, University of Washington, United States
- Graduate Program in Biological Physics, Structure, and Design, University of Washington, United States
Figures
Figure 1
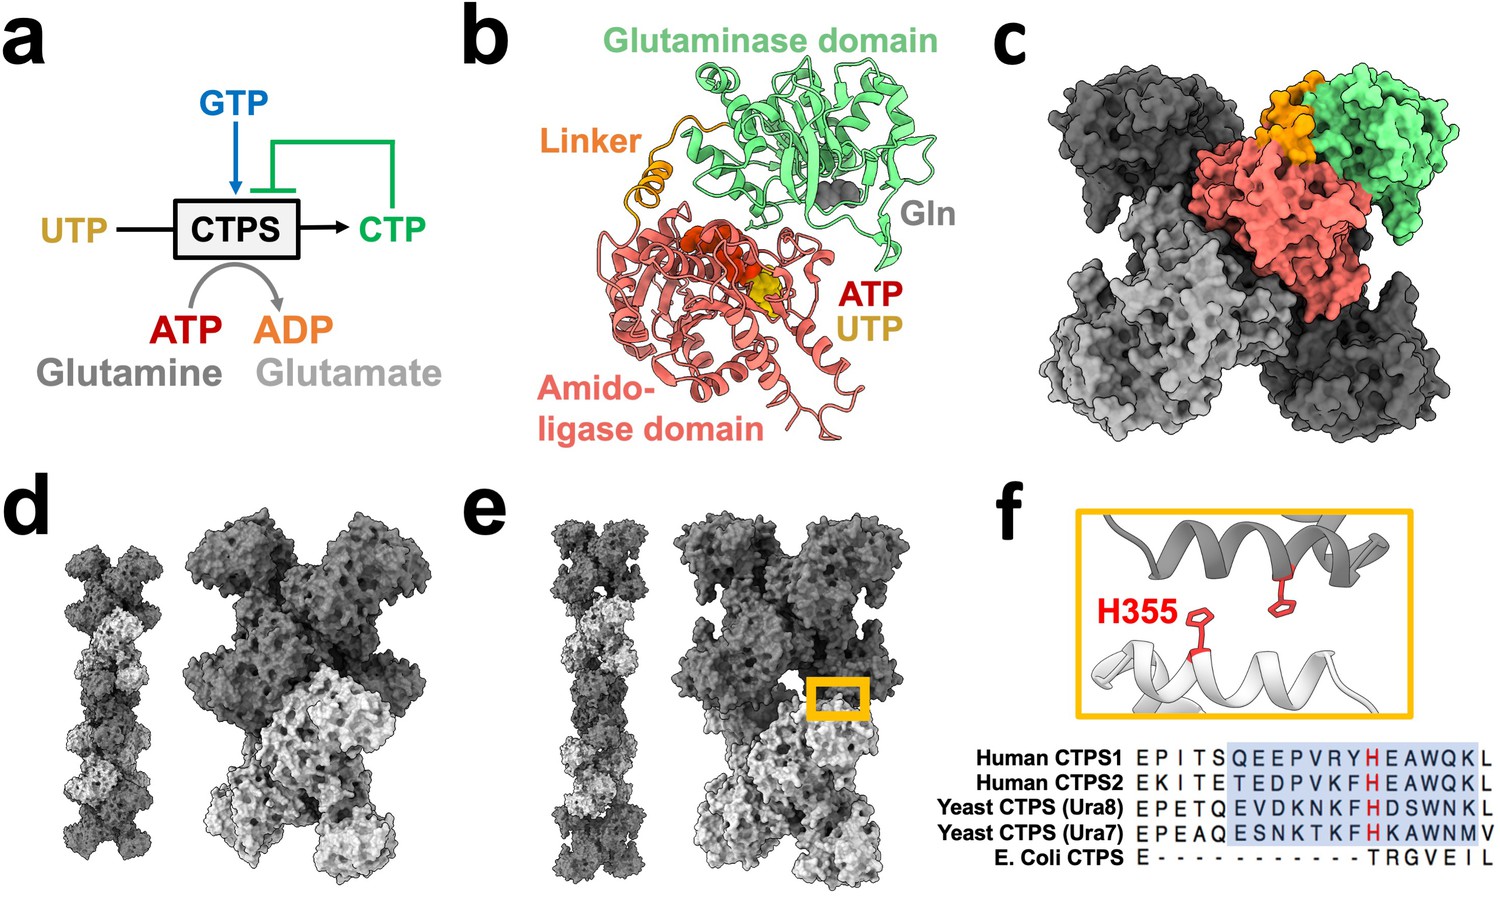
CTPS canonical structure and filament assembly.
(a) De novo CTP synthesis reaction diagram. (b) Substrate-bound hCTPS2 (6PK4) monomer with glutamine modeled from 1VCO. (c) Canonical tetramer structure of CTPS (6PK4). Monomers are shaded differently, and domain colors from panel B are painted for one monomer. (d) Surface model display for filament assembly of stacked tetramers for product-bound E. coli CTPS (5U3C). (e) Surface model display for filament assembly of stacked tetramers for product-bound hCTPS2 (6PK7). (f) Zoom-in of box from panel E showing filament assembly interface, with conserved H355 in red. Below, sequence alignment of filament assembly interface, with blue shaded box for eukaryotic alpha helical insert and conserved key histidine in red.
Figure 2 with 2 supplements
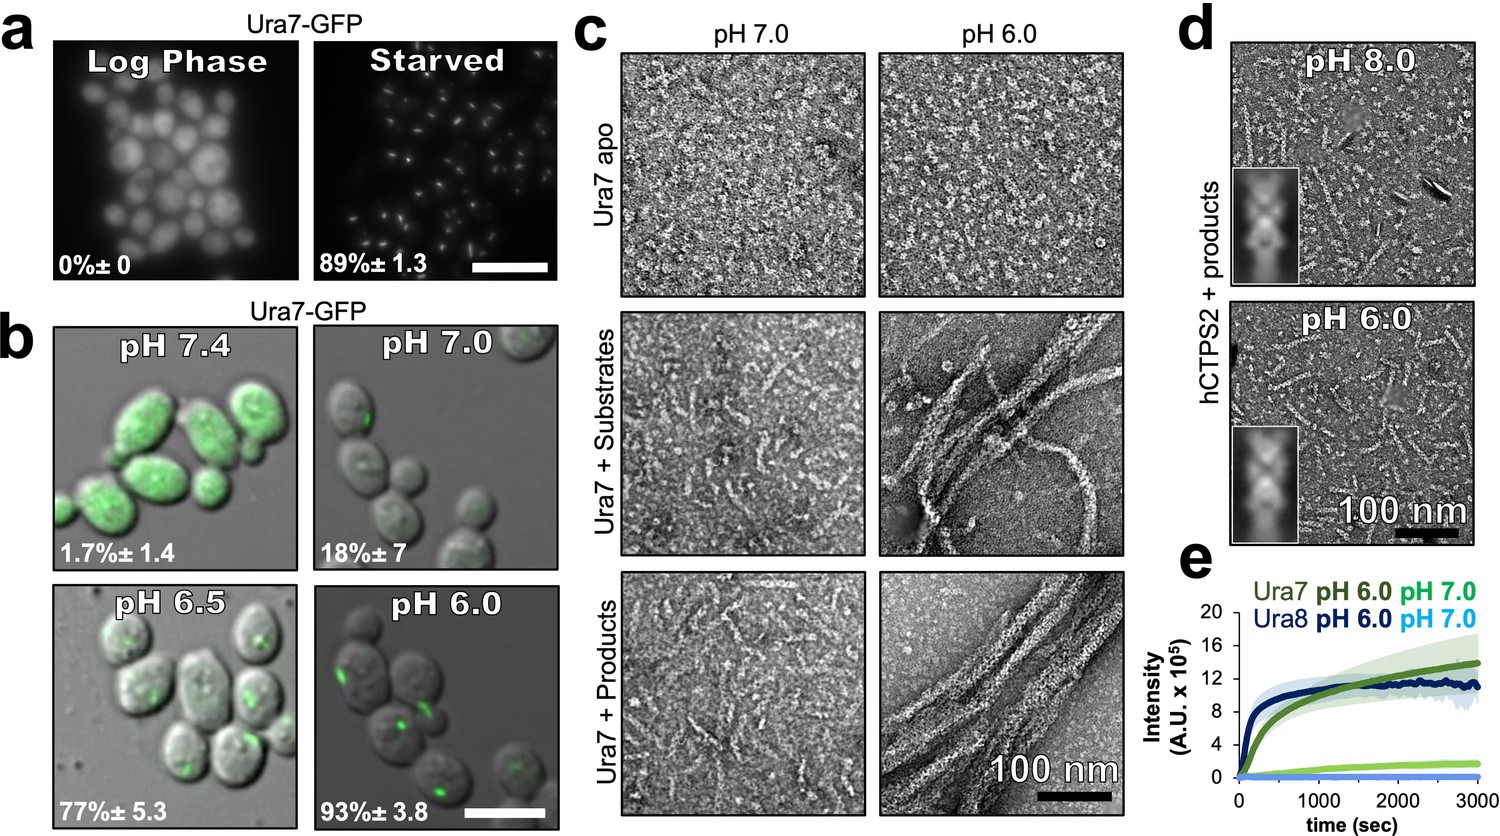
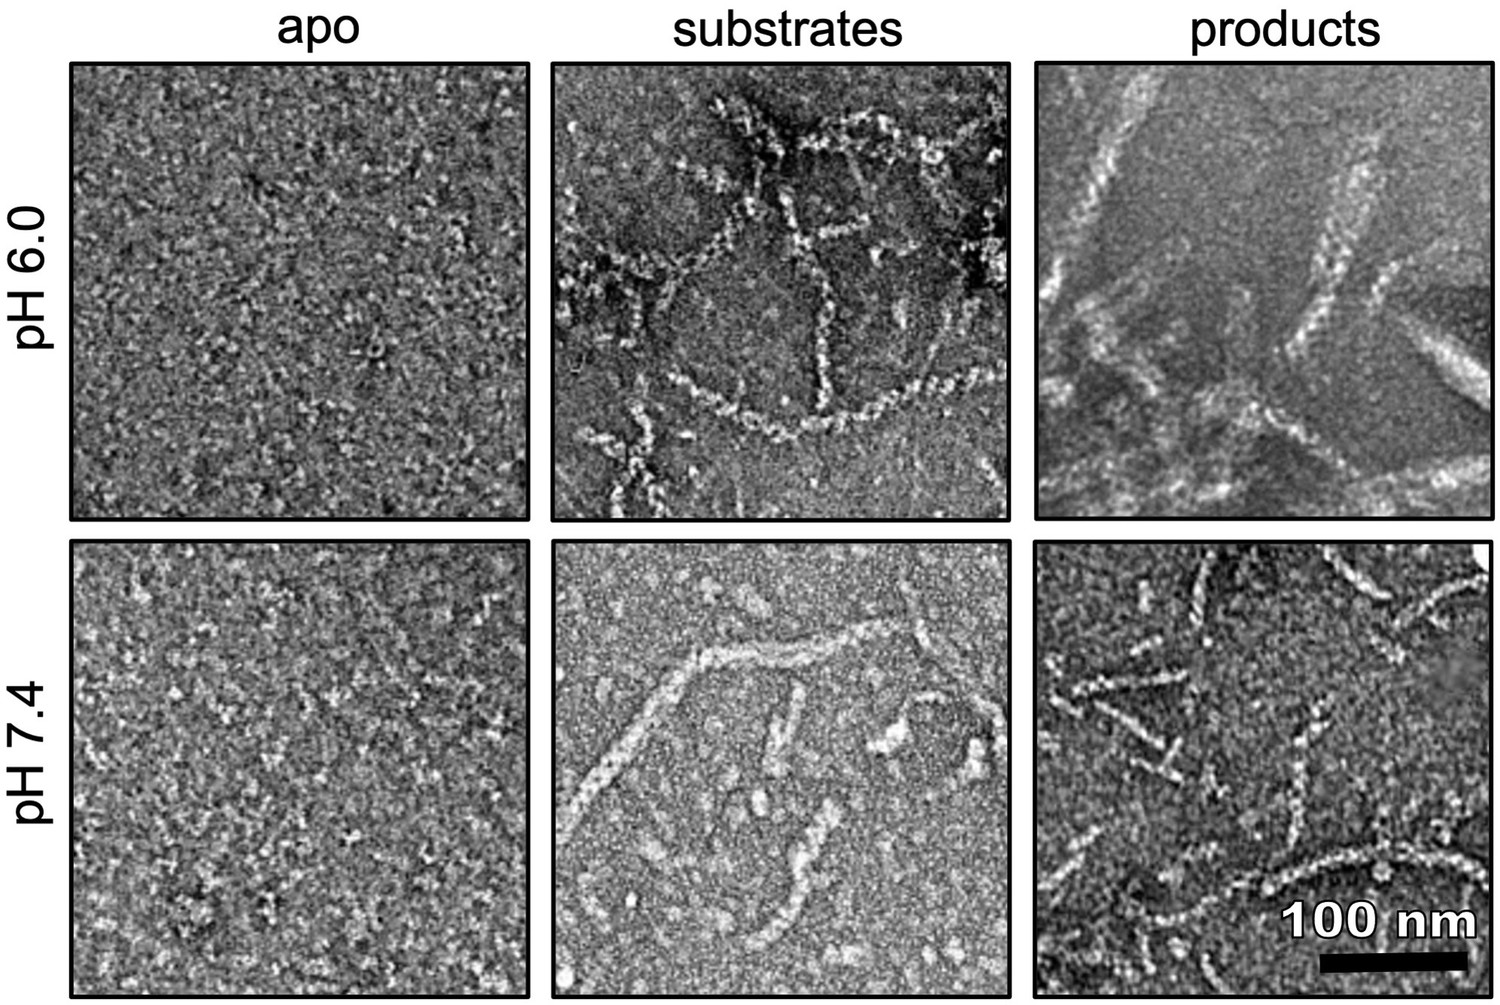
Yeast CTPS assembly is driven by pH with addition of substrates or products.
(a) Yeast expressing GFP-tagged Ura7 in log phase and starvation media. Quantification is shown as a percentage of cells with foci. Scale bar 10 µm. (b) Yeast expressing GFP-tagged Ura7 with cell membrane permeabilized using 2 mM DNP supplemented with 2 % glucose. Quantification is shown as a percentage of cells with foci. Scale bar 10 µm. (c) Negative stain EM of purified Ura7 assembled with substrate (2 mM UTP/ATP) or products (2 mM CTP). (d) Negative stain EM of purified hCTPS2 assembled with 2 mM CTP. Insets are representative 2D class averages. (e) Right angle light scattering with addition of 2 mM CTP. Units of intensity are in arbitrary units (A.U.).
Figure 2—figure supplement 1
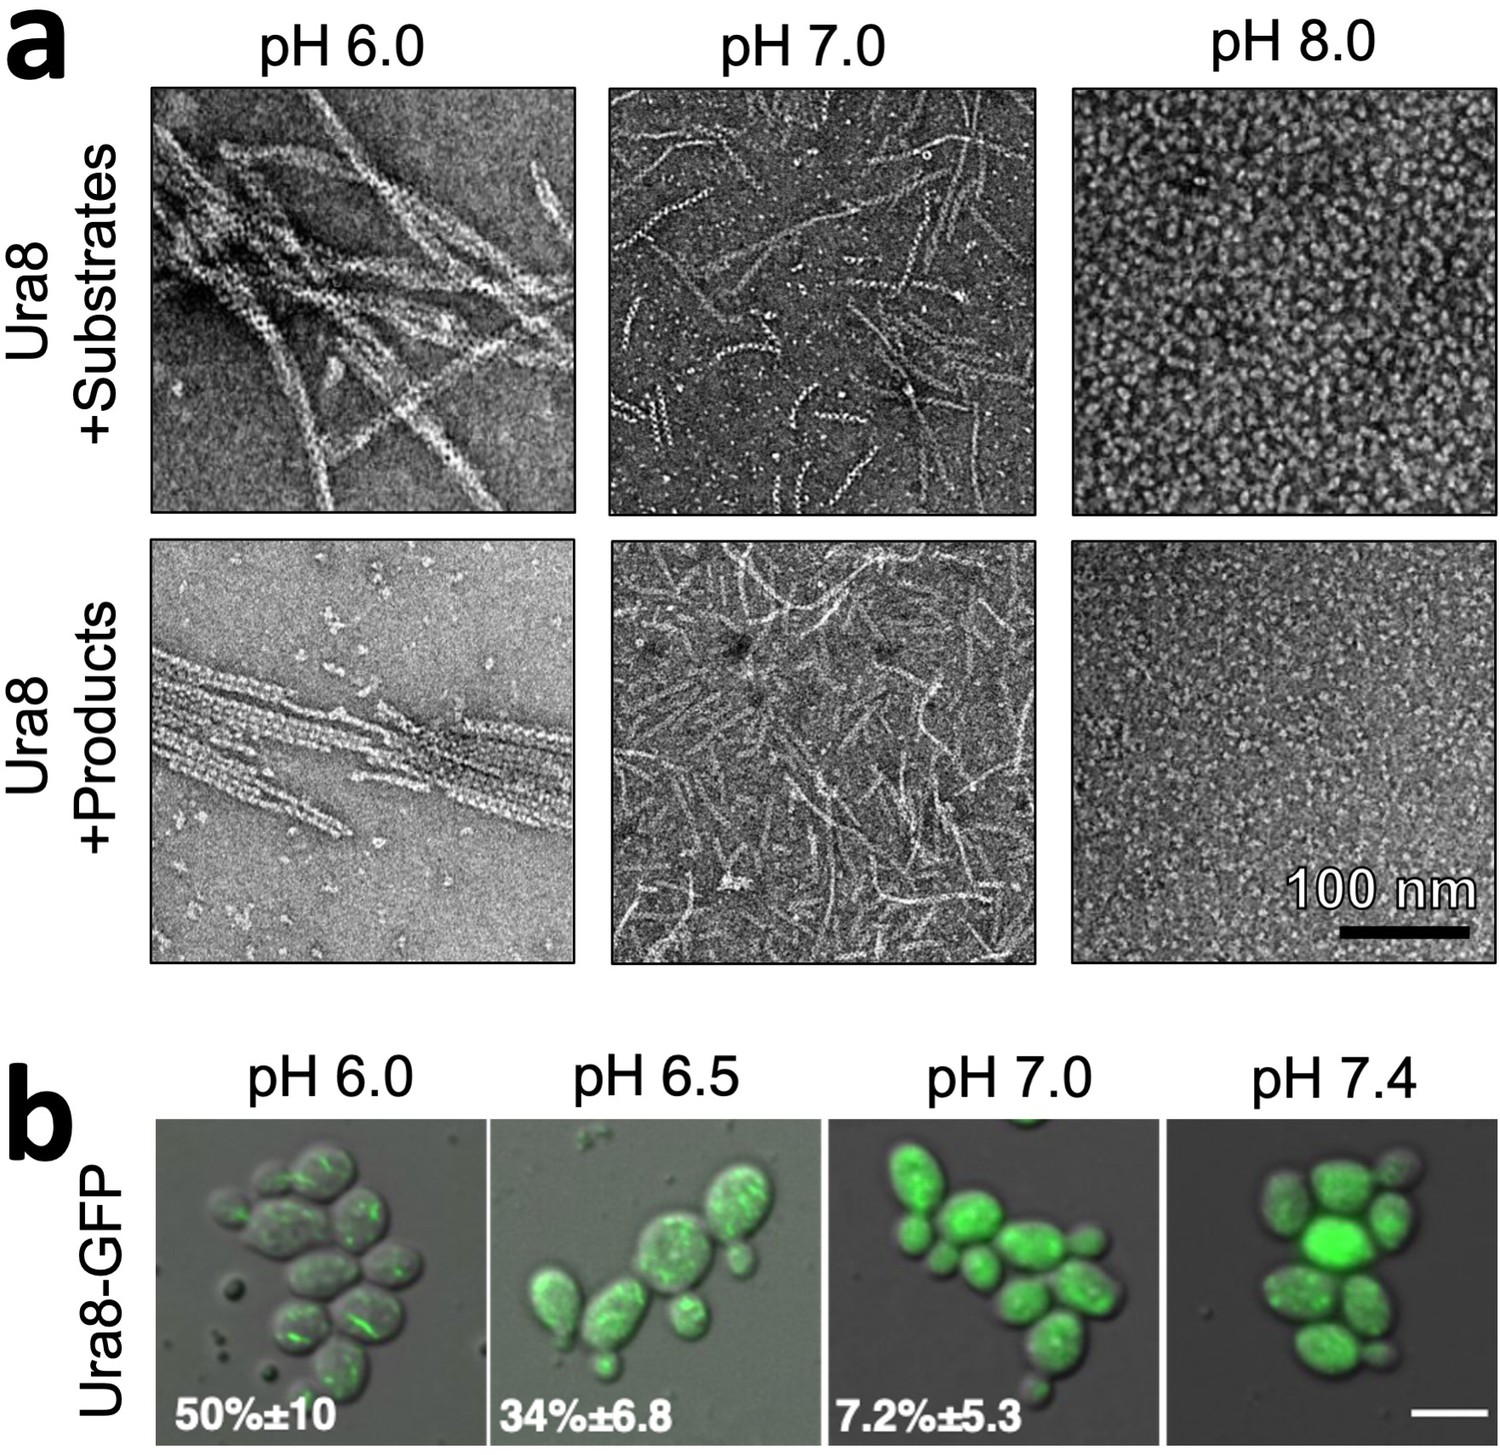
Ura8 assembly is driven by pH and substrates or products.
(a) Negative stain EM of purified recombinant Ura8 assembled with substrates (2 mM UTP/2 mM ATP) or product (2 mM CTP). (b) Yeast expressing GFP-tagged Ura8 with membrane permeabilization using 2 mM DNP and supplemented with 2 % glucose. Scale bar is 5 µm.
Figure 2—figure supplement 2

Right angle light scattering assembly kinetics for CTPS filaments.
(a) Right angle light scattering (blue line) for product-driven Ura8 assembly at pH 6.0. A single four-parameter logistic regression (red dotted line) fit to the full data (left), early (middle; 0–300 s) or late (right; 300–1500 s) time-points. Insets show zoom in of early time points. R2 is the square of the Pearson product moment correlation coefficient, representing the quality of the fit. (b) Same as panel A but for Ura7. (c) Negative stain EM of Ura7 assembly from panel B.
Figure 3 with 12 supplements
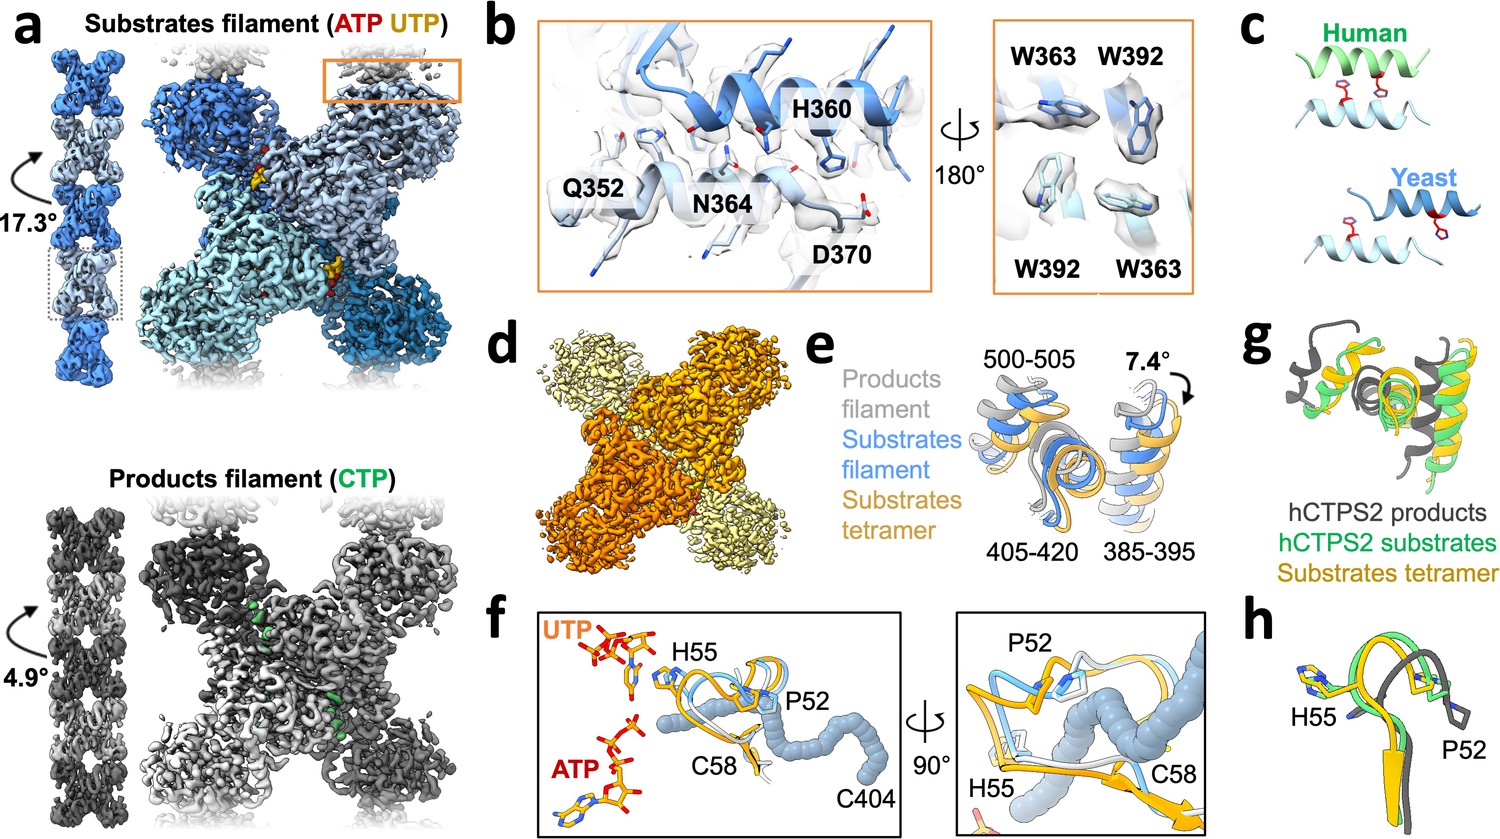
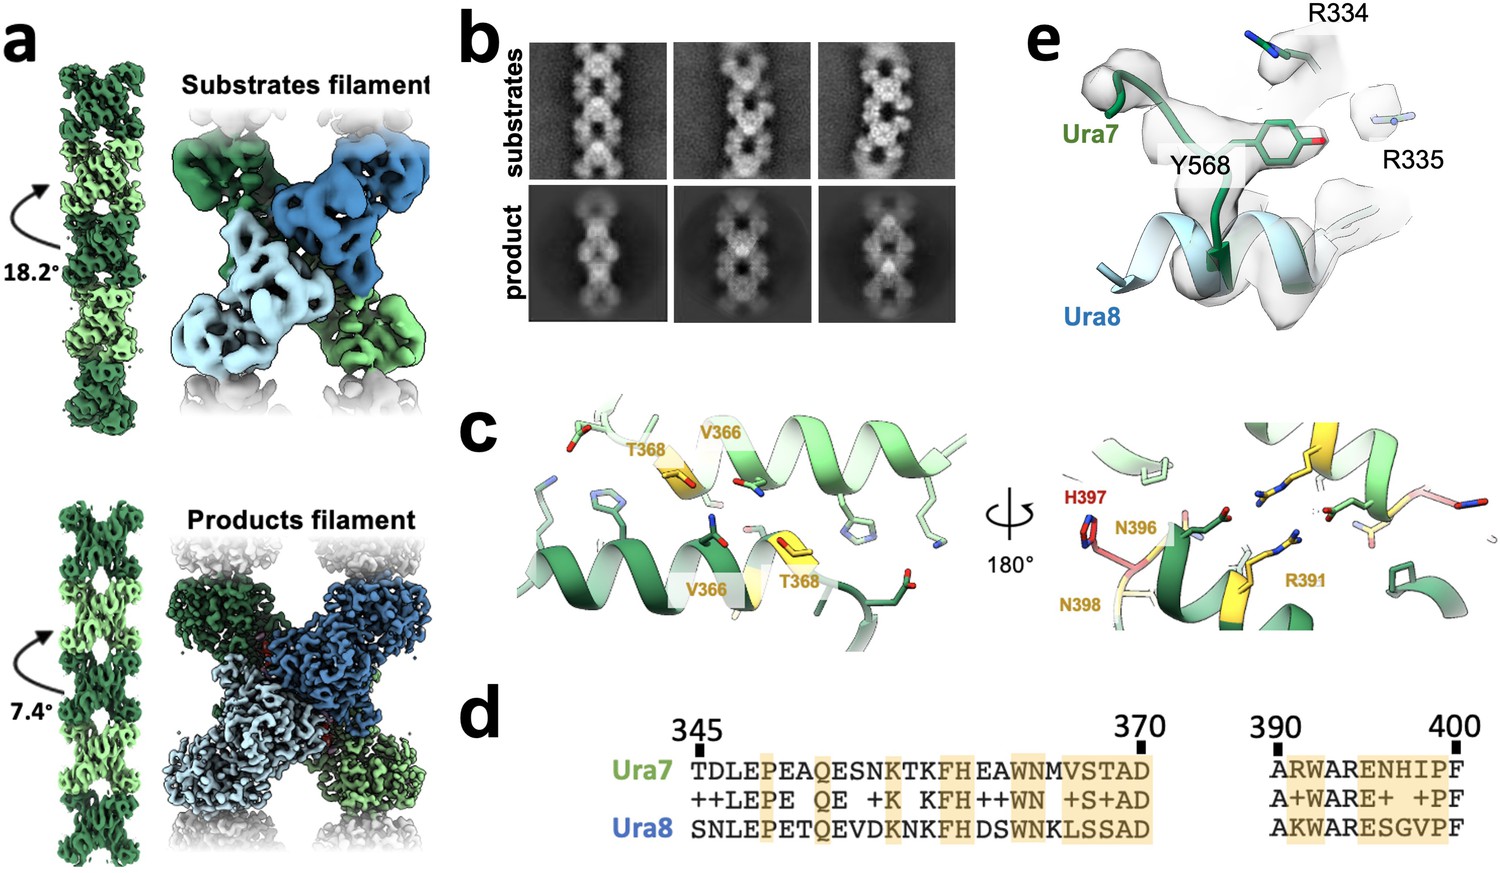
Yeast CTPS assembles distinct filaments which are not in the canonical active conformation.
(a) Cryo-EM maps of Ura8 filaments assembled at pH 6.0 in the presence of substrates (top; UTP and ATP) or product (bottom; CTP). Left, filament map from imposing helical symmetry parameters on a reconstruction of a single protomer, and low-pass filtered to 15 Å. Dotted box delineates an individual tetramer. (b) Zoom-in of the filament assembly interface (orange box in panel A) with superimposed cryo-EM density. Key residues are indicated. Right panel is the back-side view of the interface. (c) Comparison of human and yeast interface, with H360 (H355 in humans) highlighted in red. (d) Cryo-EM map of substrate-bound (ATP,UTP) tetramer at pH 7.4. (e) Glutaminase domain rotation (residues indicated) of monomers aligned on the amido-ligase domain. (f) Substrate-channel (gray tube) beginning at catalytic C404 ending at ligands UTP/ATP. Color scheme same as panel E. (g) Ura8 substrate-bound tetramer glutaminase domain rotation relative to hCTPS2 substrate (6PK4) and product-bound (6PK7) filaments. (h) Loop movements near the active site which alleviates constriction in the substrate-channel. Color scheme same as panel G.
Figure 3—figure supplement 1
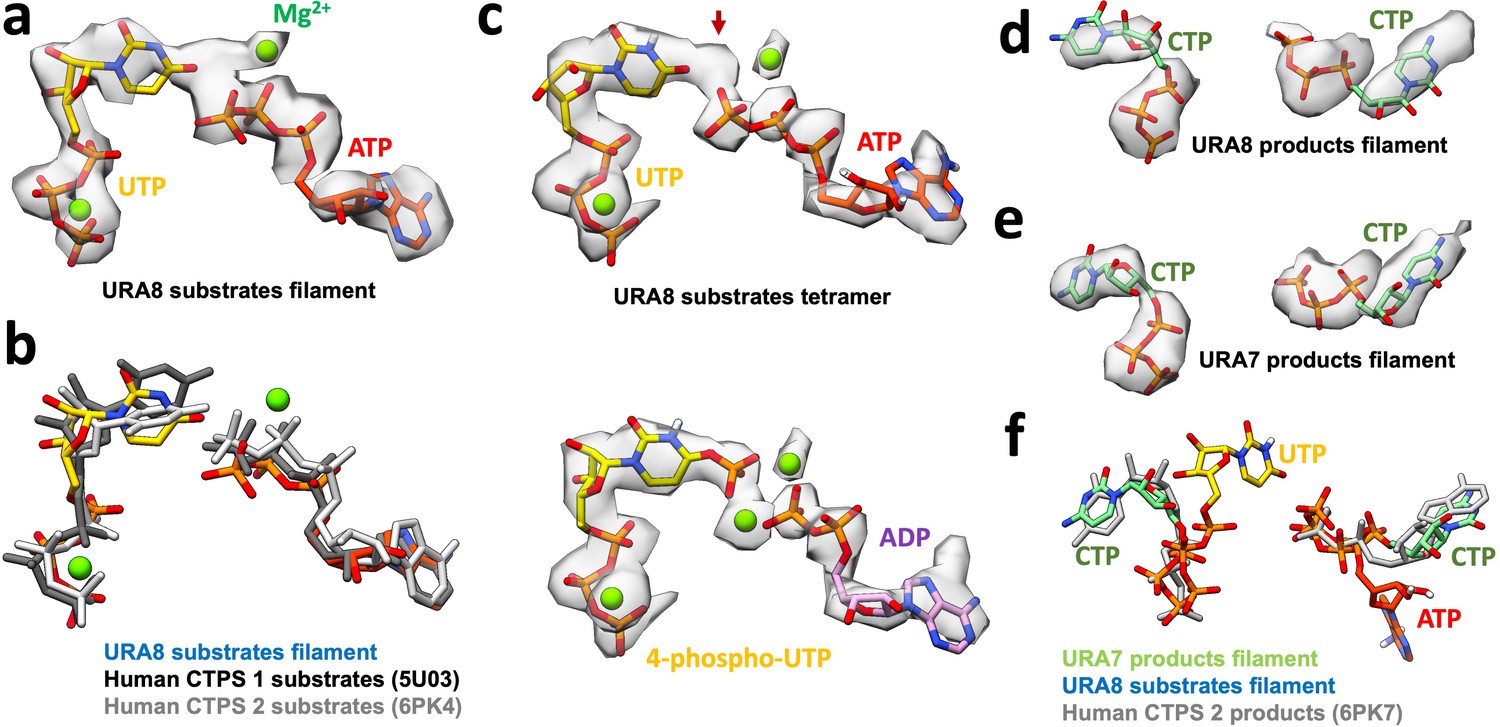
Nucleotides in yeast CTPS.
(a) Ura8 bound to ATP/UTP in filament with corresponding map density. (b) Comparison of model from panel A to published human CTPS 1 and 2 bound to substrates. (c) Ura8 bound to ATP/UTP in tetramer with corresponding map density. Arrow shows extra unknown density. Bottom panel shows the same density modeled with hydrolyzed ATP, yielding a 4-phospho-UTP intermediate in the active site. (d)(–e) CTP-bound URA8 and URA7 in filaments with corresponding density. (f) Overlay of product-bound Ura7 from panel E with published product-bound human CTPS2. Substrate-bound Ura8 filament ATP and UTP are displayed to show relative positioning of products and substrates in the active site.
Figure 3—figure supplement 2
Ura7 filament architecture and assembly interface.
(a) Cryo-EM reconstructions of Ura7 in substrate and product bound states. Left are maps generated from imposing helical symmetry parameters on a reconstruction of a single protomer. (b) Selected 2D class averages of substrate- or product-bound Ura7. (c) Ura7 filament interface. Residues painted similar (yellow) and different (red) from Ura8. In addition, Ura7 assembles with the W363/W392 hydrophobic core shown in Figure 3. (d) Sequence alignment of filament assembly interface for Ura7 (top) and Ura8 (bottom). Residues participating in interface assembly are highlighted in yellow.
Figure 3—figure supplement 3
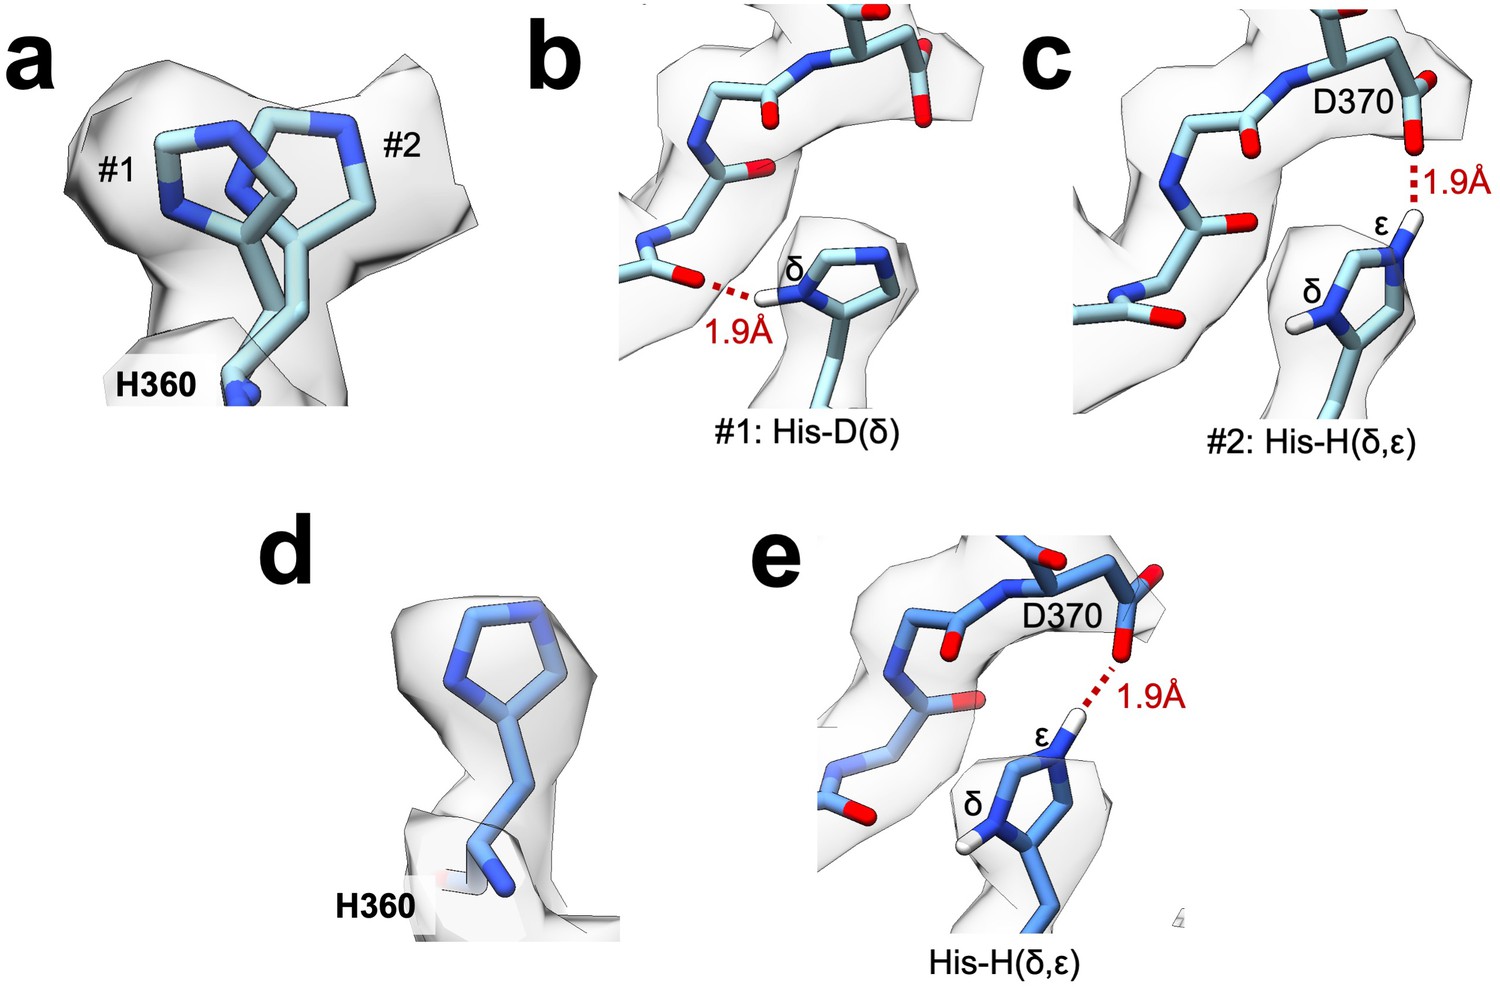
Protonation state at the filament assembly interface.
(a) Substrate-bound Ura8 filament map density for H360 with two possible rotamers modeled. Note that this view is rotated slightly relative to panels b-c. (b) Single-protonation state (His-D) of H360 hydrogen of rotamer #1 from panel A bonding with a backbone carbonyl across the interface. (c) Double-protonation state (His-H) of rotamer #2 from panel A driven by low pH leads to an ionic interaction of epsilon hydrogen with D370. (d) Similar to panel A, for His360 from substrate-bound Ura8 bundle. (e) Double-protonation state of H360 making an ionic interaction with D370 in substrate-bound Ura8 bundle.
Figure 3—figure supplement 4
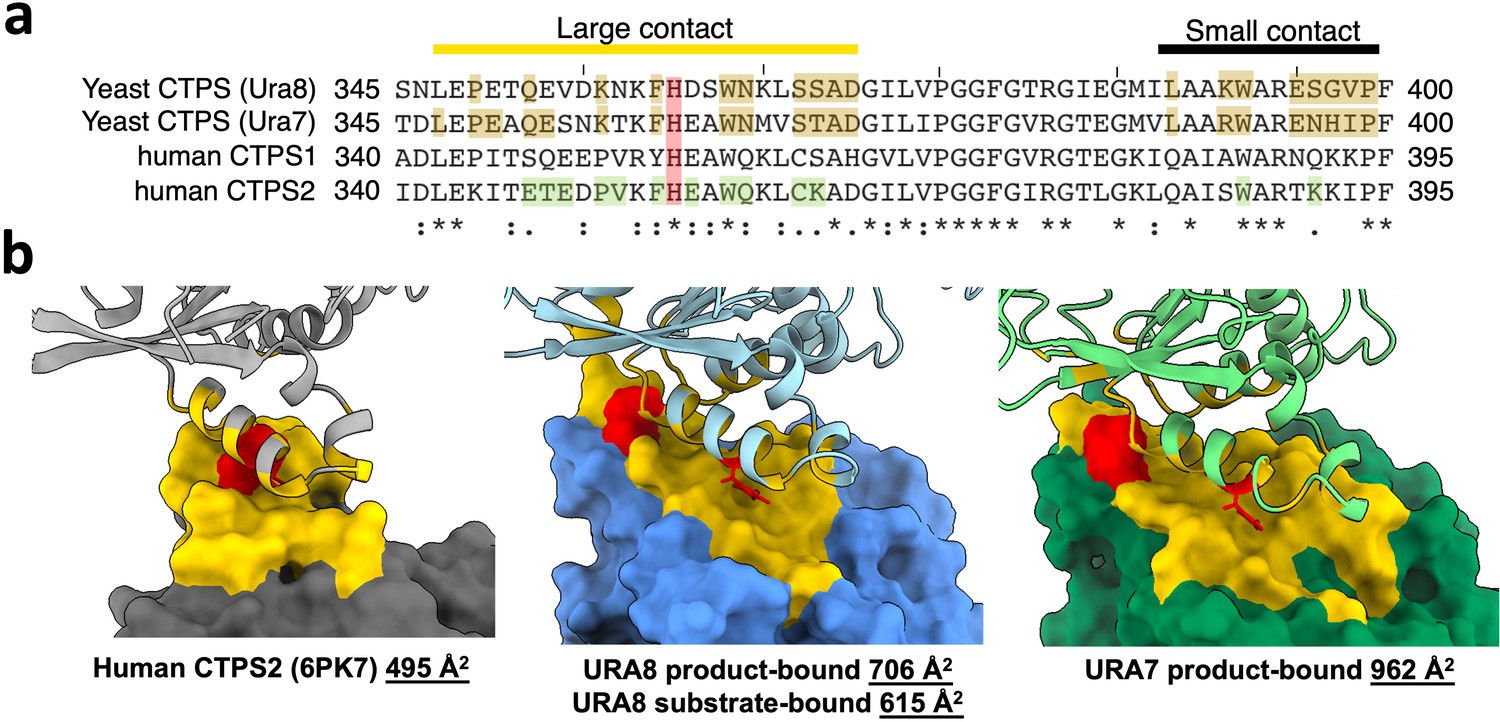
Comparison of buried surface area for yeast and human CTPS.
(a) Sequence alignment of filament assembly interface for human and yeast isoforms. Residues highlighted in brown and green correspond to filament assembly contacts for yeast and human CTPS, respectively. Conserved histidine highlighted in red. (b) Calculated buried surface area for one monomer of human or yeast CTPS with interfacing residues painted yellow. H360 (H355 in humans) is colored in red.
Figure 3—figure supplement 5
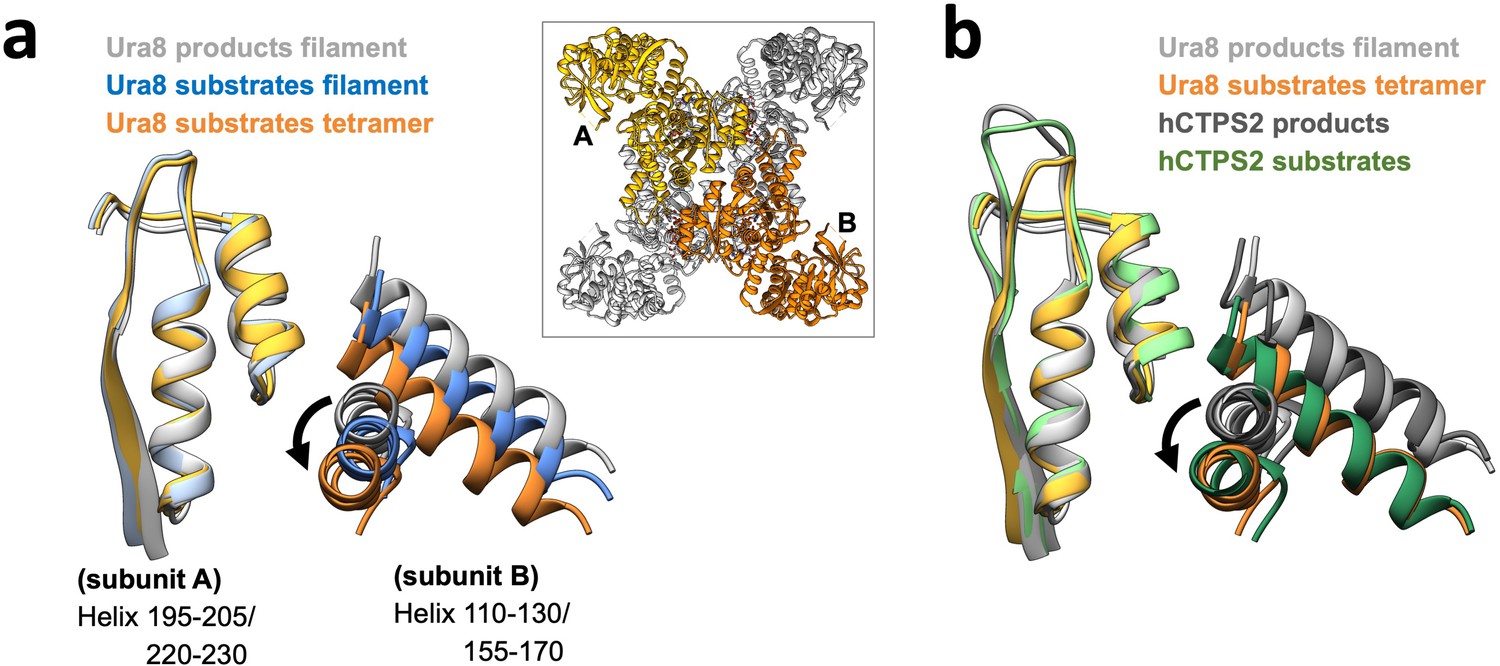
Amido-ligase domain movement at the tetramerization interface.
(a) Helices at the tetramerization interface for a transverse pair of monomers (A and B in inset). Models aligned on subunit A helices (left) to show relative movement of subunit B. (b) Models of yeast CTPS (Ura8) helices from panel A shown relative to published human CTPS2 (6PK4 substrates; 6PK7 products).
Figure 3—figure supplement 6
CTPS filaments are incompatible with the active state.
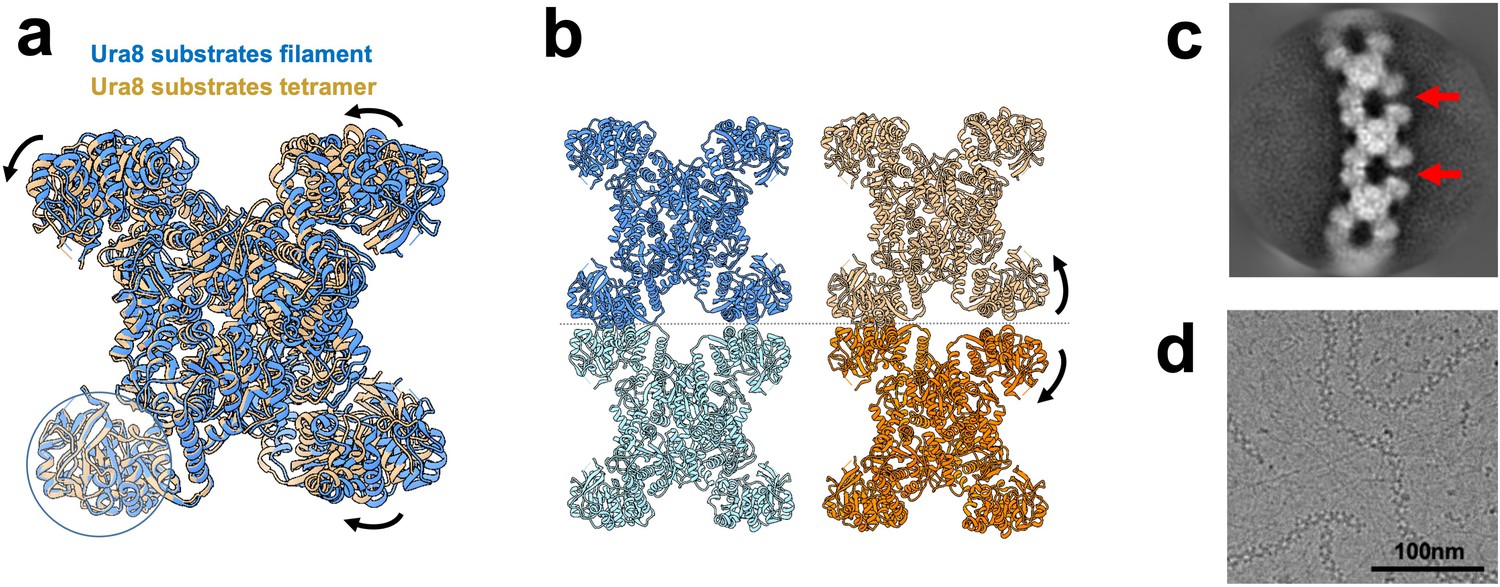
(a) Tetramer models for substrate-bound Ura8 in a filament (low pH) or unassembled (high pH). Models aligned on the glutaminase domain for one monomer (circled) and the resulting movement is shown with arrows. (b) Substrate-bound Ura8 filament (blue, left) used for alignment of two substrate-bound tetramers (right) on the contacting glutaminase domains as done in panel A. When tetramers are aligned on the left glutaminase domain, the opposing (right) interface splays open, disrupting filament architecture. (c) Representative 2D class average of substrate-bound Ura7 showing breaking of filaments described in panel B. (d) Example cryo-EM micrograph of substrate-bound Ura7 at low pH.
Figure 3—figure supplement 7

Image processing of substrate-bound Ura8 filaments.
(a) Flowchart overview of the data processing strategy. (b) Example micrograph from the dataset. (c) FSC curve from Relion postprocess and Phenix density modification. (d) Local resolution estimation.
Figure 3—figure supplement 8
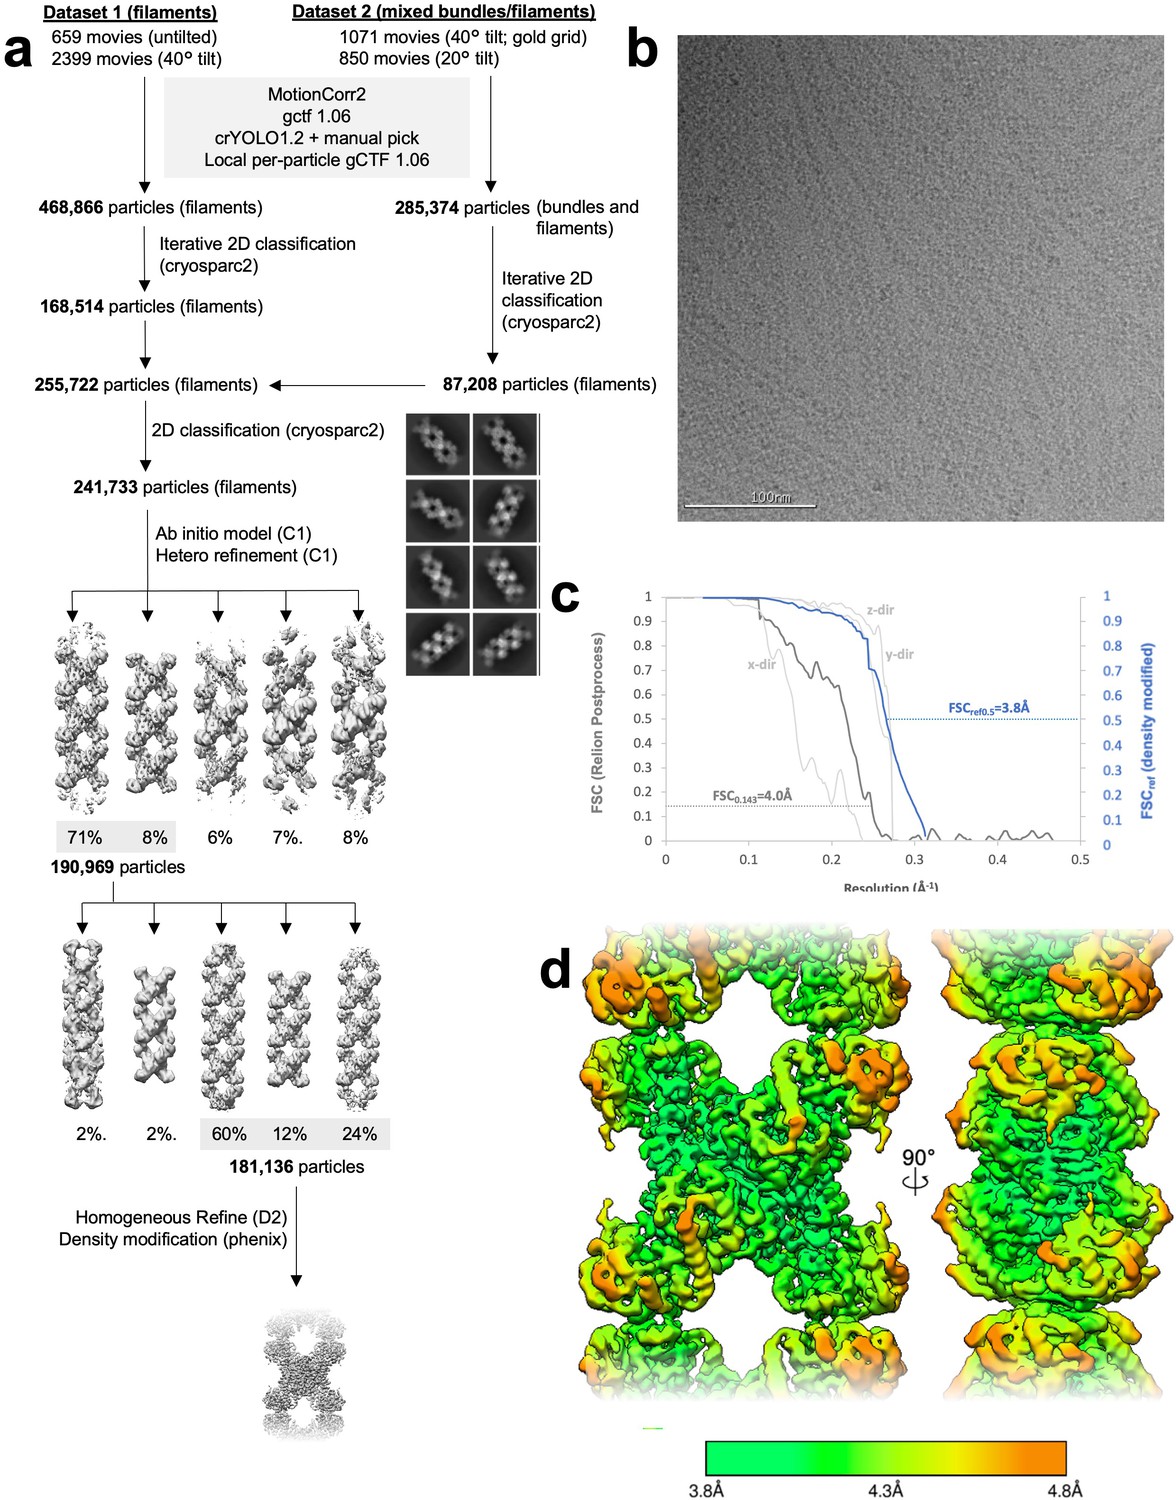
Image processing of product-bound Ura8 filaments.
(a) Flowchart overview of the data processing strategy. (b) Example micrograph from the dataset. (c) FSC curve from Relion postprocess and Phenix density modification. Light gray is 3D FSC for X/Y/Z directions. (d) Local resolution estimation.
Figure 3—figure supplement 9
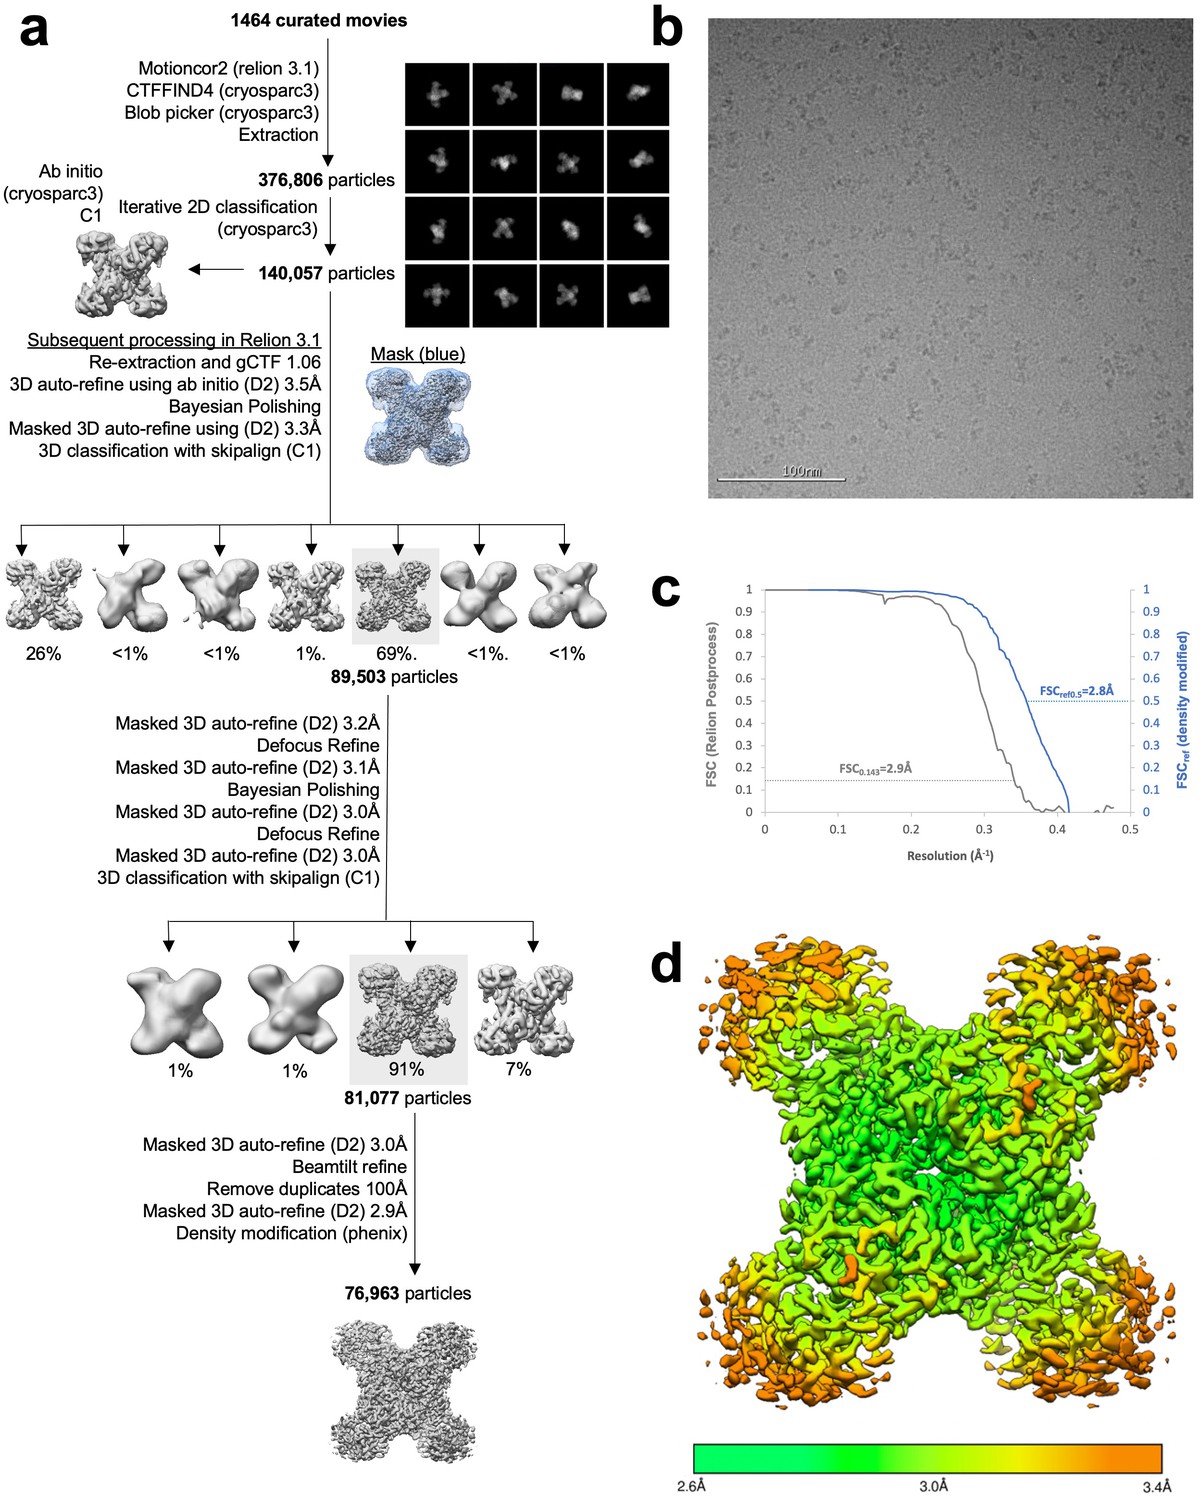
Image processing of substrate-bound Ura8 tetramers.
(a) Flowchart overview of the data processing strategy. (b) Example micrograph from the dataset. (c) FSC curve from Relion postprocess and Phenix density modification. (d) Local resolution estimation.
Figure 3—figure supplement 10

Image processing of substrate-bound Ura7 filaments.
(a) Flowchart overview of the data processing strategy. (b) Example micrograph from the dataset. (c) FSC curve from Relion postprocess. (d) Local resolution estimation.
Figure 3—figure supplement 11
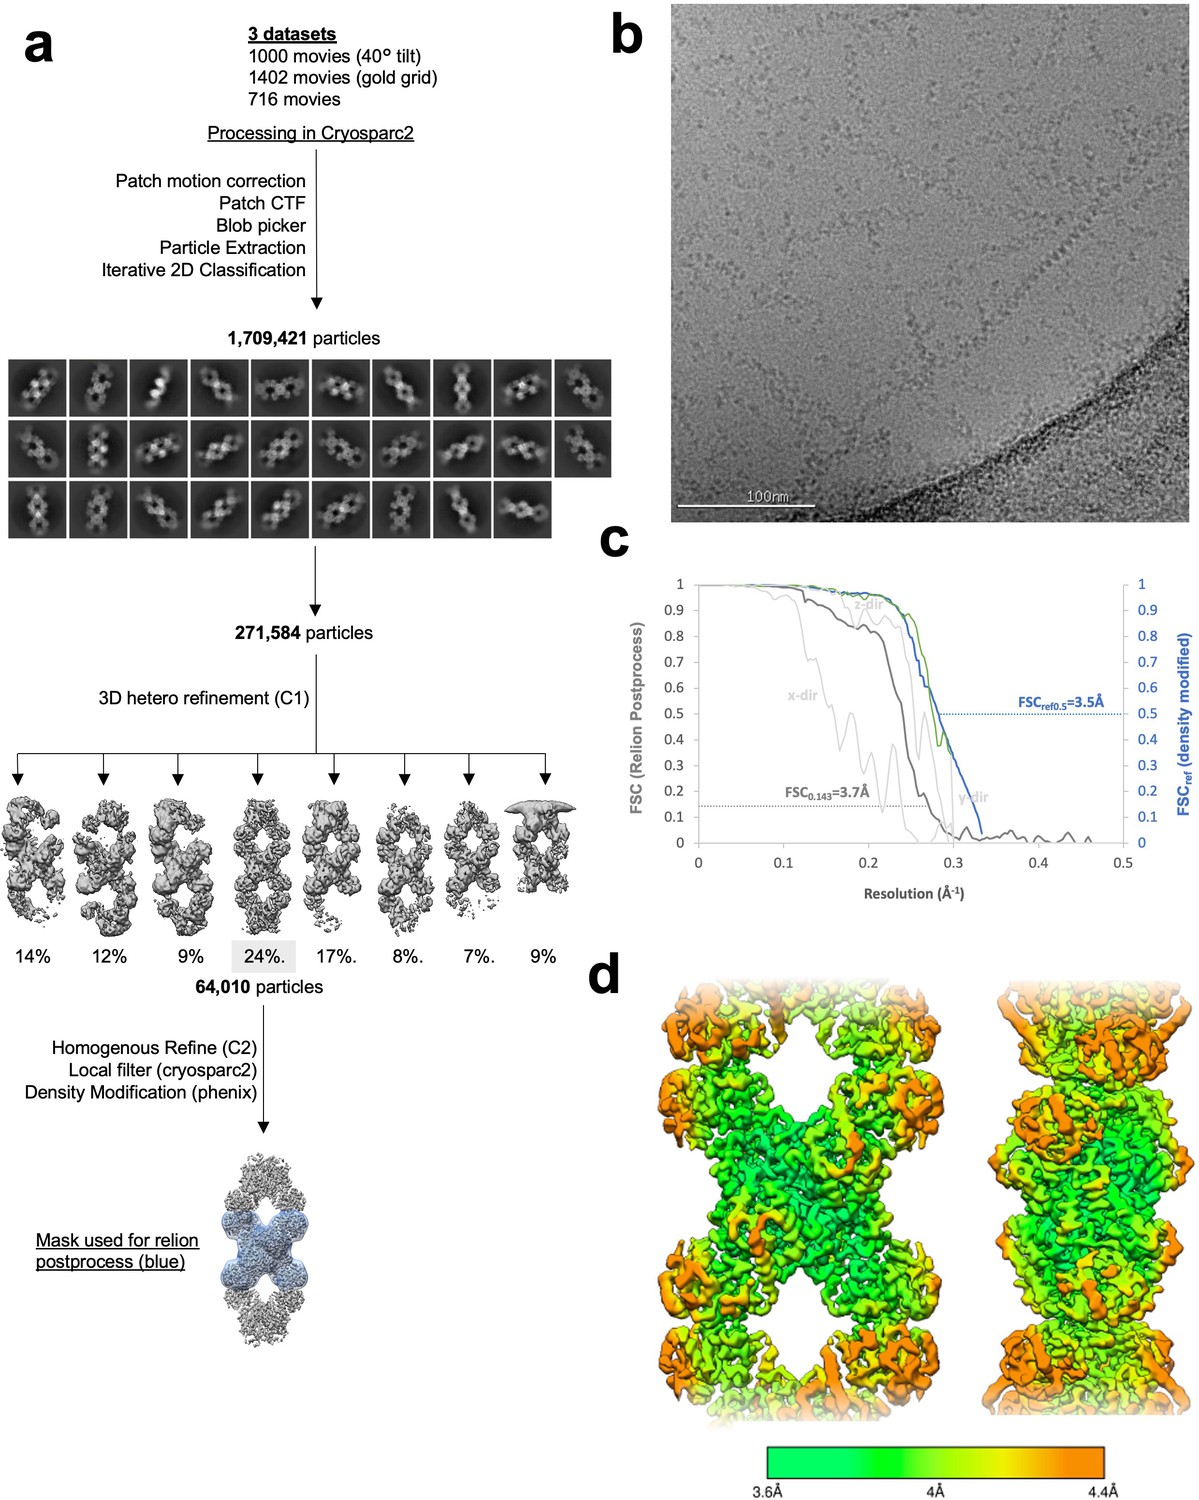
Image processing of product-bound Ura7 filaments.
(a) Flowchart overview of the data processing strategy. (b) Example micrograph from the dataset. (c) FSC curve from Relion postprocess and Phenix density modification. Light gray is 3D FSC for X/Y/Z directions. (d) Local resolution estimation.
Figure 3—video 1
Ura8 conformational changes.
Model morph from Ura8 product-bound filament to substrates-bound filament to substrate-bound tetramer. Ligands are shown at each step.
Figure 4 with 3 supplements
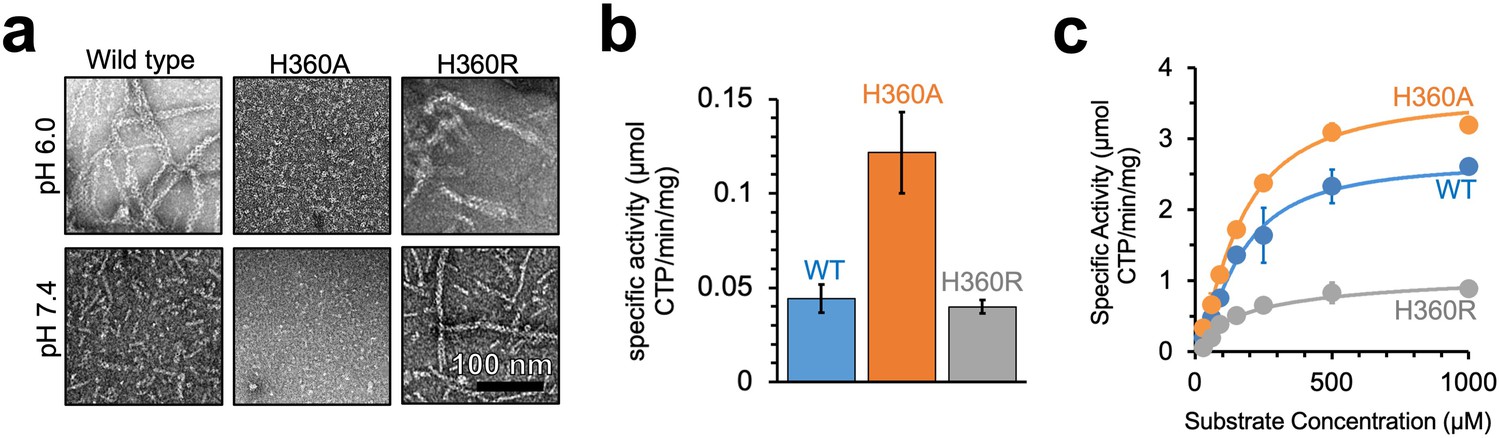
Yeast CTPS polymers reduce enzymatic activity.
(a) Negative stain EM of purified wild type and mutant Ura7 with addition of 2 mM CTP. (b) Activity assay with saturating substrates of Ura7 and mutants at pH 6.0. (c) Substrate kinetics of wild type and mutant Ura7 at pH 7.4 with four parameter regression curve fits. Experiments done in triplicate, error bars are standard error of the mean (SEM).
Figure 4—figure supplement 1
Ura7 H360R ligand-dependent assembly.
Negative stain EM of Ura7 H360R assembly at low and high pH with addition of substrates (2 mM UTP/2 mM ATP) or product (2 mM CTP).
Figure 4—figure supplement 2

Ura7 H360R structural validation.
(a) SDS-PAGE gel of wild type and mutants purified in tandem. (b) Representative 2D class averages of product-bound Ura7 wild type, and product or substrate-bound Ura7 H360R. (c) 3D reconstruction of substrate-bound Ura7 H360R with two monomers placed by rigid body fit of domains. (d) Zoom in from box in panel C of Ura7 H360R assembly interface with arginines modeled at residue 360. (e) Wild type Ura7 interface. (f) Nucleotide density from reconstruction in panel c.
Figure 4—figure supplement 3
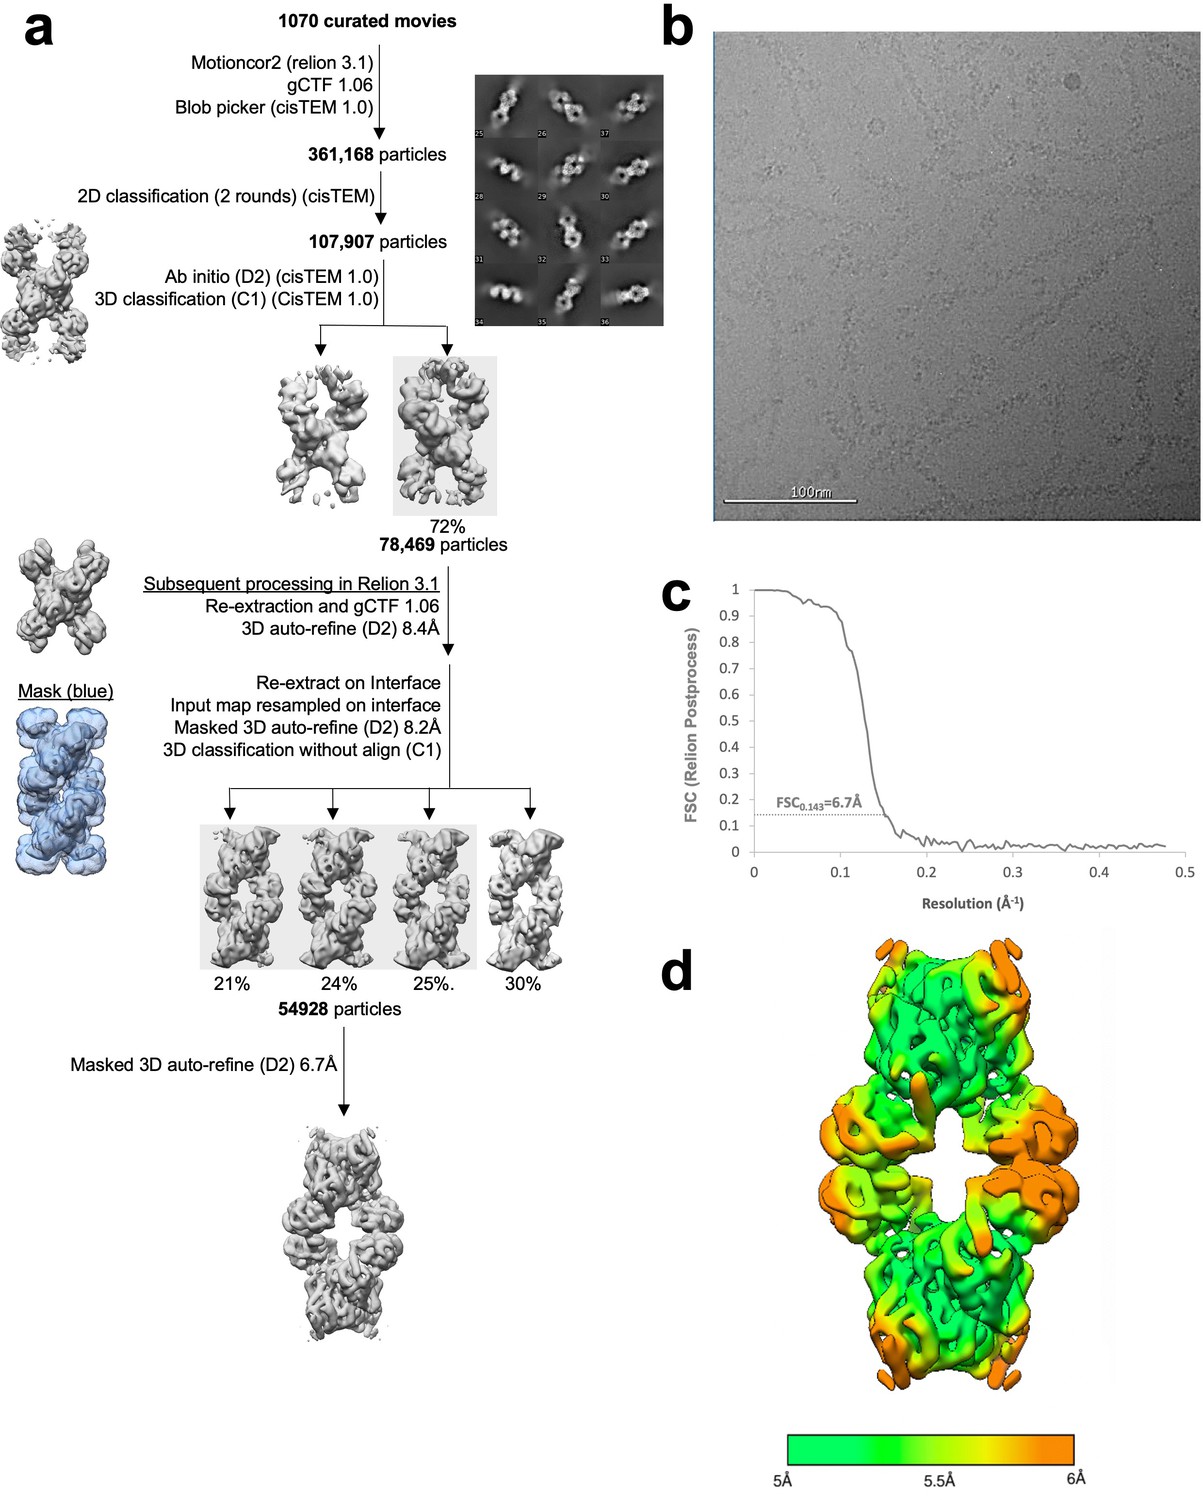
Image processing of substrate-bound Ura7-H360R at pH 7.5.
(a) Flowchart overview of the data processing strategy. (b) Example micrograph from the dataset on continuous carbon. (c) FSC curve from Relion postprocess. (d) Local resolution estimation.
Figure 5 with 7 supplements

Dysregulated assembly of CTPS in yeast leads to slowed growth.
(a) Yeast expressing GFP-tagged Ura7. Quantification is the percentage of cells showing foci. Scale bar is 5 µm. (b) Polymerization kinetics of GFP-tagged Ura7 in yeast upon transfer of cells to starvation media. (c) Same as B, for depolymerization kinetics upon re-addition of starved cells (4 hr) to nutrient-rich media. Scale bar is 5 µm. (d) Spot growth assay of yeast expressing wild type and mutant CTPS from liquid cultures grown in log phase. 1 in 10 dilutions increase from left to right. (e) Same as D, for yeast starved for 4 hr and allowed to recover on nutrient-rich solid media.
Figure 5—figure supplement 1
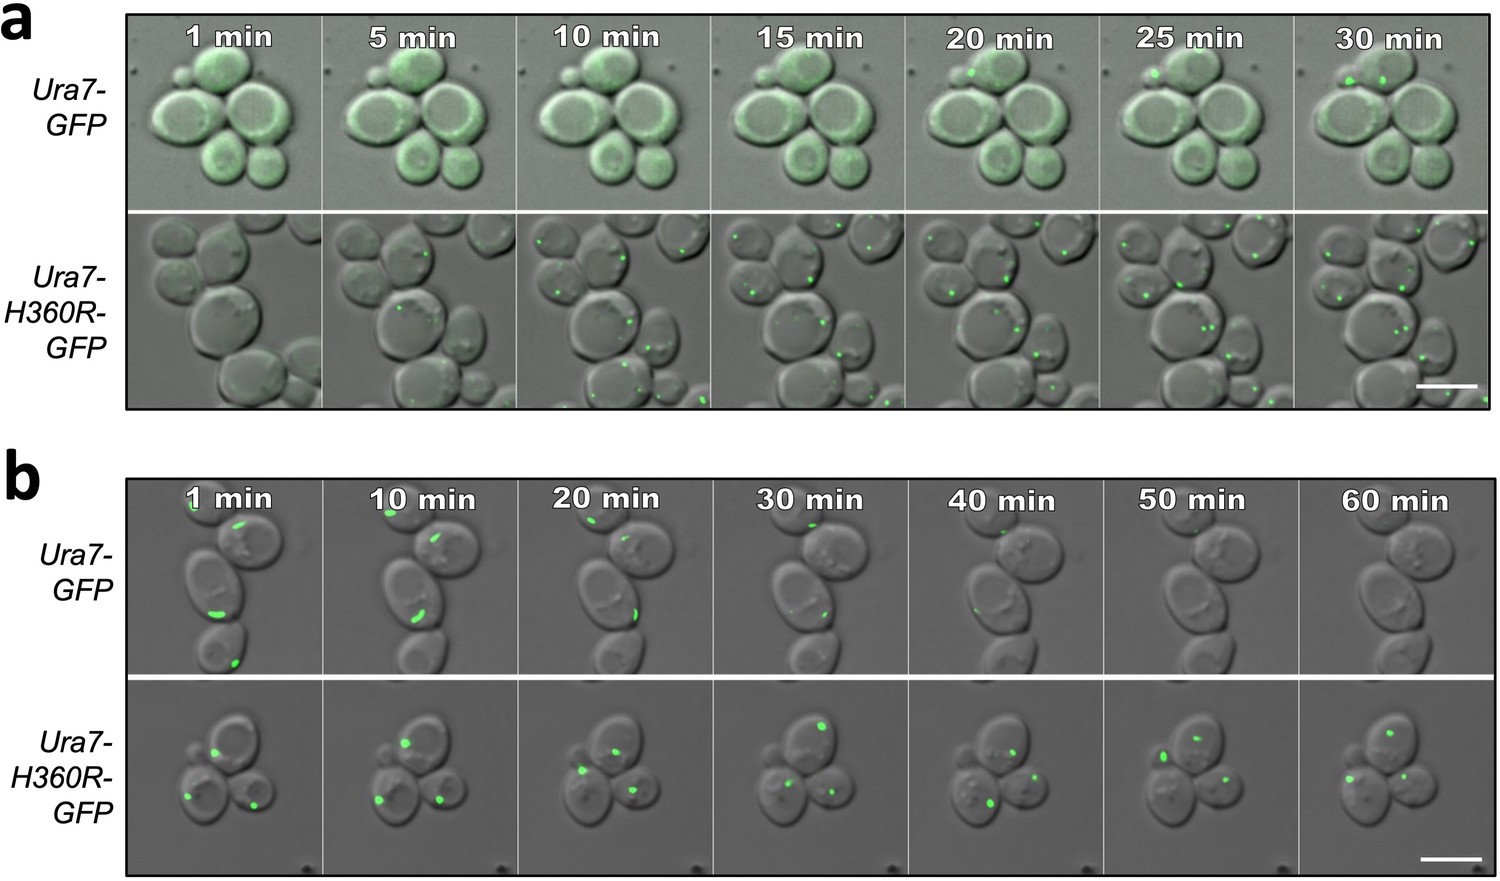
Ura7 assembly and disassembly kinetics.
(a) Yeast expressing GFP-tagged Ura7 upon transfer from log-phase growth conditions to minimal starvation media (at time 0). Scale bar is 5 µm. (b) Yeast expressing GFP-tagged Ura7 after 4 hr starvation upon transfer to nutrient-rich media. Scale bar is 5 µm.
Figure 5—figure supplement 2
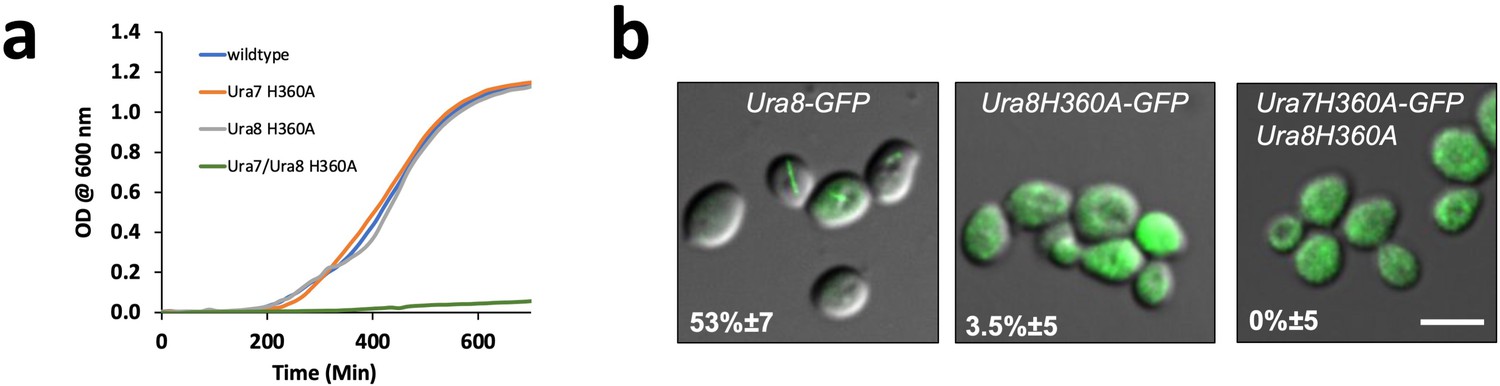
URA8 non-assembly mutant.
(a) Liquid culture growth curve for wild type and mutant Ura7 and Ura8. (b) GFP-tagged Ura8 wild type and mutant after 4 hr of starvation. Scale bar is 5 µm.
Figure 5—figure supplement 3
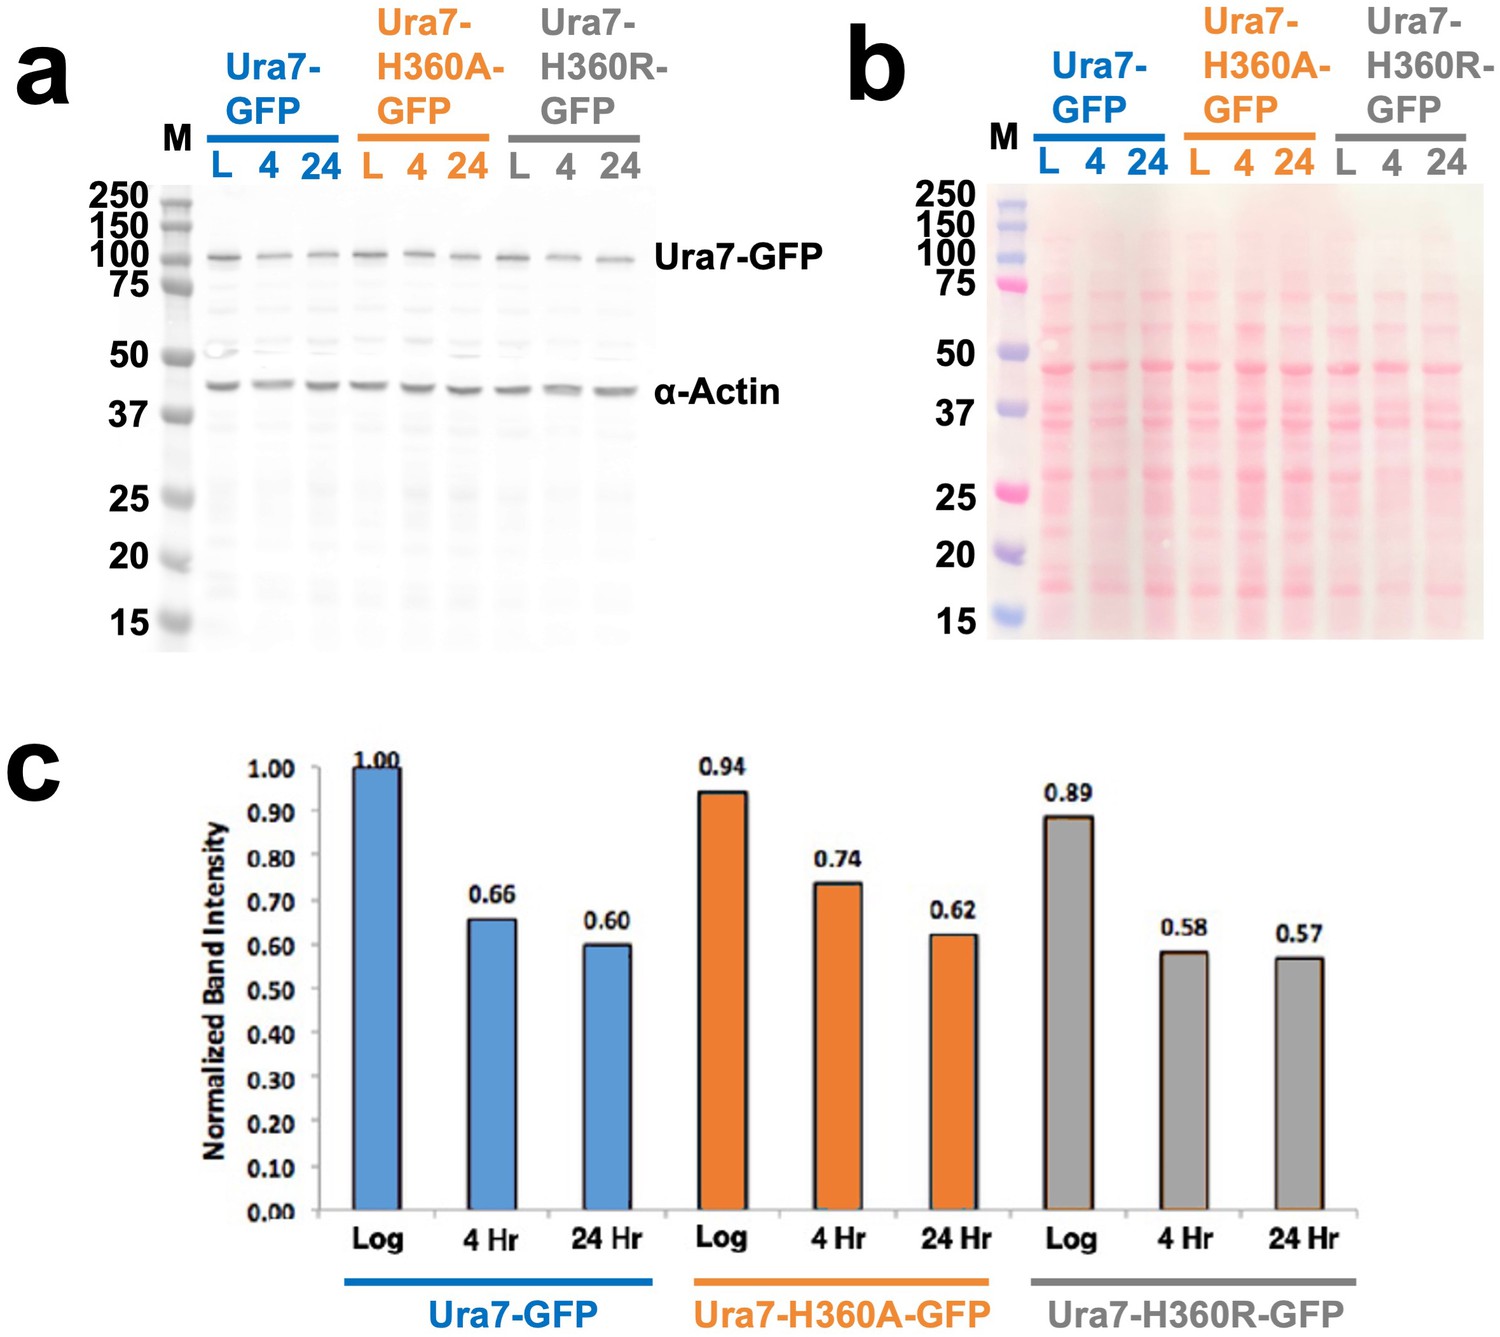
Ura7 quantification from yeast cell lysates.
(a) GFP-Ura7 expressed in yeast and quantified by Western blot. Wells were normalized by OD600 of cells, and Ura7 levels were assessed by anti-GFP antibody with anti-actin control. Ura7 was assessed in log phase (“L”), and after 4 or 24 hr of starvation. Ladder, left, is in kilo-dalton. (b) Ponceau stain of western blot from panel a. (c) Quantification of band intensity from panel A, relative to the most intense band, are displayed above each bar.
Figure 5—video 1
Wild-type Ura7 polymerization.
Yeast expressing wild-type GFP-Ura7 upon transfer to starvation media. Scale bar is 5 µm.
Figure 5—video 2
Ura7-H360R polymerization.
Yeast expressing GFP-Ura7-H360R upon transfer to starvation media. Scale bar is 5 µm.
Figure 5—video 3
Wild-type Ura7 depolymerization.
Yeast expressing wild-type GFP-Ura7 after 4 hr of starvation then transferred to nutrient-rich media. Scale bar is 5 µm.
Figure 5—video 4
Wild-type Ura7-H360R depolymerization.
Yeast expressing GFP-Ura7-H360R after 4 hr of starvation then transferred to nutrient-rich media. Scale bar is 5 µm.
Figure 6 with 14 supplements
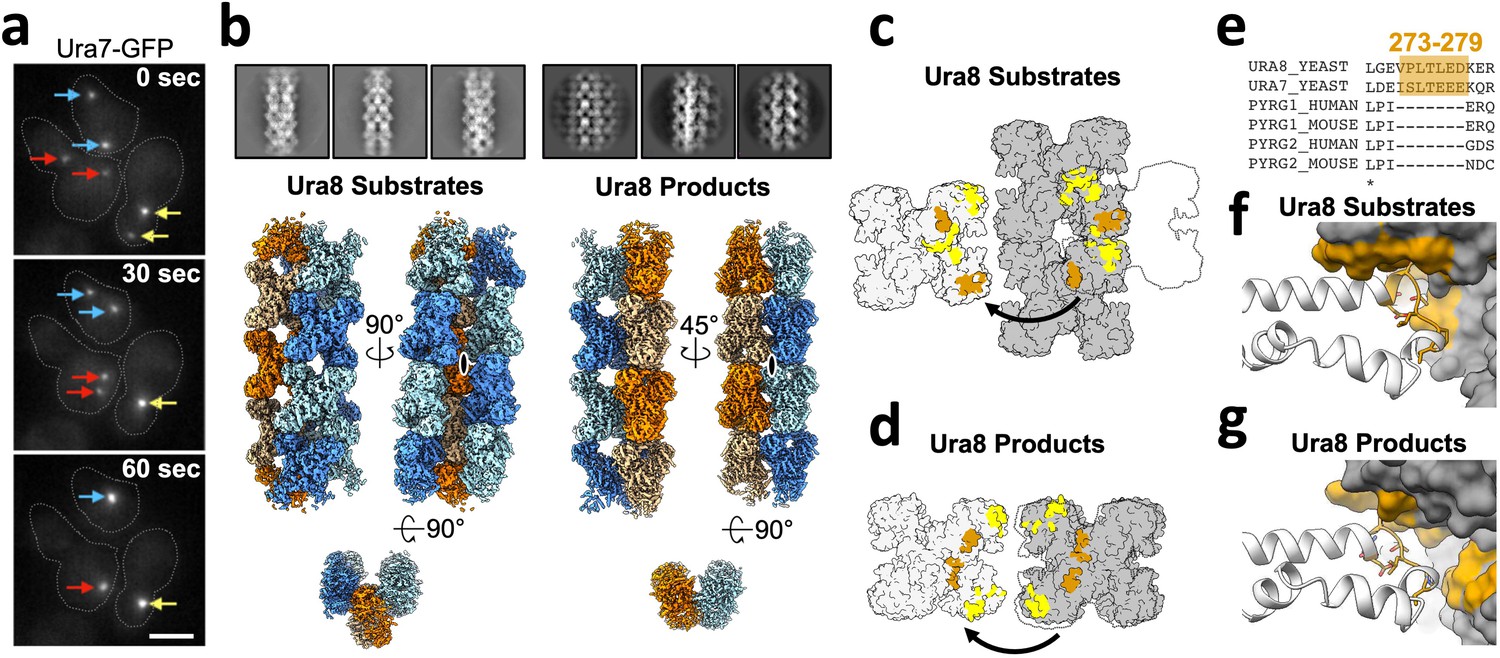
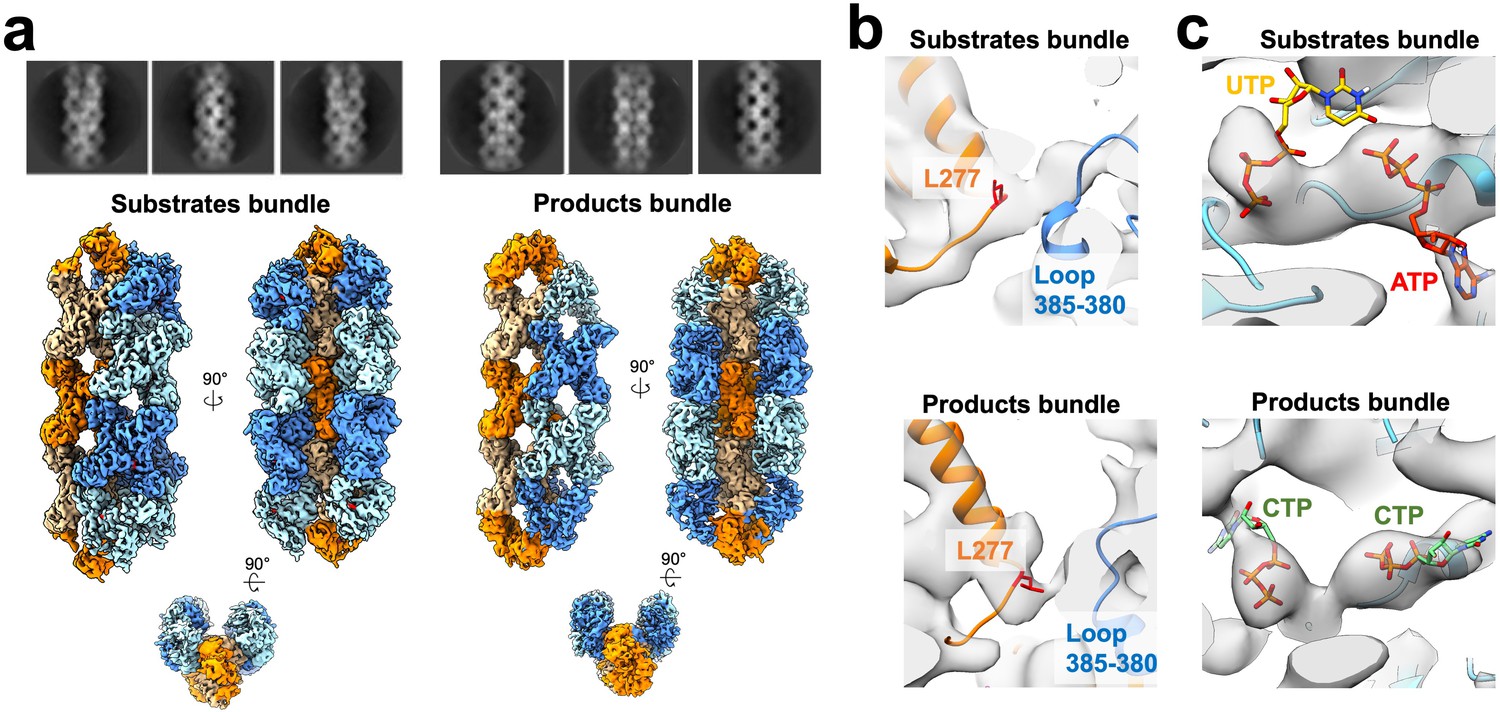
Yeast CTPS assembles highly ordered and distinct bundle architectures.
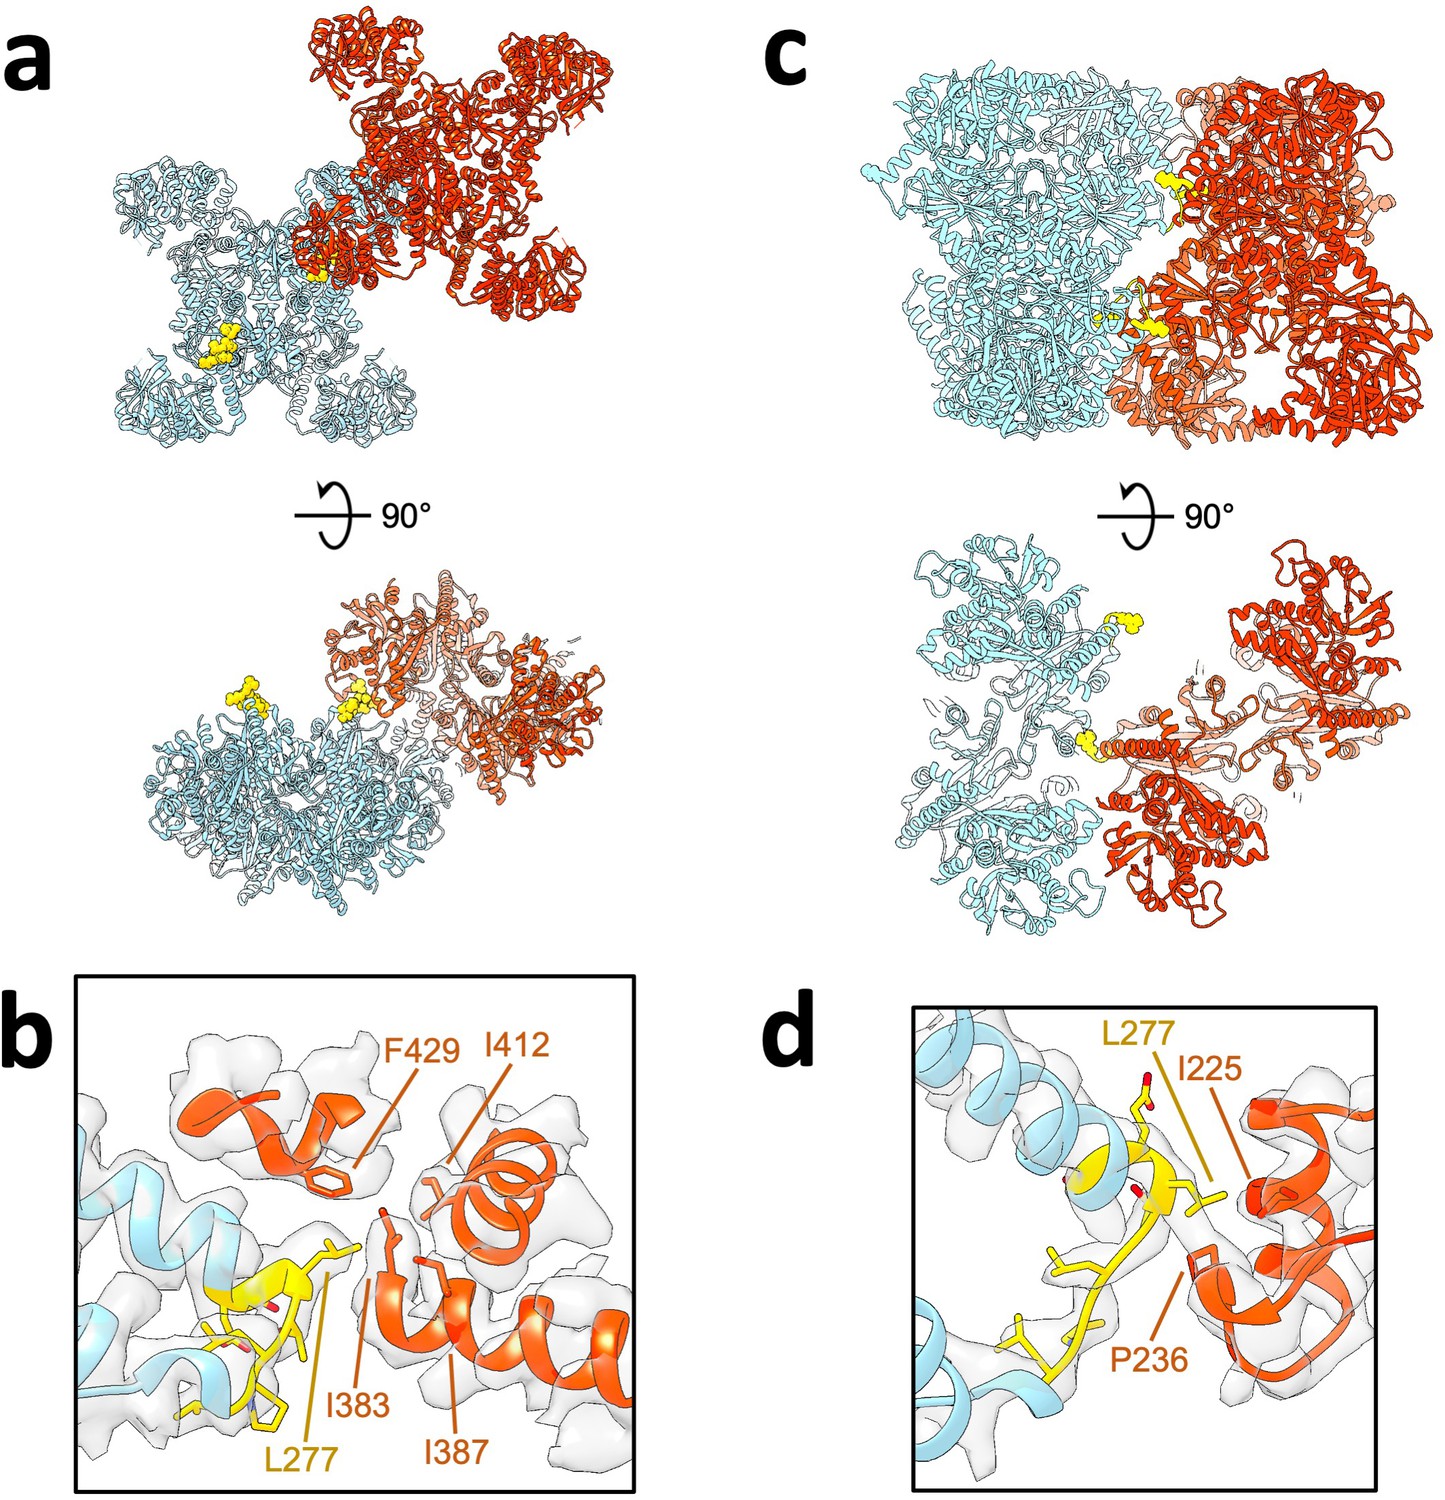
(a) Live imaging in yeast expressing GFP-tagged Ura7. Same colored arrows indicate pairs of foci that join to larger foci at later time points. Time indicated is seconds after imaging began. Cell outlines drawn manually. Scale bar 5 µm. (b) Cryo-EM 2D averages and 3D reconstructions of Ura8 in the substrate (2 mM UTP/ATP) and product-bound (2 mM CTP) states. Individual strands colored in either orange or blue with protomers shaded differently. C2 symmetry axes are shown as ovals, with axis of rotation projecting toward the reader. (c) Lateral interactions in the substrate-bound Ura8 bundle. Full contacts are painted yellow for a single tetramer (gray on left), including redundant interactions. The yeast-specific linker insert and the interface with which it interacts are painted brown. (d) Same as C, for product-bound Ura8 bundle. (e) Sequence alignment of the CTPS linker region showing the yeast-specific insert at the specified yeast residues. (f) Zoom-in of the yeast linker insert of the substrate-bound bundles interacting with the adjacent strand. Numbering is the same as panel C. (g) Same as panel F, for product-bound bundle. Numbering is the same as panel D.
Figure 6—figure supplement 1
Ura7 bundle architecture.
(a) Ura7 substrate- (2 mM UTP/2 mM ATP) and product- (2 mM CTP) bound cryo-EM 2D averages and 3D reconstructions. (b) Lateral contact mediated by yeast linker region (orange) with adjacent strand. Residue 277 is highlighted in red (see text). (c) Nucleotides in the active site with corresponding density.
Figure 6—figure supplement 2
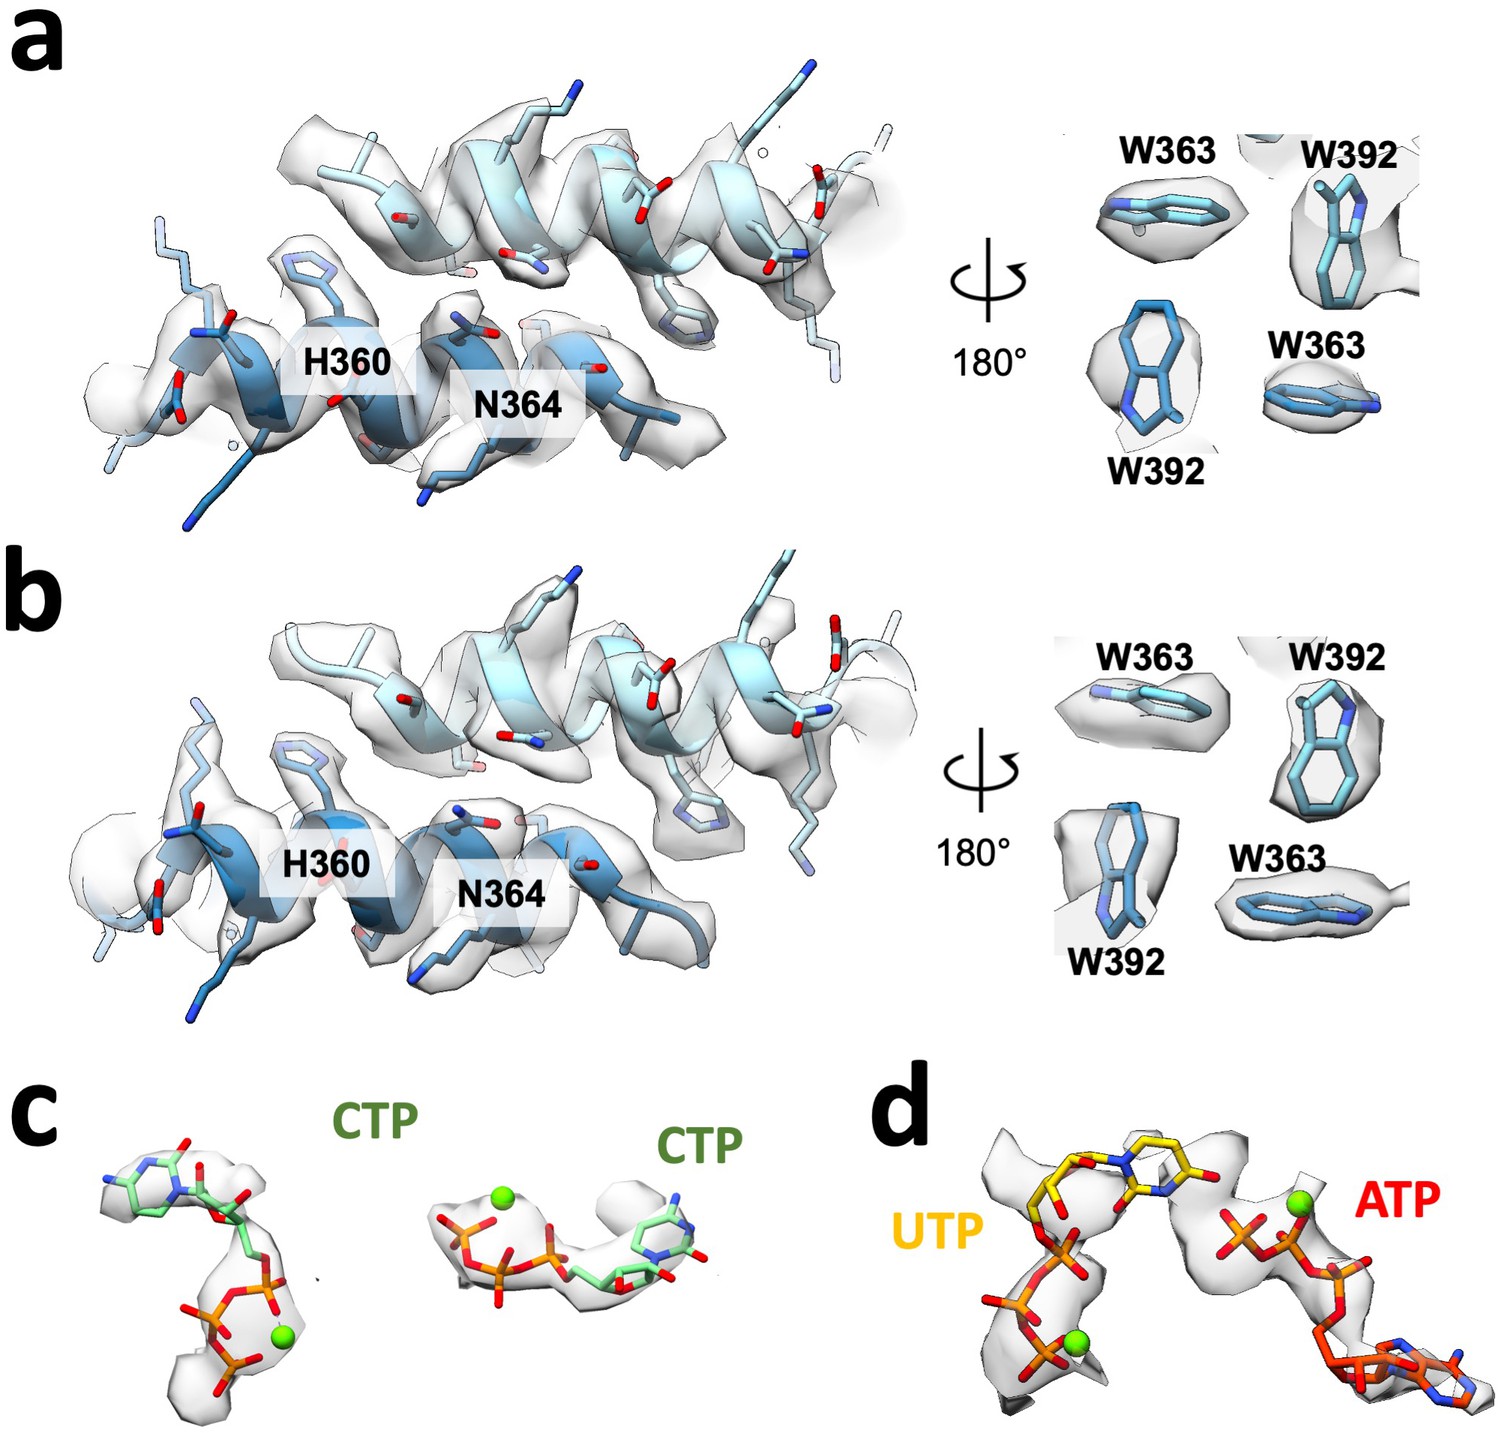
Filament assembly interface and nucleotides for Ura8 in bundles.
(a) Assembly interface and corresponding density for an individual product-bound Ura8 strand while in a bundle. Key residues are indicated. (b) Assembly interface as in A, except for substrate-bound Ura8 bundle. (c–d) Nucleotides and corresponding density for substrate (c; 2 mM UTP/2 mM ATP) and product-bound (d; 2 mM CTP) bundle reconstructions.
Figure 6—figure supplement 3
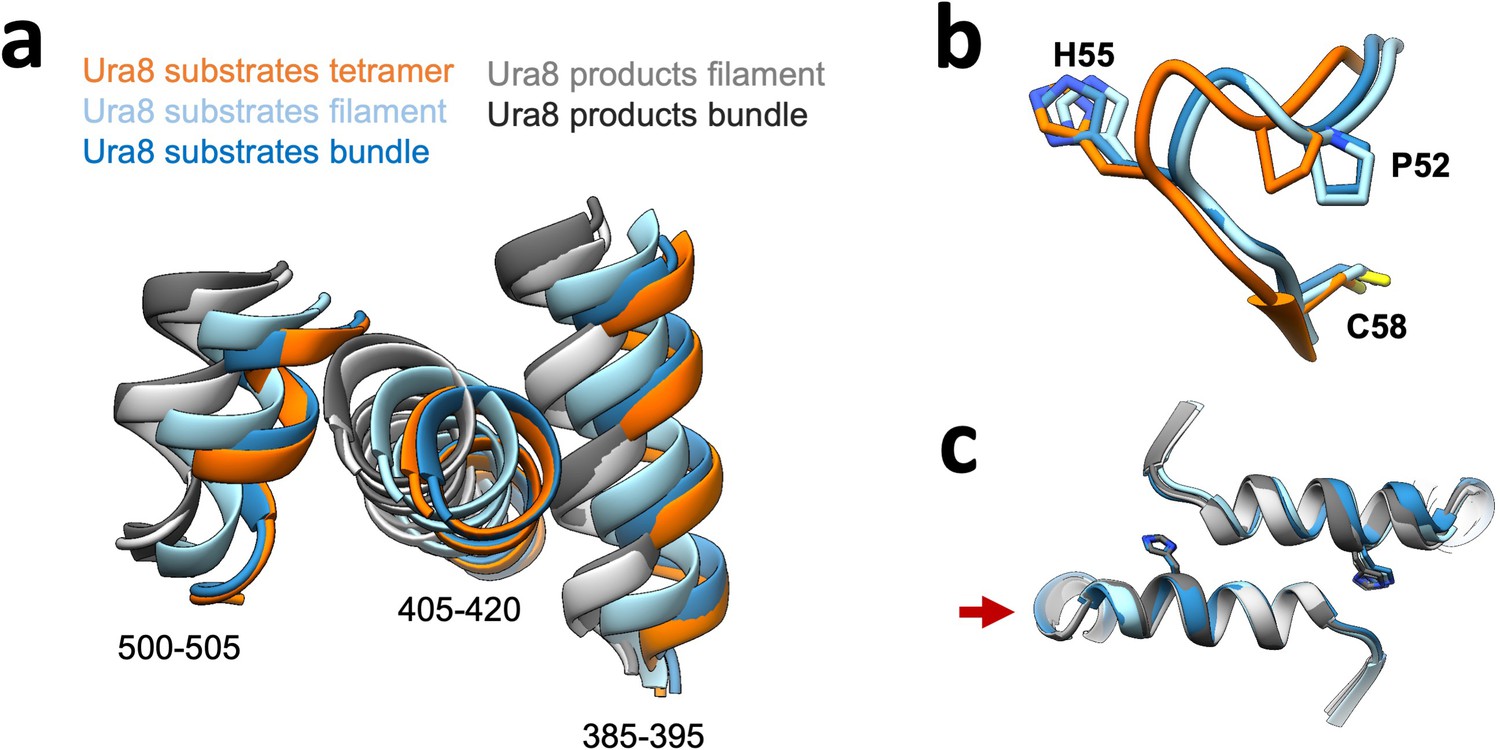
Comparison of filaments from individual filaments versus strands within bundles.
(a) Glutaminase domain rotation of helices shown in Figure 4 (numbered here). (b) Ammonia channel key residues for closure for substrate-bound Ura8 bundle relative to tetramer and filament state. (c) Filament assembly interface for Ura8 either in bundles or individual filaments. Red arrow shows which side of the interface models were aligned on.
Figure 6—figure supplement 4
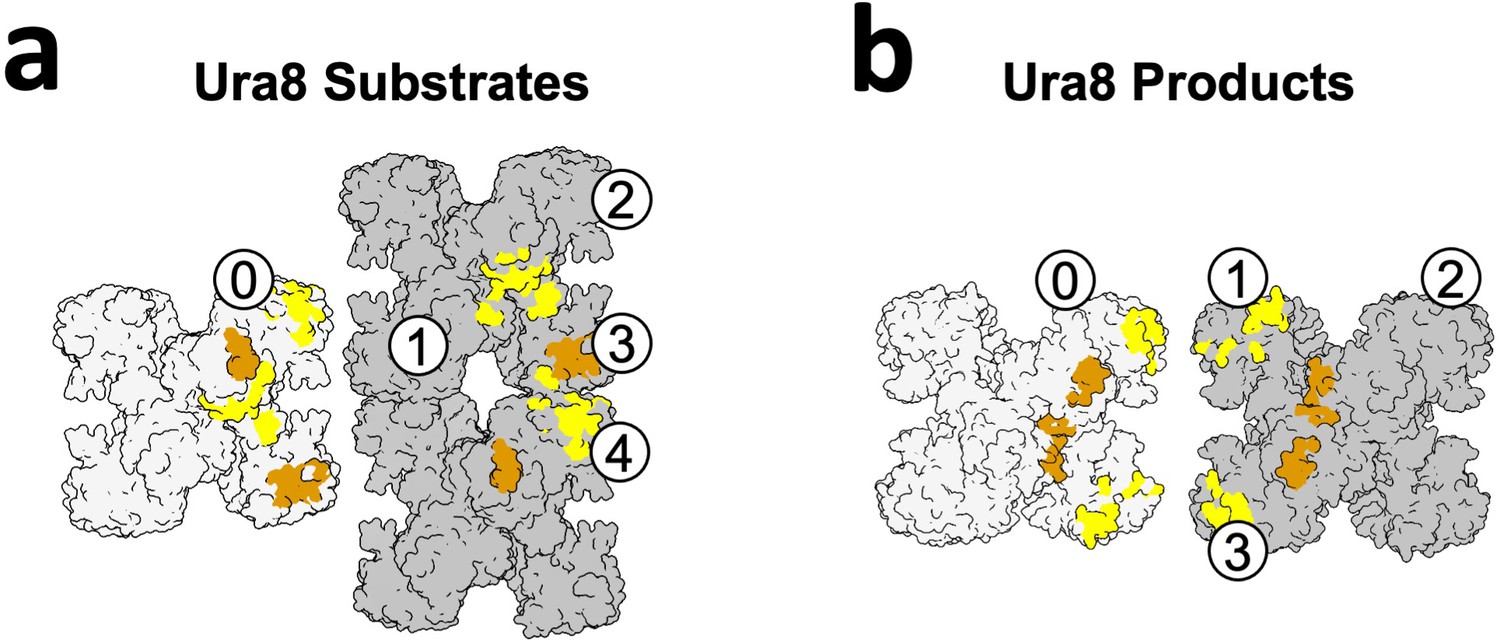
Numbering of monomers for assigning lateral contacts.
(a) Substrate-bound Ura8 bundles showing two strands (light and dark gray) and the lateral contacts they make. Painted orange are contacts made by the yeast linker, and yellow are all others. Numbering scheme is for Table 4, which shows all contacts made for a single monomer (‘0’) to monomers on the adjacent strand (‘1–4’). (b) Same as A, for product-bound Ura8 bundles.
Figure 6—figure supplement 5
Yeast linker involvement in lateral bundle contacts.
(a) Substrate-bound Ura8 bundle, shown are a pair of tetramers interacting laterally. Colored in yellow is the yeast linker insert (residues 273–279). (b) Zoom in of yeast linker insert contact with corresponding cryo-EM density. Yeast Insert residues putative contacts on the opposing strand are displayed. (c–d) Same as a-b but for a pair of tetramers in the product-bound Ura8 bundle.
Figure 6—figure supplement 6
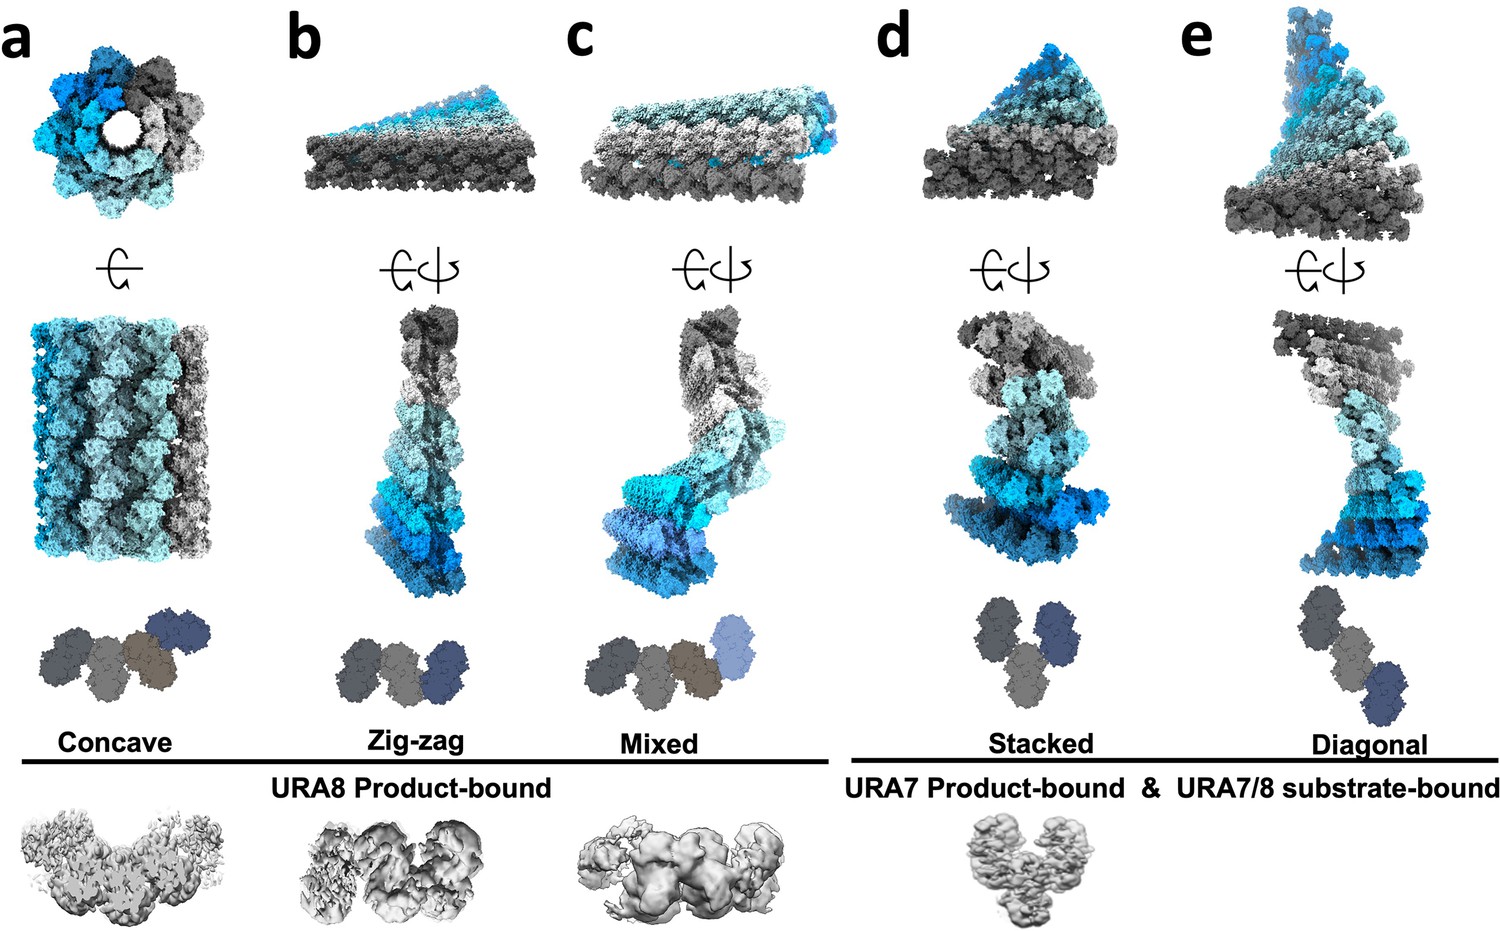
Possible higher order arrangements of yeast CTPS bundles.
Models of possible bundle configurations generated in silico by propagating contacts. Bottom shows end-on views of 3D classification maps done in C1 which were used as templates to generate the propagated models above. (a–c) Configurations for product-bound Ura8 which has strands in register. (d)(–e) Configurations for staggered strand architecture adopted by Ura8 substrate-bound and Ura7 in both ligand states. No 3D map was obtained for a diagonal configuration but our modeling predicts that it should be possible without clashing.
Figure 6—figure supplement 7

Image processing of substrate-bound Ura8 bundles.
(a) Flowchart overview of the data processing strategy. (b) Example micrograph from the dataset. (c) FSC curve from Relion postprocess and Phenix density modification. (d) Local resolution estimation.
Figure 6—figure supplement 8
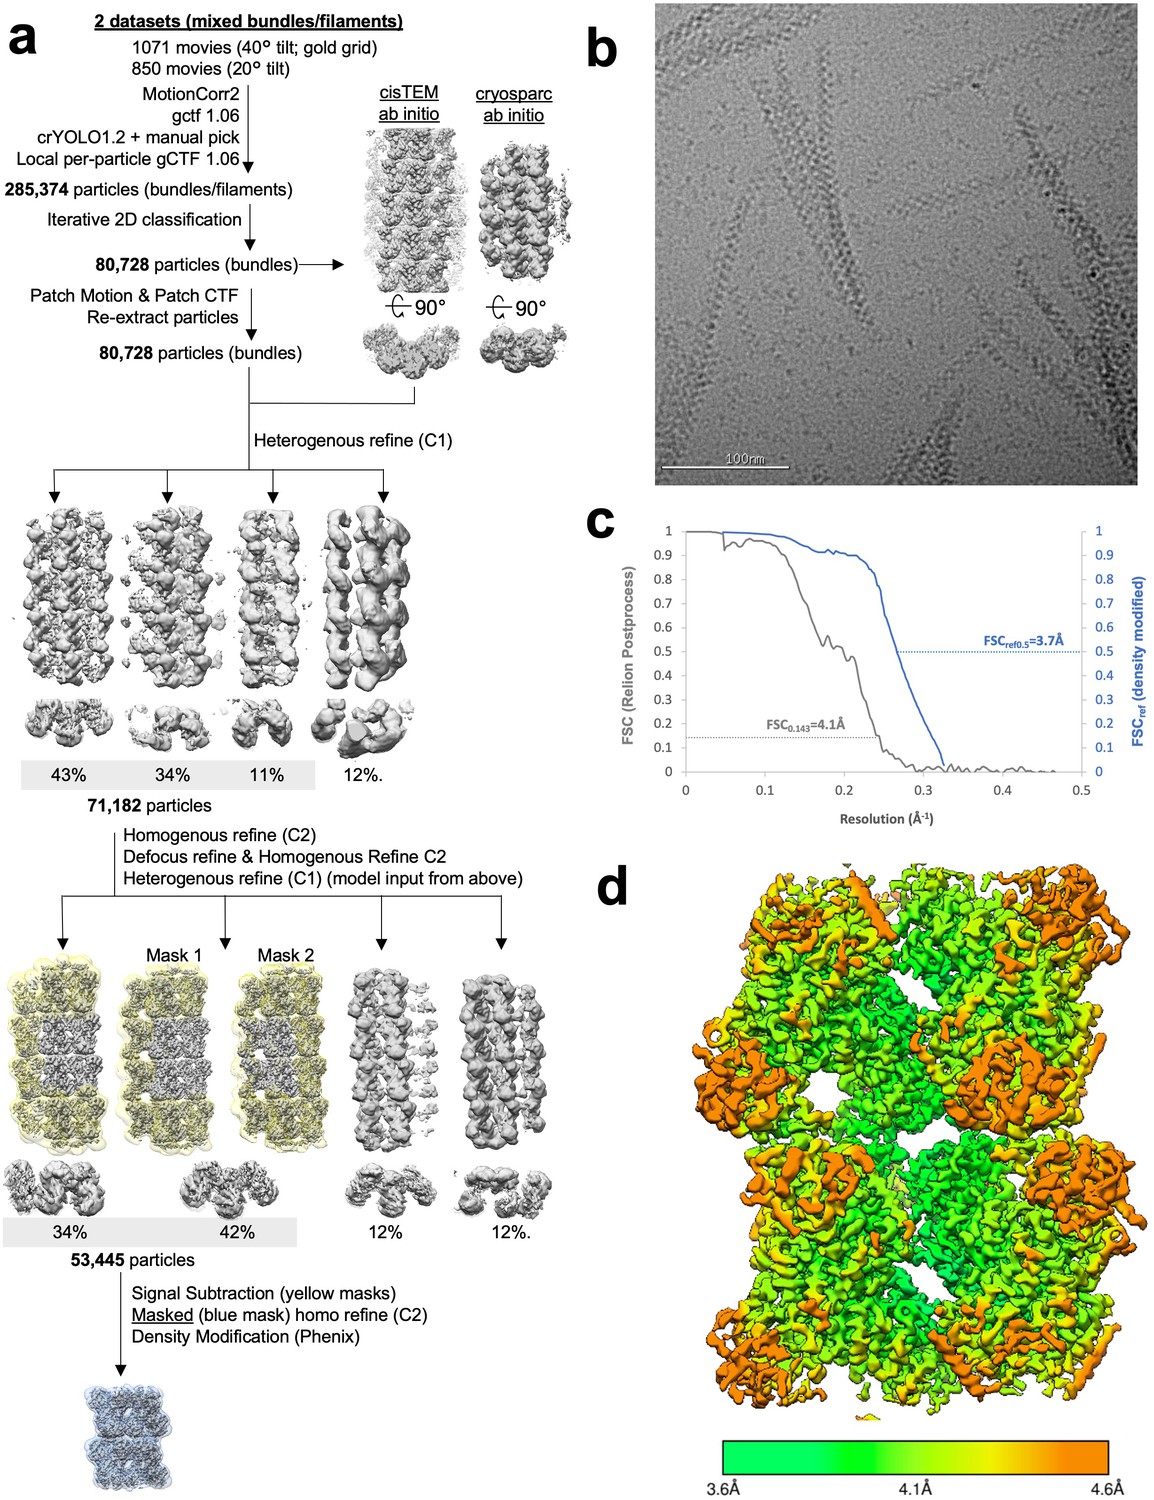
Image processing of product-bound Ura8 bundles.
(a) Flowchart overview of the data processing strategy. (b) Example micrograph from the dataset. (c) FSC curve from Relion postprocess and Phenix density modification. (d) Local resolution estimation.
Figure 6—figure supplement 9
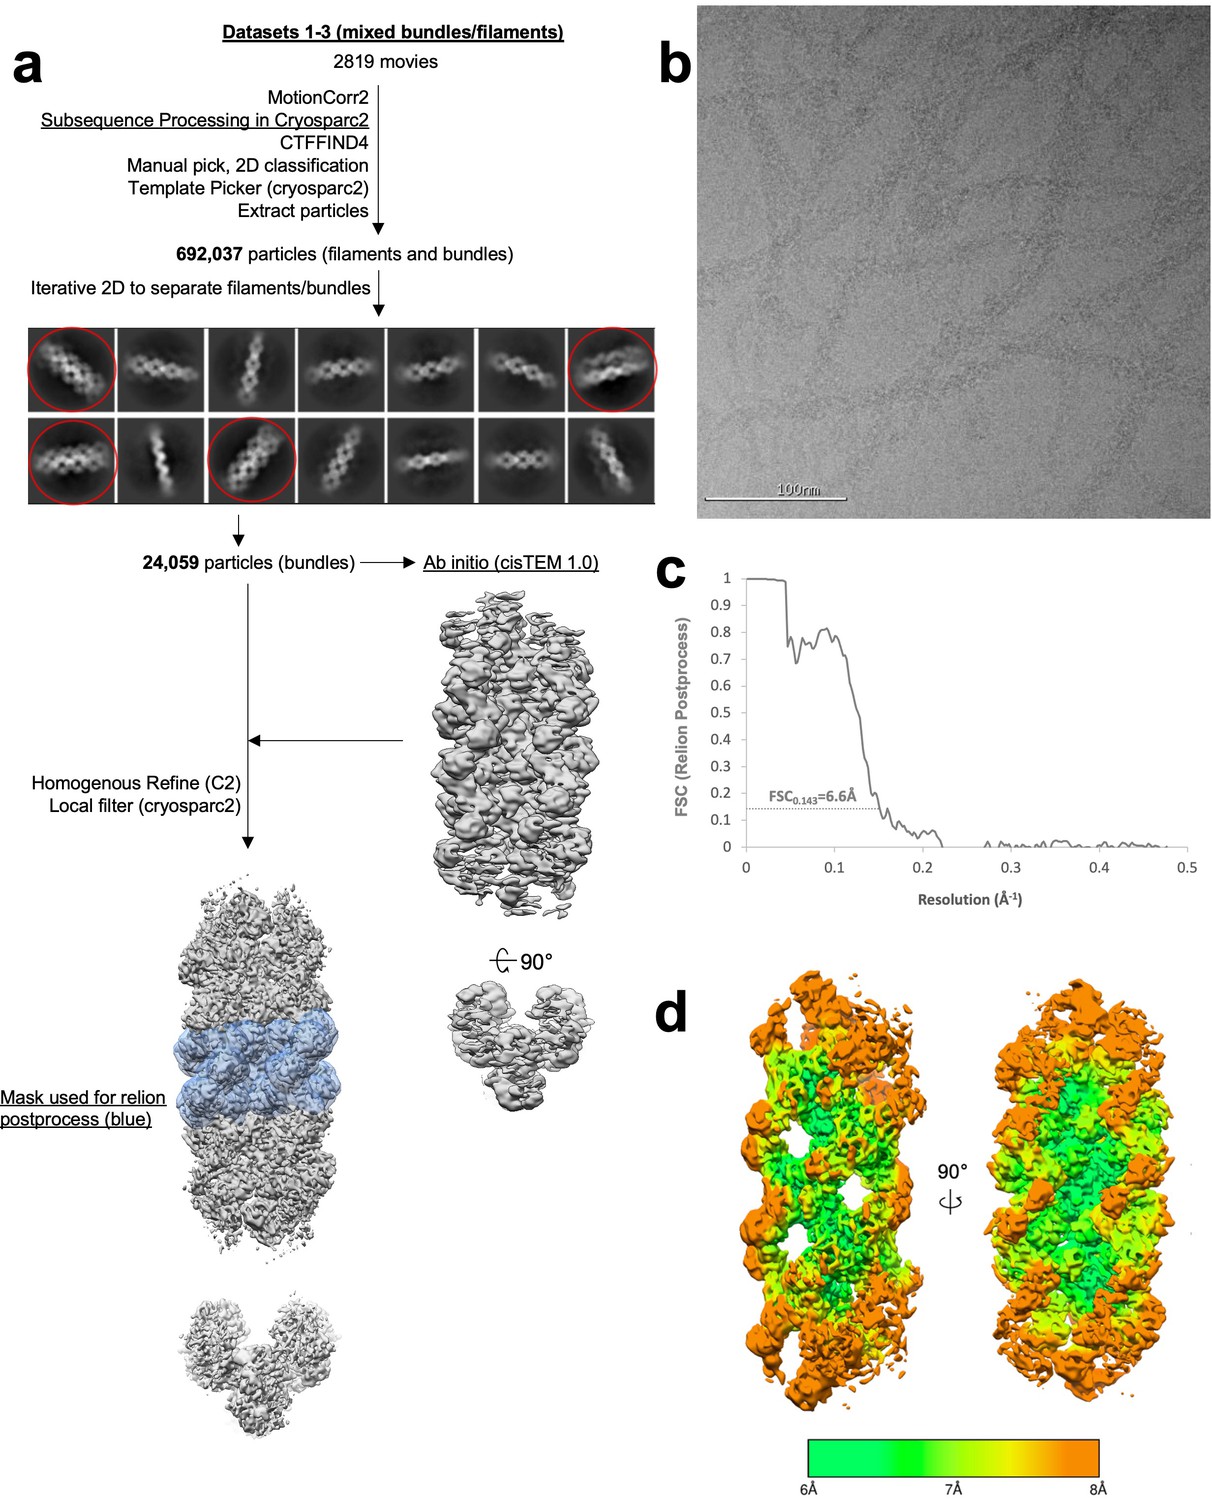
Image processing of substrate-bound Ura7 bundles.
(a) Flowchart overview of the data processing strategy. (b) Example micrograph from the dataset. (c) FSC curve from Relion postprocess. (d) Local resolution estimation.
Figure 6—figure supplement 10
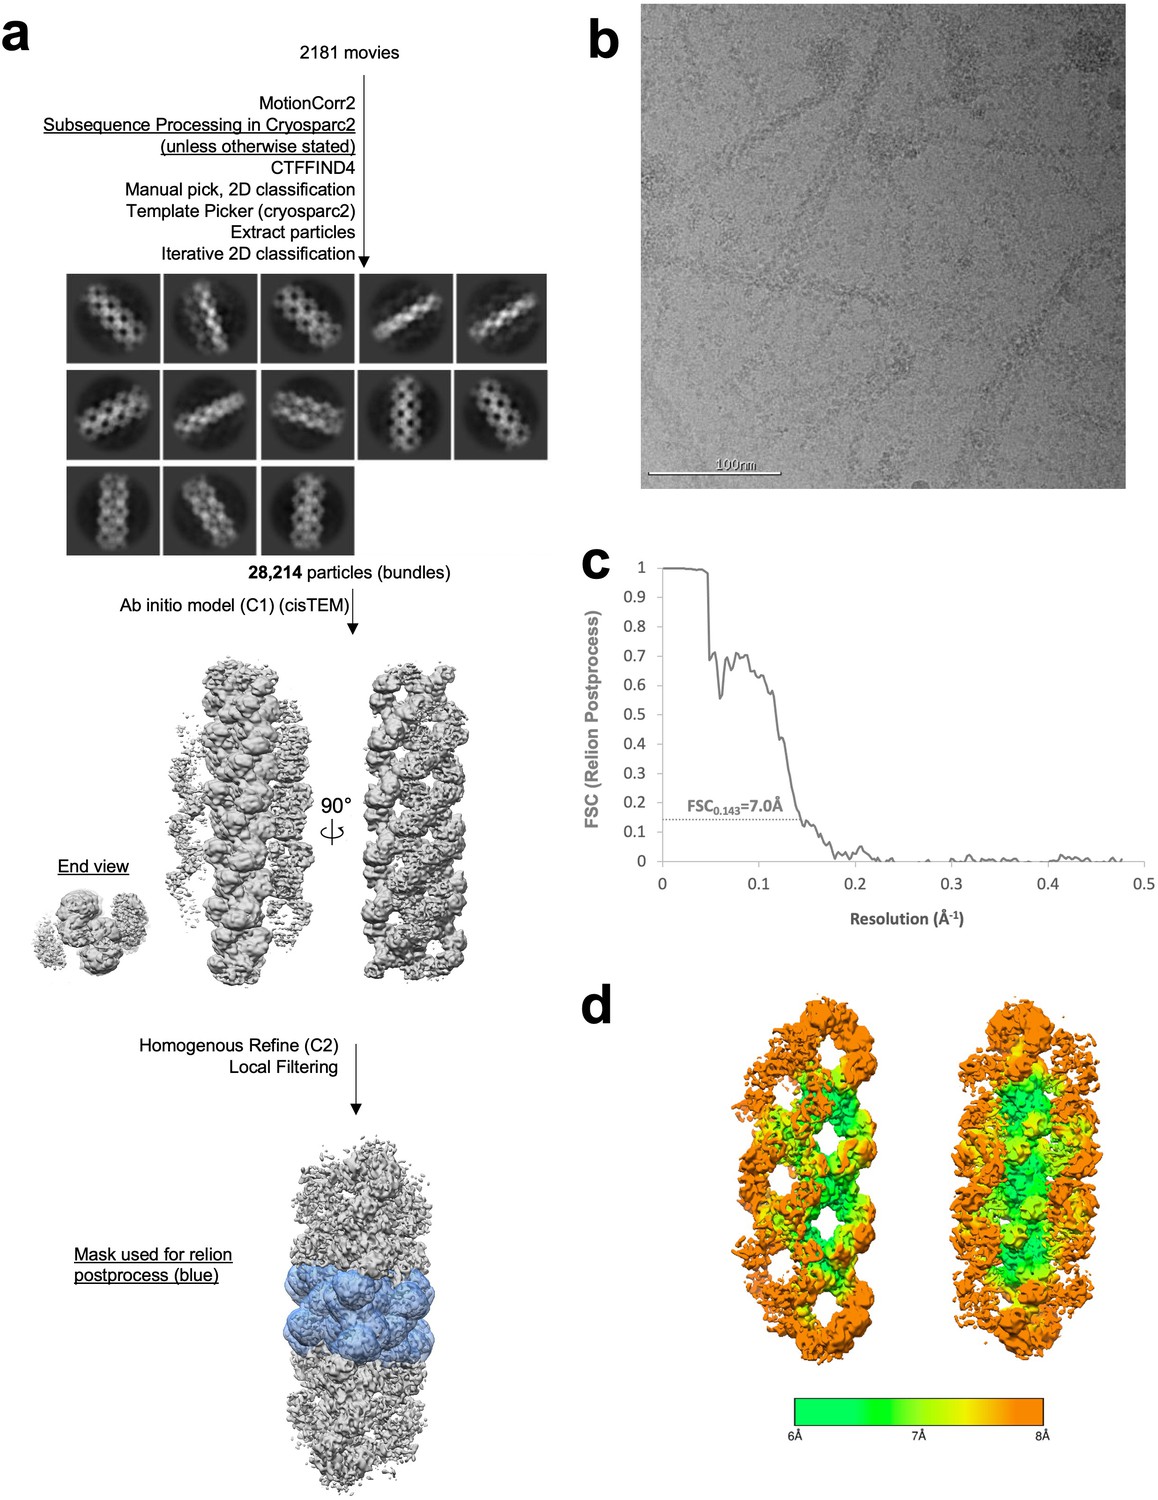
Image processing of product-bound Ura7 bundles.
(a) Flowchart overview of the data processing strategy. (b) Example micrograph from the dataset. (c) FSC curve from Relion postprocess. (d) Local resolution estimation.
Figure 6—video 1
Masked cryo-EM density of substrate-bound Ura8 bundle.
Final reconstruction (C2 symmetry imposed) of a three stranded bundle segment. Each strand is either blue or orange, with protomers alternating shade. A left/right half a tetramer is in the central reconstruction (orange), with two filament assembly interfaces on either side (blue).
Figure 6—video 2
Atomic model of substrate-bound Ura8 bundle.
Surface rendering of models for three strands built into the final reconstruction, which shows the full scale of the bundle. Each strand is in either orange or blue with protomers shaded differently.
Figure 6—video 3
Masked cryo-EM density of product-bound Ura8 bundle.
Final reconstruction (C2 symmetry imposed) of a two stranded bundle segment. Each strand is either blue or orange, with protomers alternating shade.
Figure 6—video 4
Atomic model of product-bound Ura8 bundle.
Surface rendering of models for two strands built into the final reconstruction, which shows the full scale of the bundle. Each strand is in either orange or blue with protomers shaded differently.
Figure 7
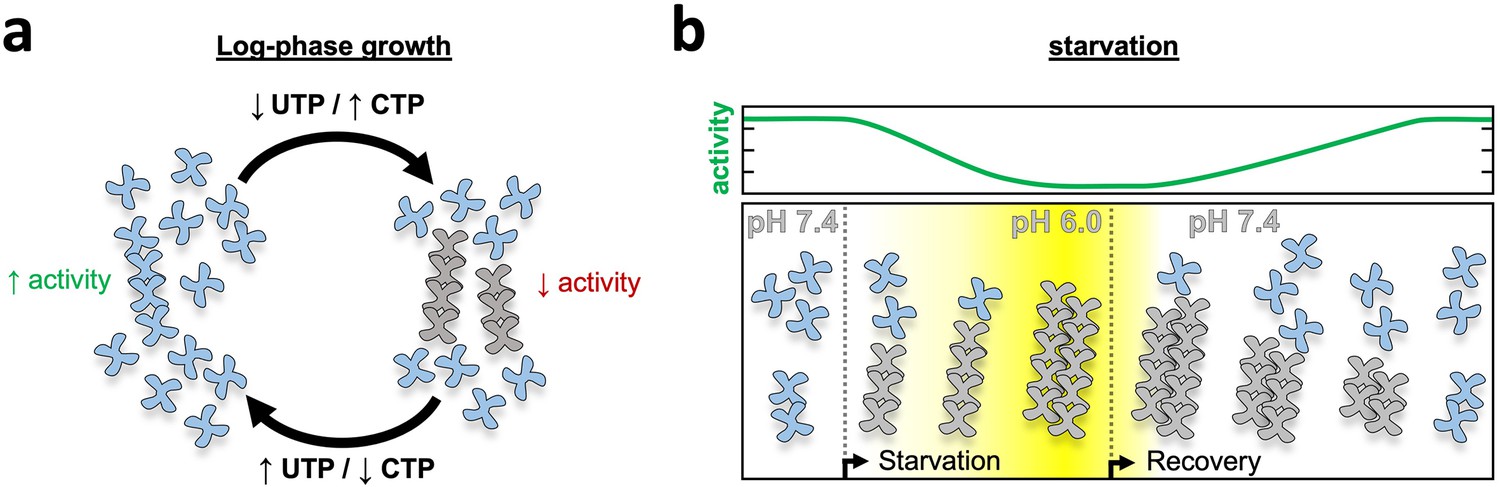
Model of yeast CTPS filament function.
(a) Log-phase growth in yeast the majority of CTPS is in the unassembled active conformation, with a subset of enzyme polymerized to maintain nucleotide pool balance. If UTP levels are high, filaments are in the strained substrate-bound conformation which breaks assembly contacts, allowing the enzyme to remain active and process substrate while polymerized. When CTP levels are high, filaments assemble rigid product-bound filaments which inactivates the enzyme until equilibrium is reached and CTPS return to the substrate-bound filament state. (b) During log growth there is an equilibrium of CTPS tetramers and filaments (left). Starvation induces a slow cytoplasmic acidification which, in conjunction with a licensing event, leads to CTPS filament and bundle growth. Bundles maintain a low activity state by stabilizing filaments through lateral assembly. As yeast recover from starvation the cytoplasm is rapidly alkalinized, but bundles persist as they slowly disassemble and gradually ramp up activity toward log phase growth.
Tables
Table 1
Cryo-EM data collection and refinement statistics.
| Ura8 substrates filament | Ura8 substrates bundle | Ura8 substrates tetramer | Ura8 products filament | Ura8 products bundle | Ura7 substrates filament | Ura7 substrates bundle | Ura7 products filament | Ura7 products bundle | Ura7-H360R substrates filament | |
|---|---|---|---|---|---|---|---|---|---|---|
| Number of micrographs | 2729 | 2729 | 1464 | 4979 | 1921 | 2819 | 2819 | 3118 | 2181 | 1070 |
| Nominal magnification | 130,000 X | |||||||||
| Voltage | 300 kV | |||||||||
| Electron Fluence | 90e-/Å2 | |||||||||
| Pixel size | 1.05 Å | |||||||||
| Defocus range | –0.4 to –1.9 μm | –0.4 to –1.9 μm | –1.2 to –5.5 μm | –0.4 to –9.0 μm | –0.4 to –7.0 μm | –0.8 to –2.2 μm | –0.8 to –2.2 μm | –0.4 to –7.0 μm | –1.0 to –2.2 μm | –0.9 to –3.5 μm |
| EMDB ID | EMD-24512 | EMD-24581 | EMD-24497 | EMD-24516 | EMD-24579 | EMD-24566 | EMD-24575 | EMD-24560 | EMD-24576 | EMD-24578 |
| PDB code | 7RL0 | 7RNR | 7RKH | 7RL5 | 7RNL | 7RMF | 7RMK | 7RMC | 7RMO | 7RMV |
| Map resolution 0.143 FSC | 2.9 Å | 3.4 Å | 2.9 Å | 4.0 Å | 4.1 Å | 7.3 Å | 6.6 Å | 3.7 Å | 7.0 Å | 6.7 Å |
| Density Modified Resolution 0.5Ref | 2.8 Å | 3.3 Å | 2.8 Å | 3.8 Å | 3.7 Å | n/a | n/a | 3.5 Å | n/a | n/a |
| Symmetry Imposed | D2 | C2 | D2 | D2 | C2 | D2 | C2 | D2 | C2 | D2 |
| Number of particles | 40,474 | 21,220 | 76,963 | 181,136 | 53,445 | 19,706 | 24,059 | 64,010 | 28,214 | 54,928 |
| Map Sharpening B Factor | –32 Å2 | –33 Å2 | –74 Å2 | –142 Å2 | –67 Å2 | –235 Å2 | –140 Å2 | –51 Å2 | –186 Å2 | –40 Å2 |
| Model composition | ||||||||||
| ligands | ATP/UTP | ATP/UTP | ATP/UTP | CTP | CTP | ATP/UTP | ATP/UTP | CTP | CTP | ATP/UTP |
| R.M.S. deviations | ||||||||||
| Bond lengths (Å) | 0.64 | 0.63 | 0.63 | 0.66 | 0.7 | 0.69 | 0.69 | 0.62 | 0.63 | 0.71 |
| Bond angles (°) | 1.09 | 1.04 | 1.04 | 1.09 | 1.13 | 1.06 | 1.06 | 1.03 | 1.03 | 1.07 |
| Validation | ||||||||||
| Molprobity Score | 0.98 | 1.35 | 1.09 | 1.59 | 1.66 | 1.56 | 2.06 | 1.40 | 1.73 | 2.30 |
| Clash Score | 0.94 | 4.74 | 0.9 | 3.2 | 3.48 | 2.31 | 10.33 | 1.51 | 4.62 | 15.84 |
| Poor Rotamers (%) | 1.21 | 0.61 | 1.64 | 2.05 | 1.43 | 1.88 | 1.88 | 1.65 | 1.66 | 2.09 |
| Ramachandran Plot | ||||||||||
| Favored (%) | 97 | 98 | 97 | 96 | 94 | 95 | 95 | 95 | 95 | 95 |
| Allowed (%) | 2 | 2 | 3 | 3 | 6 | 4 | 4 | 5 | 4 | 5 |
| Outliers (%) | 0 | 0 | 0 | 0 | 0 | 0 | 0 | 0 | 0 | 0 |
Table 2
CTPS polymer architecture characteristics.
| Ura8 prods filament | Ura8 subs filament | Ura8 subs tetramer | Ura8 prods bundle | Ura8 subs bundle | Ura7 prods filament | Ura7 subs filament | Ura7 prods bundle | Ura7 subs bundle | |
|---|---|---|---|---|---|---|---|---|---|
| Domain rotation relative to product-bound filament state | n/a | 4° | 7.4° | 1.7° | 6.9° | n/a | 7.7° | 1.4° | 6.2° |
| Filament twist | 5° | 17.1° | n/a | 3.9° | 15.9° | 7.4° | 18.2° | 7.3° | 17.3° |
| Filament rise | 102.6 Å | 102.3 Å | n/a | 103 Å | 101.8 Å | 102.7 Å | 103.4 Å | 102.8 Å | 104.5 Å |
Table 3
Kinetic activity parameters for yeast CTPS and mutants.
| Wild type | H360A | H360R | |
|---|---|---|---|
| Max | 2.68 ± 0.05 | 3.60 ± 0.08 | 1.18 ± 0.05 |
| Min | 0.00 ± 0.00 | 0.00 ± 0.00 | 0.00 ± 0.00 |
| S50 | 161.07 ± 14.24 | 160.03 ± 5.67 | 229.72 ± 9.26 |
| Hill | 1.53 ± 0.15 | 1.45 ± 0.03 | 0.80 ± 0.15 |
-
*Error represents standard error of the mean (SEM).
Table 4
CTPS bundle buried surface area and putative contact residues.
| Ura8 Product-bound bundle contacts | ||||||
|---|---|---|---|---|---|---|
| BSA | Domains | Monomer 0 | Monomer 1 | Monomer 2 | Monomer 3 | Monomer 4 |
| 93 Å2 | Glu-Glu | 465,468,515 | 381, 384, 429,430,432,433 | |||
| 173 Å2 | Glu-Glu | 471,472,476,477*,480–483 | 348,350*,352,353* | |||
| 113 Å2 | Glu-Glu | 566,567†,570,571 | 354–356,358 | |||
| 240 Å2 | Link-AL | 275,276,277†,278,280*,281* | 222*,225,226†,230,236,237* | |||
| 48 Å2 | Link-AL | 272,274 | 168,169,171,172 | |||
| Ura8 substrate-bound bundle contacts | ||||||
| 471 Å2 | Link-Glu | 275,276,277†,278–282,284,285,288 | 348,350,380–383,384†,387,412,416,423,425,426,429,430,432,433,435 | |||
| 98 Å2 | AL-Glu | 136–139 | 353,354 | |||
| 185 Å2 | Glu-AL | 471,472,477,481,506,507,526,527 | 168–172,174,272,274 | |||
| 152 Å2 | Glu-AL | 563,567,570,571* | 100*, 105–107,109,119,123,126,127,130 | |||
| 88 Å2 | Glu-AL | 465,468,471,476,483,484 | 233,236–238,263 | |||
| 151 Å2 | AL-Glu | 168–172,174 | 469,471,472,477 | |||
| 167 Å2 | AL-Glu | 100,105–107, 123*,126†,130* | 561,563,564*,567*,571 | |||
-
*
Predicted salt bridge.
-
†
Predicted hydrogen bond.
Key resources table
| Reagent type (species) or resource | Designation | Source or reference | Identifiers | Additional information |
|---|---|---|---|---|
| Chemical compound, drug | IPTG | GoldBio | I2481C100 | |
| Chemical compound, drug | MgCl2 | Fisher Scientific | BP215-500 | |
| Chemical compound, drug | NaCl | Fisher Scientific | S271-10 | |
| Chemical compound, drug | KCl | Fisher Scientific | BP217-3 | |
| Chemical compound, drug | Imidazole | Sigma Aldrich | SLBT7469 | |
| Chemical compound, drug | HEPES | Fisher Scientific | BP310-1 | |
| Chemical compound, drug | MES | Sigma Aldrich | M8250-100G | |
| Chemical compound, drug | TrisHCl | Fisher Scientific | BP152-5 | |
| Chemical compound, drug | ATP | Sigma Aldrich | A2383-10G | |
| Chemical compound, drug | UTP | Sigma Aldrich | U6750-250mg | |
| Chemical compound, drug | CTP | Sigma Aldrich | C1506-250MG | |
| Chemical compound, drug | GTP | Sigma Aldrich | G8877-1G | |
| Chemical compound, drug | Uranyl Formate | Electron Microscopy Sciences | 22,450 | Negative stain EM |
| Chemical compound, drug | Kanamycin Sulfate | Acros Organics | 450810500 | |
| Chemical compound, drug | PMSF | Sigma Aldrich | 329-98-6 | |
| Chemical compound, drug | Glycerol | Fisher Scientific | G33-1 | |
| Chemical compound, drug | glutamine | Fisher Scientific | BP379-100 | |
| Chemical compound, drug | Dithiothreitol (DTT) | Fisher Scientific | 172–25 | |
| Chemical compound, drug | 2,4-Dinitrophenol | Sigma | 51-28-5 | |
| Recombinant DNA reagent | pet28b-6His | Addgene | 73,018 | |
| Strain, strain background (Escherichia coli) | TOP10 | Thermo Scientific | C404003 | |
| Strain, strain background (Escherichia coli) | BL21(DE3) RIL | Thermo Scientific | EC0114 | |
| Strain, strain background (Saccharomyces cerevisiae) | W303 | in house | leu2-3,112 trp1-1can1-100 ura3-1 ade2-1 his3-11,15 | |
| Other | C-flat 2/2 holey carbon film | Protochips | CF-2/2–2 C | |
| Other | Superdex 200 increase 10/300 gl hi load | GE | 28-9893-35 | Gel filtration |
| Other | Amicon Ulta-15 30 K MWCO centrifugal filters | Millipore | UFC903008 | Protein concentrator |
| Other | 5 ml HisTrap FF Crude column (GE) | GE | 17528601 | Affinity tag purification |
| Software, Algorithm | MotionCor2 | https://doi.org/10.1038/nmeth.4193 | Zheng et al., 2017 | |
| Software, Algorithm | PHENIX | https://doi.org/10.1107/97809553602060000865 | Adams et al., 2012 | |
| Software, Algorithm | CTFFIND4 | https://doi.org/10.1016/j.jsb.2015.08.008 | Rohou and Grigorieff, 2015 | |
| Software, Algorithm | gCTF | https://doi.org/10.1016/j.jsb.2015.11.003 | Zhang, 2016 | |
| Software, Algorithm | crYOLO | https://doi.org/10.1038/s42003-019-0437-z | Wagner et al., 2019 | |
| Software, Algorithm | Relion | https://doi.org/10.7554/eLife.42166 | Scheres, 2012 | |
| Software, Algorithm | cisTEM | https://doi.org/10.7554/eLife.35383 | Grant et al., 2018 | |
| Software, Algorithm | cryosparc | https://doi.org/10.1038/nmeth.4169 | Punjani et al., 2017 | |
| Software, Algorithm | Isolde | https://doi.org/10.1107/S2059798318002425 | Croll, 2018 | |
| Software, Algorithm | Coot | https://doi.org/10.1107/S0907444910007493 | Emsley and Cowtan, 2004 | |
| Software, Algorithm | RosettaES | https://doi.org/10.1038/nmeth.4340 | Frenz et al., 2017 | |
| Software, Algorithm | UCSF Chimera | https://doi.org/10.1002/jcc.20084 | Pettersen et al., 2004 | |
| Software, Algorithm | Molprobity | https://doi.org/10.1107/S0907444909042073 | Chen et al., 2010 |
Table 5
Yeast Strains Used.
| Number | Background | Genotype |
|---|---|---|
| yJMK001 | W303 | URA7-GFP::KanMx |
| yJMK002 | W303 | URA7H360A |
| yJMK003 | W303 | URA7H360A-GFP::KanMx |
| yJMK004 | W303 | URA7H360R |
| yJMK005 | W303 | URA7H360R-GFP::KanMx |
| yJMK006 | W303 | URA8-GFP::KanMx |
| yJMK007 | W303 | URA8-mCherry::KanMx |
| yJMK008 | W303 | URA8H360A |
| yJMK009 | W303 | URA8H360A-GFP::KanMx |
Additional files
Download links
A two-part list of links to download the article, or parts of the article, in various formats.
Downloads (link to download the article as PDF)
Open citations (links to open the citations from this article in various online reference manager services)
Cite this article (links to download the citations from this article in formats compatible with various reference manager tools)
Cryo-EM structures of CTP synthase filaments reveal mechanism of pH-sensitive assembly during budding yeast starvation
eLife 10:e73368.
https://doi.org/10.7554/eLife.73368


