ahctf1 and kras mutations combine to amplify oncogenic stress and restrict liver overgrowth in a zebrafish model of hepatocellular carcinoma
- Epigenetics and Development Division, Walter and Eliza Hall Institute of Medical Research, Australia
- Department of Medical Biology, University of Melbourne, Australia
- Centre for Dynamic Imaging, Advanced Technology and Biology Division, Walter and Eliza Hall Institute of Medical Research, Australia
- Department of Physiology, University of Melbourne, Australia
- Institute for Molecular Biosciences, University of Queensland, Australia
- Peter MacCallum Cancer Centre, Australia
- Murdoch Children's Research Institute, Australia
- Bioinformatics Division, Walter and Eliza Hall Institute of Medical Research, Australia
- Danish Stem Cell Center, University of Copenhagen, Denmark
- Department of Developmental Genetics, Max Planck Institute for Heart and Lung Research, Germany
- Department of Biological Science, National University of Singapore, Singapore
Figures
Figure 1 with 3 supplements
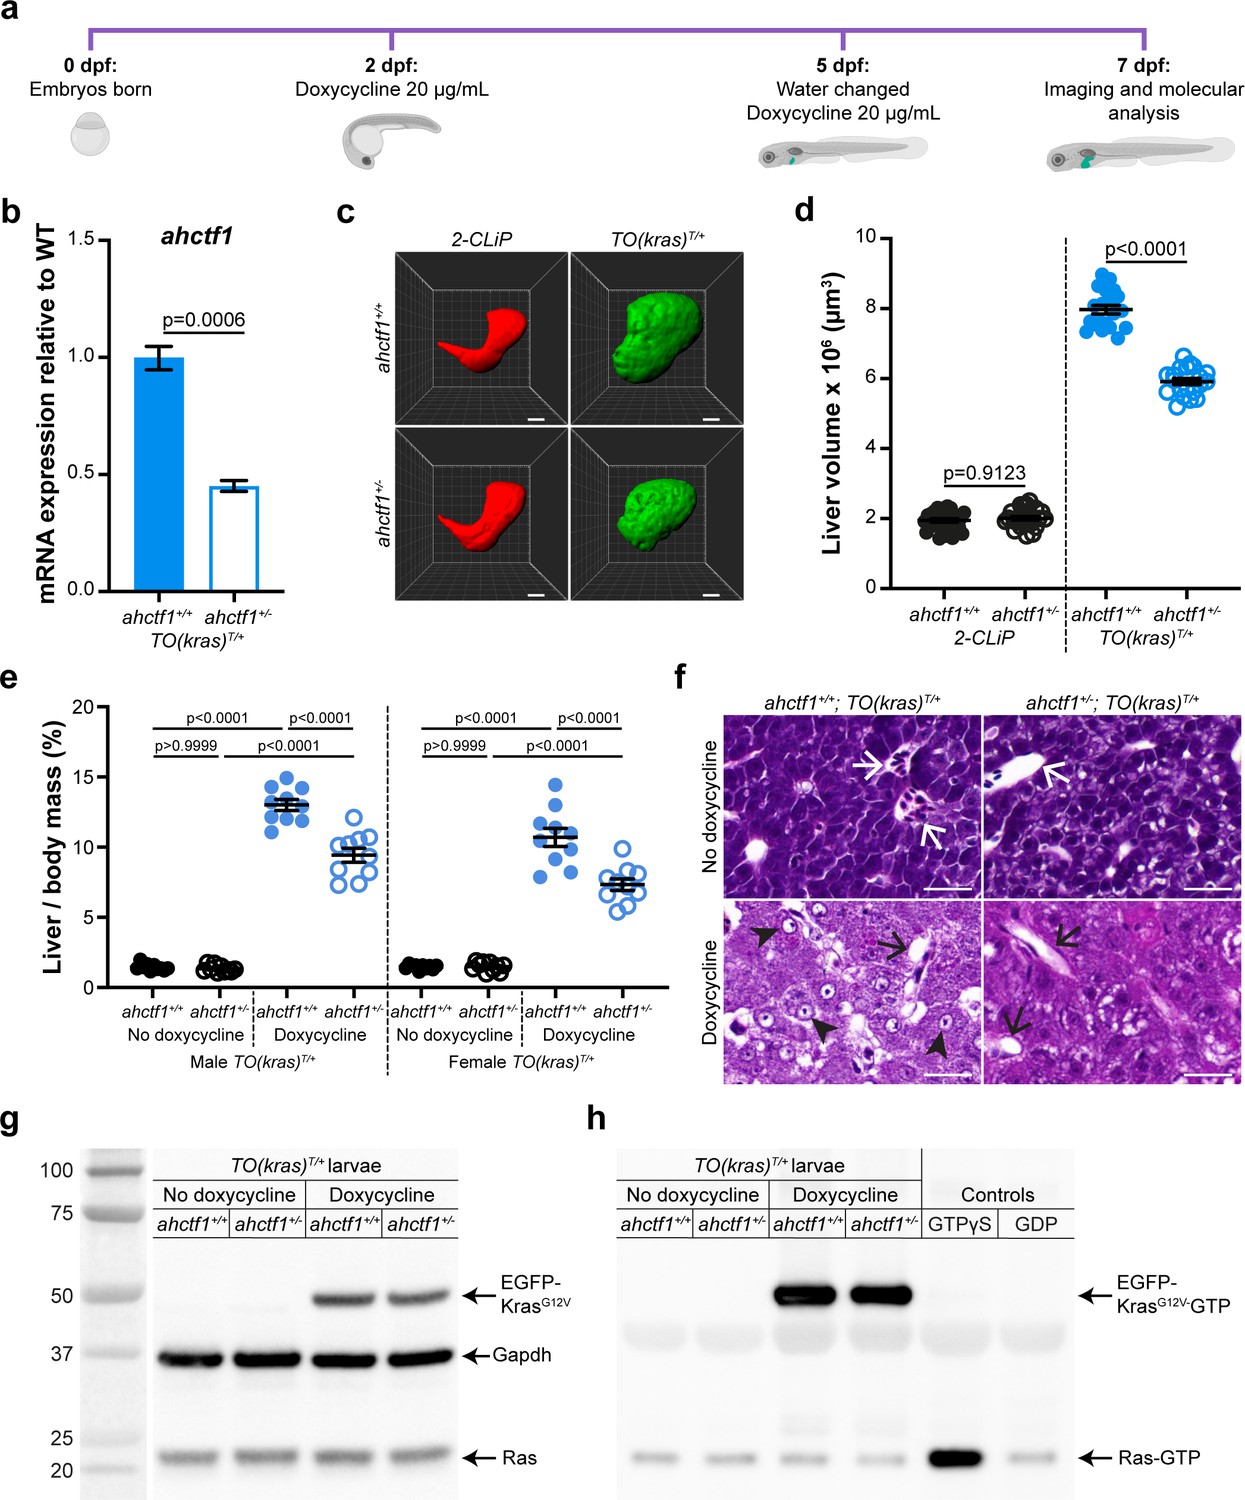
ahctf1 heterozygosity restricts liver volume in a zebrafish model of krasG12V-driven hepatocellular carcinoma (HCC).
(a) Protocol used to induce TO(krasG12V)T/+ expression in the livers of developing zebrafish larvae. (b) RT-quantitative PCR (RT-qPCR) analysis of ahctf1 mRNA levels in pooled micro-dissected larval livers (n = 3 biological replicates). (c) Representative three-dimensional reconstructions of 2-CLiP and dox-treated TO(krasG12V)T/+ larval livers of the indicated ahctf1 genotype. Scale bar 25 µm. (d) Impact of ahctf1 heterozygosity on liver volume in 2-CLiP and TO(krasG12V)T/+ larvae (n ≥ 20). (e) Impact of ahctf1 heterozygosity on liver-to-body mass ratio of adult TO(krasG12V)T/+ zebrafish in the presence or absence of dox treatment (n = 10). (f) Histological sections of adult male TO(krasG12V)T/+ zebrafish livers of the indicated ahctf1 genotype and dox treatment, stained with haematoxylin and eosin. In vehicle-treated adults, hepatocytes are densely packed and well differentiated. White arrows point to sections through blood vessels containing red blood cells. Meanwhile, the hepatocytes in dox-treated animals are poorly differentiated and exhibit multiple cytological abnormalities, including pyknotic nuclei (arrowheads) and vacuolation (black arrows). Scale bar 25 µm. (g) Western blot of Ras and Gapdh protein signals in total input lysates (50 μg) of TO(krasG12V)T/+ larvae of the indicated ahctf1 genotype and dox treatment. (h) Western blot of active Ras-GTP protein signals in lysates following active Ras pull-down.
-
Figure 1—source data 1
Figure 1b: Heterozygous ahctf1 mRNA expression in the livers of doxycycline (dox)-treated TO(krasG12V)T/+ zebrafish larvae, relative to wildtype (WT).
- https://cdn.elifesciences.org/articles/73407/elife-73407-fig1-data1-v2.xlsx
-
Figure 1—source data 2
Figure 1g: Uncropped unlabelled western blot.
- https://cdn.elifesciences.org/articles/73407/elife-73407-fig1-data2-v2.zip
-
Figure 1—source data 3
Figure 1g: Uncropped western blot (labelled).
- https://cdn.elifesciences.org/articles/73407/elife-73407-fig1-data3-v2.zip
-
Figure 1—source data 4
Figure 1h: Uncropped unlabelled western blot.
- https://cdn.elifesciences.org/articles/73407/elife-73407-fig1-data4-v2.zip
-
Figure 1—source data 5
Figure 1h: Uncropped western blot (labelled).
- https://cdn.elifesciences.org/articles/73407/elife-73407-fig1-data5-v2.zip
Figure 1—figure supplement 1
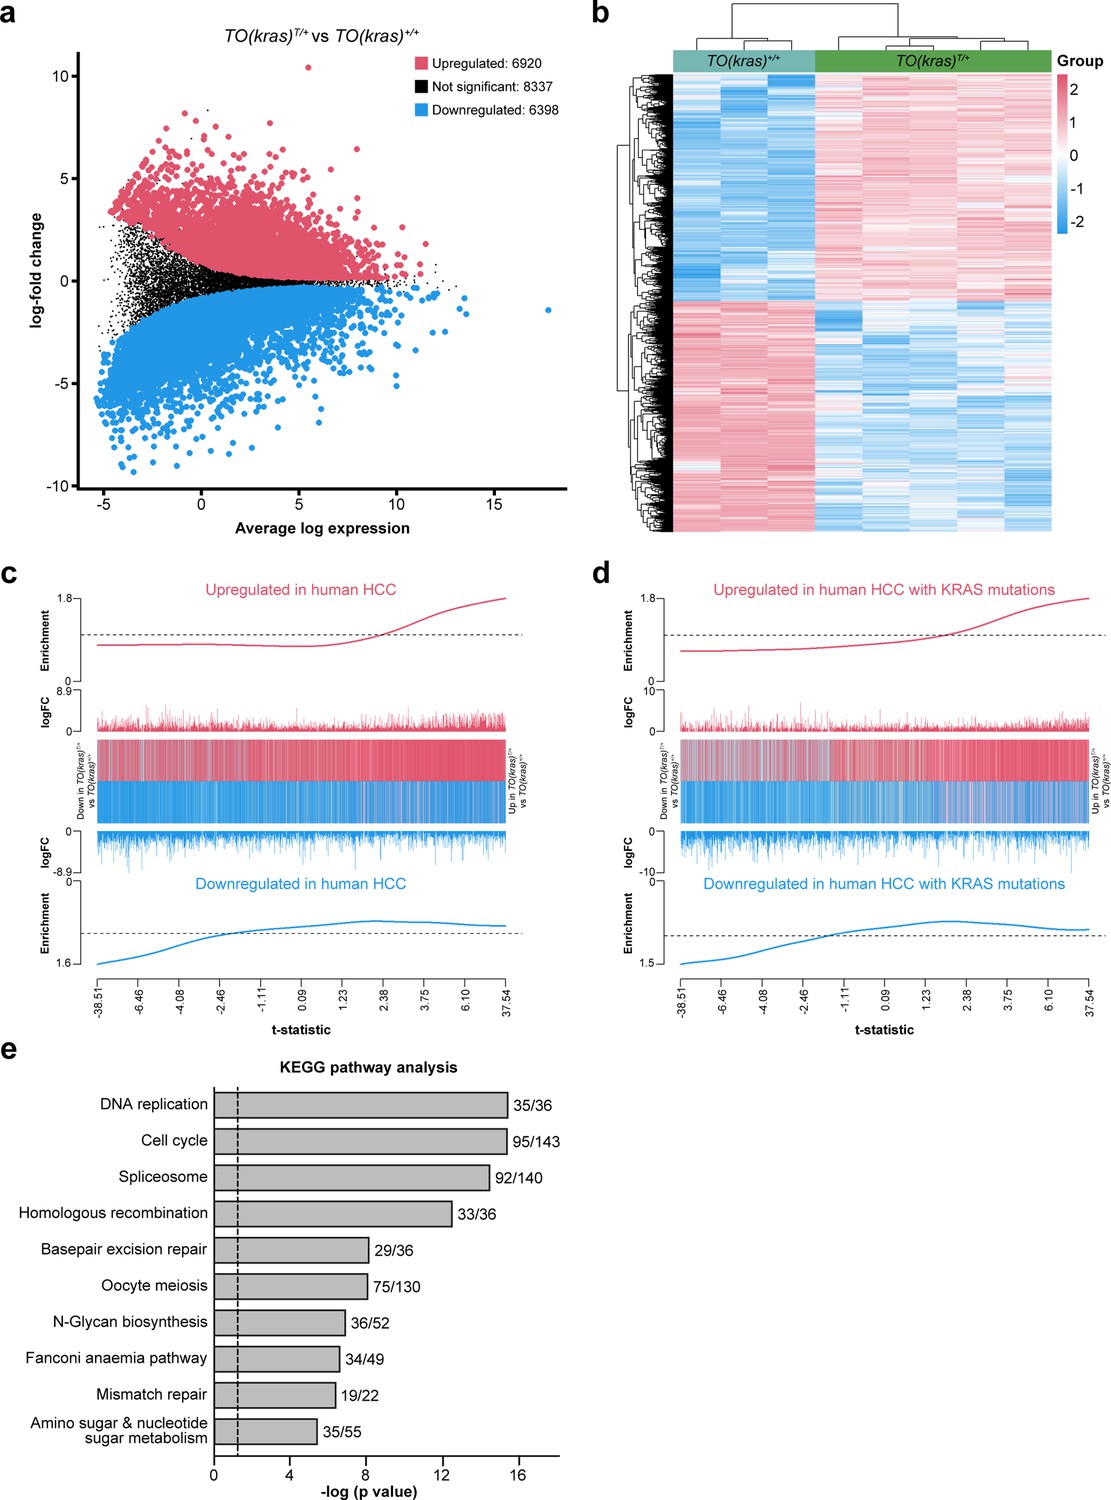
Analysis of RNAseq data from livers micro-dissected from TO(krasG12V)+/+ (wildtype, WT) and dox-treated TO(krasG12V)T/+ larvae reveals patterns of differential gene expression that recapitulate human hepatocellular carcinoma (HCC).
(a) Mean difference plot of differentially expressed genes (DEGs) between TO(krasG12V)+/+ (WT) and dox-treated TO(krasG12V)T/+ larvae. Each point represents the average expression of a gene (log counts per million) plotted on the x-axis and its log-fold change (y-axis). Red circles represent 6290 significantly upregulated genes in dox-treated TO(krasG12V)T/+ livers (FDR <0.05), compared to WT livers. Blue circles represent 6398 significantly downregulated genes and black circles represent 8337 genes that are not significantly changed. (b) Heatmap of the DEGs in livers from WT and dox-treated TO(krasG12V)T/+ larvae. Data are expressed as mean ± standard error of the mean (SEM), n > 3. Significance was calculated using a Student’s t-test. (c) Barcode plot showing positive correlation (roast test p value = 5.00025 × 10⁻⁵) between the differential gene expression results from the dox-treated TO(krasG12V)T/+ livers, compared to WT livers, and the hepatocellular carcinoma (HCC) gene expression signature. On the barcode plot, the t-statistics analysis from the dox-treated TO(krasG12V)T/+ livers compared to WT livers are ranked from smallest to largest, left to right. The position of genes in the HCC gene expression signature are marked by vertical bars; red for upregulated genes and blue for downregulated genes. The enrichment worms show the relative enrichment of the vertical bars in each part of the plot. (d) Barcode plot showing positive correlation (roast test p value = 5.00025 × 10⁻⁵) between the differential gene expression analysis from the dox-treated TO(krasG12V)T/+ versus WT livers and a small HCC gene expression signature based on four patient samples containing KRAS G12/G13 mutations. (e) Top 10 upregulated KEGG pathways in the livers of dox-treated TO(krasG12V)T/+ larvae, compared to livers of WT larvae. The number of upregulated DEGs and total genes in each pathway are shown for each bar. Log (p) values >1.3 (vertical line) denotes significant enrichment. Raw data have been deposited in the Gene Expression Omnibus under accession number GSE220282.
Figure 1—figure supplement 2
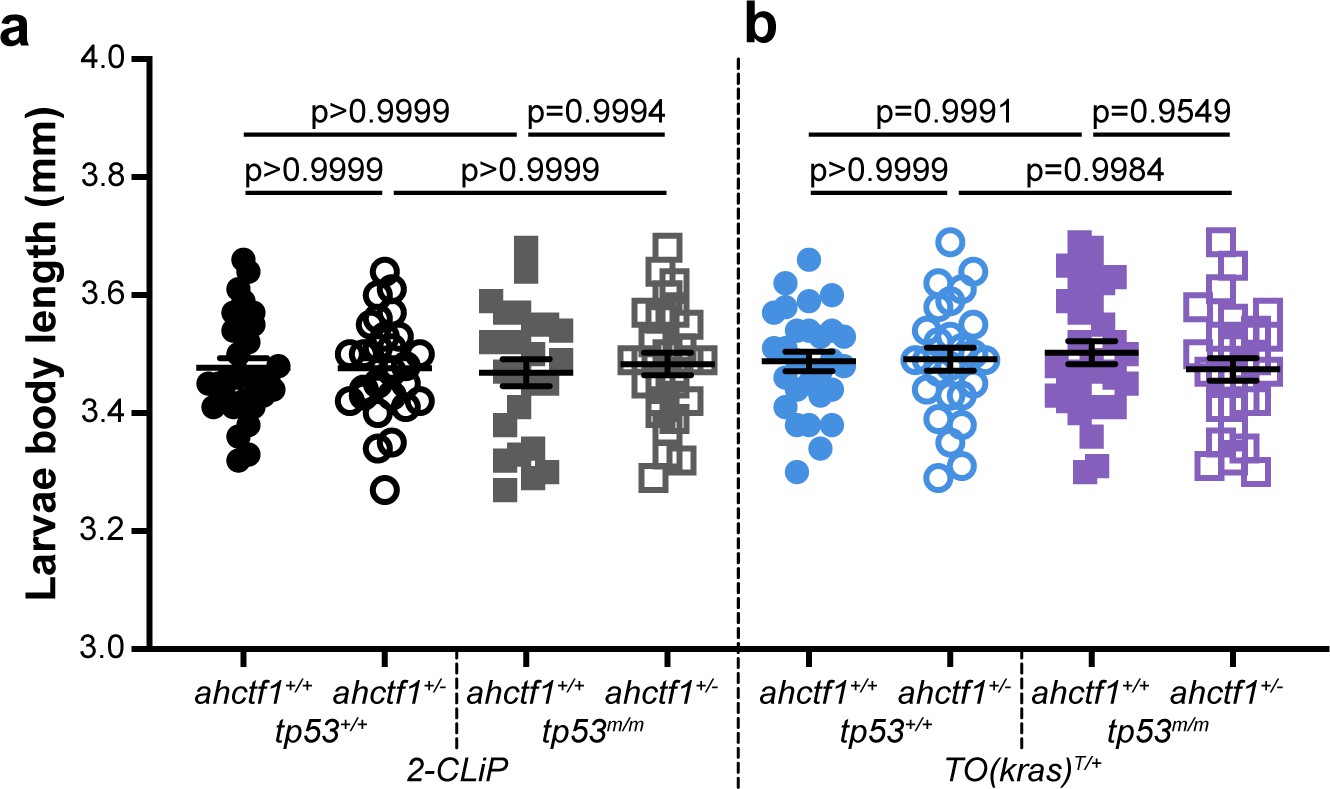
ahctf1 heterozygosity and/or homozygous tp53 mutation do not impact on body length.
(a) Body length at 7 dpf of 2-CLiP larvae (not expressing a mutant kras transgene) and (b) TO(krasG12V)T/+ larvae (no dox treatment) of the indicated ahctf1 and tp53 genotypes (n ≥ 25). Data are expressed as mean ± standard error of the mean (SEM). Significance was calculated using a one-way analysis of variation (ANOVA) with Tukey’s multiple comparisons test.
Figure 1—figure supplement 3
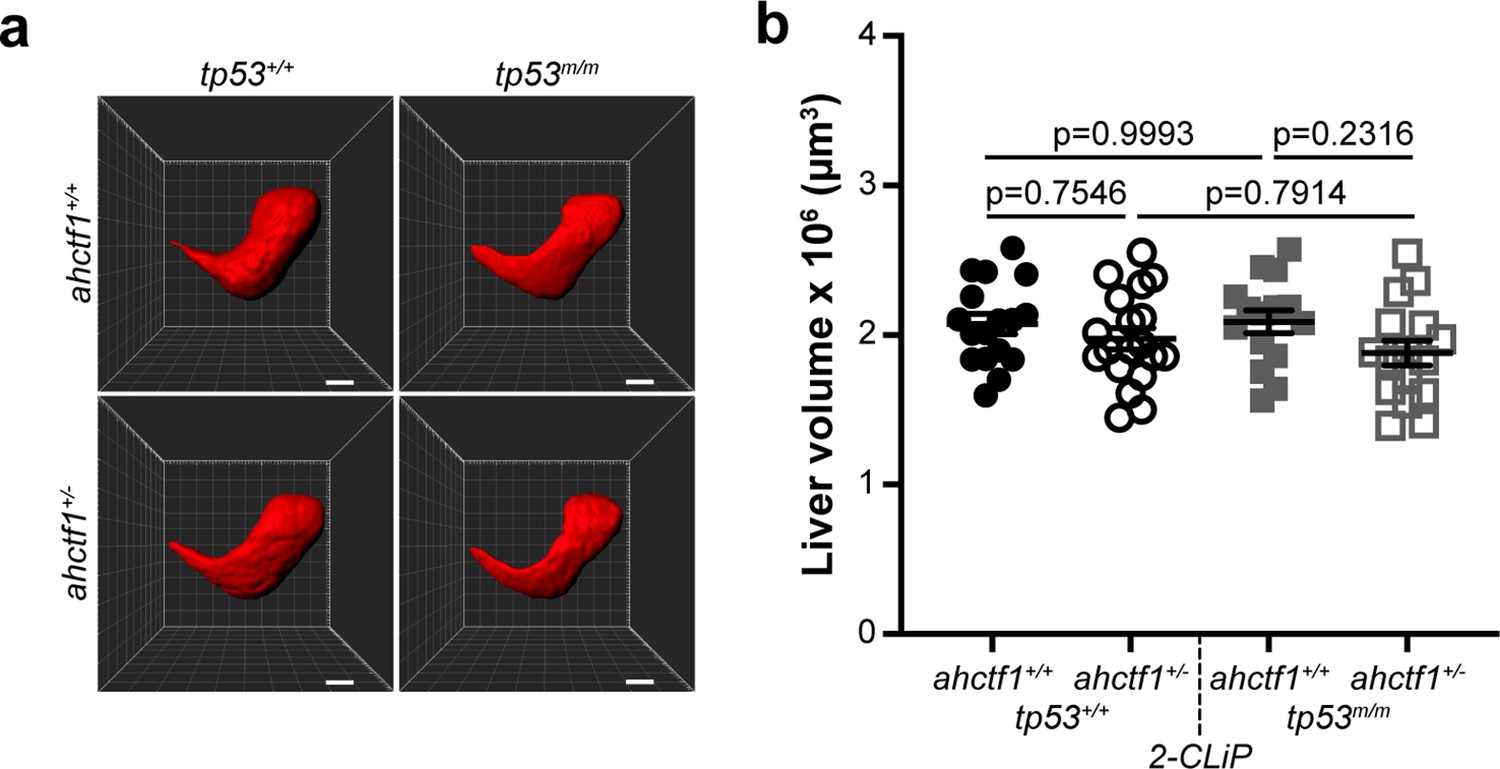
ahctf1 heterozygosity and/or homozygous tp53 mutation do not impact on liver volume during normal liver development.
(a) Representative three-dimensional reconstructions of 2-CLiP livers of the indicated ahctf1 and tp53 genotypes. Scale bar 25 µm. (b) Impact of ahctf1 heterozygosity and tp53 mutation on liver volume in 2-CLiP larvae (n ≥ 15). Data are expressed as mean ± standard error of the mean (SEM). Significance was assessed using a one-way analysis of variation (ANOVA) with Tukey’s multiple comparisons test.
Figure 2 with 1 supplement
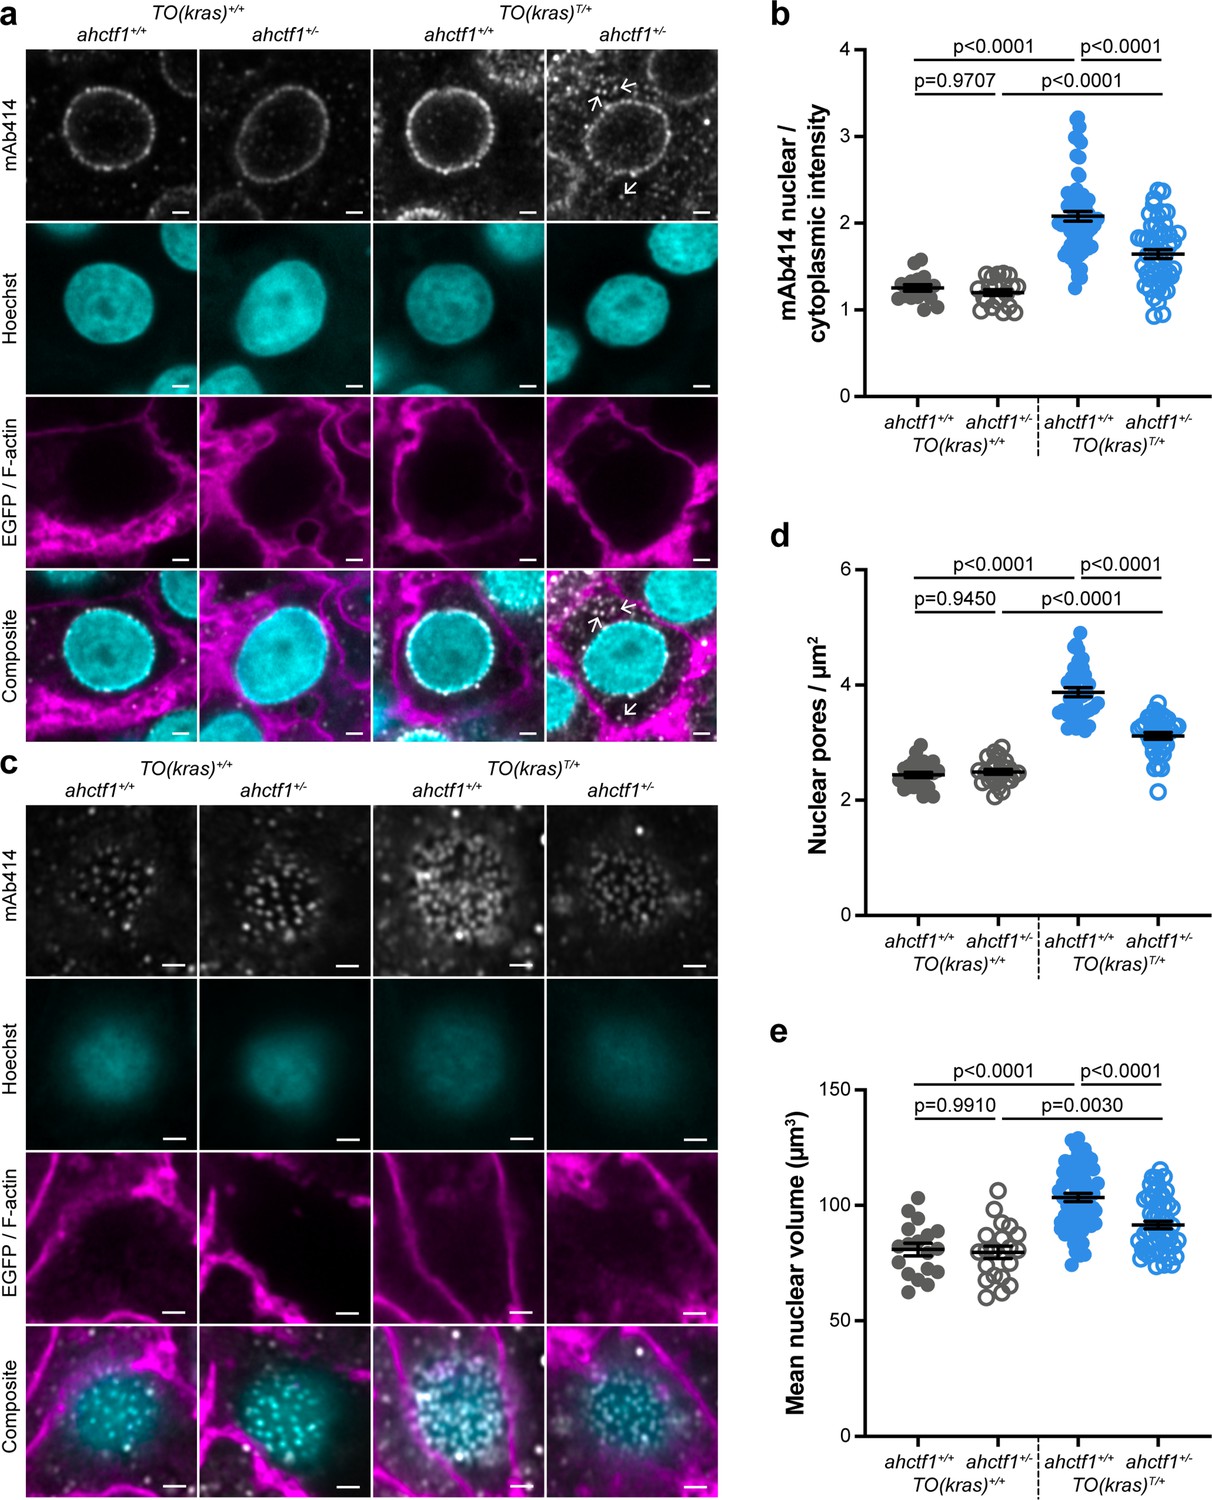
ahctf1 heterozygosity disrupts the density of nuclear pore complexes and reduces nuclear volume in dox-treated TO(krasG12V)T/+ hepatocytes.
(a) Representative Airyscan imaging of liver sections stained with mAb414 (white) marking FG-NUPs, Hoechst 33342 (cyan) marking DNA, and rhodamine phalloidin (magenta) marking the F-actin cytoskeleton in non-TO(krasG12V)-expressing cells and EGFP-KrasG12V (magenta) marking the cell membrane in dox-treated TO(krasG12V)-expressing cells of the indicated ahctf1 and TO(krasG12V) genotypes. Arrows in right-hand panel point to mAb414/FG-nucleoporin staining in the cytoplasm. Scale bar 2 µm. (b) Quantification of mean nuclear/cytoplasmic fluorescence intensity of mAb414 staining after 3D segmentation and morphological filtering of nuclear and cytoplasmic areas (n > 18). (c) Representative Airyscan images of mAb414 staining at the nuclear surface of sections of the indicated ahctf1 and TO(krasG12V) genotype. Scale bar 1 µm. (d) Quantification of nuclear pore density (n ≥ 25). (e) Quantification of nuclear volume (n ≥ 25). Data are expressed as mean ± standard error of the mean (SEM). Significance was assessed using a one-way analysis of variation (ANOVA) with Tukey’s multiple comparisons test.
-
Figure 2—source data 1
Figure 2b: Ratio of nuclear to cytoplasmic intensity of mAb414 immunostaining in livers of dox-treated TO(krasG12V)T/+ zebrafish larvae; role of ahctf1 genotype.
- https://cdn.elifesciences.org/articles/73407/elife-73407-fig2-data1-v2.xlsx
Figure 2—figure supplement 1
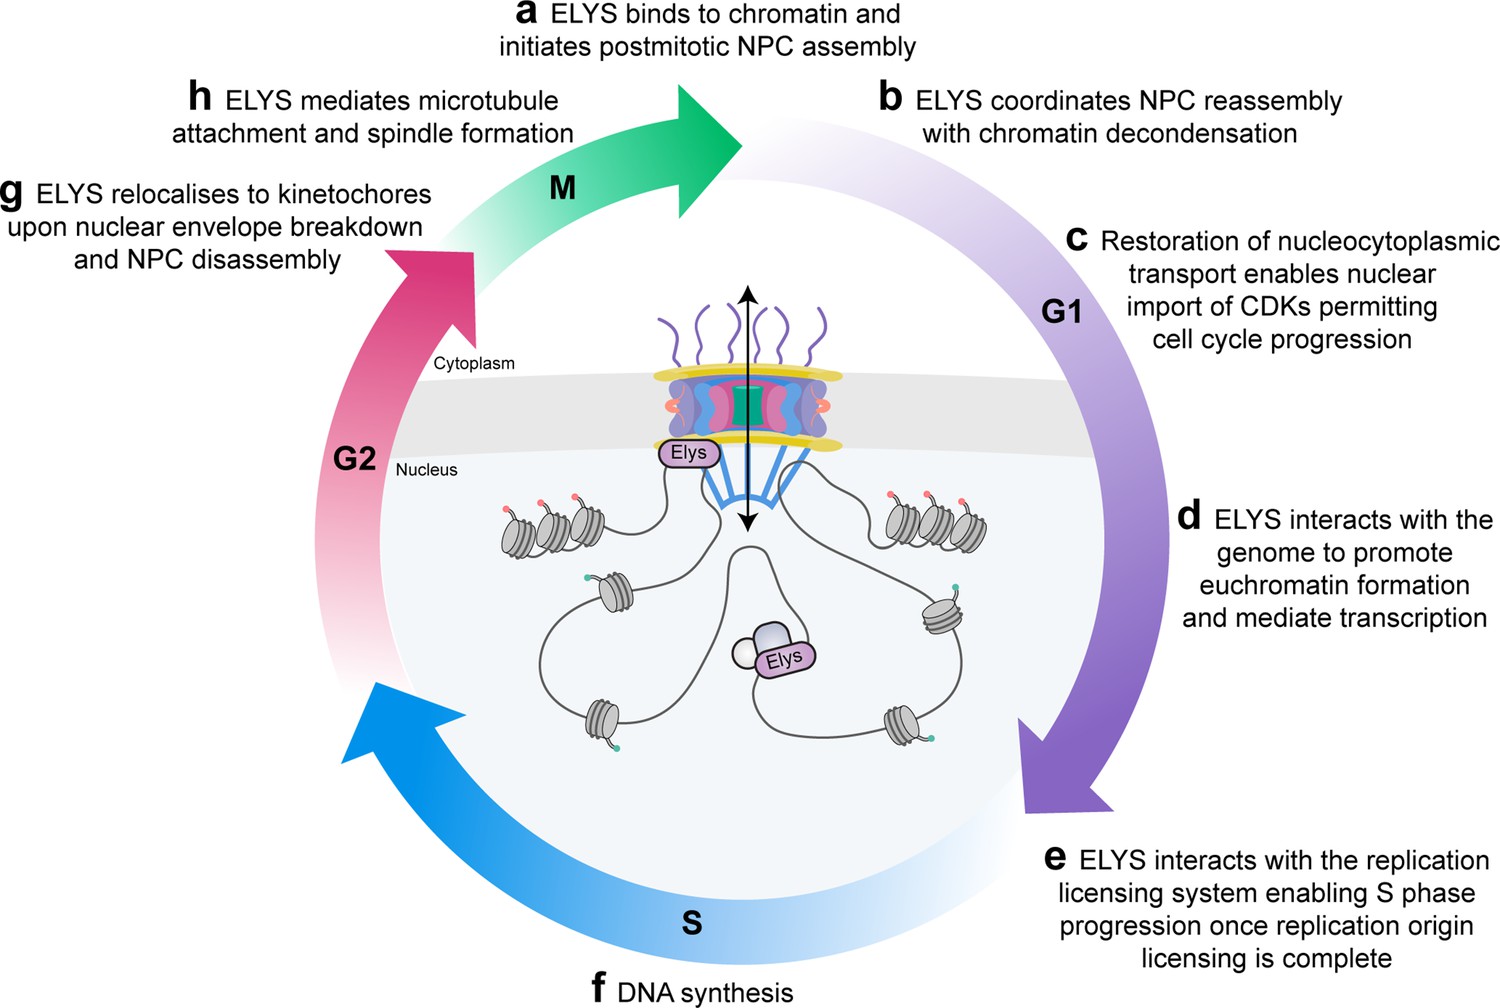
ELYS (encoded by AHCTF1) is a protein component of nuclear pore complexes (NPCs) with multiple functions during the cell cycle.
(a–c) Through its canonical role in nuclear pore re-assembly at the end of mitosis, ELYS restores nucleocytoplasmic trafficking of molecules required for cell cycle progression, including mRNAs and cyclin-dependent kinases (CDKs). (d–f) ELYS plays an active role in genome regulation through its direct interactions with components of large molecular machineries including chromatin remodellers that favour transcription and components of the DNA replication origin licensing system. (g, h) Dissolution of the nuclear envelope and NPCs prepares the cell for mitosis during which time ELYS relocalises to kinetochores where it contributes to microtubule attachment and spindle formation.
Figure 3
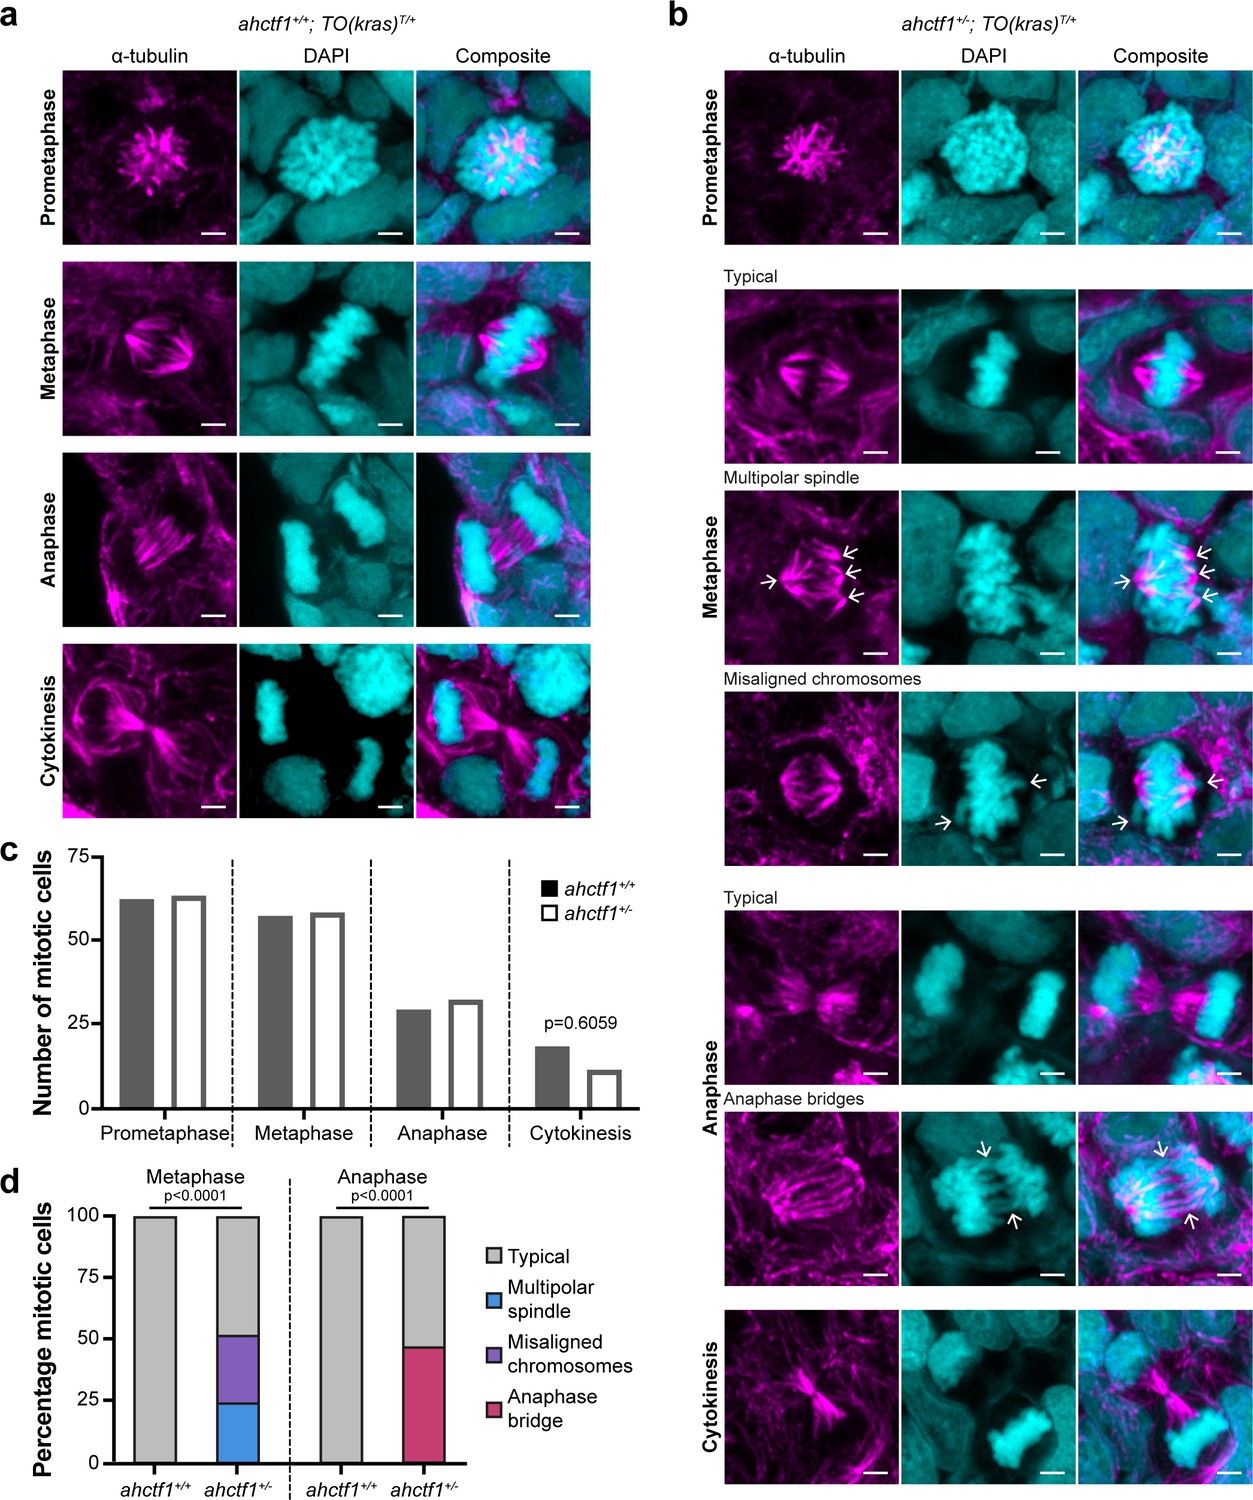
ahctf1 heterozygosity impairs mitotic spindle assembly and chromosome segregation in dox-treated TO(krasG12V)T/+ hepatocytes.
(a) Representative Airyscan imaging of liver cryosections stained with α-tubulin antibody (magenta) marking spindle microtubules and DAPI (cyan) marking DNA in mitotic cells of TO(krasG12V)T/+ larvae on a wildtype ahctf1+/+ background. (b) Mitotic cells in liver cryosections of TO(krasG12V)T/+ larvae that are heterozygous for ahctf1+/− exhibit multiple defects, including multipolar spindles, misaligned chromosomes, and anaphase bridges (arrows). Scale bar 2 µm. (c) Distribution of cells observed at different mitotic stages (n = 92 livers, 326 mitotic cells). (d) Quantification of the percentage of mitotic hepatocytes exhibiting an aberrant phenotype (n = 14–57). Significance was assessed using a Chi-square test.
-
Figure 3—source data 1
Figure 3c: Number of cells at different stages of mitosis in livers of TO(krasG12V)T/+ zebrafish larvae; role of ahctf1 genotype.
Figure 3d: Percentage of mitotic cells expressing an aberrant phenotype in livers of TO(krasG12V)T/+ zebrafish larvae; role of ahctf1 genotype.
- https://cdn.elifesciences.org/articles/73407/elife-73407-fig3-data1-v2.xlsx
Figure 4
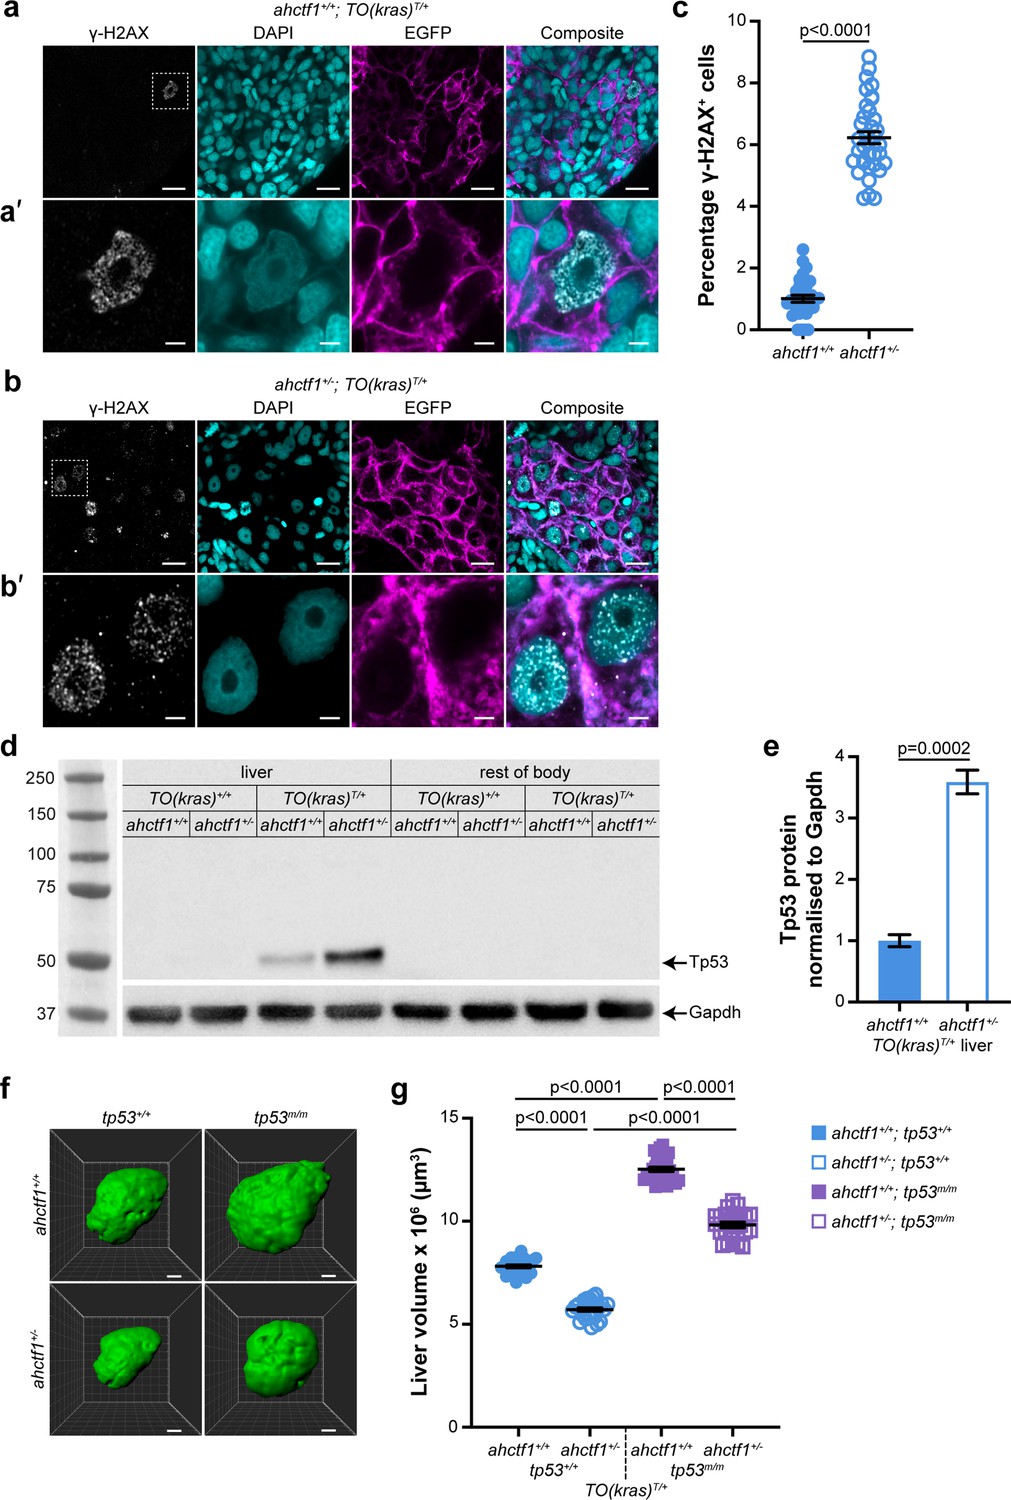
ahctf1 heterozygosity causes DNA damage and accumulation of Tp53 protein in dox-treated TO(krasG12V)T/+ hepatocytes.
(a) Representative Airyscan imaging of cryosections of liver from dox-treated ahctf1+/+;TO(krasG12V)T/+ larvae stained with γ-H2AX antibody (white) marking DNA double-strand breaks, DAPI (cyan) marking DNA and EGFP-KrasG12V (magenta) marking the cell membrane. Scale bar 5 µm. (a’) Inset of γ-H2AX-positive nuclei in ahctf1+/+;TO(krasG12V)T/+ hepatocytes. Scale bar 2 µm. (b) Representative images of cryosections of liver from dox-treated ahctf1+/−;TO(krasG12V)T/+ larvae. Scale bar 5 µm. (b’) Inset of γ-H2AX-positive nuclei in cryosections of liver from ahctf1+/−;TO(krasG12V)T/+ larvae. Scale bar 2 µm. (c) Quantification of the percentage of hepatocytes positive for γ-H2AX (n ≥ 31). (d) Representative western blot of Tp53 protein signals in lysates of TO(krasG12V) larvae of the indicated ahctf1 genotype. (e) Quantification of Tp53 protein levels normalised by reference to the Gapdh loading control (n = 3 independent experiments). (f) Representative three-dimensional reconstructions of dox-treated TO(krasG12V)T/+ livers of the indicated ahctf1 and tp53 genotypes. Scale bar 25 µm. (g) Impact of ahctf1 heterozygosity and homozygous tp53 mutation on liver volume in 2-CLiP and TO(krasG12V)T/+ larvae (n ≥ 20). Data are expressed as mean ± standard error of the mean (SEM). Significance was calculated using a Student’s t-test or one-way analysis of variation (ANOVA) with Tukey’s multiple comparisons test.
-
Figure 4—source data 1
Figure 4c: Percentage of hepatocytes positive for γ-H2AX immunostaining in livers of dox-treated TO(krasG12V)T/+ zebrafish larvae; role of ahctf1 genotype.
- https://cdn.elifesciences.org/articles/73407/elife-73407-fig4-data1-v2.xlsx
-
Figure 4—source data 2
Figure 4d: Uncropped unlabelled western blot.
- https://cdn.elifesciences.org/articles/73407/elife-73407-fig4-data2-v2.zip
-
Figure 4—source data 3
Figure 4d: Uncropped western blot (labelled).
- https://cdn.elifesciences.org/articles/73407/elife-73407-fig4-data3-v2.zip
Figure 5 with 2 supplements

ahctf1 heterozygosity amplifies cell death in dox-treated TO(krasG12V)T/+ hepatocytes in the presence and absence of Tp53.
(a) Representative maximum intensity projection images of Annexin 5-mKate fluorescence (white puncta), indicating cells undergoing apoptosis in TO(krasG12V)T/+ livers of the indicated ahctf1 and tp53 genotypes. Scale bar 25 µm. (b) Quantification of the density of Annexin 5 fluorescent foci in TO(krasG12V)T/+ livers of the indicated ahctf1 and tp53 genotypes (n ≥ 11). (c) RT-quantitative PCR (RT-qPCR) analysis of the specified mRNAs in TO(krasG12V)T/+ micro-dissected livers of the indicated ahctf1 and tp53 genotypes (n = 3 biological replicates). Data are expressed as mean ± standard error of the mean (SEM). Significance was calculated using a one-way analysis of variation (ANOVA) with Tukey’s multiple comparisons test.
-
Figure 5—source data 1
Figure 5b: Quantitation of Annexin 5-mKate fluorescence per volume (µm3) in livers of dox-treated TO(krasG12V)T/+ zebrafish larvae; role of ahctf1 and tp53 mutation.
Figure 5c: Multiple mRNA expression analyses by RT-quantitative PCR (RT-qPCR) of micro-dissected livers from dox-treated TO(krasG12V)T/+ zebrafish larvae; role of ahctf1 and tp53 mutation.
- https://cdn.elifesciences.org/articles/73407/elife-73407-fig5-data1-v2.xlsx
Figure 5—figure supplement 1
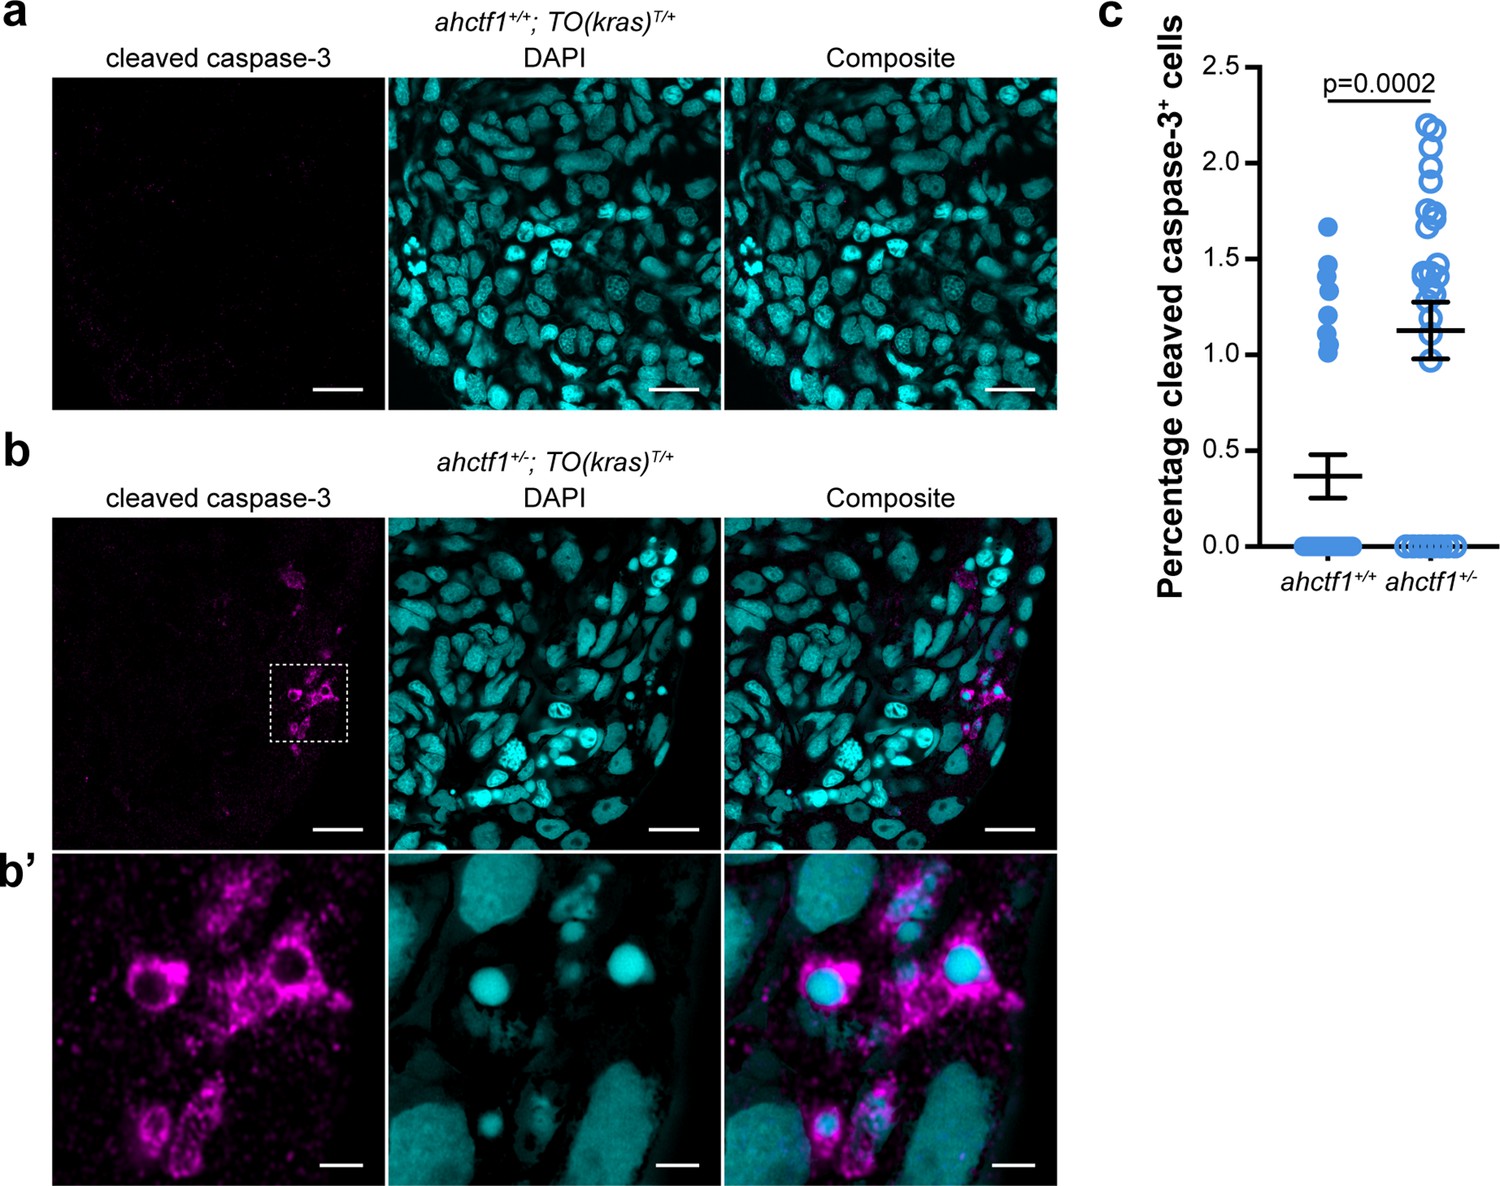
ahctf1 heterozygosity increases the percentage of TO(krasG12V)T/+ hepatocytes expressing the cleaved, active form of caspase-3.
(a) Representative Airyscan images of ahctf1+/+;TO(krasG12V)T/+ liver cryosections stained with an antibody specific for the cleaved (active) form of caspase-3 (magenta) marking apoptosis and DAPI (cyan) marking DNA. Scale bar 5 µm. (b) Cryosections of liver from dox-treated ahctf1+/−;TO(krasG12V)T/+ larvae reveal hepatocytes exhibiting cleaved caspase-3 staining and fragmented nuclei with condensed chromatin. Scale bar 5 µm. (b’) Inset showing higher magnification image of cleaved caspase-3-positive hepatocytes in livers from ahctf1+/−;TO(krasG12V)T/+ larvae. Scale bar 2 µm. (c) Quantification of the percentage of cells positive for active cleaved caspase-3 (n = 28 liver sections). Data are expressed as mean ± standard error of the mean (SEM). Significance was calculated using a Student’s t-test.
Figure 5—figure supplement 2
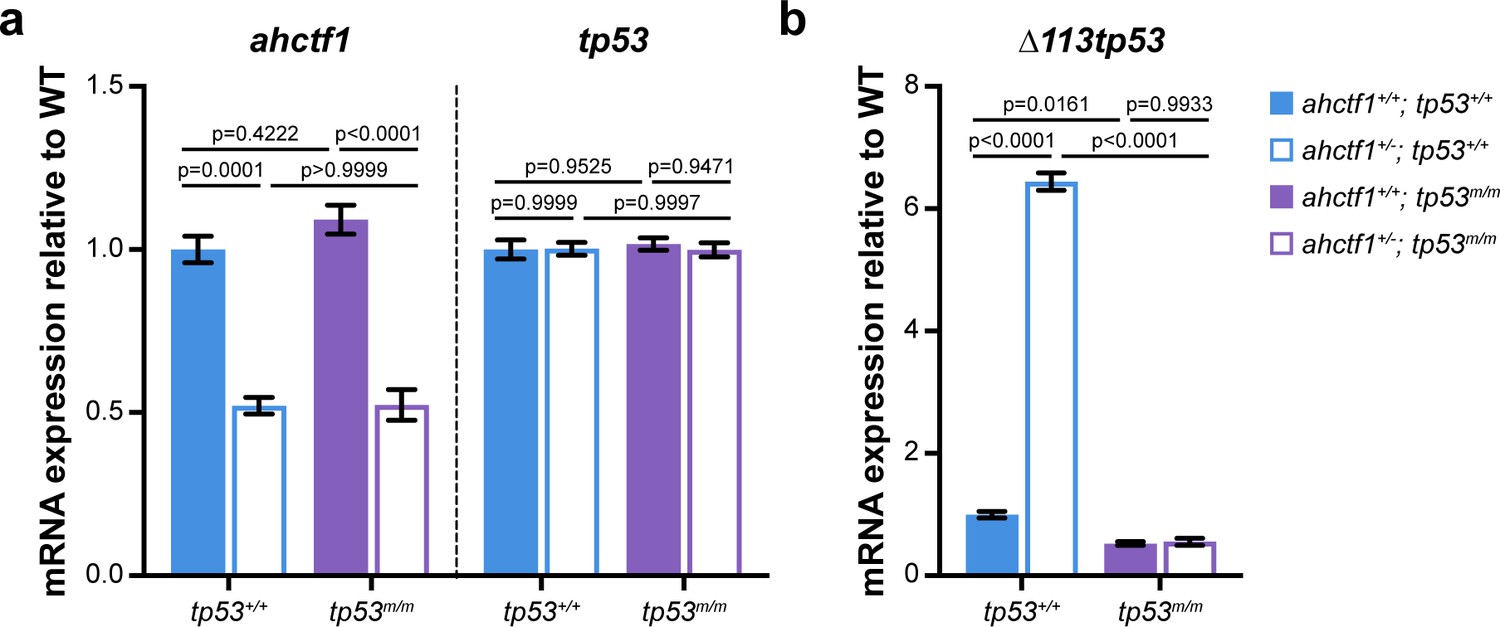
ahctf1 heterozygosity reduces ahctf1 mRNA expression and increases expression of ∆113tp53.
(a) RT-quantitative PCR (RT-qPCR) analysis of ahctf1 and tp53 mRNA expression and (b) ∆113tp53 (target of Tp53) mRNA expression in micro-dissected livers of dox-treated TO(krasG12V)T/+ larvae of the indicated ahctf1 and tp53 genotypes (n = 3 biological replicates). Data are expressed as mean ± standard error of the mean (SEM). Significance was calculated using a one-way analysis of variation (ANOVA) with Tukey’s multiple comparisons test.
Figure 6 with 1 supplement
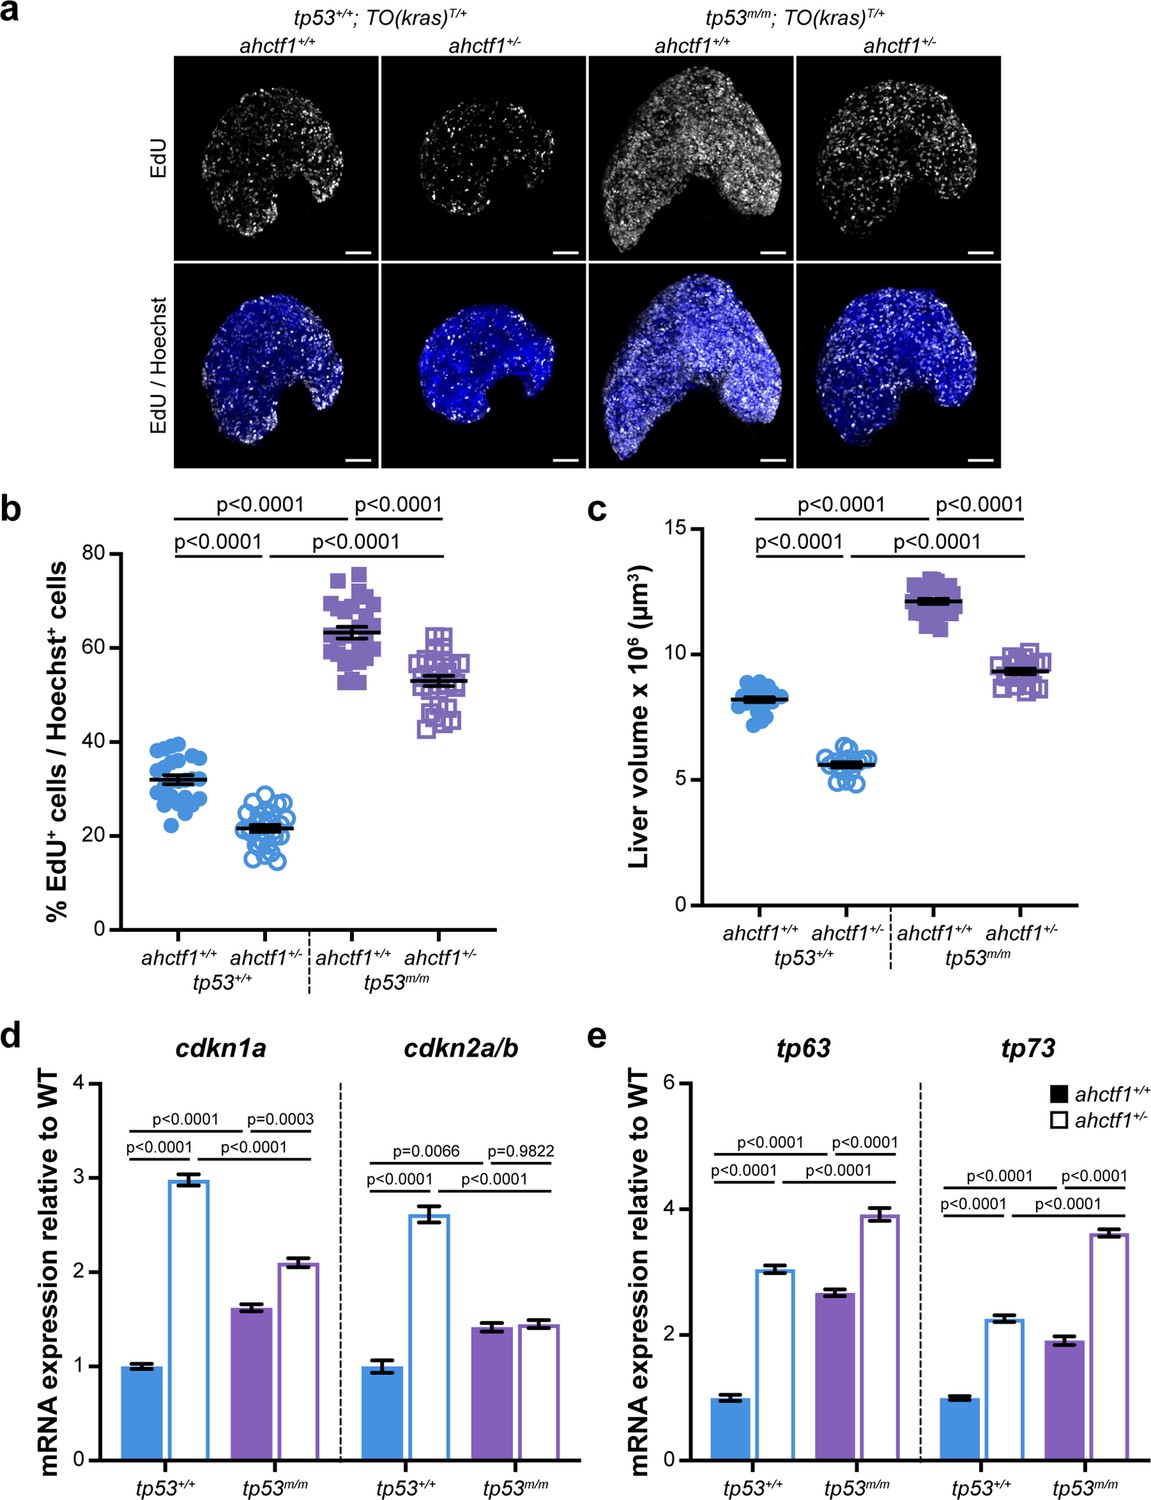
ahctf1 heterozygosity restricts DNA replication in dox-treated TO(krasG12V)T/+ hepatocytes in the presence and absence of Tp53.
(a) Representative maximum intensity projection images of EdU incorporation (white puncta) into TO(krasG12V)T/+ livers of the indicated ahctf1 and tp53 genotypes. Scale bar 25 µm. (b) Quantification of the percentage of EdU-positive nuclei per Hoechst 33342-positive nuclei (n ≥ 25). (c) Impact of ahctf1 heterozygosity and homozygous tp53 mutation on liver volume in dox-treated TO(krasG12V)T/+ larvae (n ≥ 17). (d) RT-quantitative PCR (RT-qPCR) analysis of mRNA expression of the cell cycle regulators, cdkn1a and cdkn2a/b and (e) tp63 and tp73 expression in TO(krasG12V)T/+ micro-dissected livers of the indicated ahctf1 and tp53 genotypes (n = 3 biological replicates). Data are expressed as mean ± standard error of the mean (SEM). Significance was assessed using a one-way analysis of variation (ANOVA) with Tukey’s multiple comparisons test.
-
Figure 6—source data 1
Figure 6d: cdkna1 and cdkna2a/b mRNA expression analyses by RT-quantitative PCR (RT-qPCR) of micro-dissected livers from doxycycline (dox)-treated TO(krasG12V)T/+ zebrafish larvae; role of ahctf1 and tp53 mutation.
Figure 6e: p63 and p73 mRNA expression analyses by RT-qPCR of micro-dissected livers from doxycycline (dox)-treated TO(krasG12V) T/+ zebrafish larvae; role of ahctf1 and tp53 mutation.
- https://cdn.elifesciences.org/articles/73407/elife-73407-fig6-data1-v2.xlsx
Figure 6—figure supplement 1
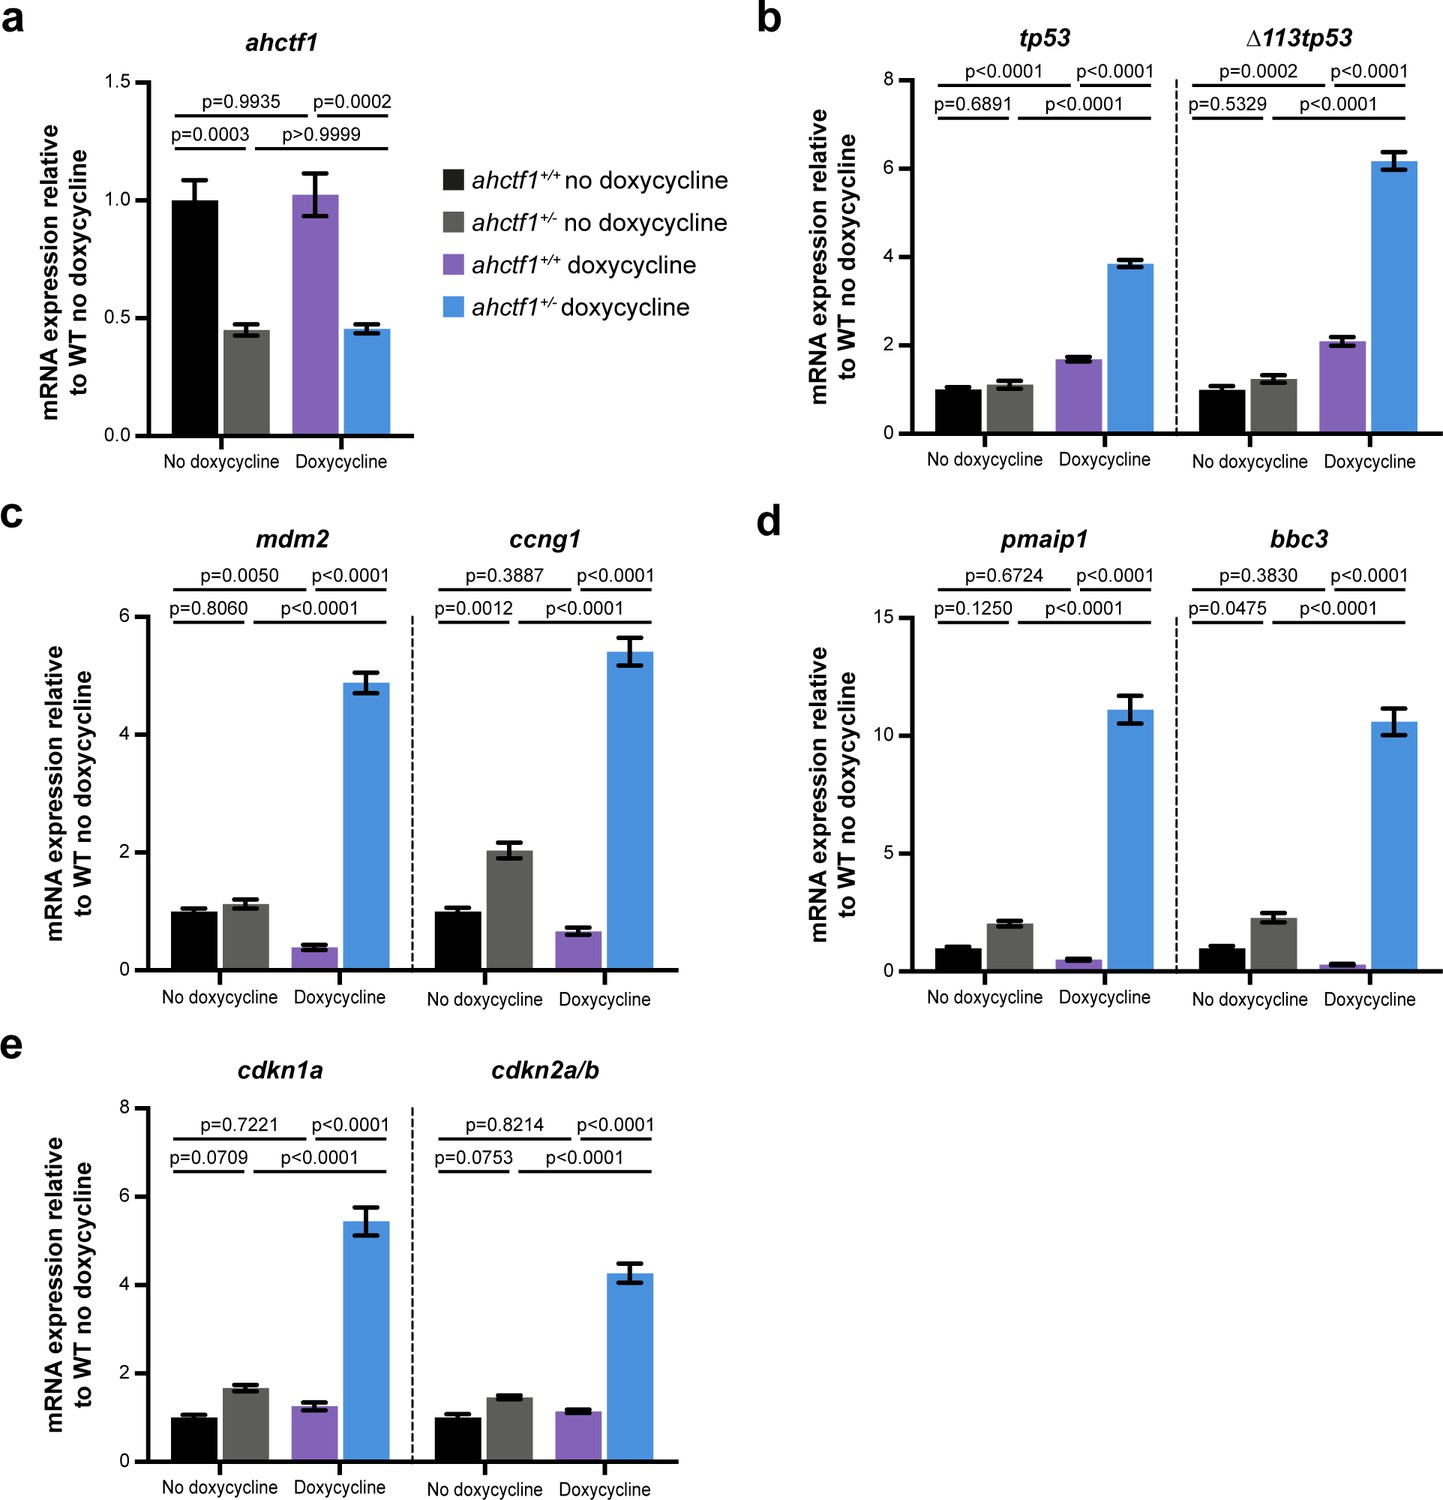
ahctf1 heterozygosity results in activation of a tp53 transcriptional programme in dox-treated adult male TO(krasG12V)T/+ zebrafish.
(a) RT-quantitative PCR (RT-qPCR) analysis of ahctf1. (b, c) Expression of tp53 mRNA and Tp53 target genes. (d) mRNA expression of cell death and (e) cell cycle regulators in the livers of TO(krasG12V)T/+ adult zebrafish of the indicated ahctf1 genotype and dox treatment (n = 3 biological replicates). Data are expressed as mean ± standard error of the mean (SEM). Significance was calculated using a one-way analysis of variation (ANOVA) with Tukey’s multiple comparisons test.
Figure 7 with 5 supplements
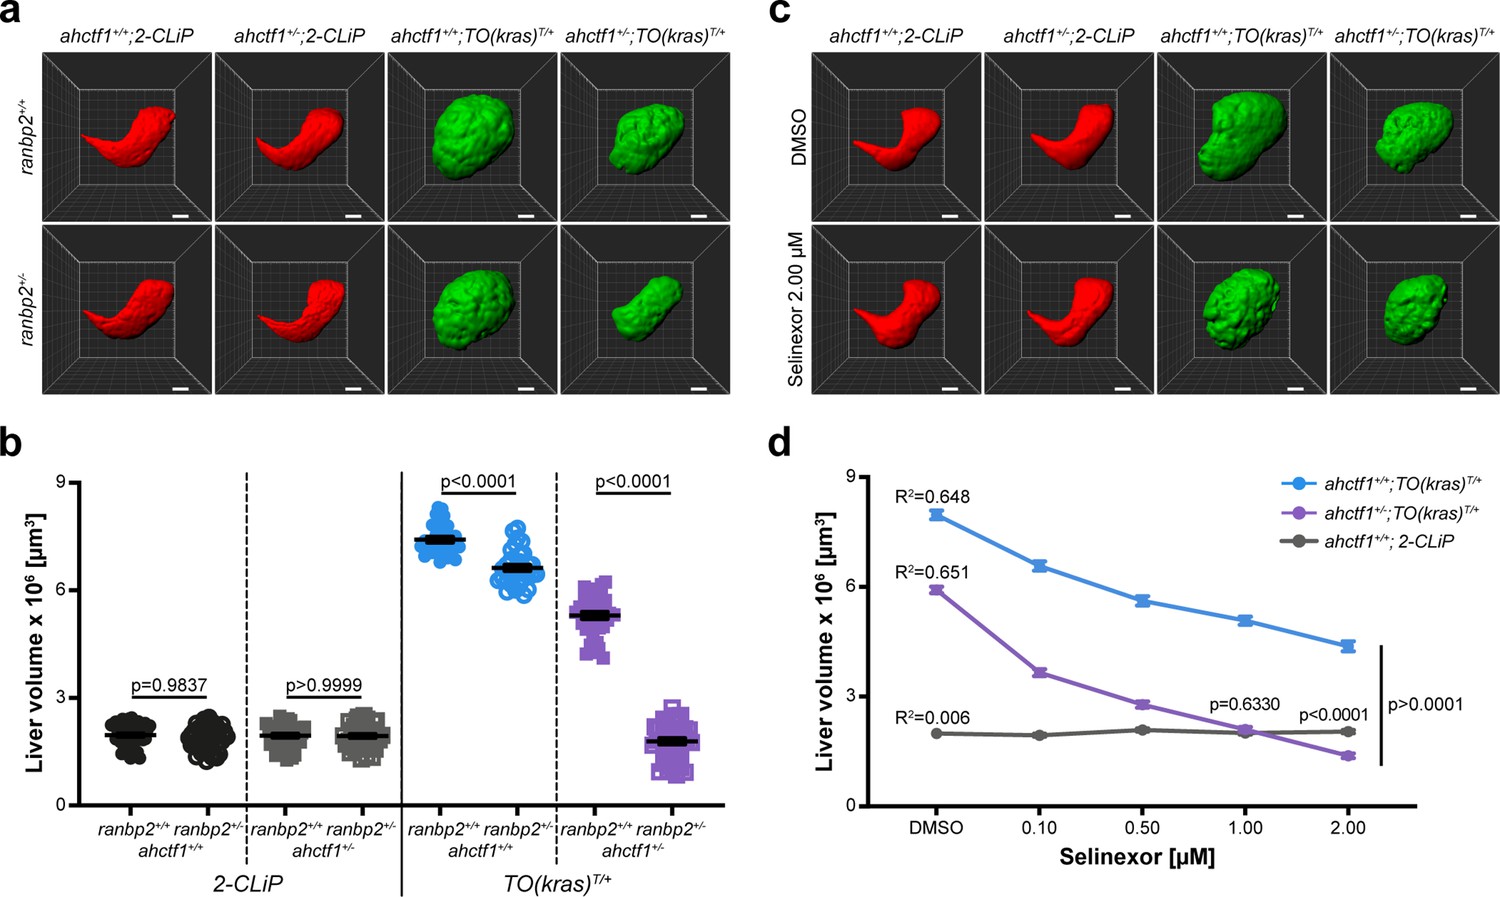
Combinatorial targeting of NUPs and Selinexor treatment restricts liver enlargement in dox-treated TO(krasG12V)T/+ hepatocytes.
(a) Representative three-dimensional reconstructions of livers from 2-CLiP and TO(krasG12V)T/+ larvae of the indicated ahctf1 and ranbp2 genotypes. Scale bar 25 µm. (b) Impact of ahctf1 heterozygosity and ranbp2 heterozygosity on liver volume in 2-CLiP and TO(krasG12V)T/+ larvae (n ≥ 30). Significance was calculated using a one-way analysis of variation (ANOVA) with Tukey’s multiple comparisons test. (c) Representative three-dimensional reconstructions of TO(krasG12V)T/+ livers of the indicated ahctf1 genotype treated with dimethyl sulfoxide (DMSO) or 2.00 µM Selinexor from 5 to 7 dpf. (d) Dose-dependent impact of Selinexor treatment on liver volume in 2-CLiP, ahctf1+/+;TO(krasG12V)T/+ and ahctf1+/−;TO(krasG12V)T/+ larvae (n ≥ 20). Data are expressed as mean ± standard error of the mean (SEM). Significance was calculated by linear regression analysis.
-
Figure 7—source data 1
Figure 7b: Quantitation of liver volume (µm3) of TO(krasG12V)T/+ zebrafish larvae; role of ahctf1 and ranbp2 mutation.
Figure 7d: Quantitation of liver volume (µm3) of TO(krasG12V)T/+ zebrafish larvae; impact of ahctf1 mutation and Selinexor treatment individually and in combination.
- https://cdn.elifesciences.org/articles/73407/elife-73407-fig7-data1-v2.xlsx
Figure 7—figure supplement 1
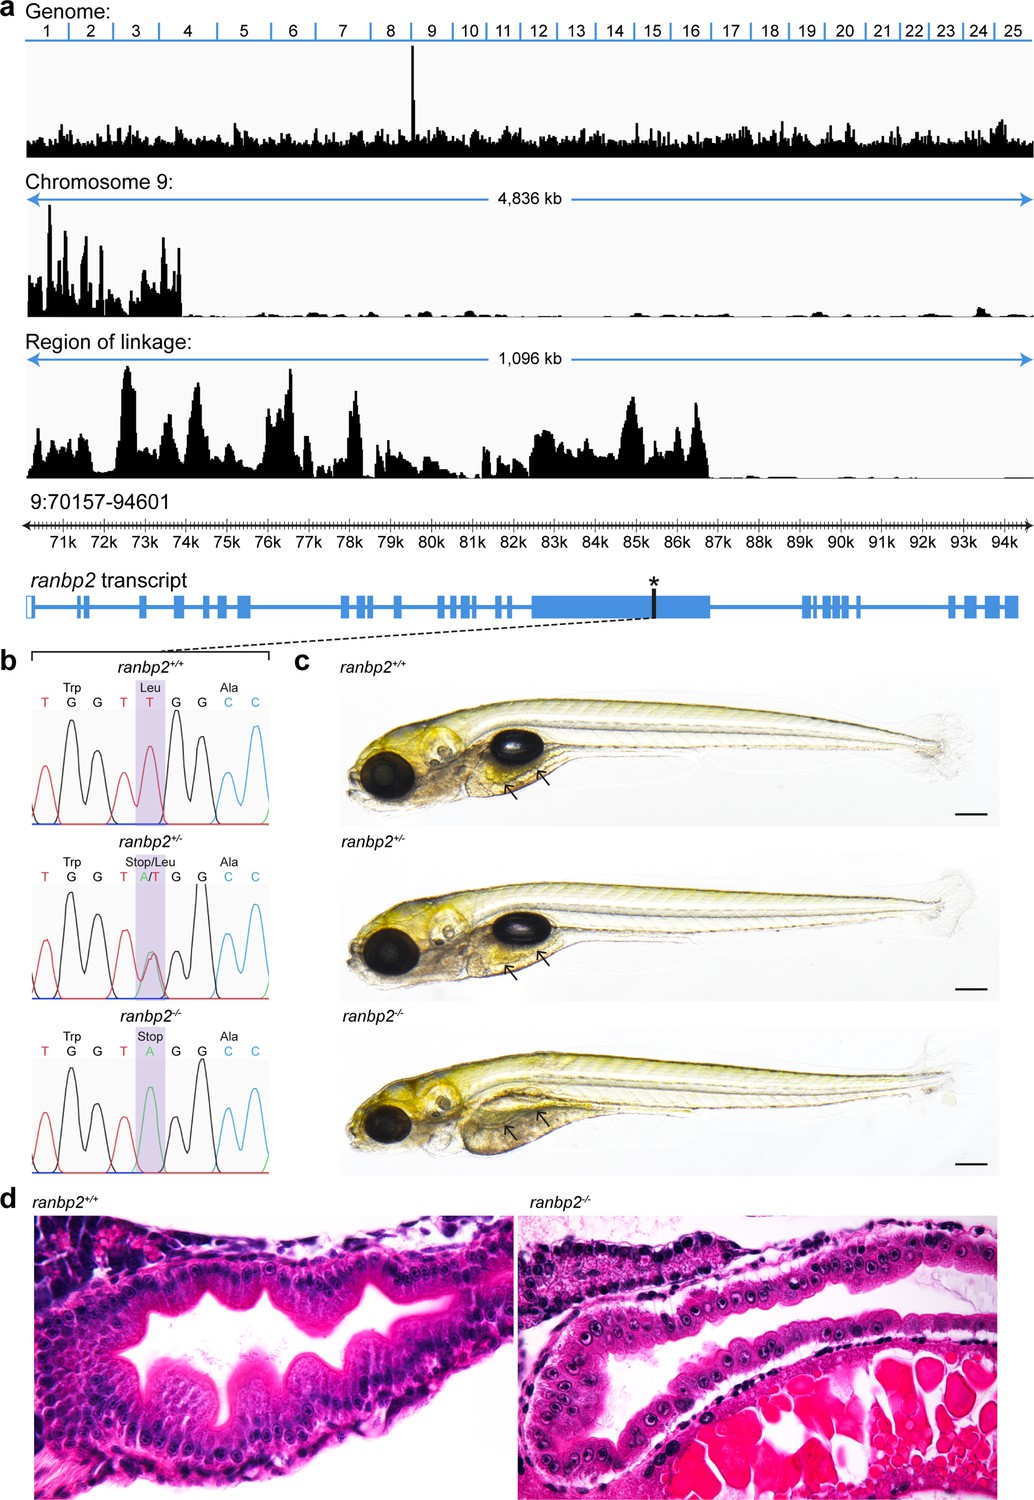
Genetic and morphological characterisation of the ranbp2 mutant.
(a) Positional cloning of the zebrafish mutant, s452 identified in a transgene assisted ENU-mutagenesis screen for mutations affecting endodermal organ morphogenesis (Ober et al., 2006) using whole-genome sequencing and homozygosity mapping. The genomic region containing the s452 causal mutation is derived exclusively from the initial ENU mutated allele and is defined by increased homozygosity. In s452 mutants the region of linkage is restricted to a <1.1-kb region on chromosome 9 within the ranbp2 gene. Plot displays genomic homozygosity across 25 chromosomes, chromosome 9 and the region of linkage. The genome position of ranbp2 within this region and a schematic diagram of the ranbp2 transcript with an asterisk denoting the position of the mutation are also shown. (b) Sanger sequencing chromatographs reveal a T>A transversion mutation introducing a premature stop codon (TTG>TAG). (c) Brightfield images reveal abnormalities in the gross morphology of homozygous mutant ranbp2 larvae at 7 dpf. ranbp2−/− larvae exhibit a thinner, flatter intestinal epithelium compared to wildtype and heterozygous ranbp2 larvae (arrows). They also exhibit a smaller jaw, smaller eyes, failure to inflate the swim bladder and delayed resorption of the yolk. Scale bar 200 µm. (d) Sagittal histological sections of 5 dpf ranbp2 larvae stained with haematoxylin and eosin. Intestinal epithelial cells in ranbp2−/− larvae are smaller, unpolarised and the epithelium lacks characteristic folding, indicative of a proliferation defect.
Figure 7—figure supplement 2
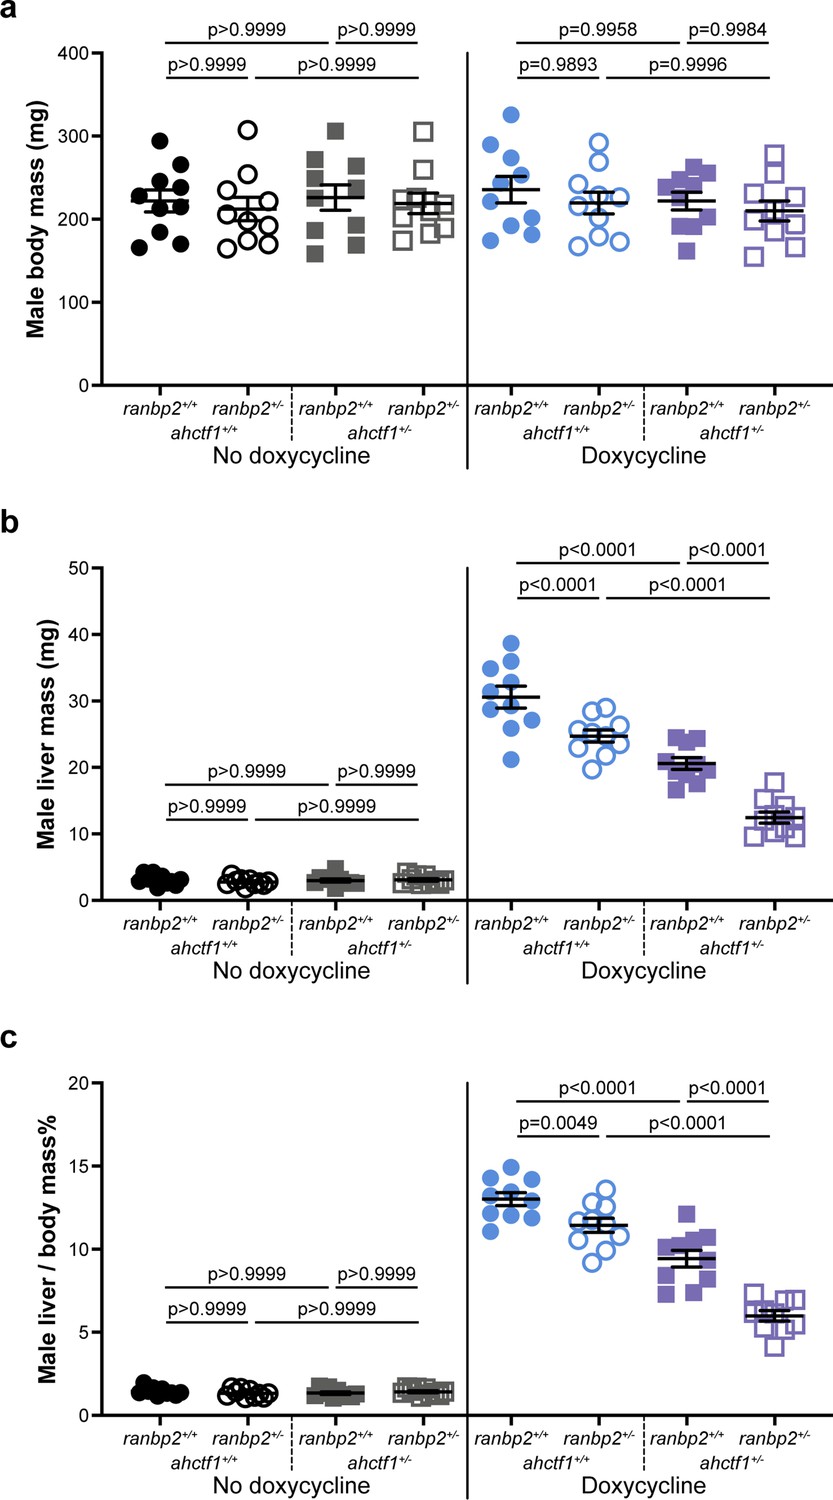
Combinatorial targeting of ahctf1 and ranbp2 restricts krasG12V-driven liver enlargement in adult male zebrafish.
Impact of ahctf1 heterozygosity and ranbp2 heterozygosity, individually and in combination, of (a) body mass, (b) liver mass, and (c) liver-to-body-mass ratio of adult male TO(krasG12V)T/+ zebrafish of the indicated dox treatment (n = 10). Data are expressed as mean ± standard error of the mean (SEM). Significance was calculated using a one-way analysis of variation (ANOVA) with Tukey’s multiple comparisons test.
Figure 7—figure supplement 3
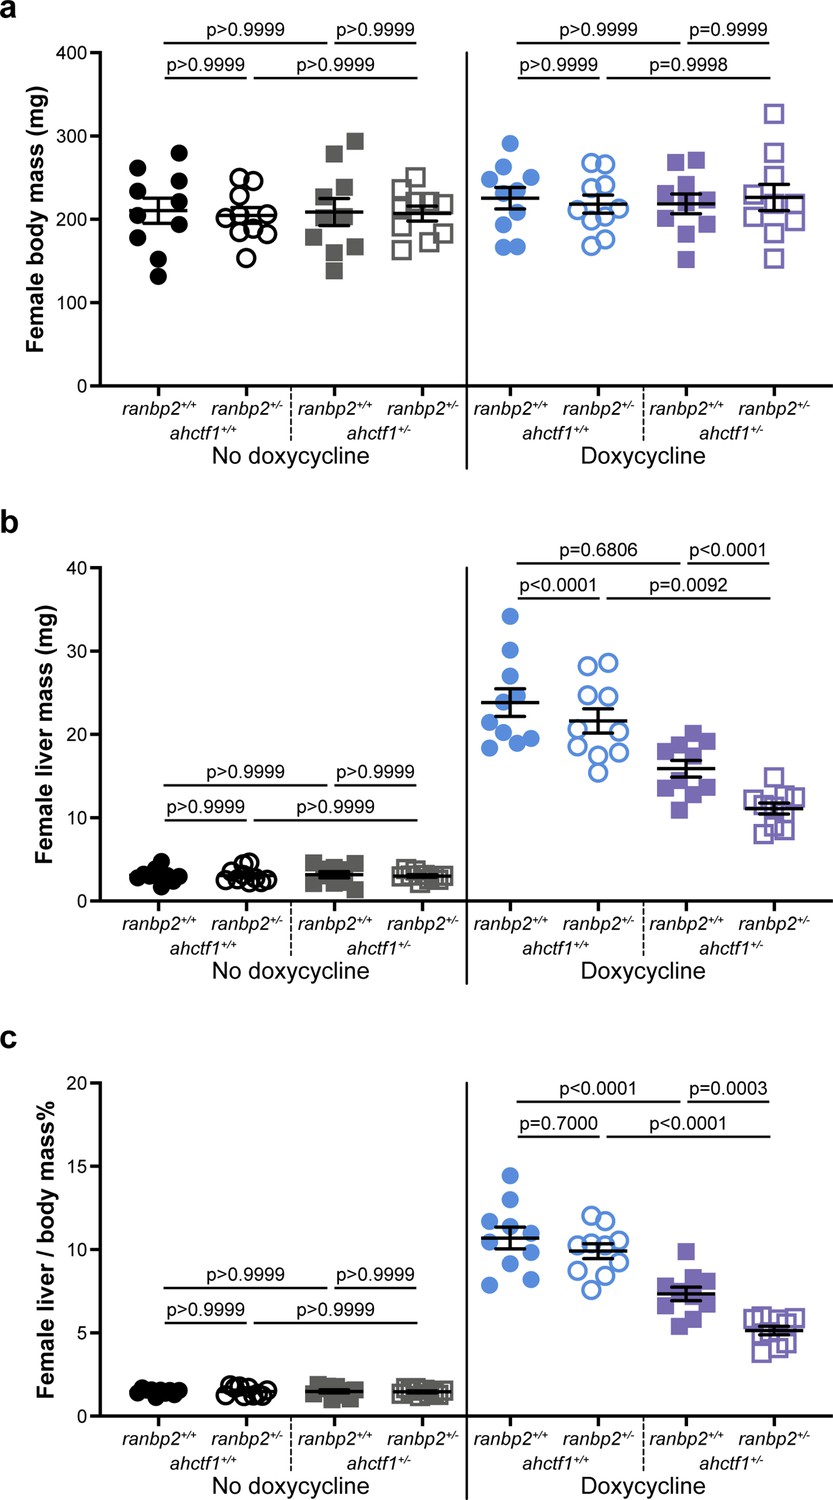
Combinatorial targeting of ahctf1 and ranbp2 restricts krasG12V-driven liver enlargement in adult female zebrafish.
Impact of ahctf1 heterozygosity and ranbp2 heterozygosity, individually and in combination, on (a) body mass, (b) liver mass, and (c) liver-to-body-mass ratio of adult female TO(krasG12V)T/+ zebrafish of the indicated dox treatment (n = 10). Data are expressed as mean ± standard error of the mean (SEM). Significance was calculated using a one-way analysis of variation (ANOVA) with Tukey’s multiple comparisons test.
Figure 7—figure supplement 4
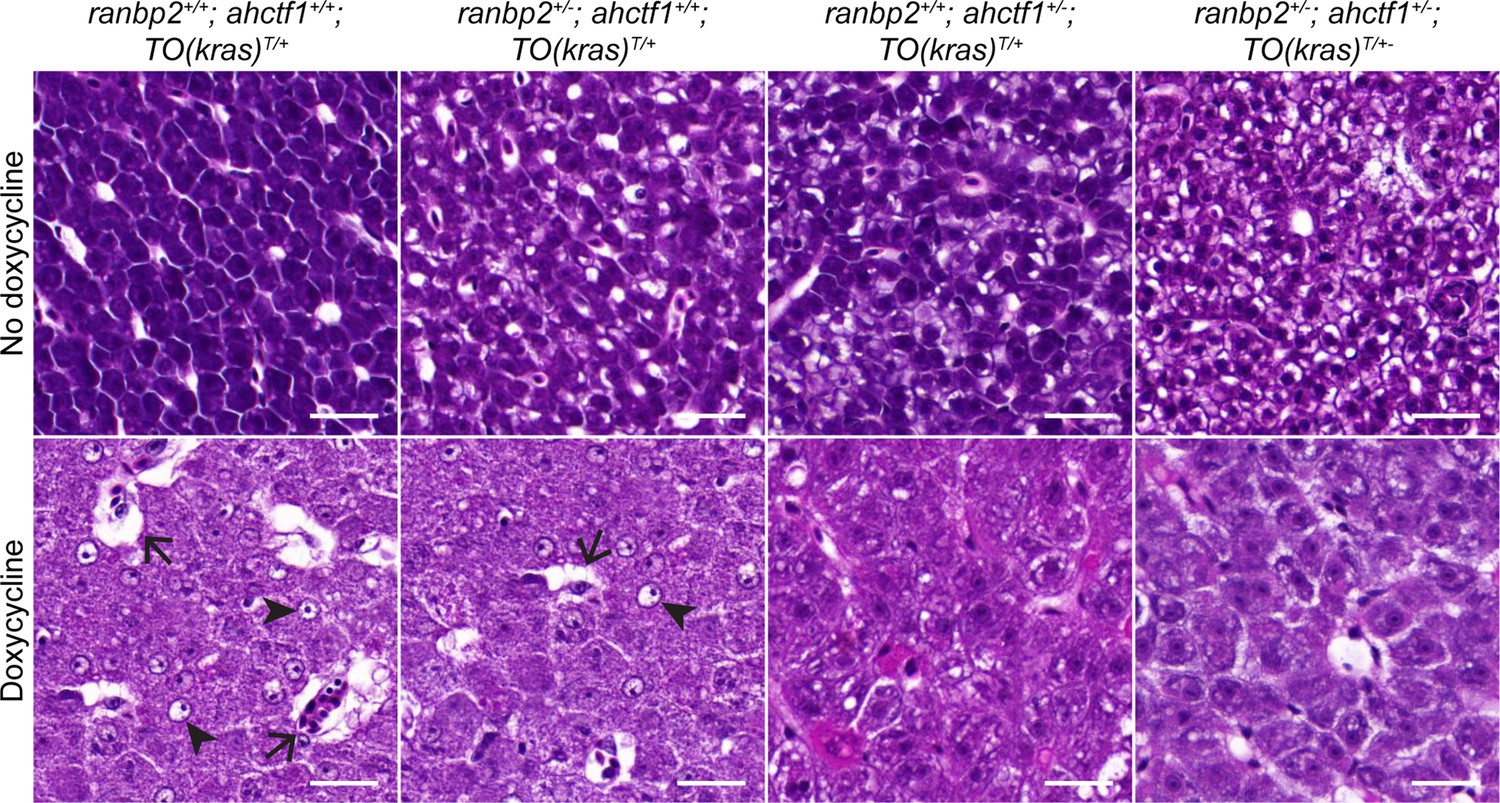
Doxycycline treatment of adult male TO(krasG12V)T/+ zebrafish results in the development of histopathological features of hepatocellular carcinoma (HCC).
Histological sections of adult male TO(krasG12V)T/+ zebrafish livers of the indicated ahctf1 and ranbp2 genotypes, with and without dox treatment, stained with haematoxylin and eosin. In vehicle-treated (no dox) adults, hepatocytes are densely packed and well differentiated. In contrast, the hepatocytes in dox-treated animals expressing oncogenic KrasG12V and wildtype (WT) ahctf1 are poorly differentiated and exhibit multiple cytological abnormalities, including pyknotic nuclei (arrowheads) and vacuolation (arrows). The integrity of cells is partially restored in animals that are heterozygous for either ahctf1, ranbp2, or a combination of both (bottom row, right panel). Scale bar 25 µm.
Figure 7—figure supplement 5
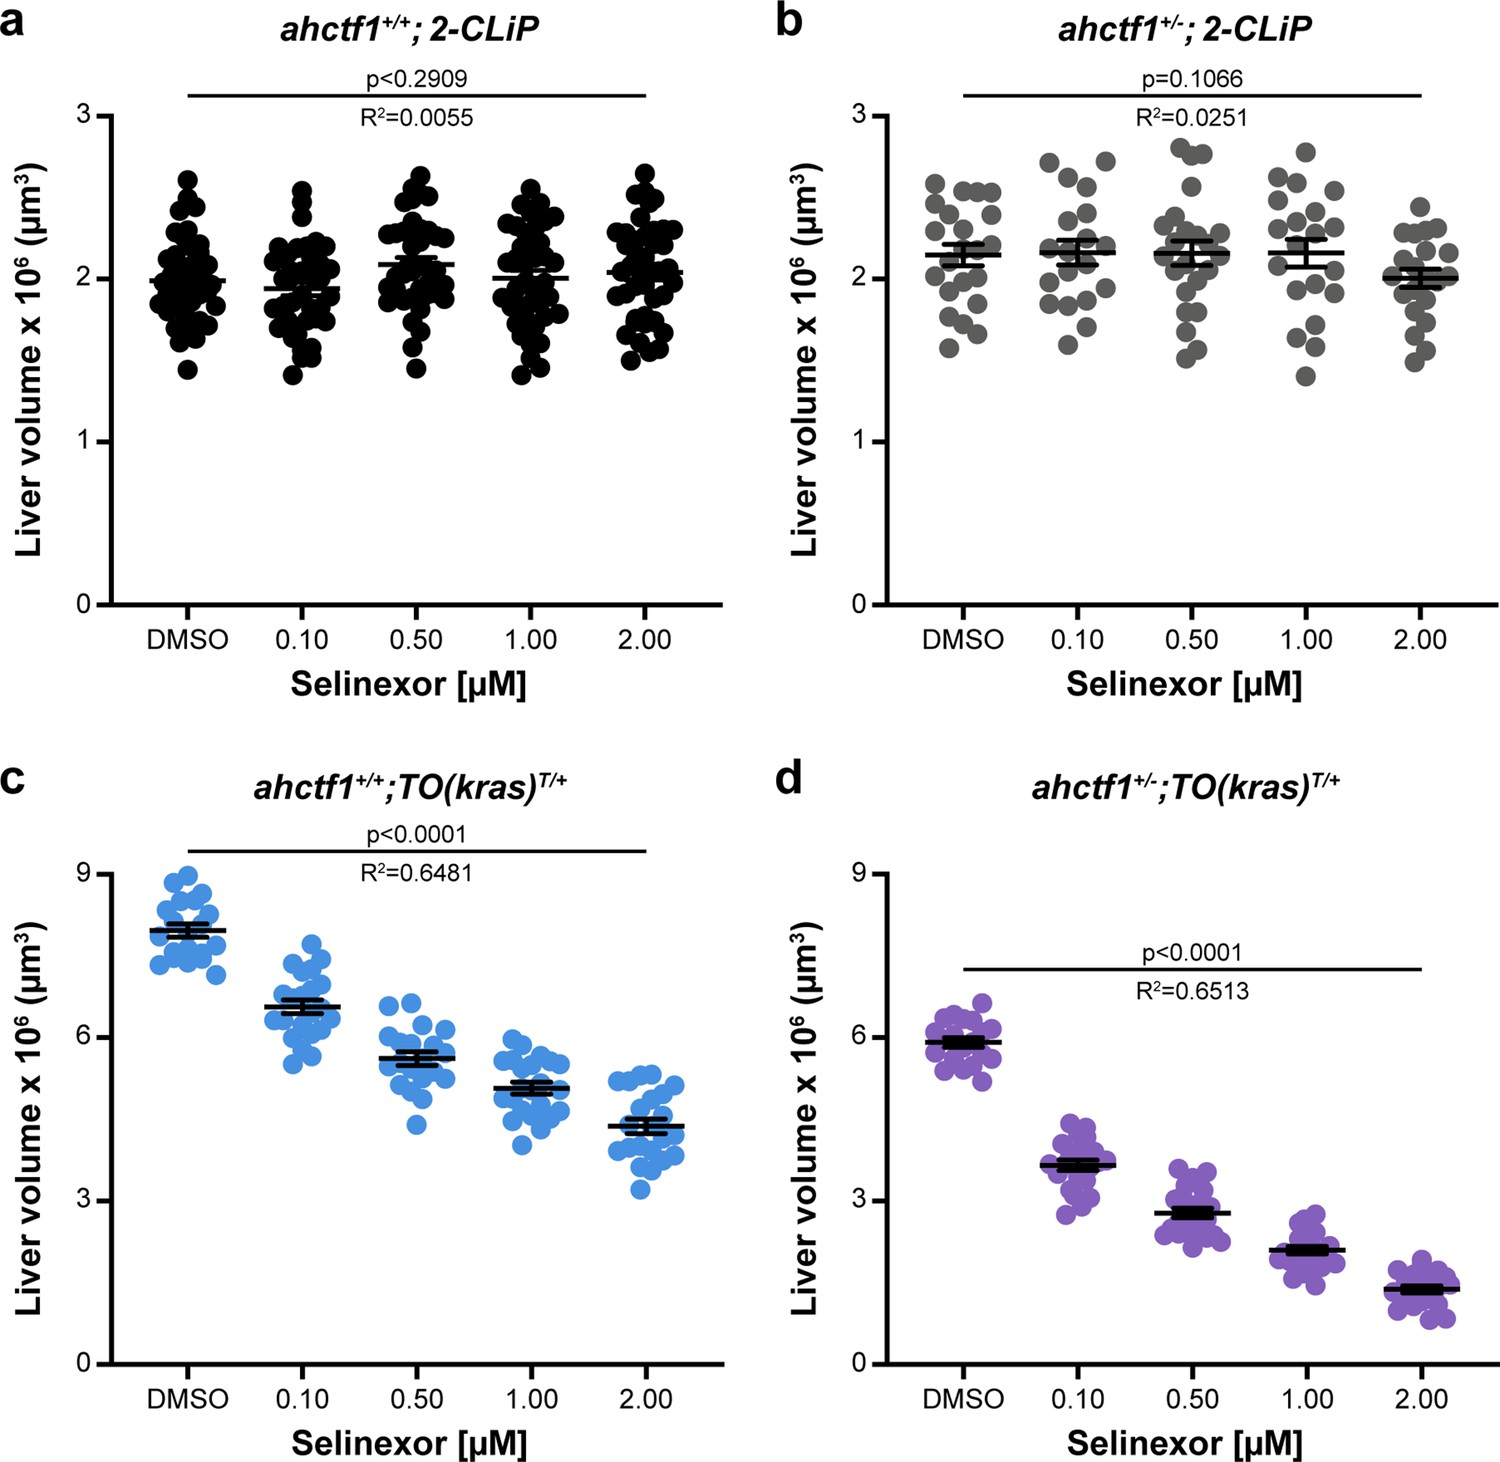
Combination of Selinexor treatment and ahctf1 heterozygosity reduces liver volume in TO(krasG12V)T/+ larvae but has no impact on liver volume in 2-CLiP larvae.
Impact of Selinexor treatment (0.10–2.00 µM) on liver volume in (a) ahctf1+/+;2-CLiP larvae (n ≥ 40). (b) ahctf1+/−;2-CLiP larvae (n ≥ 19). (c) ahctf1+/+;TO(krasG12V)T/+ larvae (n ≥ 20). (d) ahctf1+/−;TO(krasG12V)T/+ larvae (n >20). Data are expressed as mean ± standard error of the mean (SEM). Significance was calculated using a one-way analysis of variation (ANOVA) with Tukey’s multiple comparisons test and linear regression analysis.
Figure 8 with 1 supplement
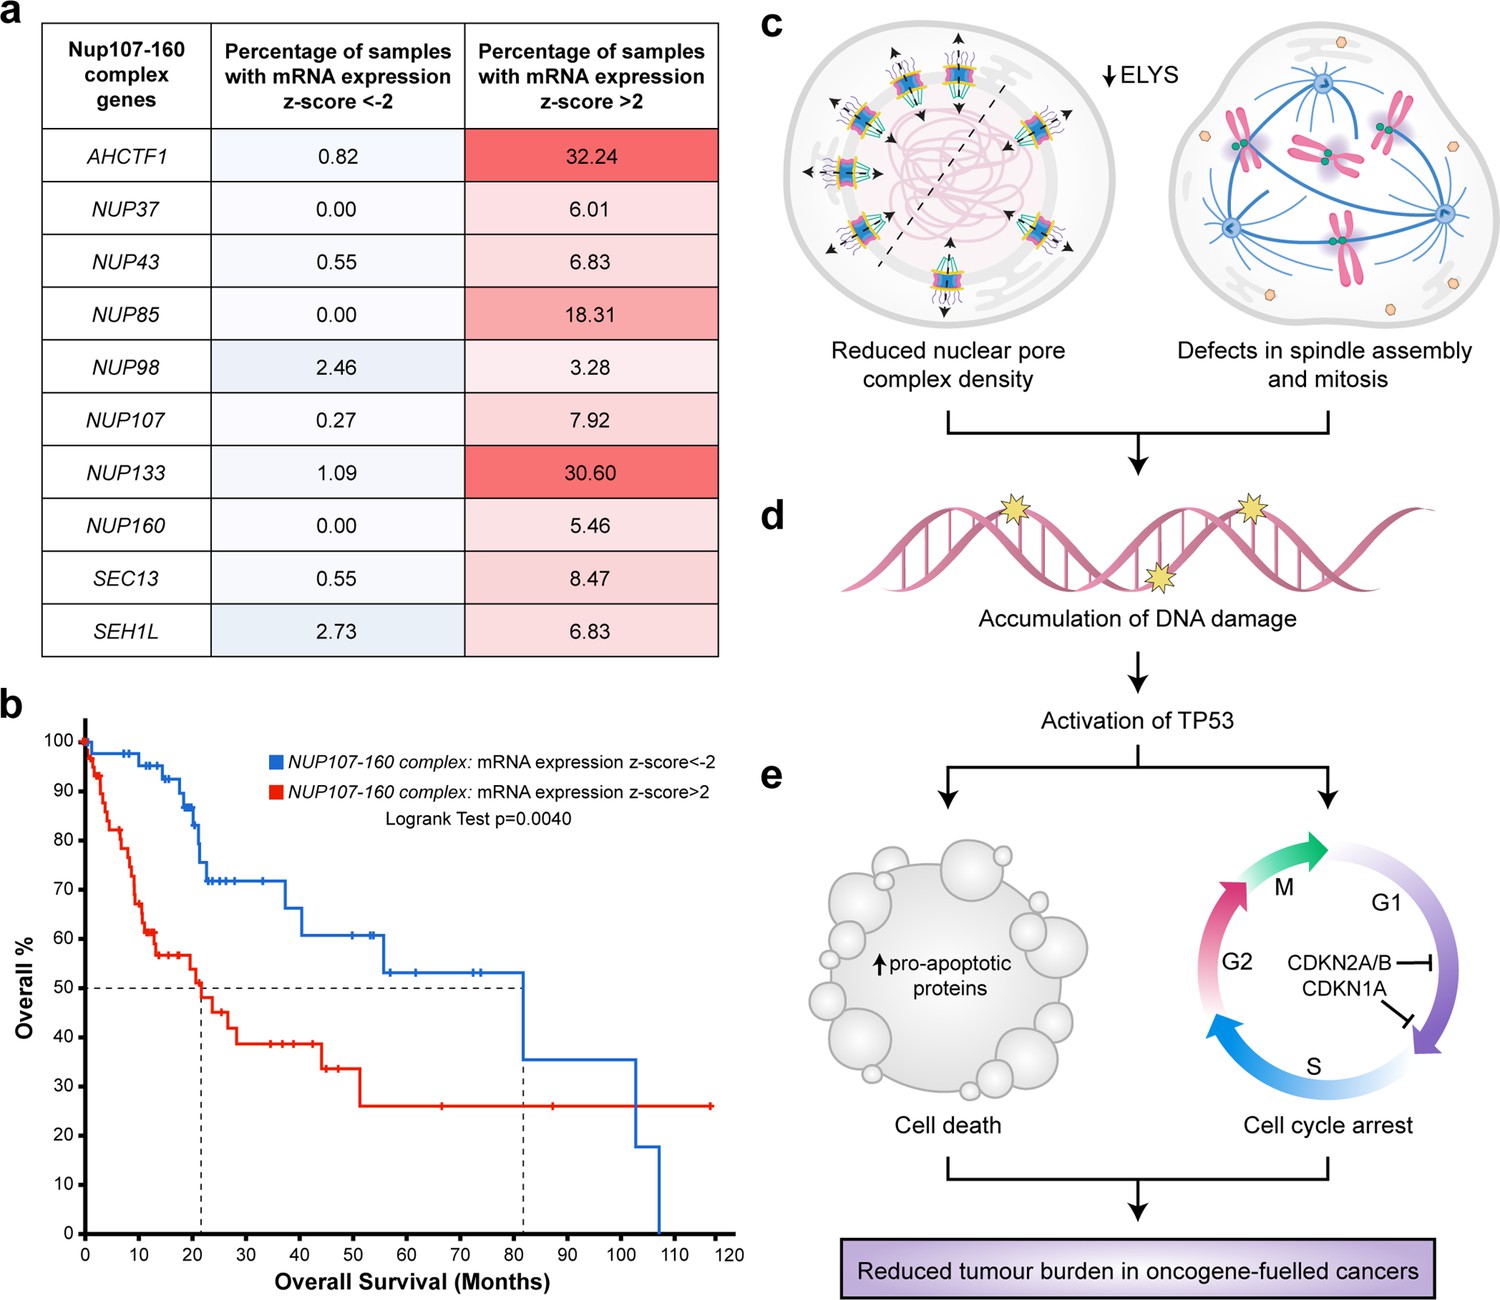
Targeting nuclear pore complexes (NPCs) is a promising therapeutic approach for hepatocellular carcinoma (HCC).
(a) Heatmap based on percentage of hepatocellular carcinoma (LIHC) samples in The Cancer Genome Atlas (TCGA) with mRNA expression levels of NUP107–160 components that are under-expressed (z-score <−2: over 2 standard deviations below the mean expression of those genes in diploid samples) or overexpressed (z-score >2: over 2 standard deviations above the mean expression of those genes in diploid samples) analysed through the cBioPortal for Cancer Genomics (Cerami et al., 2012; Gao et al., 2013). See Figure 8—source data 1. (b) Probability of overall survival of HCC patients linked to samples with mRNA expression z-scores >2 for one or more NUP107–160 complex components (red line; 63 cases); median probability of overall survival 21.70 months. Probability of overall survival of HCC patients linked to samples with mRNA expression z-scores <−2 for one or more NUP107–160 complex components (blue line; 45 cases); median probability of overall survival 81.73 months. (c) Schematic depiction of two cellular processes disrupted by mild Elys depletion, leading to (d) accumulation of DNA damage and activation of Tp53 transcription programmes. (e) Induction of cell death and cell cycle arrest in hyperproliferative oncogene-expressing cancer cells.
-
Figure 8—source data 1
Figure 8a: mRNA expression z-scores (RNAseq V2 RSEM) for AHCTF1 and the nine other genes encoding components of the NUP107–160 complex, relative to the mean expression of each gene of interest in patient samples that are diploid for that gene.
- https://cdn.elifesciences.org/articles/73407/elife-73407-fig8-data1-v2.xlsx
Figure 8—figure supplement 1
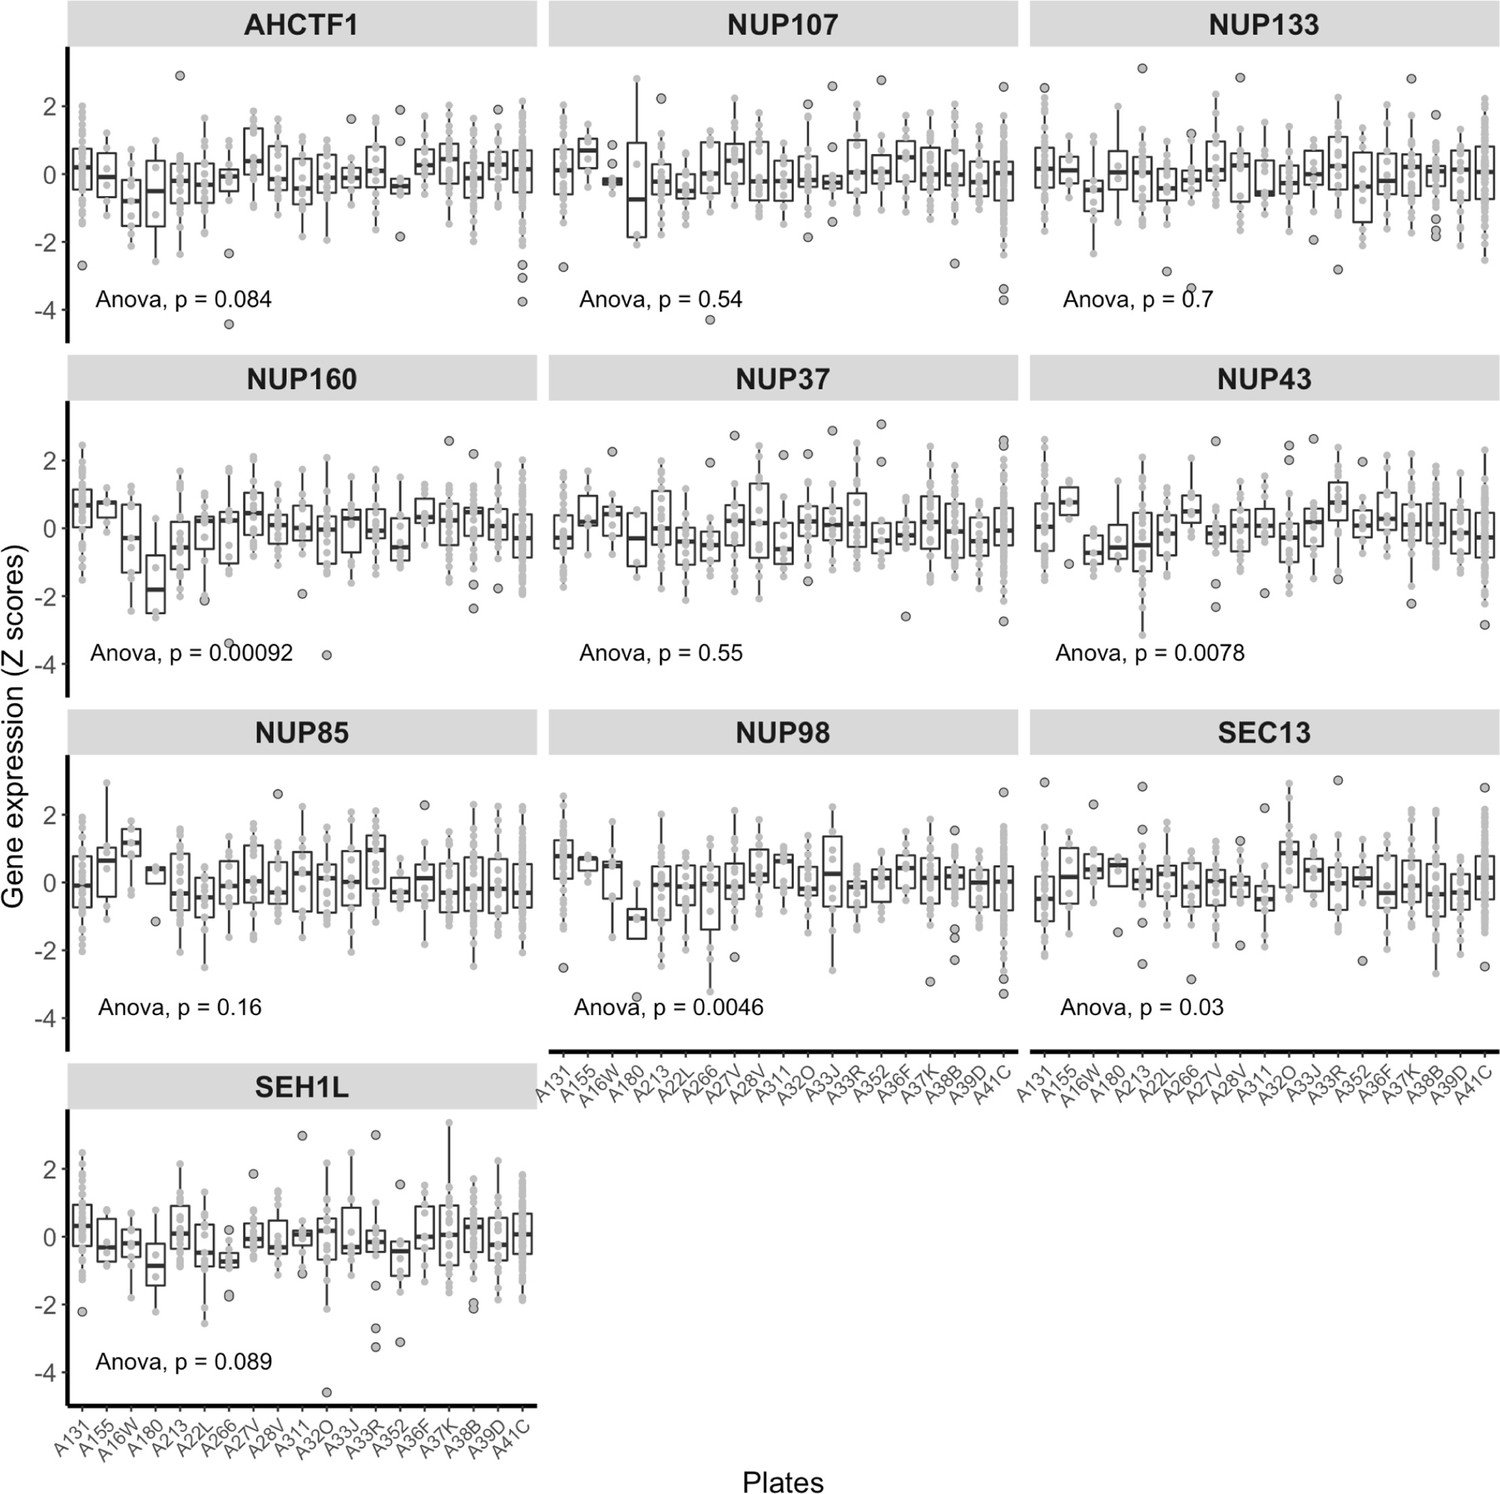
NUP107–160 complex gene expression in the The Cancer Genome Atlas (TCGA) liver hepatocellular carcinoma (LIHC) dataset is largely unaffected by unwanted variation.
The expression patterns of the genes encoding the 10 components of the NUP107–160 complex across sequencing plates in the TCGA LIHC RNA-Seq dataset. The X axes show the IDs for the 19 sequencing plates, and the Y axes represent z-scores of gene expression. The differences between average expression across individual sequencing plates were tested using analysis of variation (ANOVA) (Molania et al., 2022).
Tables
Key resources table
| Reagent type (species) or resource | Designation | Source or reference | Identifiers | Additional information |
|---|---|---|---|---|
| Gene (Danio rerio) | ahctf1 | Ensembl | ENSDARG00000077530 | |
| Gene (Danio rerio) | ranbp2 | Ensembl | ENSDARG00000093125 | |
| Gene (Danio rerio) | tp53 | Ensembl | ENSDARG00000035559 | |
| Genetic reagent Zebrafish (Danio rerio) | ahctf1ti262 (TU) | European Zebrafish Resource Centre (EZRC) | ZDB-ALT-980203-1165 | Also known as flotte lotte |
| Genetic reagent Zebrafish (Danio rerio) | ranbp2s452 (TU) | Heath Lab (see this paper; Figure 7—figure supplement 1) | ||
| Genetic reagent Zebrafish (Danio rerio) | Tp53zdf1 (AB) | European Zebrafish Resource Centre (EZRC) | ZDB-ALT-050428-215201 | Also known as Tp53M214K |
| Genetic reagent Zebrafish (Danio rerio) | Tg(fabp10:dsRed, ela31:GFP)gz12 | Zhiyuan Gong, National University of Singapore | PMID:18796162 | Also known as Lipan or 2CLiP |
| Genetic reagent Zebrafish (Danio rerio) | Tg(fabp10:rtTA2s-M2; TRE2:EGFP-krasG12V)gz32 | Zhiyuan Gong, National University of Singapore | PMID:23812423 | |
| Genetic reagent Zebrafish (Danio rerio) | Tg(actb2:SEC-Hsa.ANXA5-mKate2,cryaa:mCherry)uq24rp | Thomas Hall, Institute of Molecular Bioscience, University of Queensland | PMID:31754462 | |
| Antibody | mAb414 (Mouse monoclonal) | AbCam | Cat# ab24609 | IF (1:750) |
| Antibody | anti-γ-H2AX (Mouse monoclonal) | AbCam | Cat# ab11174 | IF (1:1000) |
| Antibody | anti-α-Tubulin DM1A (Mouse monoclonal) | Cell Signaling Technology | Cat#: 3873 | IF (1:1000) |
| Antibody | anti-cleaved Caspase3 (Rabbit polyclonal) | Cell Signaling Technology | Cat#: 9664 | IF (1:250) |
| Antibody | Donkey anti-Rabbit IgG (H+L) Highly Cross-Adsorbed Secondary Antibody, Alexa Fluor 647 (Donkey polyclonal) | Thermo Fisher Scientific | Cat#: A31573 | IF (1:500) |
| Antibody | Goat anti-Mouse IgG (H+L) Cross-Adsorbed Secondary Antibody, Alexa Fluor 647 (Goat polyclonal) | Thermo Fisher Scientific | Cat#: A21235 | IF (1:500) |
| Antibody | anti-Tp53 (9.1) (Mouse monoclonal) | AbCam | Cat# ab77813 | WB (1:500) |
| Antibody | anti-GAPDH (14C10) (Rabbit polyclonal) | Cell Signaling Technology | Cat#: 2118 | WB (1:1000) |
| Antibody | Goat Anti-Mouse Immunoglobulins/HRP (affinity isolated) (Goat polyclonal) | Dako | Cat#: P0447 | WB (1:5000) |
| Antibody | Goat Anti-Rabbit Immunoglobulins/HRP (affinity isolated) (Goat polyclonal) | Dako | Cat#: P0448 | WB (1:5000) |
| Commercial assay or kit | Active Ras Pull-Down and Detection kit | Thermo Fisher Scientific | Cat#: 16117 | |
| Commercial assay or kit | Click-iT Edu AF647 kit imaging kit | Invitrogen | Cat#: C10340 | |
| Chemical compound, drug | Selinexor (KPT-330) | Gift of Karyopharm Therapeutics | XPO1 inhibitor | |
| Chemical compound, drug | Doxycycline | Sigma Aldrich | Sigma D9891 | 20 μg/mL |
Additional files
Download links
A two-part list of links to download the article, or parts of the article, in various formats.
Downloads (link to download the article as PDF)
Open citations (links to open the citations from this article in various online reference manager services)
Cite this article (links to download the citations from this article in formats compatible with various reference manager tools)
ahctf1 and kras mutations combine to amplify oncogenic stress and restrict liver overgrowth in a zebrafish model of hepatocellular carcinoma
eLife 12:e73407.
https://doi.org/10.7554/eLife.73407


