ahctf1 and kras mutations combine to amplify oncogenic stress and restrict liver overgrowth in a zebrafish model of hepatocellular carcinoma
- Epigenetics and Development Division, Walter and Eliza Hall Institute of Medical Research, Australia
- Department of Medical Biology, University of Melbourne, Australia
- Centre for Dynamic Imaging, Advanced Technology and Biology Division, Walter and Eliza Hall Institute of Medical Research, Australia
- Department of Physiology, University of Melbourne, Australia
- Institute for Molecular Biosciences, University of Queensland, Australia
- Peter MacCallum Cancer Centre, Australia
- Murdoch Children's Research Institute, Australia
- Bioinformatics Division, Walter and Eliza Hall Institute of Medical Research, Australia
- Danish Stem Cell Center, University of Copenhagen, Denmark
- Department of Developmental Genetics, Max Planck Institute for Heart and Lung Research, Germany
- Department of Biological Science, National University of Singapore, Singapore
Abstract
The nucleoporin (NUP) ELYS, encoded by AHCTF1, is a large multifunctional protein with essential roles in nuclear pore assembly and mitosis. Using both larval and adult zebrafish models of hepatocellular carcinoma (HCC), in which the expression of an inducible mutant kras transgene (krasG12V) drives hepatocyte-specific hyperplasia and liver enlargement, we show that reducing ahctf1 gene dosage by 50% markedly decreases liver volume, while non-hyperplastic tissues are unaffected. We demonstrate that in the context of cancer, ahctf1 heterozygosity impairs nuclear pore formation, mitotic spindle assembly, and chromosome segregation, leading to DNA damage and activation of a Tp53-dependent transcriptional programme that induces cell death and cell cycle arrest. Heterozygous expression of both ahctf1 and ranbp2 (encoding a second nucleoporin), or treatment of heterozygous ahctf1 larvae with the nucleocytoplasmic transport inhibitor, Selinexor, completely blocks krasG12V-driven hepatocyte hyperplasia. Gene expression analysis of patient samples in the liver hepatocellular carcinoma (LIHC) dataset in The Cancer Genome Atlas shows that high expression of one or more of the transcripts encoding the 10 components of the NUP107–160 subcomplex, which includes AHCTF1, is positively correlated with worse overall survival. These results provide a strong and feasible rationale for the development of novel cancer therapeutics that target ELYS function and suggest potential avenues for effective combinatorial treatments.
Editor's evaluation
We believe that the study demonstrates the importance of nuclear pore complex components for Kras/p53 driven liver tumors. The findings made here in zebrafish may stimulate additional preclinical and mechanistic studies to test the role of nuclear pore components in cancer.
https://doi.org/10.7554/eLife.73407.sa0Introduction
Synthetic lethality describes the death of cells in response to individual mutations in two separate genes, neither of which is lethal alone. The phenomenon has emerged as a promising framework for cancer drug development (Gao and Lai, 2018). Inherent to the approach is the capacity to induce the death of a vulnerable cell population, such as oncogene-expressing cancer cells, and leave healthy cells unaffected. In the clinic, the use of poly(adenosine diphosphate [ADP]-ribose) polymerase (PARP) inhibitors to successfully treat tumours carrying mutations in the breast cancer susceptibility genes, BRCA1/BRCA2 (Lord and Ashworth, 2017), has validated the approach and driven the search for other clinically relevant gene pairings, including those that confer synthetic lethality in cancer cells expressing oncogenic mutations in KRAS (Luo et al., 2009; Wang et al., 2017). In this paradigm, the interacting gene is neither mutated nor oncogenic in its own right. Rather, its function is essential to maintain the tumourigenic state, inspiring the concept of non-oncogene addiction (Solimini et al., 2007).
In this study, we tested whether AHCTF1 exhibits the properties of a synthetic lethal interacting gene with mutant KRAS. We became interested in AHCTF1 when we and others showed that homozygous inheritance of an ENU-induced nonsense mutation in the zebrafish ahctf1 gene (ahctf1ti262) (de Jong-Curtain et al., 2009; Davuluri et al., 2008) disrupted nuclear pore formation and caused catastrophic levels of cell death in the intestinal epithelium and other highly proliferative cell compartments during zebrafish development (de Jong-Curtain et al., 2009; Davuluri et al., 2008). Meanwhile, cells in relatively quiescent tissues survived and remained healthy.
AHCTF1 encodes ELYS, a 252-kDa multidomain nucleoporin (NUP) that was first discovered in mice where it was shown to be required for the proliferation and survival of inner mass cells during embryonic development (Okita et al., 2004). ELYS is one of 10 components of the large NUP107–160 subunit of nuclear pore complexes (NPCs). These huge (110 MDa) multi-subunit complexes comprise approximately 34 different NUPs in octameric array (Beck and Hurt, 2017; Petrovic et al., 2022), forming cylindrical channels in the nuclear envelope that regulate nucleocytoplasmic transport and intracellular localisation of large (>40 kDa) molecules. ELYS is also indispensable for NPC reassembly after mitosis (Rasala et al., 2006; Gillespie et al., 2007; Franz et al., 2007) and carries out a broad range of activities during the cell cycle, including chromatin decompaction, mitotic spindle assembly, and chromosome segregation (Gillespie et al., 2007; Kuhn et al., 2019; Güttinger et al., 2009; Chatel and Fahrenkrog, 2011; Mishra et al., 2010; Yokoyama et al., 2014; Kobayashi et al., 2019; Rasala et al., 2008).
Having shown previously that cells that are rapidly growing and dividing during zebrafish development are highly vulnerable to ELYS depletion, we hypothesised that cancer cells fuelled by powerful oncogenes would be vulnerable too. To test this, we took advantage of a genetically tractable zebrafish model of hepatocellular carcinoma (HCC) in which a doxycycline-inducible, hepatocyte-specific EGFP-krasG12V transgene drives hepatocyte hyperplasia, liver enlargement, and morphological changes characteristic of human HCC (Chew et al., 2014). We chose this model of HCC because the RAS/RAF/MAPK signalling pathway is almost always hyperactivated in human HCC (Calvisi et al., 2006).
We found that reducing the expression of ahctf1 mRNA by 50% disrupted multiple functions in krasG12V-expressing hepatocytes and markedly impaired their growth and survival. Further studies showed that accumulation of DNA damage and robust Tp53 activation contributed to this response. These findings suggest that ahctf1 and mutant kras participate in a synthetic lethal interaction that is selective for Kras oncogene-expressing cells, providing a rationale to investigate whether ELYS function could be targeted effectively and selectively by a new class of anti-cancer drugs.
Results
Molecular characterisation of mutant kras-driven zebrafish models of HCC
To generate both larval and adult models of HCC (Chew et al., 2014), we varied the timing of doxycycline (dox) treatment. In our larval model, on a wildtype (WT) ahctf1 background, we induced the expression of a single EGFP-krasG12V transgene, denoted TO(krasG12V)T/+ in developing livers by treating with dox between 2 and 7 days post-fertilisation (dpf) (Figure 1a, b). This led to the accumulation of a constitutively active, EGFP-tagged, potently oncogenic form of Kras (KrasG12V) specifically in hepatocytes, causing hepatocyte hyperplasia and a substantial increase (4-fold) in liver volume (Figure 1c, d). To establish the clinical relevance of this phenotype to human HCC, we used RNA sequencing to analyse the gene expression patterns of livers expressing the krasG12V transgene compared to livers expressing no transgene. We detected more than 6000 significantly upregulated genes in dox-treated TO(krasG12V)T/+ livers compared WT livers, and a further 6000+ genes were significantly downregulated (Figure 1—figure supplement 1a, b). Gene set enrichment analysis identified a positive correlation between the differential gene expression data from the dox-treated TO(krasG12V)T/+ versus WT livers and the differential gene expression data obtained from the HCC (LIHC) and healthy liver subsets available in The Cancer Genome Atlas (TCGA) (Figure 1—figure supplement 1c). We also found a positive correlation between the diffentially expressed genes (DEGs) from the dox-treated TO(krasG12V)T/+ versus WT livers and a small HCC expression signature based on four patient samples carrying KRAS G12 or KRAS G13 mutations (Figure 1—figure supplement 1d). Of the upregulated genes, many were significantly enriched in KEGG pathways associated with highly proliferative cancers, including DNA replication, cell cycle regulation, and DNA damage repair (Figure 1—figure supplement 1e). These observations build on previous reports that dox-treated TO(krasG12V)T/+ zebrafish provide an authentic model of human HCC (Zheng et al., 2014b; Huo et al., 2019).
Figure 1 with 3 supplements see all
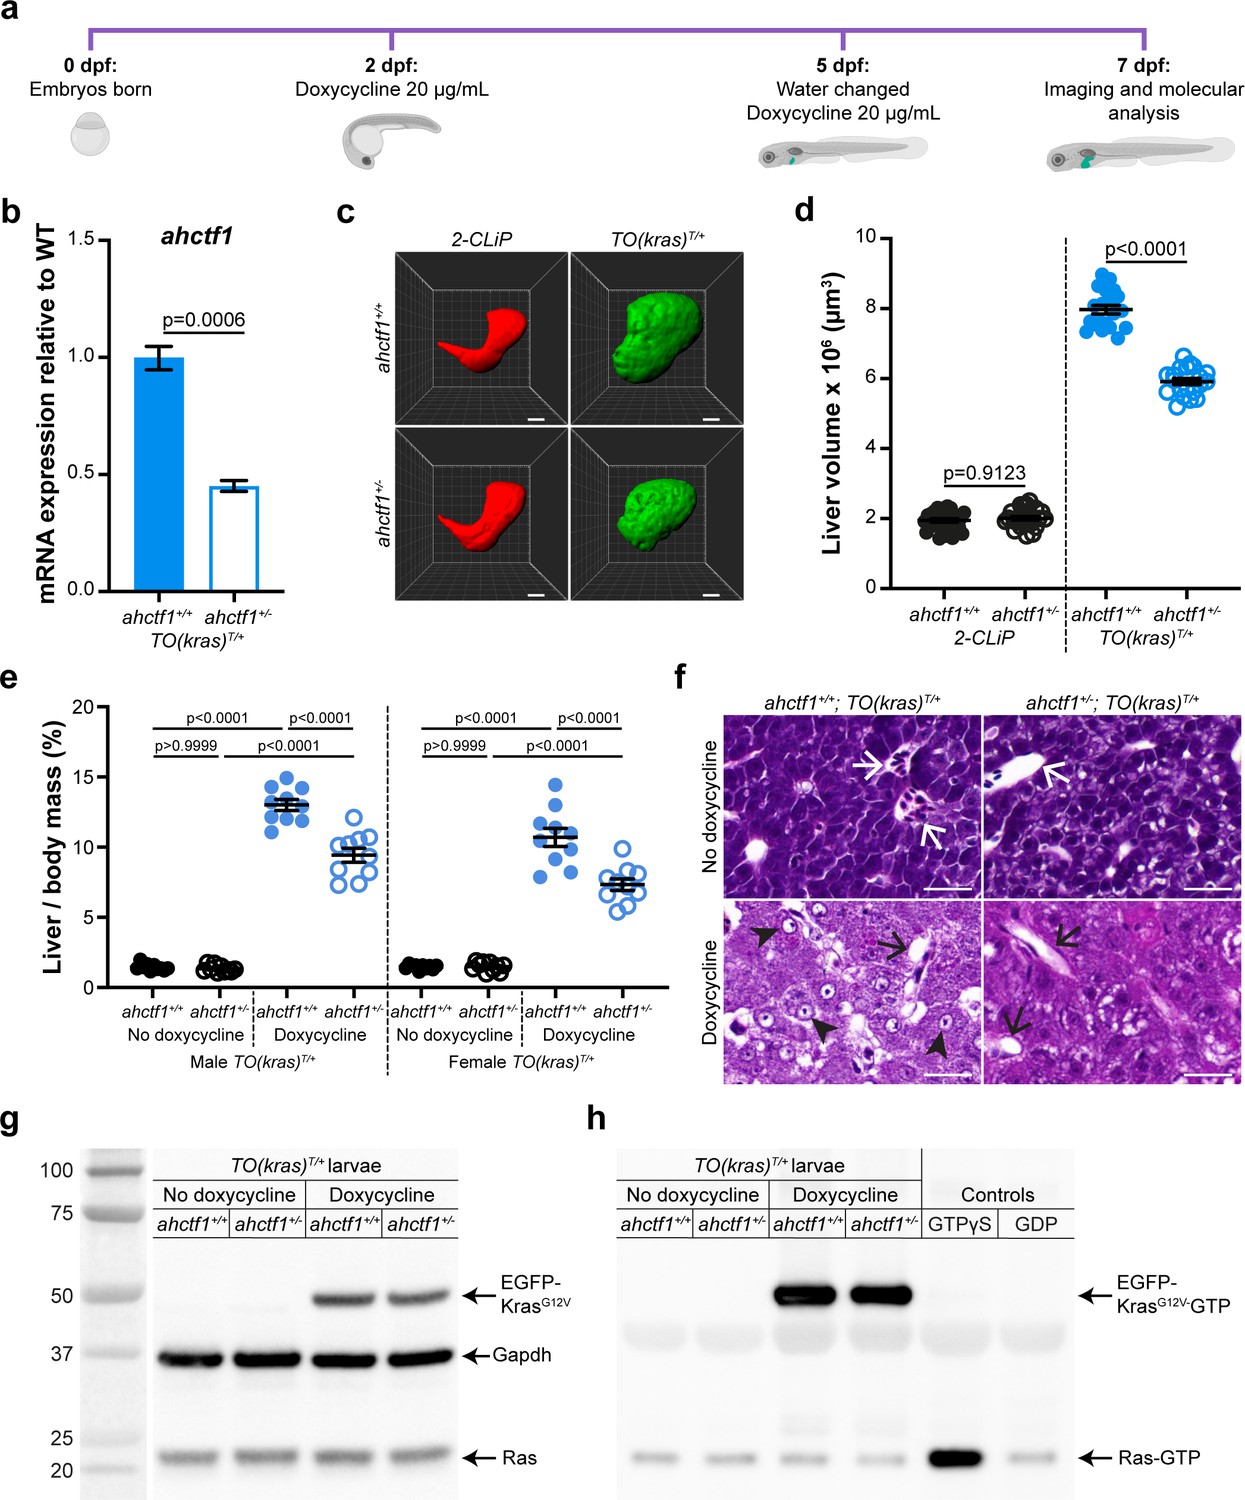
ahctf1 heterozygosity restricts liver volume in a zebrafish model of krasG12V-driven hepatocellular carcinoma (HCC).
(a) Protocol used to induce TO(krasG12V)T/+ expression in the livers of developing zebrafish larvae. (b) RT-quantitative PCR (RT-qPCR) analysis of ahctf1 mRNA levels in pooled micro-dissected larval livers (n = 3 biological replicates). (c) Representative three-dimensional reconstructions of 2-CLiP and dox-treated TO(krasG12V)T/+ larval livers of the indicated ahctf1 genotype. Scale bar 25 µm. (d) Impact of ahctf1 heterozygosity on liver volume in 2-CLiP and TO(krasG12V)T/+ larvae (n ≥ 20). (e) Impact of ahctf1 heterozygosity on liver-to-body mass ratio of adult TO(krasG12V)T/+ zebrafish in the presence or absence of dox treatment (n = 10). (f) Histological sections of adult male TO(krasG12V)T/+ zebrafish livers of the indicated ahctf1 genotype and dox treatment, stained with haematoxylin and eosin. In vehicle-treated adults, hepatocytes are densely packed and well differentiated. White arrows point to sections through blood vessels containing red blood cells. Meanwhile, the hepatocytes in dox-treated animals are poorly differentiated and exhibit multiple cytological abnormalities, including pyknotic nuclei (arrowheads) and vacuolation (black arrows). Scale bar 25 µm. (g) Western blot of Ras and Gapdh protein signals in total input lysates (50 μg) of TO(krasG12V)T/+ larvae of the indicated ahctf1 genotype and dox treatment. (h) Western blot of active Ras-GTP protein signals in lysates following active Ras pull-down.
-
Figure 1—source data 1
Figure 1b: Heterozygous ahctf1 mRNA expression in the livers of doxycycline (dox)-treated TO(krasG12V)T/+ zebrafish larvae, relative to wildtype (WT).
- https://cdn.elifesciences.org/articles/73407/elife-73407-fig1-data1-v2.xlsx
-
Figure 1—source data 2
Figure 1g: Uncropped unlabelled western blot.
- https://cdn.elifesciences.org/articles/73407/elife-73407-fig1-data2-v2.zip
-
Figure 1—source data 3
Figure 1g: Uncropped western blot (labelled).
- https://cdn.elifesciences.org/articles/73407/elife-73407-fig1-data3-v2.zip
-
Figure 1—source data 4
Figure 1h: Uncropped unlabelled western blot.
- https://cdn.elifesciences.org/articles/73407/elife-73407-fig1-data4-v2.zip
-
Figure 1—source data 5
Figure 1h: Uncropped western blot (labelled).
- https://cdn.elifesciences.org/articles/73407/elife-73407-fig1-data5-v2.zip
ahctf1 heterozygosity reduces liver overgrowth in a zebrafish model of krasG12V-driven HCC
We investigated the requirement for Elys in this in vivo cancer setting by introducing a mutant ahctf1 allele (floti262) (Chen et al., 1996) into the genome of the TO(krasG12V)T/+ model. This produced a 57% reduction in ahctf1 mRNA expression in ahctf1+/− larvae at 7 dpf, compared to larvae expressing WT ahctf1 (Figure 1b). This is consistent with the nonsense mutation in ahctf1ti262 triggering nonsense mediated decay of mRNA transcribed from the affected allele, rather than it being translated and expressed as a truncated Elys protein. As a control for our experiments, we used another transgenic line, denoted 2-CLiP (2-Colour Liver Pancreas), in which hepatocytes express dsRed fluorescence constitutively but no oncogenic transgene (Korzh et al., 2008). On this background, heterozygous (HET) ahctf1ti262 zebrafish develop normally (Figure 1—figure supplement 2a), reach sexual maturity, and exhibit a normal lifespan, as do HET ahctf1 mice (Okita et al., 2004). Similarly, hepatocytes on the TO(krasG12V)T/+ background receiving no dox treatment developed normally (Figure 1—figure supplement 2b). Mean liver volume in control 2-CLiP larvae at 7 dpf was 1.95 × 10⁶ ± 4.99 × 104 μm3 and was unaffected by ahctf1 genotype (Figure 1—figure supplement 3a, b).
Dox-induced expression of oncogenic KrasG12V in the TO(krasG12V)T/+ model, produced a striking (4-fold) increase in liver volume (7.97 × 10⁶ ± 1.21 × 105 μm3) over the 5 days of dox treatment (Figure 1c, d). Remarkably, liver volume was pared back to 5.92 × 10⁶ ± 8.83 × 104 µm3 in ahctf1 HETS, equating to a 35% reduction in excess liver volume. ahctf1 heterozygosity also reduced liver enlargement in krasG12V-expressing adult zebrafish. To induce HCC in these experiments, sexually mature zebrafish aged 3 months post-fertilisation were treated with dox (final concentration 20 mg/L) for 7 days with fresh water and dox administered daily. After 7 days, the impact of forced krasG12V expression was assessed in both male and female adults by measuring the mass of the liver and expressing this as a percentage of the total mass of the animal prior to liver dissection (Figure 1e). Compared to vehicle-treated animals, we found that dox induction of krasG12V expression produced a robust (9-fold) increase in liver mass expressed as a percentage of total body mass of male zebrafish expressing WT ahctf1. This ratio was reduced by 28% in ahctf1 HETS and we obtained similar results with females (Figure 1e). Histological sections of livers from vehicle-treated ahctf1+/+; TO(krasG12V)T/+ males stained with haematoxylin and eosin (H&E) revealed an orderly arrangement of polygonal hepatocytes interspersed with blood vessels containing red blood cells. In the absence of dox, this appearance was unaffected by ahctf1 genotype (Figure 1f, top row). In contrast, dox-treated ahctf1+/+; TO(krasG12V)T/+-expressing male livers exhibited severely disrupted architecture, and a general loss of hepatocyte organisation (Figure 1f, bottom left). Hepatocytes were generally poorly differentiated and some exhibited features such as pyknotic nuclei, condensed nucleoli, and vacuolation (Figure 1f, bottom left). Sections of krasG12V-expressing livers from ahctf1 HETS showed hepatocytes with improved nuclear integrity and less vacuolation (Figure 1f, bottom right). These data show that in both larval and adult TO(krasG12V)T/+-expressing zebrafish, a modest (50%) decrease in ahctf1 mRNA expression exerts a robust and selective reduction in hepatocyte hyperplasia and liver overgrowth.
Level of activated (GTP-bound) Ras in dox-treated TO(krasG12V)T/+ larvae is unaffected by ahctf1 heterozygosity
To determine how heterozygous ahctf1 mRNA expression restricts mutant kras-driven liver overgrowth, we investigated whether the Elys protein could interfere with the activation of KrasG12V directly. To do this, we first quantitated the abundance of the EGFP-KrasG12V protein using western blot analysis. Dox treatment markedly increased the abundance of the EGFP-KrasG12V protein in lysates of TO(krasG12V)T/+ zebrafish larvae compared to vehicle-treated larvae (Figure 1g), and this was unaffected by ahctf1 genotype. We then used an active (GTP-bound) Ras pull-down assay to isolate the active GTP-bound fraction of Ras proteins in lysates of TO(krasG12V)T/+ larvae, followed by western blot analysis (Baker and Rubio, 2021). In vehicle-treated zebrafish larvae, signals corresponding to GTP-bound endogenous Ras proteins were weak, whereas lysates from dox-treated larvae gave robust signals corresponding to activated EGFP-KrasG12V proteins. The intensity of these signals was not affected by ahctf1 genotype (Figure 1h). Thus, the impact of heterozygous ahctf1 mutation on the growth, proliferation, and survival of TO(krasG12V)T/+ expressing hepatocytes did not occur by directly or indirectly interfering with the production of GTP-bound Ras proteins.
ahctf1 heterozygosity disrupts the abundance of NPCs in dox-treated TO(krasG12V)T/+ hepatocytes
Having demonstrated that ahctf1 heterozygosity restricts krasG12V-driven liver enlargement, we sought to understand the biological mechanisms underlying this. As previously mentioned, Elys is a multifunctional protein with several roles in the cell cycle (Figure 2—figure supplement 1). We started by examining whether its canonical role in post-mitotic nuclear pore assembly (Figure 2—figure supplement 1a, b) was disrupted. To measure the abundance and distribution of NPCs, we stained thick sections of larval livers (200 μm), with an antibody (mAb414) that recognises FG-repeat NUPs (NUP358, 214, 153, and 62) in mature NPCs. Using Airyscan confocal laser-scanning microscopy, we showed that hepatocytes not carrying the TO(krasG12V) transgene (denoted TO(kras)+/+), exhibit fluorescent puncta corresponding to NPCs at the nuclear rim with negligible staining in the cytoplasm, a pattern that was unaffected by ahctf1 genotype (Figure 2a; left two columns). In dox-treated larvae harbouring the TO(krasG12V)T/+ transgene, fluorescence intensity was markedly increased (Figure 2a, third column) and there was an increase in the ratio of nuclear:cytoplasmic staining (Figure 2b). By comparison, fluorescence intensity at the nuclear rim was diminished in ahctf1 HETS, concomitant with the appearance of fluorescent puncta in the cytoplasm (Figure 2a, fourth column; arrows) and a significant reduction in the ratio of nuclear:cytoplasmic fluorescence intensity (Figure 2b).
Figure 2 with 1 supplement see all
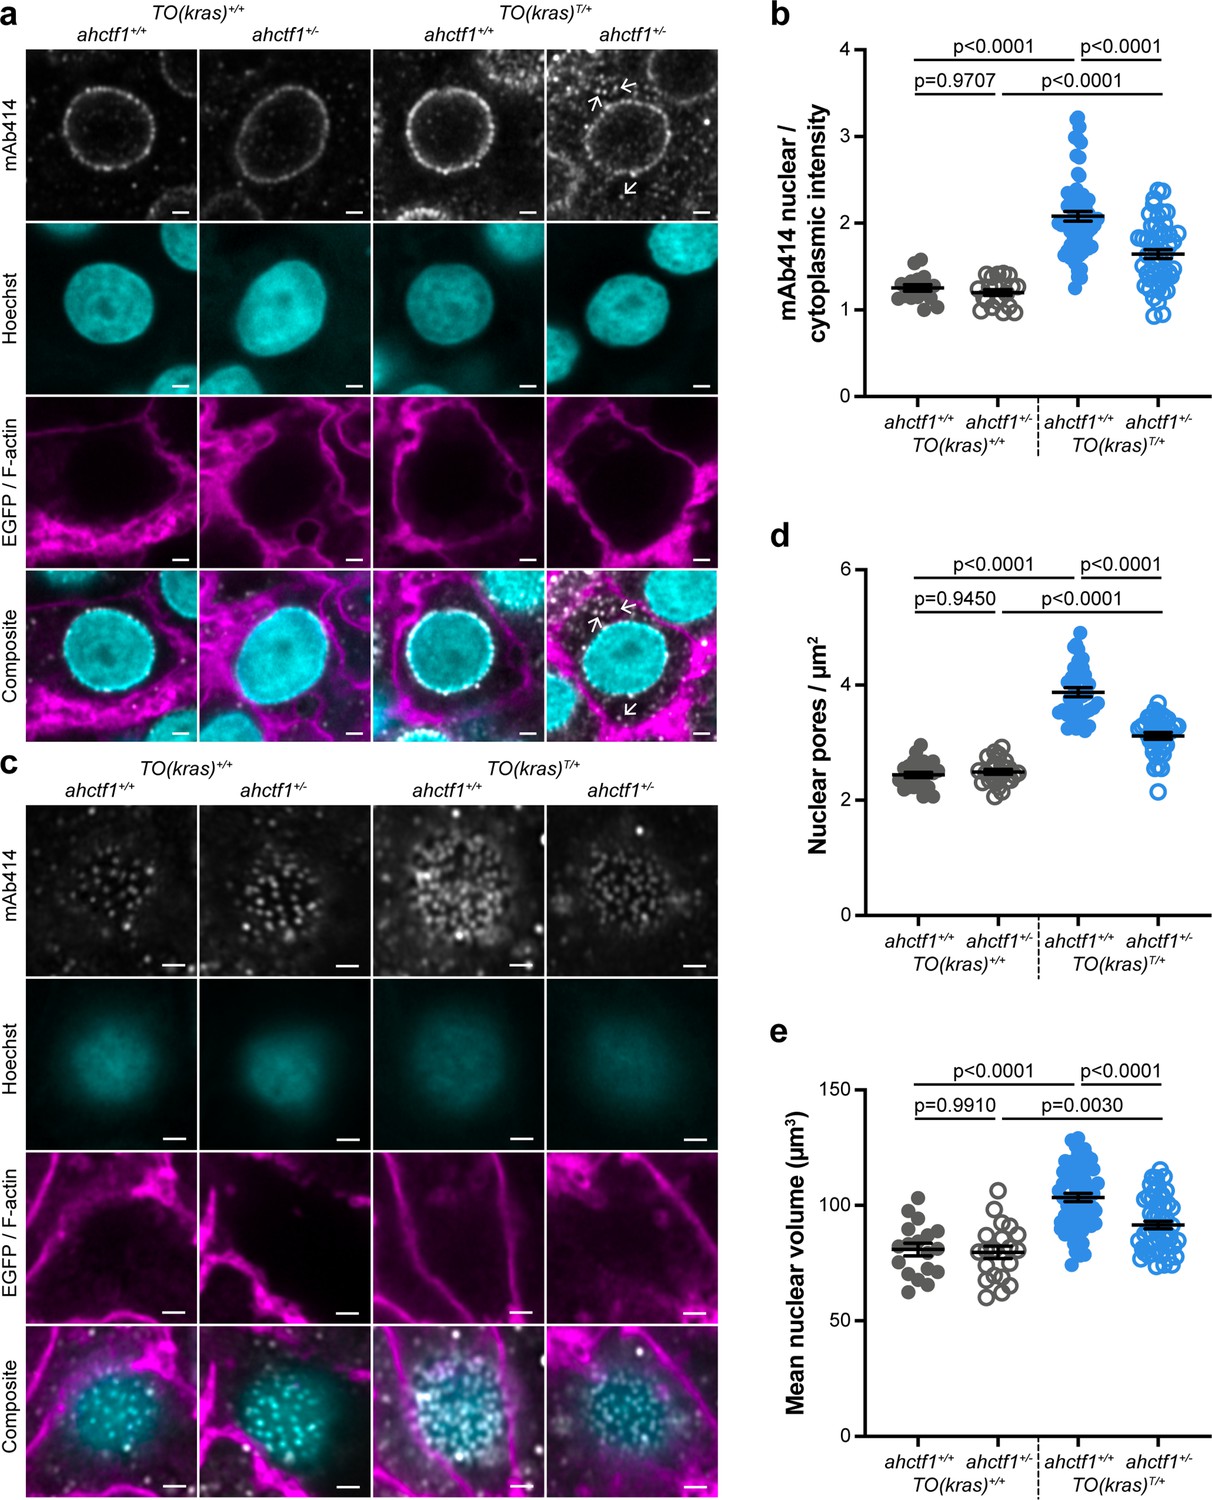
ahctf1 heterozygosity disrupts the density of nuclear pore complexes and reduces nuclear volume in dox-treated TO(krasG12V)T/+ hepatocytes.
(a) Representative Airyscan imaging of liver sections stained with mAb414 (white) marking FG-NUPs, Hoechst 33342 (cyan) marking DNA, and rhodamine phalloidin (magenta) marking the F-actin cytoskeleton in non-TO(krasG12V)-expressing cells and EGFP-KrasG12V (magenta) marking the cell membrane in dox-treated TO(krasG12V)-expressing cells of the indicated ahctf1 and TO(krasG12V) genotypes. Arrows in right-hand panel point to mAb414/FG-nucleoporin staining in the cytoplasm. Scale bar 2 µm. (b) Quantification of mean nuclear/cytoplasmic fluorescence intensity of mAb414 staining after 3D segmentation and morphological filtering of nuclear and cytoplasmic areas (n > 18). (c) Representative Airyscan images of mAb414 staining at the nuclear surface of sections of the indicated ahctf1 and TO(krasG12V) genotype. Scale bar 1 µm. (d) Quantification of nuclear pore density (n ≥ 25). (e) Quantification of nuclear volume (n ≥ 25). Data are expressed as mean ± standard error of the mean (SEM). Significance was assessed using a one-way analysis of variation (ANOVA) with Tukey’s multiple comparisons test.
-
Figure 2—source data 1
Figure 2b: Ratio of nuclear to cytoplasmic intensity of mAb414 immunostaining in livers of dox-treated TO(krasG12V)T/+ zebrafish larvae; role of ahctf1 genotype.
- https://cdn.elifesciences.org/articles/73407/elife-73407-fig2-data1-v2.xlsx
To determine the abundance of NPCs, we analysed the pattern and density of fluorescent puncta observed at the nuclear surface of non-krasG12V expressing hepatocytes (Figure 2c; left two columns). The induced expression of the krasG12V transgene in the presence of WT ahctf1 resulted in 59% more fluorescent puncta/NPCs at the nuclear surface of hyperplastic hepatocytes (Figure 2c, d; third column). These signals were reduced by 21% in ahctf1 HETS (Figure 2c, d; fourth column). Induced krasG12V expression also produced a 28% increase in nuclear volume compared to non-krasG12V-expressing cells (Figure 2e), and this increase in size was reduced to 13% in ahctf1 HETS. We infer from these data that hyperplastic hepatocytes expressing the krasG12V oncogene require highly efficient rates of nucleocytoplasmic transport to support their rapid proliferation, which they fulfil by increasing NPC density and the size of their nuclei. This adaptation required a full complement of ahctf1 expression, suggesting non-oncogene addiction to ahctf1. We found that in hyperplastic hepatocytes that were heterozygous for ahctf1 this adaptation was partially restricted, creating a condition likely to amplify oncogenic stress.
ahctf1 heterozygosity impairs mitotic spindle assembly and chromosome segregation in dox-treated TO(krasG12V)T/+ hepatocytes
Next, we examined the impact of reduced Elys expression on spindle formation and chromosome segregation during mitosis (Figure 2—figure supplement 1g and h). We assessed these features in cryosections of liver using α-tubulin and 4′,6-diamidino-2-phenylindole (DAPI) to stain microtubules and chromatin, respectively. Metaphase cells in ahctf1+/+;TO(krasG12V)T/+ livers exhibited normal bipolar spindle formation followed by complete chromosome segregation during anaphase (Figure 3a). In contrast, metaphase cells in ahctf1+/−;TO(krasG12V)T/+ hepatocytes displayed abnormal multipolar spindles and misaligned chromosomes (Figure 3b). Proper chromosome segregation was disrupted with multiple anaphase bridges formed. While the number of cells observed at different mitotic stages was similar in ahctf1+/+ and ahctf1+/− (Figure 3c), mitotic abnormalities were observed in 50% of ahctf1+/−;TO(krasG12V)T/+ hepatocytes during metaphase and anaphase but not at all in ahctf1+/+;TO(krasG12V)T/+ hepatocytes (Figure 3d). These data are consistent with hyperplastic hepatocytes requiring a full complement of ahctf1 expression to maintain rapid rounds and integrity of mitosis, and provide another facet of non-oncogene addiction to ahctf1 that is likely to contribute to oncogenic stress.
Figure 3
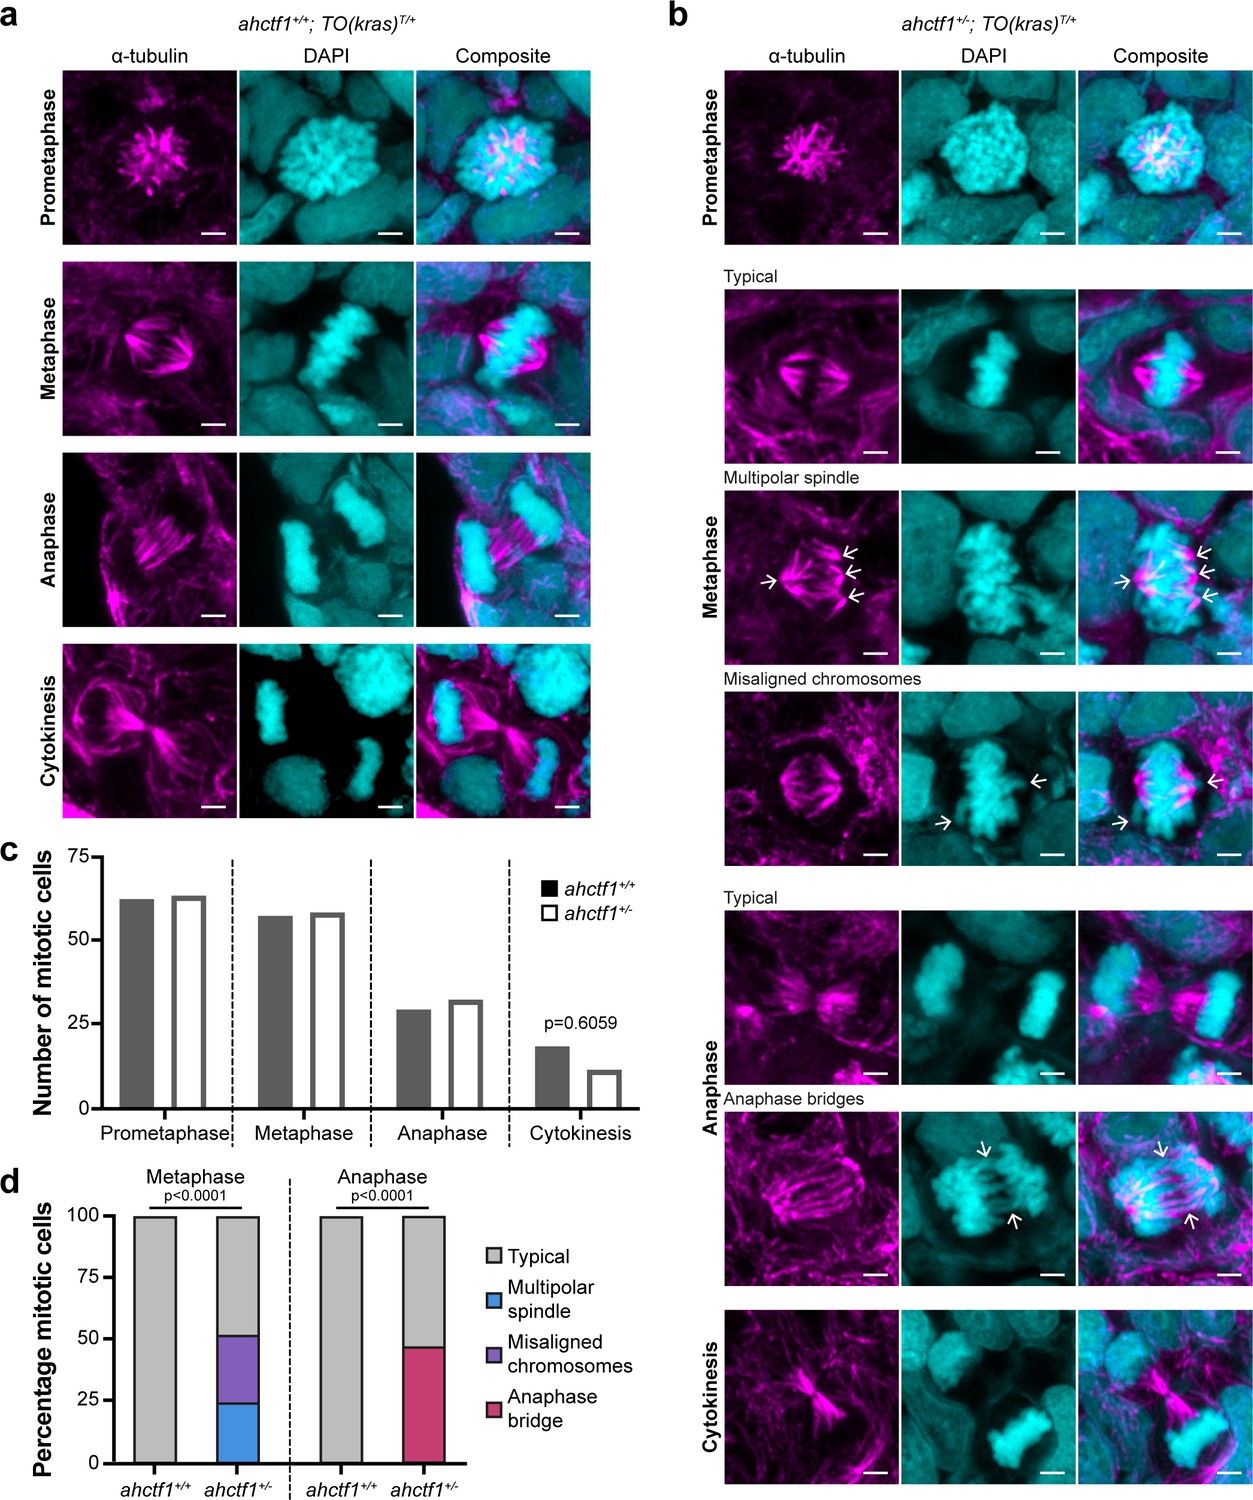
ahctf1 heterozygosity impairs mitotic spindle assembly and chromosome segregation in dox-treated TO(krasG12V)T/+ hepatocytes.
(a) Representative Airyscan imaging of liver cryosections stained with α-tubulin antibody (magenta) marking spindle microtubules and DAPI (cyan) marking DNA in mitotic cells of TO(krasG12V)T/+ larvae on a wildtype ahctf1+/+ background. (b) Mitotic cells in liver cryosections of TO(krasG12V)T/+ larvae that are heterozygous for ahctf1+/− exhibit multiple defects, including multipolar spindles, misaligned chromosomes, and anaphase bridges (arrows). Scale bar 2 µm. (c) Distribution of cells observed at different mitotic stages (n = 92 livers, 326 mitotic cells). (d) Quantification of the percentage of mitotic hepatocytes exhibiting an aberrant phenotype (n = 14–57). Significance was assessed using a Chi-square test.
-
Figure 3—source data 1
Figure 3c: Number of cells at different stages of mitosis in livers of TO(krasG12V)T/+ zebrafish larvae; role of ahctf1 genotype.
Figure 3d: Percentage of mitotic cells expressing an aberrant phenotype in livers of TO(krasG12V)T/+ zebrafish larvae; role of ahctf1 genotype.
- https://cdn.elifesciences.org/articles/73407/elife-73407-fig3-data1-v2.xlsx
ahctf1 heterozygosity causes DNA damage and accumulation of Tp53 protein in dox-treated TO(krasG12V)T/+ hepatocytes
Other features of oncogene-induced stress in response to robust and persistent overexpression of RAS oncoproteins include stalled DNA replication, DNA damage, and genome instability. To determine whether expression of krasG12V causes DNA damage in our model, we stained cryosections of larval livers with DAPI and γ-H2AX, which is a sensitive marker for stalled DNA replication forks and DNA double-strand breaks (Rogakou et al., 1998). We found that 1% of ahctf1+/+;TO(krasG12V)T/+ hepatocyte nuclei were positive for γ-H2AX (Figure 4a, c), compared to 6% in the nuclei of ahctf1 HETS (Figure 4b, c).
Figure 4
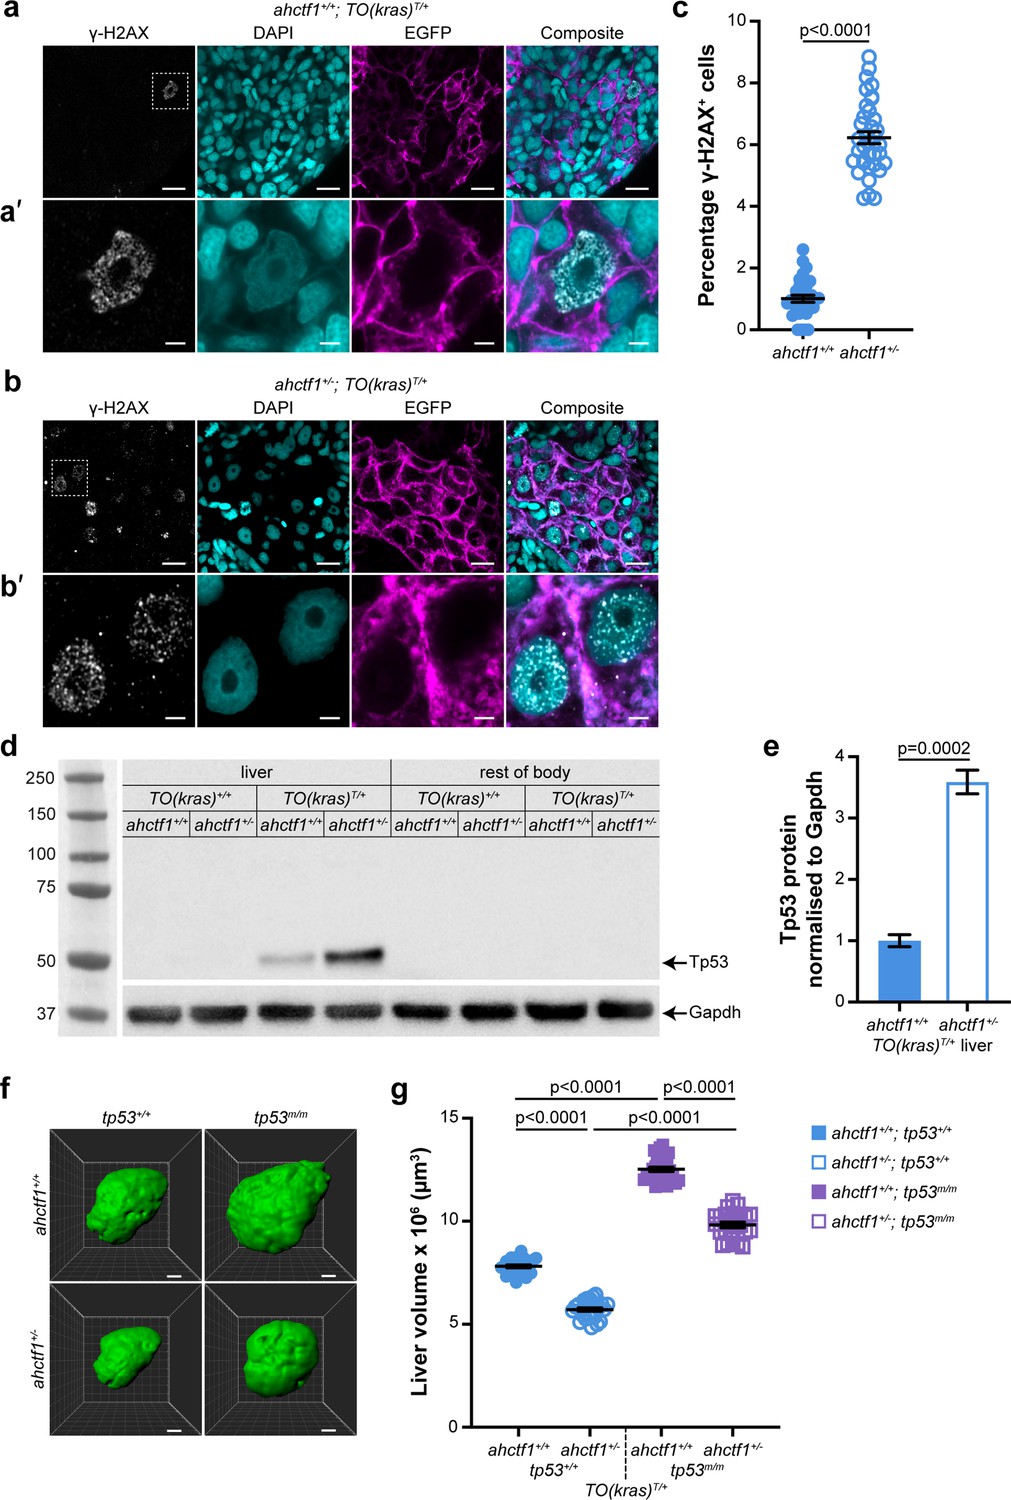
ahctf1 heterozygosity causes DNA damage and accumulation of Tp53 protein in dox-treated TO(krasG12V)T/+ hepatocytes.
(a) Representative Airyscan imaging of cryosections of liver from dox-treated ahctf1+/+;TO(krasG12V)T/+ larvae stained with γ-H2AX antibody (white) marking DNA double-strand breaks, DAPI (cyan) marking DNA and EGFP-KrasG12V (magenta) marking the cell membrane. Scale bar 5 µm. (a’) Inset of γ-H2AX-positive nuclei in ahctf1+/+;TO(krasG12V)T/+ hepatocytes. Scale bar 2 µm. (b) Representative images of cryosections of liver from dox-treated ahctf1+/−;TO(krasG12V)T/+ larvae. Scale bar 5 µm. (b’) Inset of γ-H2AX-positive nuclei in cryosections of liver from ahctf1+/−;TO(krasG12V)T/+ larvae. Scale bar 2 µm. (c) Quantification of the percentage of hepatocytes positive for γ-H2AX (n ≥ 31). (d) Representative western blot of Tp53 protein signals in lysates of TO(krasG12V) larvae of the indicated ahctf1 genotype. (e) Quantification of Tp53 protein levels normalised by reference to the Gapdh loading control (n = 3 independent experiments). (f) Representative three-dimensional reconstructions of dox-treated TO(krasG12V)T/+ livers of the indicated ahctf1 and tp53 genotypes. Scale bar 25 µm. (g) Impact of ahctf1 heterozygosity and homozygous tp53 mutation on liver volume in 2-CLiP and TO(krasG12V)T/+ larvae (n ≥ 20). Data are expressed as mean ± standard error of the mean (SEM). Significance was calculated using a Student’s t-test or one-way analysis of variation (ANOVA) with Tukey’s multiple comparisons test.
-
Figure 4—source data 1
Figure 4c: Percentage of hepatocytes positive for γ-H2AX immunostaining in livers of dox-treated TO(krasG12V)T/+ zebrafish larvae; role of ahctf1 genotype.
- https://cdn.elifesciences.org/articles/73407/elife-73407-fig4-data1-v2.xlsx
-
Figure 4—source data 2
Figure 4d: Uncropped unlabelled western blot.
- https://cdn.elifesciences.org/articles/73407/elife-73407-fig4-data2-v2.zip
-
Figure 4—source data 3
Figure 4d: Uncropped western blot (labelled).
- https://cdn.elifesciences.org/articles/73407/elife-73407-fig4-data3-v2.zip
In the presence of WT Tp53, DNA damage is limited by activation of Tp53 transcription-dependent pathways that can perform DNA damage repair, and, if necessary, induce cell cycle arrest, senescence, and/or apoptosis. To determine whether the increase in DNA damage that occurred in our model in response to ahctf1 heterozygosity stimulated Tp53 accumulation, we measured the levels of Tp53 protein in pooled lysates of micro-dissected krasG12V-expressing livers, krasG12V-nonexpressing livers and the larval remains after the dissection (Figure 4d, e). No Tp53 signal was obtained from non-krasG12V-expressing livers, or the body remains after liver removal. However, we detected a weak Tp53 signal in extracts of dox-treated ahctf1+/+;TO(krasG12V)T/+ livers, consistent with induced krasG12V expression causing mild cellular stress. This low level of stress was amplified significantly in heterozygous ahctf1 livers, where we obtained a strong (>3.5-fold) increase in the intensity of the Tp53 signal (Figure 4e), which correlated well with the higher density of γ-H2AX staining.
To test whether Tp53 accumulation was responsible for limiting liver volume in TO(krasG12V)T/+ larvae, we introduced the zebrafish tp53M214K allele encoding a transactivation dead Tp53 variant (Berghmans et al., 2005). Abrogating Tp53 function by homozygous expression of this allele (denoted tp53m/m) in ahctf1+/+;TO(krasG12V)T/+ larvae increased liver volume by 50%, to 12.5 × 10⁶ ± 1.10 × 105 μm3, compared to livers on a WT (tp53+/+) background (Figure 4f, g), demonstrating that Tp53 function normally places great restraint on the growth of TO(krasG12V)T/+ livers in this model. ahctf1 heterozygosity combined with loss of Tp53 function also produced an increase in liver volume by 50% compared to ahctf1+/−;TO(krasG12V)T/+ livers on a WT Tp53 background. Comparing the volume of ahctf1 HET livers and WT ahctf1 livers on a Tp53 mutant background, showed that heterozygous ahctf1 still achieved a reduction in liver volume, albeit significantly less than in the presence of WT Tp53.
ahctf1 heterozygosity amplifies cell death of dox-treated TO(krasG12V)T/+ hepatocytes in the presence and absence of WT Tp53
The tumour suppressive properties of Tp53 lie in its capacity to activate the transcription of genes that participate in processes that restrict tumour growth, including cell cycle arrest, senescence, apoptosis, DNA repair, and metabolic adaptation. To test whether disruption of these processes contributed to the reduction in liver volume we observe between WT and heterozygous ahctf1 larvae, we first looked at apoptosis. To do this, we introduced an apoptosis reporter transgene, Tg(actb2:SEC-Hsa.ANXA5-mKate2,cryaa:mCherry)uq24rp (hereafter denoted Annexin 5-mKate) into the HCC model. This transgene constitutively expresses a fusion protein comprising Annexin 5 and the far-red fluorophore mKate (Hall et al., 2019). The protein generates discrete fluorescent puncta in cells undergoing apoptosis by binding to phosphatidylserine molecules that become accessible to Annexin 5 binding when the plasma membrane breaks down during apoptosis. The abundance of Annexin 5 fluorescent puncta was 1.5 puncta per 10−5 μm3 in the livers of WT Tp53, ahctf1+/+;TO(krasG12V)T/+ larvae and this value increased by 3.5-fold (5.2 puncta per 10−5 μm3) on a heterozygous ahctf1 background (Figure 5a, left two columns, Figure 5b). We saw a comparable increase in the number of apoptotic cells in heterozygous ahctf1 livers when we used the cleaved (active) form of caspase-3 as an alternative marker of apoptosis (Figure 5—figure supplement 1).
Figure 5 with 2 supplements see all

ahctf1 heterozygosity amplifies cell death in dox-treated TO(krasG12V)T/+ hepatocytes in the presence and absence of Tp53.
(a) Representative maximum intensity projection images of Annexin 5-mKate fluorescence (white puncta), indicating cells undergoing apoptosis in TO(krasG12V)T/+ livers of the indicated ahctf1 and tp53 genotypes. Scale bar 25 µm. (b) Quantification of the density of Annexin 5 fluorescent foci in TO(krasG12V)T/+ livers of the indicated ahctf1 and tp53 genotypes (n ≥ 11). (c) RT-quantitative PCR (RT-qPCR) analysis of the specified mRNAs in TO(krasG12V)T/+ micro-dissected livers of the indicated ahctf1 and tp53 genotypes (n = 3 biological replicates). Data are expressed as mean ± standard error of the mean (SEM). Significance was calculated using a one-way analysis of variation (ANOVA) with Tukey’s multiple comparisons test.
-
Figure 5—source data 1
Figure 5b: Quantitation of Annexin 5-mKate fluorescence per volume (µm3) in livers of dox-treated TO(krasG12V)T/+ zebrafish larvae; role of ahctf1 and tp53 mutation.
Figure 5c: Multiple mRNA expression analyses by RT-quantitative PCR (RT-qPCR) of micro-dissected livers from dox-treated TO(krasG12V)T/+ zebrafish larvae; role of ahctf1 and tp53 mutation.
- https://cdn.elifesciences.org/articles/73407/elife-73407-fig5-data1-v2.xlsx
To determine whether Tp53 accumulation played a role in this cell death, we measured the density of Annexin 5 puncta in the absence of functional Tp53. Compared to those expressing WT Tp53 (1.5 puncta per 10−5 μm3), Annexin 5 puncta were relatively sparse (0.13 puncta per 10−5 μm3) in Tp53-deficient livers on a ahctf1+/+;TO(krasG12V)T/+ background. This robust (11.3-fold) reduction in the density of Annexin 5 foci indicates that the death of hepatocytes in ahctf1 WT, TO(krasG12V)T/+ livers is normally kept in check by Tp53 (Figure 5a, b). Turning to ahctf1 HETS, the density of Annexin 5 puncta on a tp53m/m background was 2.3 puncta per 10−5 μm3, less than half the number of puncta (5.2 per 10−5 μm3) on a WT Tp53 background (Figure 5a, b). The number of hepatocytes undergoing apoptosis on a Tp53-deficient background remained higher in heterozygous ahctf1 larvae compared to ahctf1 WT larvae, albeit it was much reduced compared to that observed in the presence of WT Tp53.
To determine whether these responses were tied to the expression of pro-apoptotic Tp53 target genes in krasG12V-driven hepatocytes, we used RT-quantitative PCR (RT-qPCR) analysis of pooled micro-dissected livers (Figure 5c). The abundance of tp53 mRNA was unaffected by ahctf1 heterozygosity (Figure 5—figure supplement 2a), which was to be expected because the accumulation of Tp53 protein is regulated post-translationally. However, we could infer that Tp53 transcription was activated by ahctf1 heterozygosity by the expression of the canonical Tp53 target genes, mdm2 and Δ113tp53, which were upregulated by 4.7-fold (Figure 6c) and >6-fold, respectively (Figure 5—figure supplement 2b), compared to when ahctf1 was WT.
Figure 6 with 1 supplement see all
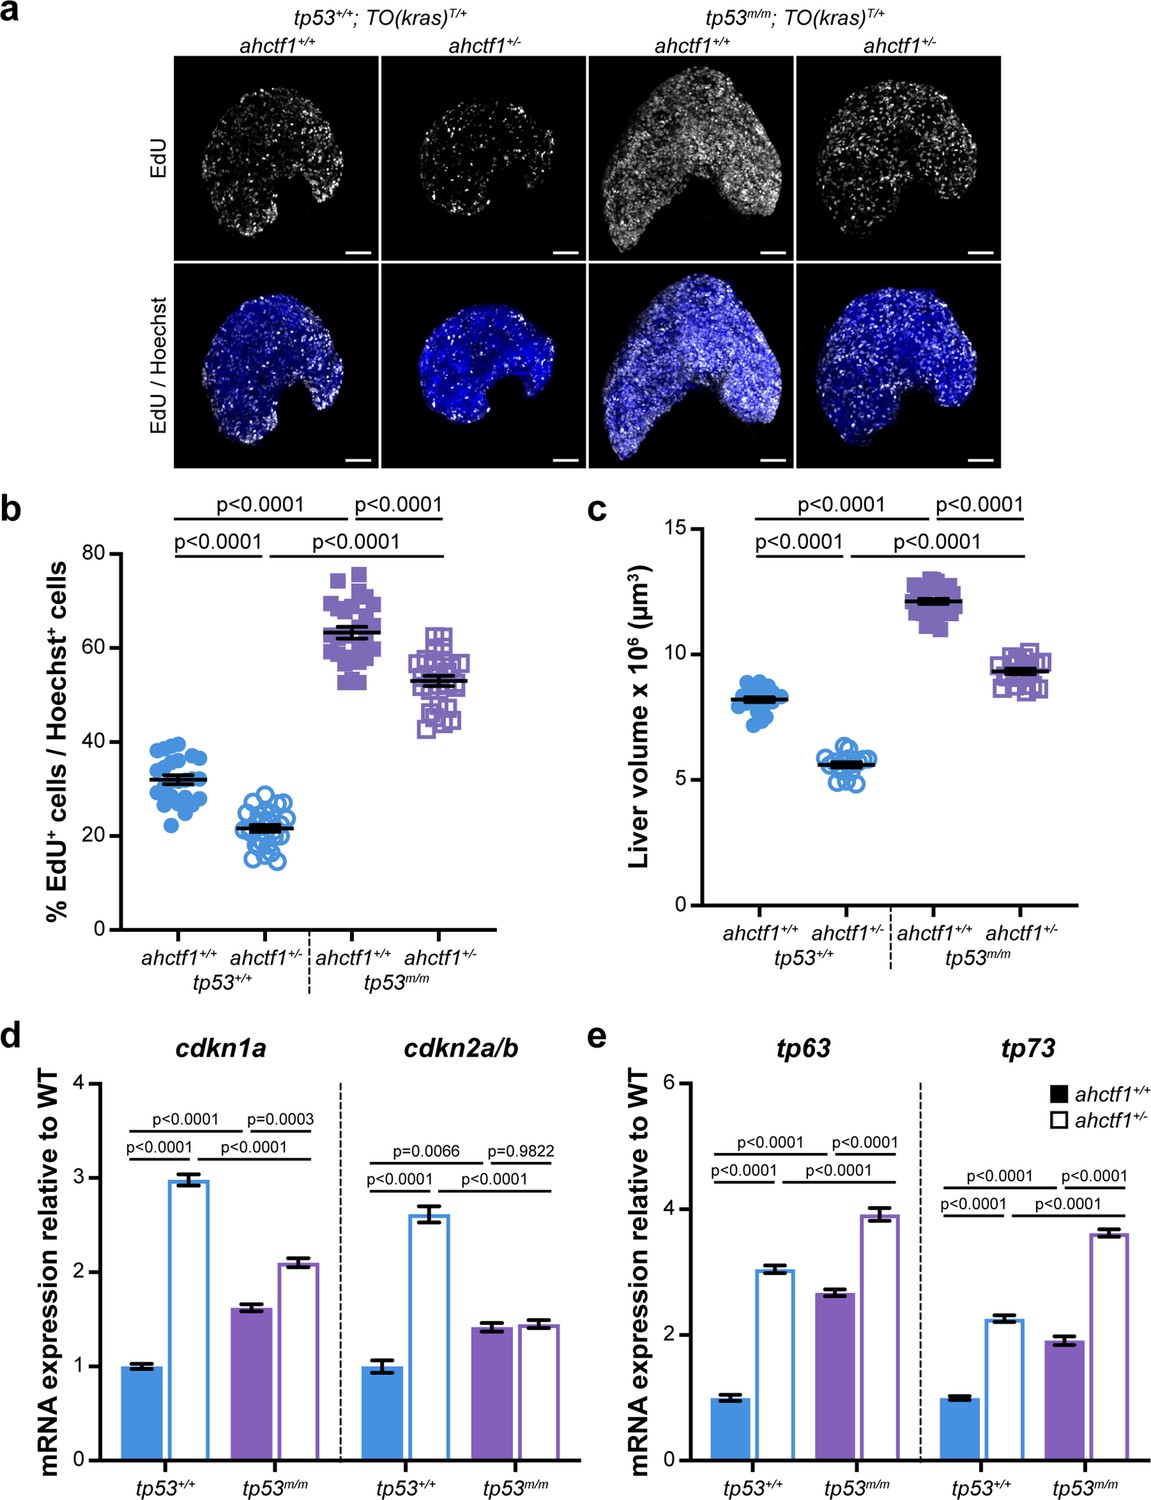
ahctf1 heterozygosity restricts DNA replication in dox-treated TO(krasG12V)T/+ hepatocytes in the presence and absence of Tp53.
(a) Representative maximum intensity projection images of EdU incorporation (white puncta) into TO(krasG12V)T/+ livers of the indicated ahctf1 and tp53 genotypes. Scale bar 25 µm. (b) Quantification of the percentage of EdU-positive nuclei per Hoechst 33342-positive nuclei (n ≥ 25). (c) Impact of ahctf1 heterozygosity and homozygous tp53 mutation on liver volume in dox-treated TO(krasG12V)T/+ larvae (n ≥ 17). (d) RT-quantitative PCR (RT-qPCR) analysis of mRNA expression of the cell cycle regulators, cdkn1a and cdkn2a/b and (e) tp63 and tp73 expression in TO(krasG12V)T/+ micro-dissected livers of the indicated ahctf1 and tp53 genotypes (n = 3 biological replicates). Data are expressed as mean ± standard error of the mean (SEM). Significance was assessed using a one-way analysis of variation (ANOVA) with Tukey’s multiple comparisons test.
-
Figure 6—source data 1
Figure 6d: cdkna1 and cdkna2a/b mRNA expression analyses by RT-quantitative PCR (RT-qPCR) of micro-dissected livers from doxycycline (dox)-treated TO(krasG12V)T/+ zebrafish larvae; role of ahctf1 and tp53 mutation.
Figure 6e: p63 and p73 mRNA expression analyses by RT-qPCR of micro-dissected livers from doxycycline (dox)-treated TO(krasG12V) T/+ zebrafish larvae; role of ahctf1 and tp53 mutation.
- https://cdn.elifesciences.org/articles/73407/elife-73407-fig6-data1-v2.xlsx
We then examined the expression levels of Bcl2 family genes that regulate mitochondrial apoptosis including mRNAs encoding the six BH3-only apoptosis effector proteins, Pmaip1 (aka Noxa) and Bbc3 (aka Puma), Bim, Bid, Bik, and Bad, and the pro-apoptotic executioner protein, Bax (Figure 5c). All were significantly increased in the livers of ahctf1 HETS compared to WT ahctf1 livers. The most marked upregulation was observed with the classical Tp53 transcriptional targets, pmaip1, bbc3, and bax (Figure 5c). In contrast, transcripts encoding the pro-survival proteins, Bcl2 and Bclxl, were significantly downregulated by ahctf1 heterozygosity (Figure 5c). In the absence of Tp53 function, ahctf1 heterozygosity produced more modest increases in the expression of the pro-apoptotic transcripts and smaller decreases in the expression of the pro-survival bcl2 and bclxl genes (Figure 5c). We surmise from these data that ahctf1 heterozygosity contributes to a reduction in liver overgrowth in TO(krasG12V)T/+ larvae by activating a largely Tp53-dependent transcriptional programme that promotes apoptosis.
ahctf1 heterozygosity restricts DNA replication in dox-treated TO(krasG12V)T/+ hepatocytes
To determine whether DNA replication and cell cycle progression were affected by ahctf1 heterozygosity (Figure 2—figure supplement 1c–e), we used an EdU incorporation assay to identify the number of DNA replicating cells in S-phase (Figure 6a). We found that 32% of hyperplastic hepatocytes were positive for EdU in ahctf1+/+;TO(krasG12V)T/+ larvae on a WT Tp53 background (Figure 6b) and this abundance was reduced to 22% of hepatocytes in ahctf1+/−;TO(krasG12V)T/+ larvae (Figure 6b). To determine whether Tp53 played a role in the reduced frequency of cells in S-phase, we repeated the experiment in Tp53-deficient larvae. This resulted in a striking increase in the number of cells in S-phase whereby 63% of hepatocytes were EdU positive in WT ahctf1 larvae, and 53% of hepatocytes were EdU positive in ahctf1 HETS (Figure 6b). These data show that ahctf1 heterozygosity reduces the number of cells in S-phase by a mechanism that largely depends on the availability of WT Tp53. The changes in EdU incorporation between hepatocytes of different ahctf1 and tp53 genotypes were accompanied by corresponding changes in liver volume (Figure 6c).
Next, we determined whether the expression of Tp53-dependent negative cell cycle regulators was involved in the reduced number of hepatocytes in S-phase we observed in ahctf1 HETS. We saw a 3-fold increase in the expression of cdkn1a and a 2.5-fold increase in the expression of cdkn2a/b in ahctf1 HET larvae compared to larvae that were WT for ahctf1 (Figure 6d). The upregulation of cdkna1 expression in ahctf1 HETS was partially reduced by Tp53 deficiency, suggesting that the regulation of cdkna2 expression was largely, but not completely, Tp53 dependent. In contrast, the upregulation of cdkna2a/b was entirely lost in ahctf1 HETS, showing that in this setting, cdkna2a/b upregulation was dependent on the availability of functional Tp53 (Figure 6d).
We also found that mRNAs encoding the Tp53 family members, Tp63 and Tp73 were upregulated by 3.0- and 2.3-fold, respectively, in ahctf1 HET livers, compared to WT ahctf1 livers, in the presence of WT Tp53 (Figure 6e). Interestingly, in the absence of WT Tp53 (Figure 6e), ahctf1 heterozygosity caused a further, albeit mild, increase in the expression of tp63 and tp73. Since tp63 and tp73 are not direct Tp53 target genes, this raises the possibility that elevated tp63 and tp73 expression may contribute modest Tp53-independent roles to the inhibition of liver overgrowth, activation of apoptosis and impaired cell cycle progression we observed in response to ahctf1 heterozygosity. This is plausible because Tp63 and Tp73 have several direct target genes in common with Tp53, including the pro-apoptotic genes, bbc3, pmaip1, bim, and bax, and the cell cycle arrest gene, cdkna1.
We also examined the transcriptional profile of pro-apoptotic and cell cycle arrest genes in our adult model of HCC. Looking specifically at the expression of direct Tp53 target genes in response to ahctf1 heterozygosity, we found that Δ113tp53, mdm2, pmaip1, bbc3, ccgn1, and cdkn1a, were all robustly upregulated in dox-treated TO(krasG12V)T/+ livers (Figure 6—figure supplement 1a–d), as was cdkn2a/b, which is not a direct Tp53 target (Figure 6—figure supplement 1e). These data suggest that Tp53 plays a central role in mediating the reduction in liver enlargement conferred by heterozygous ahctf1 expression in adult dox-treated TO(krasG12V)T/+ livers, in agreement with our findings with the larval model of HCC.
Collectively, our data demonstrate that the reduction in liver overgrowth caused by ahctf1 heterozygosity in dox-treated TO(krasG12V)T/+ zebrafish is concurrent with the induction of largely Tp53-dependent transcriptional programmes that promote cell cycle arrest and apoptosis. However, we cannot infer from our data whether these two cellular responses are activated simultaneously in individual hepatocytes, or whether they are regulated in a dynamic fashion.
Combinatorial targeting of ahctf1 and ranbp2 expression blocks liver overgrowth in dox-treated TO(krasG12V)T/+ larvae
To extend our understanding of the role of NUPs in hyperplastic growth, we took advantage of a zebrafish mutant we had previously identified in a transgene assisted ENU-mutagenesis screen (Ober et al., 2006), which harboured a nonsense mutation in ranbp2 (Figure 7—figure supplement 1a, b). Like several other digestive organ mutants identified in this screen (de Jong-Curtain et al., 2009; Boglev et al., 2013; Markmiller et al., 2014), ranbp2s452 mutants exhibit morphological defects in proliferative compartments, including the intestinal epithelium, craniofacial complex, and eye (Figure 7—figure supplement 1c, d). RANBP2 (also known as NUP358) is a major component of the cytoplasmic filaments of NPCs, where it plays a role in nucleocytoplasmic trafficking. Like ELYS, RANBP2 also plays non-canonical roles beyond the NPC, including in mitotic progression and the maintenance of genome integrity (Joseph et al., 2004; Salina et al., 2003; Hashizume et al., 2013).
Like ahctf1 heterozygosity, we found that ranbp2 heterozygosity alone, or in combination with ahctf1 heterozygosity, had no impact on liver volume in control (2-CLiP) larvae (Figure 7a, b). In TO(krasG12V)T/+ larvae that were WT for both ranbp2 and ahctf1, dox treatment caused a >3.8-fold increase in liver volume. Upon introduction of a single mutation of either ahctf1 or ranbp2 into this setting, the excess liver volume was pared back by 38% and 13%, respectively (Figure 7b). Remarkably, when we measured liver volume in TO(krasG12V)T/+ larvae that were trans heterozygous for ranbp2 and ahctf1, we found a striking, synergistic decrease in liver volume, which by 7 dpf, was not significantly different from that of 2-CLiP livers, albeit the correct shape of the liver was not completely restored.
Figure 7 with 5 supplements see all
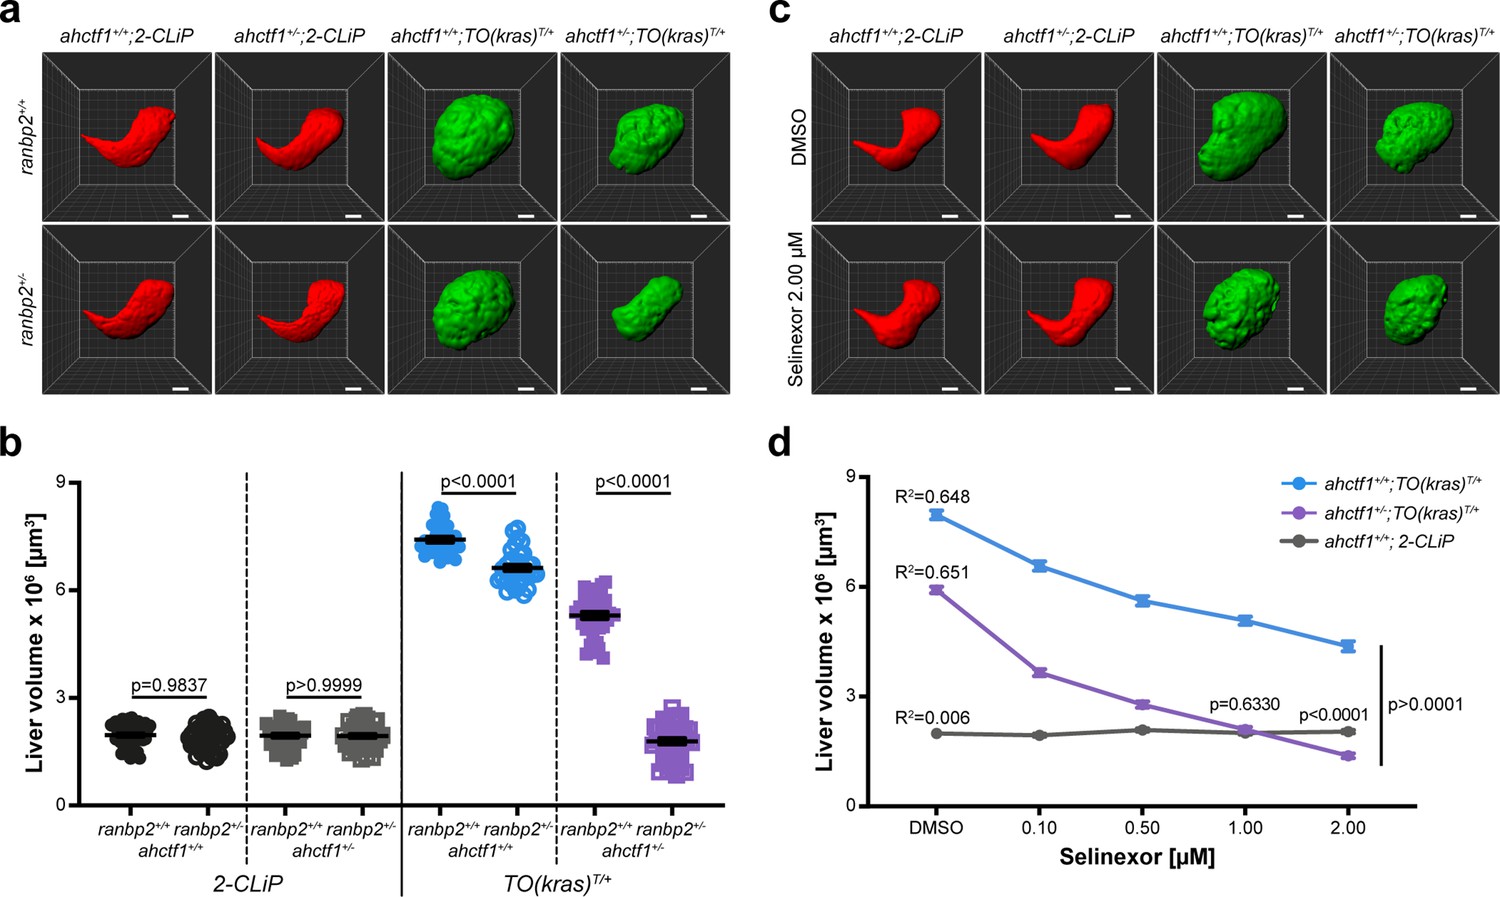
Combinatorial targeting of NUPs and Selinexor treatment restricts liver enlargement in dox-treated TO(krasG12V)T/+ hepatocytes.
(a) Representative three-dimensional reconstructions of livers from 2-CLiP and TO(krasG12V)T/+ larvae of the indicated ahctf1 and ranbp2 genotypes. Scale bar 25 µm. (b) Impact of ahctf1 heterozygosity and ranbp2 heterozygosity on liver volume in 2-CLiP and TO(krasG12V)T/+ larvae (n ≥ 30). Significance was calculated using a one-way analysis of variation (ANOVA) with Tukey’s multiple comparisons test. (c) Representative three-dimensional reconstructions of TO(krasG12V)T/+ livers of the indicated ahctf1 genotype treated with dimethyl sulfoxide (DMSO) or 2.00 µM Selinexor from 5 to 7 dpf. (d) Dose-dependent impact of Selinexor treatment on liver volume in 2-CLiP, ahctf1+/+;TO(krasG12V)T/+ and ahctf1+/−;TO(krasG12V)T/+ larvae (n ≥ 20). Data are expressed as mean ± standard error of the mean (SEM). Significance was calculated by linear regression analysis.
-
Figure 7—source data 1
Figure 7b: Quantitation of liver volume (µm3) of TO(krasG12V)T/+ zebrafish larvae; role of ahctf1 and ranbp2 mutation.
Figure 7d: Quantitation of liver volume (µm3) of TO(krasG12V)T/+ zebrafish larvae; impact of ahctf1 mutation and Selinexor treatment individually and in combination.
- https://cdn.elifesciences.org/articles/73407/elife-73407-fig7-data1-v2.xlsx
We recapitulated these results in adult male and female TO(krasG12V)T/+ zebrafish. In these experiments, total body mass was unaffected by single mutations in either ranbp2 or ahctf1, or both mutant alleles together, independent of dox treatment (Figure 7—figure supplements 2a and 3a). However, when liver mass was expressed as a percentage of total body mass, this was reduced by 13% (ranbp2) and 28% (ahctf1). In adult males carrying both mutations, liver mass expressed as a percentage of total body mass was reduced by 54% (Figure 7—figure supplement 2b and c). Similar results were obtained in adult females (Figure 7—figure supplement 3b, c). Histological analysis of adult male livers demonstrated that hepatocyte integrity and organisation were improved (fewer abnormal nuclei and cytoplasmic vacuoles) in ranbp2+/−;ahctf1+/− HETS (Figure 7—figure supplement 4). Thus, hyperplastic hepatocytes are highly susceptible to combinatorial targeting of NUP function, raising the question of whether this selective vulnerability could be exploited in the clinic.
Combining Selinexor treatment with ahctf1 heterozygosity blocks liver overgrowth in dox-treated TO(krasG12V)T/+ larvae
Selinexor is a selective inhibitor of nuclear export through its interaction with XPO1 (exportin). The drug has received FDA approval for the treatment of refractory or relapsed multiple myeloma and diffuse large B-cell lymphoma and is in clinical trials for several other cancers, including HCC (Jans et al., 2019; Zheng et al., 2014a), leading us to test the impact of Selinexor treatment in our larval model of HCC. We observed no reduction in liver volume in 2-CLiP larvae exposed to 0.10–2.00 µM Selinexor from 5 to 7 dpf (Figure 7—figure supplement 5a, b). In contrast, ahctf1+/+;TO(krasG12V)T/+ larvae exhibited a dose-dependent reduction in liver volume when exposed to Selinexor and this was reduced further by ahctf1 heterozygosity (Figure 7—figure supplement 5c, d). Indeed, at a 1.00 µM concentration of Selinexor, liver volume in ahctf1+/−;TO(krasG12V)T/+ larvae was indistinguishable from that of control 2-CLiP larvae, indicating that liver overgrowth was completely blocked. These observations suggest that Selinexor could be an effective and selective suppressor of growth and proliferation in human HCC, and that its efficacy may be enhanced by combinatorial targeting with novel therapeutics designed to disrupt the function of the ELYS protein.
Targeting NUPs is a promising therapeutic approach for HCC
To explore the clinical rationale for developing NUP inhibitors for the purpose of HCC treatment, we analysed gene expression data available for 366 patient samples in TCGA liver hepatocellular carcinoma (LIHC) dataset (Figure 8—source data 1) using the cBioPortal for Cancer Genomics (Cerami et al., 2012; Gao et al., 2013). Z-score values were allocated to mRNA expression levels (RNAseq V2 RSEM) for each of the genes encoding the 10 components of the NUP107–160 complex relative to the mean expression value of that gene in diploid samples. Using this approach, we found a higher percentage of HCC samples overexpressing NUP mRNAs (z-score >2) than those under-expressing NUP mRNAs (z-score <2). For example, in the case of AHCTF1, 32.4% of patient samples had a z-score of >2 relative to the mean expression of samples in the LIHC cohort that were diploid for AHCTF1. Conversely, only 0.82% of patient samples had a z-score of <−2 for AHCTF1 relative to its expression in samples that were diploid for this gene (Figure 8a).
Figure 8 with 1 supplement see all
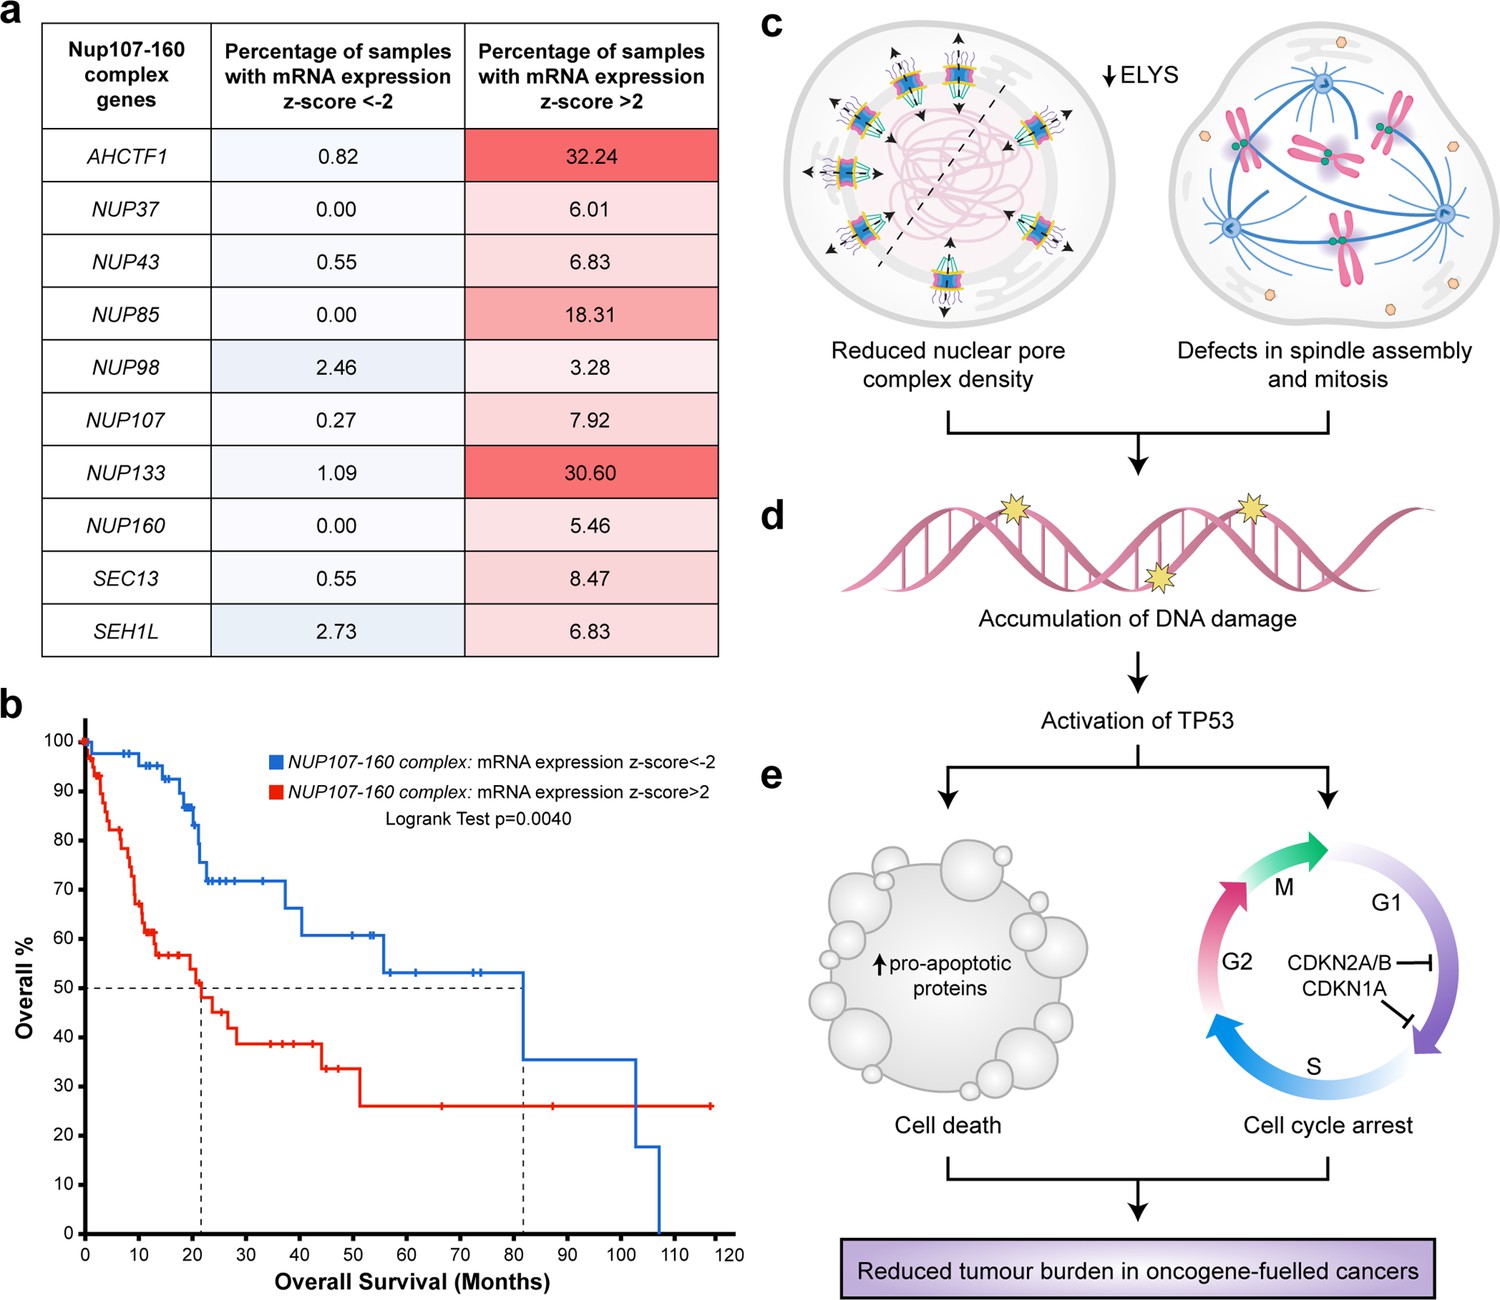
Targeting nuclear pore complexes (NPCs) is a promising therapeutic approach for hepatocellular carcinoma (HCC).
(a) Heatmap based on percentage of hepatocellular carcinoma (LIHC) samples in The Cancer Genome Atlas (TCGA) with mRNA expression levels of NUP107–160 components that are under-expressed (z-score <−2: over 2 standard deviations below the mean expression of those genes in diploid samples) or overexpressed (z-score >2: over 2 standard deviations above the mean expression of those genes in diploid samples) analysed through the cBioPortal for Cancer Genomics (Cerami et al., 2012; Gao et al., 2013). See Figure 8—source data 1. (b) Probability of overall survival of HCC patients linked to samples with mRNA expression z-scores >2 for one or more NUP107–160 complex components (red line; 63 cases); median probability of overall survival 21.70 months. Probability of overall survival of HCC patients linked to samples with mRNA expression z-scores <−2 for one or more NUP107–160 complex components (blue line; 45 cases); median probability of overall survival 81.73 months. (c) Schematic depiction of two cellular processes disrupted by mild Elys depletion, leading to (d) accumulation of DNA damage and activation of Tp53 transcription programmes. (e) Induction of cell death and cell cycle arrest in hyperproliferative oncogene-expressing cancer cells.
-
Figure 8—source data 1
Figure 8a: mRNA expression z-scores (RNAseq V2 RSEM) for AHCTF1 and the nine other genes encoding components of the NUP107–160 complex, relative to the mean expression of each gene of interest in patient samples that are diploid for that gene.
- https://cdn.elifesciences.org/articles/73407/elife-73407-fig8-data1-v2.xlsx
To determine whether differences in NUP gene expression were associated with overall survival, we analysed the clinical data available for patients in the LIHC dataset. Here, log-transformed mRNA expression z-scores were calculated relative to the expression distribution of the ten 107–160 NUP genes across all 366 patient samples. This was followed by a logrank test to compare the survival distributions of patients linked to samples in the high expression group (z-score >2) versus patients linked to samples in the low expression (z-score <−2.0) group. We found that patients linked to samples with high mRNA expression z-scores (>2.0) for one or more NUP107–160 components appeared to do significantly worse than patients with samples in the low expression group (z-score <−2.0). Indeed, the median probability of overall survival for patients allocated to the high expression group was 21.70 months compared to 81.73 months (3.8-fold increase) for patients allocated to the low expression group (Figure 8b). We infer from these clinical data that patients with HCCs expressing high levels of mRNAs encoding ELYS and other components of the NUP107–160 complex may benefit most from strategies designed to target these NUP components therapeutically.
To examine the integrity of these interesting clinical data, we determined whether unwanted variation affected the expression levels of the NUP107–160 complex genes in samples of the LIHC dataset. If present, unwanted variation caused by factors such as differences in library size, tumour purity/heterogeneity and batch effects between participating laboratories, can significantly adversely affect downstream analyses including association between gene expression and survival outcomes (Molania et al., 2022). Since the 366 samples of the LIHC dataset were profiled across 19 sequencing plates that could potentially cause batch effects, we addressed this issue by performing analysis of variation (ANOVA) tests (Figure 8—figure supplement 1). These tests revealed that the expression of our genes of interest in the LIHC dataset was largely unaffected by unwanted variation, increasing confidence that the inverse relationship we report here between upregulated NUP107–160 gene expression and poorer overall survival rate is likely to be reliable.
Discussion
In this paper we show that the presence of one mutant ahctf1 allele markedly reduces hepatocyte growth and survival in a mutant kras-driven model of HCC. In our experiments ahctf1 heterozygosity reduced the abundance of NPCs and introduced defects in mitotic spindle assembly and chromosome segregation only in hepatocytes expressing the krasG12V oncogene (Figure 8c). These perturbations combined to amplify the mild oncogenic stress exhibited by cells expressing the krasG12V oncogene, culminating in DNA damage, Tp53 activation (Figure 8d) and increased expression of Tp53 target genes that promote apoptosis and cell cycle arrest (Figure 8e). The exquisite vulnerability of hepatocytes co-expressing the krasG12V oncogene and a single mutated ahctf1 allele demonstrates a synthetic lethal interaction between a powerful oncogene and heterozygous expression of an essential cellular gene. Such a finding is of significant interest considering the remarkable success of PARP1 inhibitors in the clinic and presents a potential new drug target for tumours expressing mutant KRAS, which has hitherto proven difficult to target directly.
Our results compliment a growing body of evidence that carcinogenesis places persistently high demands on essential cellular genes, including those encoding NUPs (Sakuma et al., 2021). Sakuma et al. used siRNAs targeting 28 individual NUP genes to reduce the abundance of NPCs in the human melanoma-derived cell line, A375, and showed that this caused cell death (Sakuma et al., 2021). Meanwhile, normal human pulmonary fibroblasts and retinal pigmental epithelium cells (RPE1), underwent a reversible cell cycle arrest instead, consistent with reports that quiescent cells generally require only low levels of NUP expression due to exceptional stability of assembled NPCs (D’Angelo et al., 2009; Toyama et al., 2013).
Mutations in TP53, or amplification/overexpression of its negative regulators MDM2/MDM4, occur in 30% of HCC cases (Zucman-Rossi et al., 2015). Therefore, it was pertinent to ask whether the potential therapeutic effect of inhibiting ELYS function in a clinical setting would be diminished in tumours not expressing WT TP53 protein. To address this question, we studied the impact of ahctf1 heterozygosity in zebrafish that were homozygous for mutant tp53. We found that loss of Tp53 function permitted markedly higher rates of hepatocyte growth and liver enlargement in the larval, mutant kras-driven model of HCC, whether they were WT or heterozygous for ahctf1. However, total liver volume in ahctf1 HETS was 35% less than in WT, meaning that the capacity of ahctf1 heterozygosity to reduce liver volume was not entirely dependent on availability of WT Tp53. However, from a therapeutic perspective, we think that obtaining the full benefit of targeting ELYS protein in the clinic is likely to be affected by the mutational status of TP53.
Dysregulation of nucleocytoplasmic transport is a common feature in a broad spectrum of cancers, usually arising from altered expression of nuclear pore components and/or nuclear transport receptors (Kau et al., 2004). For example, the nuclear transport receptor XPO1 is frequently overexpressed in cancers, leading to mis-localisation and inactivation of tumour suppressor proteins (Zheng et al., 2014a; Hill et al., 2014). We found that in our zebrafish HCC model, treatment with a clinically validated XPO1 inhibitor, Selinexor, produced a dose-dependent reduction in liver enlargement, which was strongly augmented by ahctf1 heterozygosity. We also found that trans heterozygosity of ahctf1 and ranbp2 produced a synergistic reduction in liver volume in both krasG12V-expressing larvae and adults. Normal livers not expressing the TO(krasG12V) transgene were completely unaffected by Selinexor treatment or ahctf1;ranbp2 trans heterozygosity, suggesting that new drugs targeting the ELYS protein and/or other NUPs could be combined effectively with drugs that target nucleocytoplasmic transport without forfeiting cancer selectivity.
To date, the molecular topology of the ELYS protein is poorly defined. Further high-resolution structural characterisation is required to advance our molecular understanding of the extent to which discrete domains within the ELYS protein contribute to its various interactions, and to reveal opportunities to inhibit such regions for the purpose of disabling ELYS function therapeutically. Crystal structures of ELYS have shown that the β-propeller and α-helical domains in the N-terminal half of the ELYS protein bind to NUP160, and cryo-electron microscopy revealed the association of the ELYS C-terminal region with nucleosomes (Kobayashi et al., 2019; Bilokapic and Schwartz, 2013). However, ELYS and other NUPs in the NUP107–160 complex generally lack features that would facilitate high affinity binding with small drug-like molecules (Sakuma et al., 2021; Mitsopoulos et al., 2021). Notwithstanding this, rapidly emerging technological advances in drug development may provide alternative strategies to target the ELYS protein. For example, carefully controlled proteasomal degradation of proteins that participate in the oncogenic process using proteolysis targeting chimeras (PROTACs) is a rapidly advancing field in cancer therapy (Ocaña and Pandiella, 2020). In parallel, emerging small molecule RNA-targeting technology is on course to permit direct modulation of the abundance of specific RNA transcripts for a variety of clinical purposes (Mukherjee et al., 2020). In summary, we believe the findings from our in vivo model of HCC provide a strong and feasible rationale for the development of novel therapeutics that target ELYS function as well as suggesting potential avenues for effective combinatorial treatments.
Materials and methods
Key resources table
| Reagent type (species) or resource | Designation | Source or reference | Identifiers | Additional information |
|---|---|---|---|---|
| Gene (Danio rerio) | ahctf1 | Ensembl | ENSDARG00000077530 | |
| Gene (Danio rerio) | ranbp2 | Ensembl | ENSDARG00000093125 | |
| Gene (Danio rerio) | tp53 | Ensembl | ENSDARG00000035559 | |
| Genetic reagent Zebrafish (Danio rerio) | ahctf1ti262 (TU) | European Zebrafish Resource Centre (EZRC) | ZDB-ALT-980203-1165 | Also known as flotte lotte |
| Genetic reagent Zebrafish (Danio rerio) | ranbp2s452 (TU) | Heath Lab (see this paper; Figure 7—figure supplement 1) | ||
| Genetic reagent Zebrafish (Danio rerio) | Tp53zdf1 (AB) | European Zebrafish Resource Centre (EZRC) | ZDB-ALT-050428-215201 | Also known as Tp53M214K |
| Genetic reagent Zebrafish (Danio rerio) | Tg(fabp10:dsRed, ela31:GFP)gz12 | Zhiyuan Gong, National University of Singapore | PMID:18796162 | Also known as Lipan or 2CLiP |
| Genetic reagent Zebrafish (Danio rerio) | Tg(fabp10:rtTA2s-M2; TRE2:EGFP-krasG12V)gz32 | Zhiyuan Gong, National University of Singapore | PMID:23812423 | |
| Genetic reagent Zebrafish (Danio rerio) | Tg(actb2:SEC-Hsa.ANXA5-mKate2,cryaa:mCherry)uq24rp | Thomas Hall, Institute of Molecular Bioscience, University of Queensland | PMID:31754462 | |
| Antibody | mAb414 (Mouse monoclonal) | AbCam | Cat# ab24609 | IF (1:750) |
| Antibody | anti-γ-H2AX (Mouse monoclonal) | AbCam | Cat# ab11174 | IF (1:1000) |
| Antibody | anti-α-Tubulin DM1A (Mouse monoclonal) | Cell Signaling Technology | Cat#: 3873 | IF (1:1000) |
| Antibody | anti-cleaved Caspase3 (Rabbit polyclonal) | Cell Signaling Technology | Cat#: 9664 | IF (1:250) |
| Antibody | Donkey anti-Rabbit IgG (H+L) Highly Cross-Adsorbed Secondary Antibody, Alexa Fluor 647 (Donkey polyclonal) | Thermo Fisher Scientific | Cat#: A31573 | IF (1:500) |
| Antibody | Goat anti-Mouse IgG (H+L) Cross-Adsorbed Secondary Antibody, Alexa Fluor 647 (Goat polyclonal) | Thermo Fisher Scientific | Cat#: A21235 | IF (1:500) |
| Antibody | anti-Tp53 (9.1) (Mouse monoclonal) | AbCam | Cat# ab77813 | WB (1:500) |
| Antibody | anti-GAPDH (14C10) (Rabbit polyclonal) | Cell Signaling Technology | Cat#: 2118 | WB (1:1000) |
| Antibody | Goat Anti-Mouse Immunoglobulins/HRP (affinity isolated) (Goat polyclonal) | Dako | Cat#: P0447 | WB (1:5000) |
| Antibody | Goat Anti-Rabbit Immunoglobulins/HRP (affinity isolated) (Goat polyclonal) | Dako | Cat#: P0448 | WB (1:5000) |
| Commercial assay or kit | Active Ras Pull-Down and Detection kit | Thermo Fisher Scientific | Cat#: 16117 | |
| Commercial assay or kit | Click-iT Edu AF647 kit imaging kit | Invitrogen | Cat#: C10340 | |
| Chemical compound, drug | Selinexor (KPT-330) | Gift of Karyopharm Therapeutics | XPO1 inhibitor | |
| Chemical compound, drug | Doxycycline | Sigma Aldrich | Sigma D9891 | 20 μg/mL |
Sequence-based reagents
Table 1. Genotyping primers
Request a detailed protocol| Name | Forward (5′–3′) | Reverse (5′–3′) |
|---|---|---|
| ahctf1ti262 | TGACATGCATGCCCTCTCTG | TAGCTGCTCCTCGCTTACGT |
| ranbp2s452 | CGCCGATCAAGAGGACGAAA | TGTCCGCCGTAACACTACTC |
| tp53 wildtype | AGCTGCATGGGGGGGAT | GATAGCCTAGTGCGAGCACACTCTT |
| tp53M214K | AGCTGCATGGGGGGGAA | GATAGCCTAGTGCGAGCACACTCTT |
Table 2. RT-qPCR primers
Request a detailed protocol| Name | Forward (5′–3′) | Reverse (5′–3′) |
|---|---|---|
| ahctf1ti262 | GGTGAGTCAGTGTGGGGAAC | CCAGCAGGGCATGAAGTGAT |
| b2m | GCGGTTGGGATTTACATGTTG | GCCTTCACCCCAGAGAAAGG |
| bad | AGCAGCACCTCACTGTTCCT | CCAGTTTCCAGCAAGTCCTC |
| bax | GGAGATGAGCTGGATGGAAA | GGGCCACTCTGATGAAGACA |
| bbc3 | GATGCCTTCAGCTTGGAC | GCCTGGACACTTCCTGTTCT |
| bcl2 | GGATCGAGGAAAATGGAGGT | AAAACGGGTGGAACACAGAG |
| bclxl | CAACCATATTCAACCCTGGA | TTCTTGCGATTTCCTGCT |
| bid | ACCAGCGACCTACAGAGACC | TCTGCATTGACTGAAAGACCA |
| bik | TTGCTTCCACAGCTTCAAAA | ATGTAGTGCTGCGAGACCAG |
| bim | GCACTTTGATTTCCCTCAGC | TGGAGAAAGTCCGGTTCATC |
| ccng1 | GTGCGGAGACGTTTTCCTT | AAGACAGATGCTTGGGCTGA |
| cdkn1a | CAAGCCAAGAAGCGTCTAGTG | AACGGTGTCGTCTCTGGTTC |
| cdkn2a/b | CGAGGATGAACTGACCACAGC | CAACAGCCAAAGGTGCGTTAC |
| hrpt1 | GAGGAGCGTTGGATACAGA | CTCGTTGTAGTCAAGTGCAT |
| mdm2 | TGACAAAGAAACTGGTAAGA | AAACATAACCTCCTTCATGGT |
| pmaip1 | ATGGCGAAGAAAGAGCAAAC | TCATCGCTTCCCCTCCATTTG |
| tbp | CAGGCAACACACCACTTTAT | AAGTTTACGGTGGACACAAT |
| tp53 | TCCACTCTCCCACCAACATC | GGGAACCTGAGCCTAAATCC |
| tp63 | CGGCCTGTTTGGACTATTTC | ACTCCATGATGCCTTTCCAG |
| tp73 | GGCCAATCCTCATCATCATC | TCCCTGAATGGTCTTCGTC |
| ∆113tp53 | ATATCCTGGCGAACATTTGG | ACGTCCACCACCATTTGAAC |
Zebrafish maintenance and strains
Request a detailed protocolZebrafish were maintained at 28°C on a 12 hr light/12 hr dark cycle. The mutant lines ahctf1ti262 and tp53M214K/M214K (also known as tp53e7/e7 and referred to herein as tp53m/m) have been described previously (Chen et al., 1996; Berghmans et al., 2005). The Tg(fabp10:dsRed, ela3l:GFP)gz12 line, herein referred to as 2-CLiP, expresses dsRed in the liver and GFP in the exocrine pancreas but carries no oncogenic transgenes or mutations (Korzh et al., 2008). The Tg(fabp10:rtTA2s-M2;TRE2:EGFP-krasG12V)gz32 line referred to as TO(krasG12V)T/+ and the cell death reporter line, Tg(actb2:SEC-Hsa.ANXA5-mKate2,cryaa:mCherry)uq24rp were described previously (Chew et al., 2014; Hall et al., 2019). The ranbp2s452 mutant line was generated in the Liverplus ENU mutagenesis screen (Ober et al., 2006), and its genetic and morphological characterisation is presented for the first time in this paper.
Inducing hepatocyte hyperplasia in larval zebrafish
Request a detailed protocolTo induce krasG12V expression, TO(krasG12V)T/+ embryos were treated with 20 µg/mL dox (Sigma, #D9891) at 2 dpf in E3 medium (5 mM NaCl, 0.17 mM KCl, 0.33 mM CaCl2, 0.33 mM MgSO4) with 0.003% 1-phenyl-2-thiourea (PTU; Sigma, #P7629) to suppress pigmentation. E3 medium was changed at 5 dpf and fresh dox (final conc. 20 µg/mL) added. For the Selinexor experiments, the drug (final concentration 0.10–2.00 μM) (Karyopharm) or 0.001% DMSO (vehicle control) was added at 5 dpf. Morphological and molecular analyses were performed at 7 dpf. To quantitate liver volume, larvae were anaesthetised with benzocaine (200 mg/L) and mounted in 1% agarose. Image acquisition was performed using an Olympus FVMPE-RS multiphoton microscope with a ×25 objective and Olympus FV30-SW software. Excitation wavelengths for GFP and RFP were 840 and 1100 nm, respectively. For volumetric analysis of whole livers, z-stacks with step size 2 μm were imported into ImageJ or Imaris software.
Inducing HCC in adult zebrafish
Request a detailed protocolTo induce krasG12V expression, adult TO(krasG12V)T/+ zebrafish (>3 months post-fertilisation) were treated for 7 days with 20 mg/L doxycycline (Sigma, #D9891) with water and dox changed daily. Zebrafish were euthanised with benzocaine (1000 mg/L) and tumour burden quantified by liver-to-body mass ratio measurements.
Genotyping
Request a detailed protocolGenomic DNA (gDNA) was extracted from whole zebrafish larvae by incubation at 95°C in 50 μL of 50 mM sodium hydroxide (NaOH) for 20 min, followed by neutralisation with 5 μL of 1 M Tris–HCl (pH 8.0). Primer sequences for genotyping are listed in Table 1.
mRNA expression analysis
Request a detailed protocolTotal RNA was extracted from independent pools of micro-dissected zebrafish livers using the RNeasy Micro Kit (QIAGEN, #74004). RNA integrity was assessed by a High Sensitivity RNA ScreenTape assay (Agilent, #5067-5579) on a 2200 TapeStation. cDNA was generated from 1 to 10 µg RNA using the Superscript III First Strand Synthesis System (Invitrogen, #18080051) and oligo(dT) priming according to the manufacturer’s instructions. RT-qPCR was performed using a SensiMix SYBR kit (Bioline, #QT605-05) on an Applied Biosystems ViiATM7 Real-Time PCR machine. Expression data were normalised by reference to hrpt1, b2m, and tbp. LinRegPCR V11.0 was used for baseline correction, PCR efficiency calculation and transcript quantification analysis (Ruijter et al., 2009). Relative expression levels were calculated by the 2−∆∆Ct method and all results were expressed as the mean ± standard error of the mean (SEM) of three independent pools of biological replicates. Primer sequences for RT-qPCR are listed in Table 2.
Library preparation and RNA sequencing
Request a detailed protocolRNA was isolated from individually micro-dissected livers and 100 ng per sample of RNA was used for RNA-sequencing library preparation using the TruSeq RNA Sample Prep Kit with Ribo-Zero depletion (Illumina). Indexed libraries were sequenced on a NextSeq 500 instrument (Illumina) to generate 80-bp paired end reads and yielding at least 20 million reads per sample. All samples were aligned to the GRCz11 build of the zebrafish genome using the align function from the Rsubread software package (v2.0.1) (Liao et al., 2019). In all cases at least 75% of fragments (read pairs) were successfully mapped. All fragments overlapping genes were counted using Rsubread’s featureCounts function. Genes were identified using Ensembl annotation (v101). Differential expression analyses between the sample groups were then undertaken using the limma (v3.46.0) (Ritchie et al., 2015) and edgeR (v3.32.1) (Robinson et al., 2010) software packages. Expression-based filtering was performed using edgeR’s filterByExpr function with default parameters. A total of 21,655 genes remained. Sample composition was normalised using the TMM method (Robinson and Oshlack, 2010). These data were transformed to log-counts per million (logCPM) with associated observation level precision weights using voom (Law et al., 2014). Linear models were fit to the data and robust empirical Bayes moderated t-statistics were utilised to identify differentially expressed genes (Phipson et al., 2016) through application of edgeR’s voomLmFit pipeline. The false discovery rate was controlled below 5% using the Benjamini and Hochberg method. The mean difference plot was generated using limma’s plotMD function and the heatmap using the pheatmap software package (v1.0.12). Gene set enrichment analysis was conducted with limma’s cameraPR function with default parameters, and the associated barcode plots drawn with limma’s barcodeplot function. Pathway analyses of the kyoto encyclopedia of genes and genomes (KEGG) database were accomplished using limma’s kegga function. The data have been deposited in the GEO under accession number GSE220282.
Western blot analysis
Request a detailed protocolPooled micro-dissected zebrafish livers were lysed in RIPA buffer (20 mM HEPES (4-(2-hydroxyethyl)-1-piperazineethanesulfonic acid), pH 7.9, 150 mM NaCl, 1 mM MgCl2, 1% NP40, 10 mM NaF, 0.2 mM Na3VO4, 10 mM β-glycerol phosphate) supplemented with cOmplete Proteinase Inhibitor (Roche, #11836170001) and PhosTOP phosphatase inhibitors (Roche, #04906837001). Samples were incubated for 30 min on ice and the extracts cleared by centrifugation at 13,000 rpm for 20 min at 4°C. The protein concentration of samples was determined by BCA protein assay (Thermo Fisher Scientific, #23227). 25 μg of protein per lane were resolved on NuPAGE Novex Bis-Tris 4–12% polyacrylamide gels (Invitrogen, #NP0321BOX) and transferred onto nitrocellulose blotting membranes (Amersham Protran, #10600003). Membranes were blocked with 5% bovine serum albumin (BSA) in phosphate-buffered saline (PBS) for 1 hr at room temperature (RT) and incubated with primary antibodies 1:500 Anti-p53 (9.1) mouse mAb (Abcam, #ab77813) overnight at 4°C and 1:1000 Anti-GAPDH (14C10) Rabbit mAb (Cell Signalling Technology, #2118) for 1 hr at RT. Secondary antibodies: Goat anti-mouse HRP (Dako, #P0447) and Goat anti-Rabbit HRP (Dako, #P0448) were used at 1:5000 and incubated with membranes for 1 hr at RT. Signals were developed using Amersham ECL Western Blotting Detection Kit (Cytiva, # RPN2108) and imaged on a Chemidoc Touch (Bio-Rad). Relative protein quantitation was calculated based on normalised integrated intensity.
Active Ras pull-down and detection
Request a detailed protocolTotal lysate was isolated from 7 dpf zebrafish larvae and equal amounts of protein (50 μg) were used as input for the pull-down of activated GTP-Ras proteins using the Active Ras Pull-Down and Detection kit (Thermo Fisher, #16117) according to the manufacturers’ instructions.
Cell death analysis
Request a detailed protocolTo assess apoptosis, 7 dpf TO(krasG12V);Annexin 5-mKate zebrafish larvae were fixed in 4% paraformaldehyde (PFA) overnight at 4°C and livers isolated by micro-dissection. Image acquisition was performed using a Zeiss LSM 880 microscope with a ×20 objective and ZEN software. Excitation wavelengths for mKate and GFP were 560 and 900 nm, respectively. Liver volume was quantified and 3D segmentation of Annexin 5-mKate signals were performed in ImageJ.
Analysis of DNA replication in S-phase
Request a detailed protocolEdU incorporation was used to assess the percentage of cells in S-phase of the cell cycle. Briefly, live zebrafish larvae (7 dpf) were incubated at 28°C in 2 mM EdU (Invitrogen, #C10340) in E3 medium for 2 hr followed by a further incubation in fresh E3 medium for 1 hr. Larvae were euthanised using benzocaine (1000 mg/L; Sigma, #PHR1158) prior to removal of the liver by micro-dissection. EdU labelling was carried out using the Click-iT Edu Alexa Fluor 647 (AF647) imaging kit (Invitrogen, #C10340), according to the manufacturer’s instructions. The livers were co-stained with Hoechst 33342 (Thermo Fisher, #62249). Image acquisition was performed using an Olympus FVMPE-RS multiphoton microscope with excitation wavelengths of 950 nm for Hoechst 33342 dye and 1160 nm for AF647 (Thermo Fisher, #A21235). The number of Hoechst 33342- and EdU-positive cells was quantified using Arivis Vision4D software.
Nuclear pore analysis
Request a detailed protocolLarvae fixed in 4% PFA overnight at 4°C were embedded in 4% low-melting temperature agarose and transverse sections collected at 200 µm intervals using a vibrating microtome (Leica VT 1000S). Sections were blocked with 1% BSA in PBS/0.3% Triton X-100 and incubated with a 1:750 dilution of mAb414 (Abcam, #ab24609) at 4°C overnight. Sections were then incubated with 1:500 anti-mouse AF647 and Hoechst 33342 at room temperature for 1 hr. Sections were mounted and imaged using a Zeiss LSM880 Fast Airyscan Confocal microscope with a ×63 objective. 3D segmentation of cells was performed in ImageJ using EGFP signal for TO(krasG12V)T/+ larvae or F-actin stained with 1:200 rhodamine phalloidin for TO(krasG12V)+/+ larvae. An outline was drawn around the nuclear periphery and segmented using the Hoechst signal. mAb414 fluorescence intensity was calculated for the nuclear periphery and for the cytoplasm. NPC density was calculated by finding maxima for mAb414 at the nuclear surface of 5 nuclei per liver.
Cryosectioning and immunofluorescence microscopy analysis
Request a detailed protocolDissected livers were fixed in 4% PFA overnight at 4°C and washed with PBS/0.1% Tween 20 before incubation in 30% sucrose in PBS overnight at 4°C. Livers were aligned in a tissue mould, embedded in OCT and frozen on dry ice. The livers were sectioned at 10µm intervals using a Thermo Fisher Scientific Microm HM550 cryostat. Sections were washed with PBS before blocking with 10% FCS in PBS/0.3% Triton X-100. Incubation with primary antibodies was performed at 4°C overnight, while incubation with secondary antibodies was performed at room temperature for 1 hr. Antibodies used in this work were: 1:2000 a-Tubulin DM1A (CST, #3873), 1:1000 γ-H2AX (gift of James Amatruda), 1:250 cleaved caspase-3 (CST, #9664), 1:500 anti-rabbit AF647 (Thermo Fisher Scientific, #A31573) and 1:500 anti-mouse AF647 (Thermo Fisher, #A21235). Prolong Diamond Antifade reagent with DAPI (Thermo Fisher #P36962) was used for slide mounting. A Zeiss LSM880 Fast Airyscan Confocal microscope with a ×63 objective was used for image acquisition and ImageJ for image analysis.
TCGA LIHC dataset analysis
Request a detailed protocolGene expression values for patient samples in the LIHC dataset in the TCGA, PanCancer Atlas were analysed using cBioPortal (Cerami et al., 2012; Gao et al., 2013). The NUP107–160 complex genes AHCTF1, NUP37, NUP43, NUP85, NUP98, NUP107, NUP133, NUP160, SEC12, and SEH1L were queried in samples with mRNA data (RNA Seq V2 RSEM). Patient samples were assigned to groups with high or low expression of one or more NUP107–160 complex genes based on z-scores >2 and <−2.0, respectively, relative to diploid samples. Patient samples that overlapped the selected groups were excluded from the overall survival analysis.
Statistical analysis
Request a detailed protocolData are expressed as mean ± standard error of the mean (SEM), unless indicated otherwise, and the number of biological replicates indicating samples from individual animals/livers, or pools of individual animals/livers for each experiment are stated in the figure legends. p values were calculated using Student’s t-tests (two-tailed, followed by Welch’s correction) when comparing two groups, and by ANOVA followed by Tukey’s post hoc test when comparing multiple groups. Chi-square tests were used to analyse the distribution of mitotic cells and the number of mitotic cells exhibiting an aberrant phenotype. The effect of Selinexor treatment on liver volume was analysed by linear regression, regressing liver volume against Selinexor concentration. All analysis was performed using GraphPad Prism V7.03 (GraphPad software) and p values ≤0.05 were considered statistically significant.
Data availability
A new RNA sequencing dataset has been deposited in GEO under accession ID GSE220282. Existing datasets analysed during the current study are available in the cBioPortal Cancer Genomics database (http://www.cbioportal.org). All data generated/analysed during this study are included in the Figures and figure supplements and Source Data files are provided for Figures 1–8.
-
NCBI Gene Expression OmnibusID GSE220282. Molecular characterisation of a mutant kras-driven zebrafish model of hepatocellular carcinoma.
-
cBioPortal Cancer Genomics databaseID Genomics. Liver Hepatocellular Carcinoma.
References
-
Active gtpase pulldown protocolMethods in Molecular Biology 2262:117–135.https://doi.org/10.1007/978-1-0716-1190-6_7
-
The nuclear pore complex: understanding its function through structural insightNature Reviews. Molecular Cell Biology 18:73–89.https://doi.org/10.1038/nrm.2016.147
-
Ubiquitous activation of ras and JAK/STAT pathways in human HCCGastroenterology 130:1117–1128.https://doi.org/10.1053/j.gastro.2006.01.006
-
Nucleoporins: leaving the nuclear pore complex for a successful mitosisCellular Signalling 23:1555–1562.https://doi.org/10.1016/j.cellsig.2011.05.023
-
Synthetic lethality in drug development: the dawn is comingFuture Medicinal Chemistry 10:2129–2132.https://doi.org/10.4155/fmc-2018-0227
-
Orchestrating nuclear envelope disassembly and reassembly during mitosisNature Reviews. Molecular Cell Biology 10:178–191.https://doi.org/10.1038/nrm2641
-
Cellular rescue in a zebrafish model of congenital muscular dystrophy type 1ANPJ Regenerative Medicine 4:21.https://doi.org/10.1038/s41536-019-0084-5
-
Transcriptomic analyses of oncogenic hepatocytes reveal common and different molecular pathways of hepatocarcinogenesis in different developmental stages and genders in krasg12v transgenic zebrafishBiochemical and Biophysical Research Communications 510:558–564.https://doi.org/10.1016/j.bbrc.2019.02.008
-
Inhibitors of nuclear transportCurrent Opinion in Cell Biology 58:50–60.https://doi.org/10.1016/j.ceb.2019.01.001
-
Nuclear transport and cancer: from mechanism to interventionNature Reviews. Cancer 4:106–117.https://doi.org/10.1038/nrc1274
-
Chromatin targeting of nuclear pore proteins induces chromatin decondensationThe Journal of Cell Biology 218:2945–2961.https://doi.org/10.1083/jcb.201807139
-
The nup107-160 complex and gamma-turc regulate microtubule polymerization at kinetochoresNature Cell Biology 12:164–169.https://doi.org/10.1038/ncb2016
-
CanSAR: update to the cancer translational research and drug discovery knowledgebaseNucleic Acids Research 49:D1074–D1082.https://doi.org/10.1093/nar/gkaa1059
-
Removing unwanted variation from large-scale RNA sequencing data with prpsNature Biotechnology 41:82–95.https://doi.org/10.1038/s41587-022-01440-w
-
PEARL-seq: a photoaffinity platform for the analysis of small molecule-RNA interactionsACS Chemical Biology 15:2374–2381.https://doi.org/10.1021/acschembio.0c00357
-
Proteolysis targeting chimeras (protacs) in cancer therapyJournal of Experimental & Clinical Cancer Research 39:189.https://doi.org/10.1186/s13046-020-01672-1
-
Structure and function of the nuclear pore complexCold Spring Harbor Perspectives in Biology 14:a041264.https://doi.org/10.1101/cshperspect.a041264
-
Robust hyperparameter estimation protects against hypervariable genes and improves power to detect differential expressionThe Annals of Applied Statistics 10:946–963.https://doi.org/10.1214/16-AOAS920
-
Capture of AT-rich chromatin by ELYS recruits POM121 and NDC1 to initiate nuclear pore assemblyMolecular Biology of the Cell 19:3982–3996.https://doi.org/10.1091/mbc.e08-01-0012
-
Dna double-stranded breaks induce histone H2AX phosphorylation on serine 139The Journal of Biological Chemistry 273:5858–5868.https://doi.org/10.1074/jbc.273.10.5858
-
Nup358 integrates nuclear envelope breakdown with kinetochore assemblyThe Journal of Cell Biology 162:991–1001.https://doi.org/10.1083/jcb.200304080
-
KPT-330 inhibitor of XPO1-mediated nuclear export has anti-proliferative activity in hepatocellular carcinomaCancer Chemotherapy and Pharmacology 74:487–495.https://doi.org/10.1007/s00280-014-2495-8
-
Genetic landscape and biomarkers of hepatocellular carcinomaGastroenterology 149:1226–1239.https://doi.org/10.1053/j.gastro.2015.05.061
Article and author information
Author details
Didier YR Stainier

Funding
National Health and Medical Research Council (Project GNT 1024878)
- Joan K Heath
Australian Government (Graduate Student Training Program)
- Kimberly J Morgan
Ludwig Institute for Cancer Research (Ludwig Member Support Package)
- Joan K Heath
The funders had no role in study design, data collection, and interpretation, or the decision to submit the work for publication.
Acknowledgements
The authors thank Tyson Blanch, Cameron Mackey, Elizabeth Grgacic, and Bryan Ko for excellent zebrafish husbandry and Ellen Tsui for histology. We are grateful to Assoc Prof Kimberley Evason for reviewing the zebrafish liver histology, Prof James Amatruda for the gift of rabbit polyclonal antibody to zebrafish γ-H2AX and Karyopharm Therapeutics for the gift of Selinexor. We thank Drs Andrew Cox, Leigh Coultas, Alexandra Garnham, Quentin Gouil, Assoc Prof Brendon Monahan, and Prof Gordon Smyth for bioinformatics support and insightful discussions.
Ethics
All husbandry and experimental procedures performed on zebrafish followed standard operating procedures and were conducted with the approval of the Animal Ethics Committees of the Walter and Eliza Hall Institute and The University of Melbourne, Parkville, Victoria, Australia. WEHI-AEC approved project 2019.014, project title: Zebrafish disease models and mechanisms.
Copyright
© 2023, Morgan et al.
This article is distributed under the terms of the Creative Commons Attribution License, which permits unrestricted use and redistribution provided that the original author and source are credited.
Metrics
-
- 1,956
- views
-
- 224
- downloads
-
- 7
- citations
Views, downloads and citations are aggregated across all versions of this paper published by eLife.
Citations by DOI
-
- 7
- citations for umbrella DOI https://doi.org/10.7554/eLife.73407
Download links
A two-part list of links to download the article, or parts of the article, in various formats.
Downloads (link to download the article as PDF)
Open citations (links to open the citations from this article in various online reference manager services)
Cite this article (links to download the citations from this article in formats compatible with various reference manager tools)
ahctf1 and kras mutations combine to amplify oncogenic stress and restrict liver overgrowth in a zebrafish model of hepatocellular carcinoma
eLife 12:e73407.
https://doi.org/10.7554/eLife.73407


