Distinct and diverse chromatin proteomes of ageing mouse organs reveal protein signatures that correlate with physiological functions
- Department of Biochemistry & Molecular Biology and VILLUM Center for Bioanalytical Sciences. University of Southern Denmark, Denmark
Figures
Figure 1 with 2 supplements
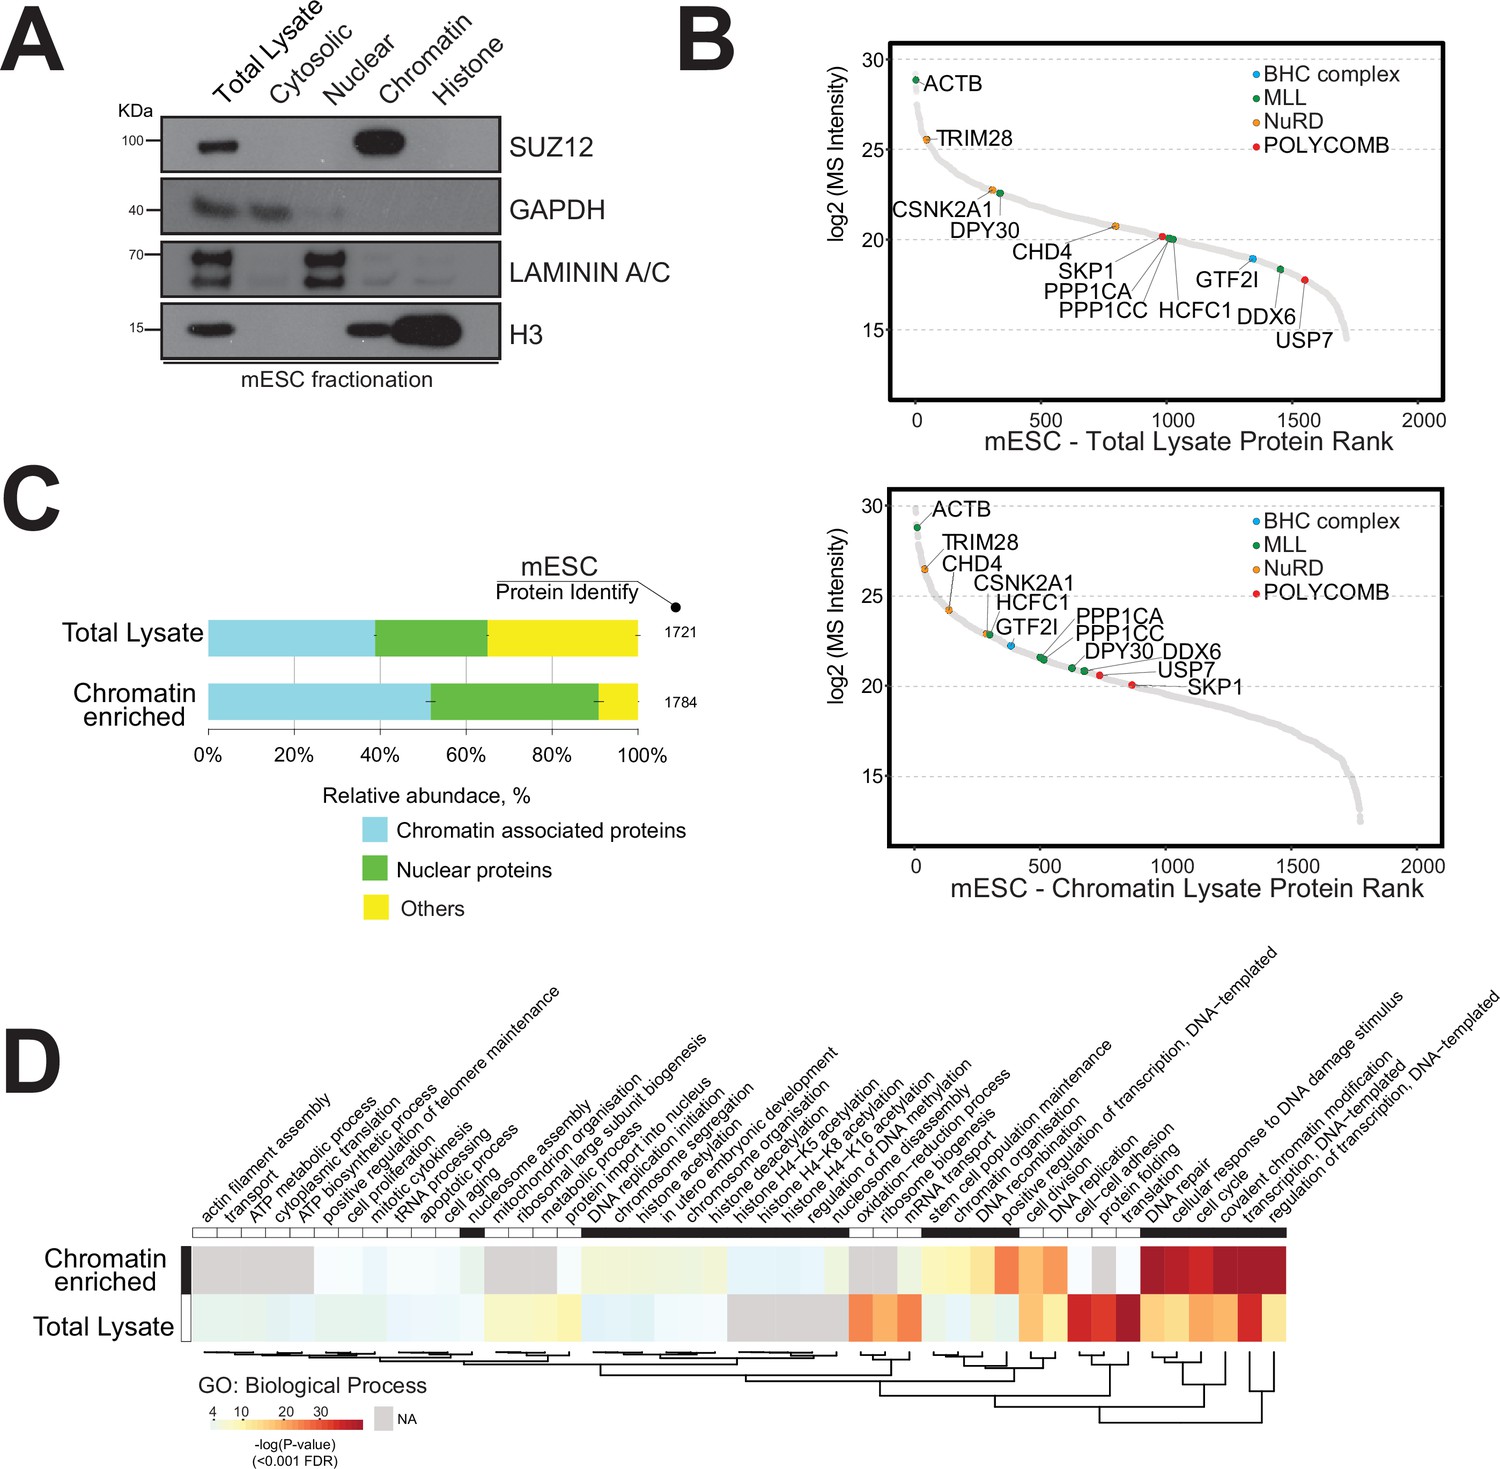
Strategy for the enrichment of chromatin-associated proteins in mouse embryonic stem cells.
(A) Western blot analysis of mouse embryonic cell fractionation. The cytoplasmic, nuclei, chromatin, and histone compartments are probed (respectively) by GAPDH, Laminin A/C, SUZ12, and H3 antibodies. (B) Dynamic range plot of mouse embryonic cell fractionation. Epigenetic enzyme subunits associated with chromatin remodelling complexes are listed and sorted by their abundance (Log2 MS intensity) for the two datasets: chromatin proteome lysate and whole-cell lysate. (C) Evaluation of the enrichment of chromatin-associated proteins in mouse embryonic cell fractions. The proportion of chromatin-associated and nuclear proteins in each organ is shown. Blue, chromatin-associated protein; green, nuclear proteins; yellow, protein associated with other cellular components. The relative abundances were determined based on the total ion current. The obtained quantitative results were used to calculate the relative abundances of distinct chromatin-associated and nuclear proteins corresponding to each cell compartment, where the sum of all total ion current intensities was considered as 100%. (D) Hierarchical clustering heatmap of mouse embryonic cell fractionation. Chromatin fractionation and total lysate proteomes are compared. Significantly enriched Gene Ontology (GO) term biological processes (BP) associated with nuclear and chromatin environments are enriched in the chromatin fraction lysate.
-
Figure 1—source data 1
Western blot data.
- https://cdn.elifesciences.org/articles/73524/elife-73524-fig1-data1-v2.pdf
Figure 1—figure supplement 1
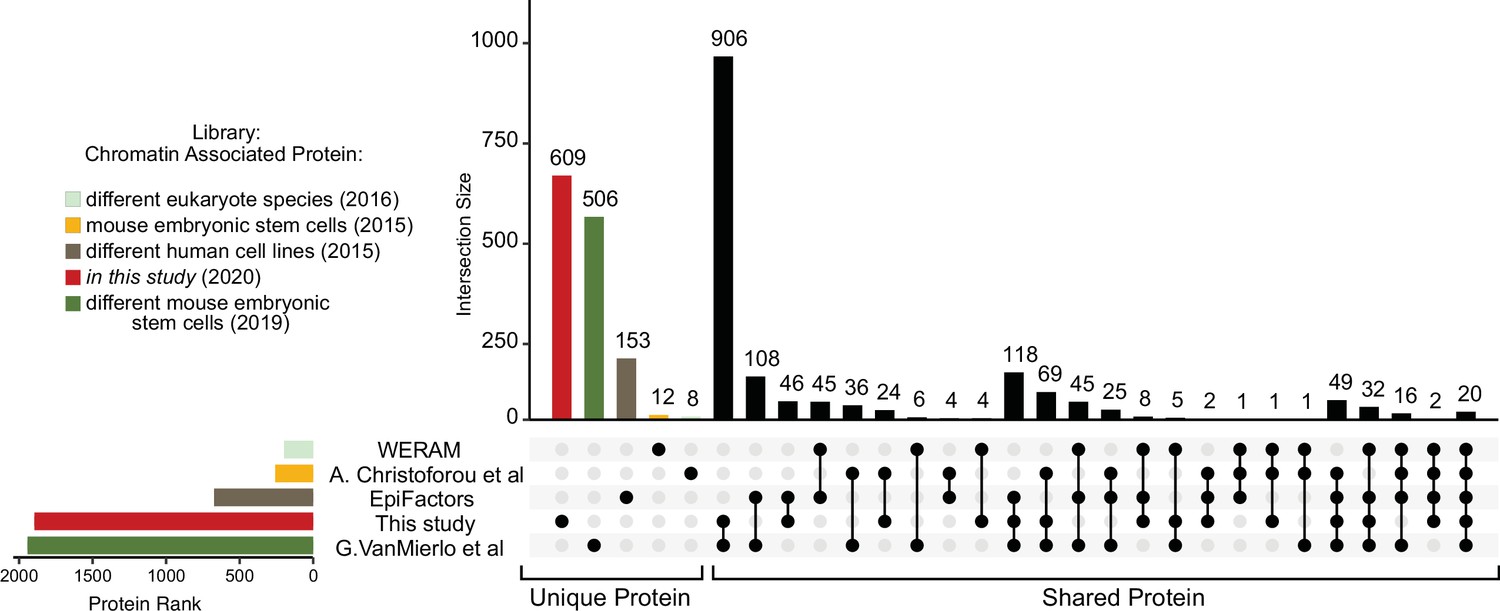
Comparison of annotated chromatin‐associated proteins from recently deposited proteomics data libraries of chromatin studies.
UpSet plot measurement of the number of chromatin-associated proteins detected in different studies (Medvedeva et al., 2015; van Mierlo et al., 2019; Christoforou et al., 2016; Xu et al., 2016). Unique proteins related to their sources are highlighted by colours while the multiple intersection nodes highlighted in black display shared proteins between organs.
Figure 1—figure supplement 2
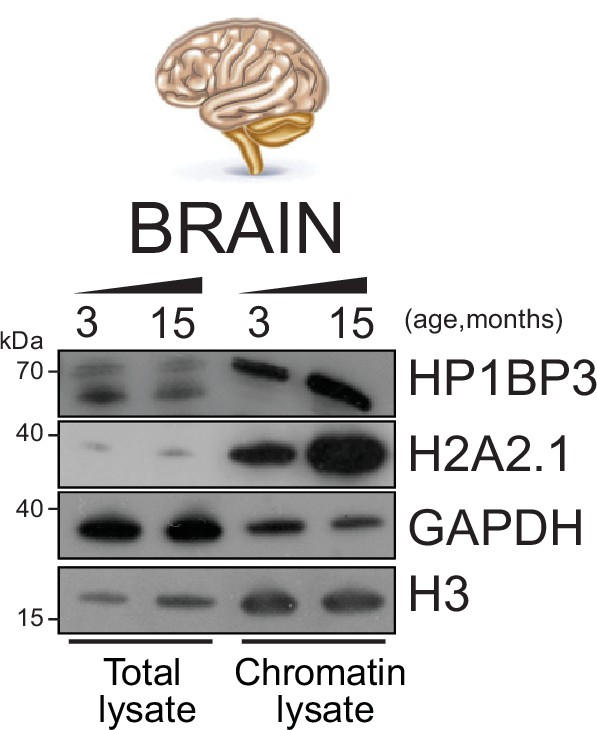
Evaluation of the enrichment of chromatin-associated proteins in mouse organs.
Brain organ fractionation was assayed by Western blot demonstrating the separation between nuclear and chromatin fraction in mouse brain. The heterochromatin marker HP1BP3 and histone H2A variant H2A2.1 were enriched in the chromatin lysate. The GAPDH and H3 antibodies were used as control, respectively, for the whole-cell lysate and the chromatin fractions.
-
Figure 1—figure supplement 2—source data 1
Western blot results (original scans).
- https://cdn.elifesciences.org/articles/73524/elife-73524-fig1-figsupp2-data1-v2.pdf
Figure 2
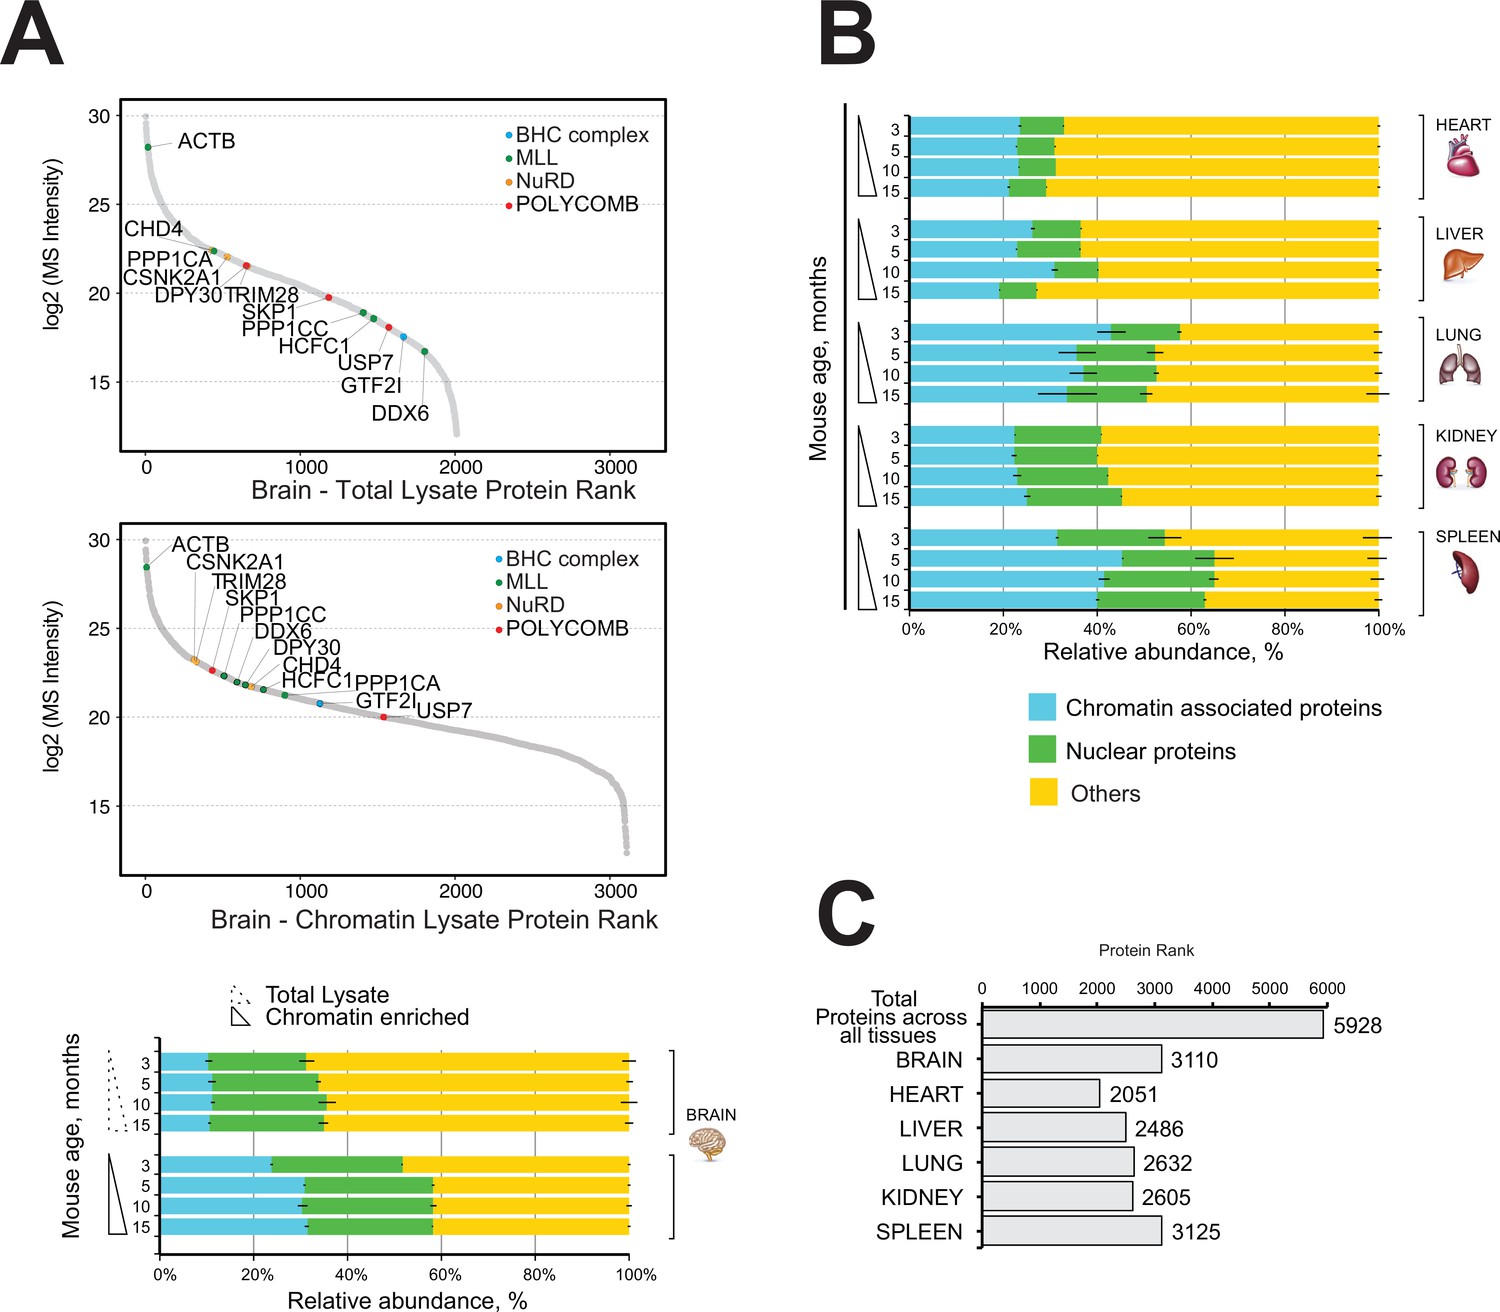
Comparative and quantitative proteomics of chromatin proteins in mouse organs.
(A) High-resolution LC-MS/MS brain proteomics during mouse lifespan. Dynamic range plot of the brain tissue fractionation obtained from a mouse. Chromatin lysate and whole total lysate proteomes are compared. Epigenetic subunits associated with chromatin remodelling complexes are listed and sorted by specific abundance (Log2 MS Intensity) in both proteomics datasets. Blue, chromatin-associated protein; green, nuclear proteins; yellow, protein associated with other cellular components. The continuous line box indicates the total lysate proteome, and the dashed line box indicates the chromatin fractions proteome. (B) High-resolution LC-MS/MS chromatin proteome harvested from 3-, 5-, 10-, and 15-month-old mice. Evaluation of the amount of chromatin-associated proteins and nuclear protein among different organs (heart, liver, lung, kidney, and spleen). The relative abundances were quantified based on the total ion current. The obtained quantitative results were used to calculate the relative abundances of distinct chromatin-associated and nuclear proteins in each organ, where the sum of all total ion current intensities was considered as 100%. Blue, chromatin-associated protein; green, nuclear proteins; yellow, protein associated with other cellular components. The continuous line box indicates total lysate proteome, and the dashed line box indicates the chromatin fractions proteome. (C) Histogram showing the number of proteins identified across six mouse organs over time.
Figure 3 with 1 supplement

Chromatin proteomics by high mass resolution mass spectrometry demonstrated distinct organ ageing profiles.
(A) Principal component analysis (PCA) of the proteomics datasets. Each data point represents a single replicate (n = 3). Colour subgroups represent each mouse lifespan point, being 3, 5, 10, and 15 months, respectively. The grey-coloured square behind each replicate highlights a distinct separation between each organ during the mouse lifespan. (B) Pearson correlation coefficient showing the relationship between the different enriched chromatin proteome organs and ageing. The positive correlation coefficient is displayed in red, and reduced values are shown in bright blue and white.
Figure 3—figure supplement 1
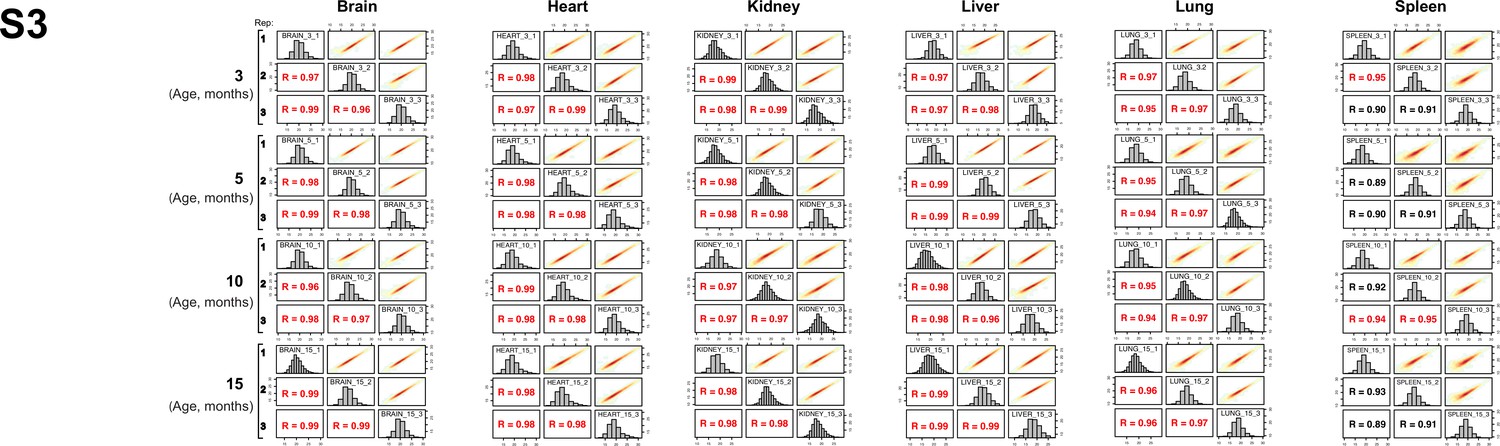
Evaluation of robustness and reproducibility of quantitative proteomics LC-MS/MS strategy.
The biological reproducibility of each organ proteome over time is displayed as a scatter plot and measured by the Pearson correlation coefficient. Red dots indicate high reproducibility, and blue dots indicate low reproducibility.
Figure 4

Functional proteome analysis of common and distinct organ ageing profiles during the mouse lifespan.
(A) Overlap of proteome data sets across six mouse organs using an UpSet plot. The number of common (orange) and unique (red) organ-specific proteins detected is shown, while various inter-organ combinations are displayed in black. In the bottom of the panel, the proportion of chromatin-associated proteins and nuclear proteins present for the ‘core’ proteome and the unique organ-specific profile is shown. The relative abundances were quantified based on the total ion current. The obtained quantitative results were used to calculate the relative abundances of distinct chromatin-associated and nuclear proteins in each organ, where the sum of all total ion current intensities was considered as 100%. Blue, chromatin-associated protein; green, nuclear proteins; yellow, protein associated with other cellular components. (B) Gene Ontology (GO) analysis (biological processes) of the core proteome (863) was performed by DAVID GO analysis. The right panel indicates the most significant GO term categories. The left panel shows multi sub-annotations corresponding to each category. Dot size represents the logarithm of the p-value assigned to the detected category, while dot colour represents the number of proteins in the pathway. (C) GO analysis (biological processes) of the unique proteins present in each organ proteome. The dot size represents the significant p-value assigned to the detected category, while the dot colour represents the number of proteins corresponding to the source pathway.
Figure 5 with 2 supplements
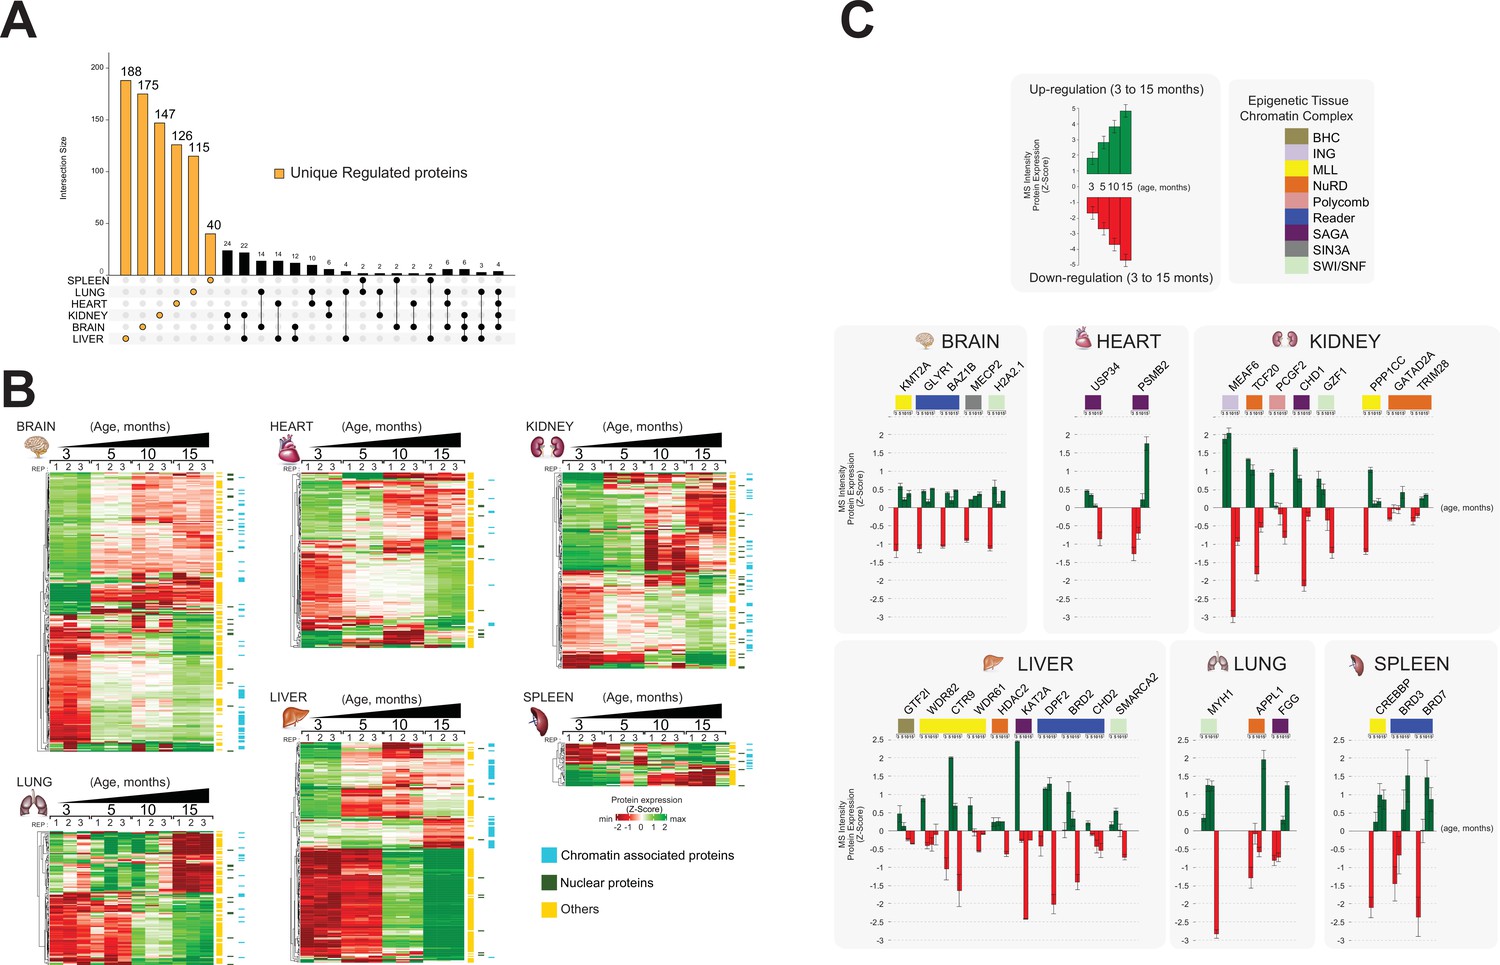
Identification of unique protein abundance changes in organ proteome profiles during ageing.
(A) UpSet plot measurement of the amount of nuclear and relative chromatin-associated proteins differentially expressed during the mouse lifespan across all organs. Unique chromatin-associated proteins related to their organ sources are highlighted by an orange bar. The multiple intersection nodes highlighted in black display shared proteins between organs. (B) Hierarchical clustering heatmap of the ‘unique differentially expressed protein’ related to each organ among the early (3 months) and the late (15 months) ageing stages. Green and red represent increased and decreased expression (respectively) during the mouse lifespan. Blue, chromatin-associated protein; green, nuclear proteins; yellow, protein associated with other cellular components. (C) Extrapolation of the quantitative expression profile of epigenetic subunits associated with chromatin remodelling complexes. Green and red represent increased and decreased expression (respectively) during the mouse lifespan.
Figure 5—figure supplement 1
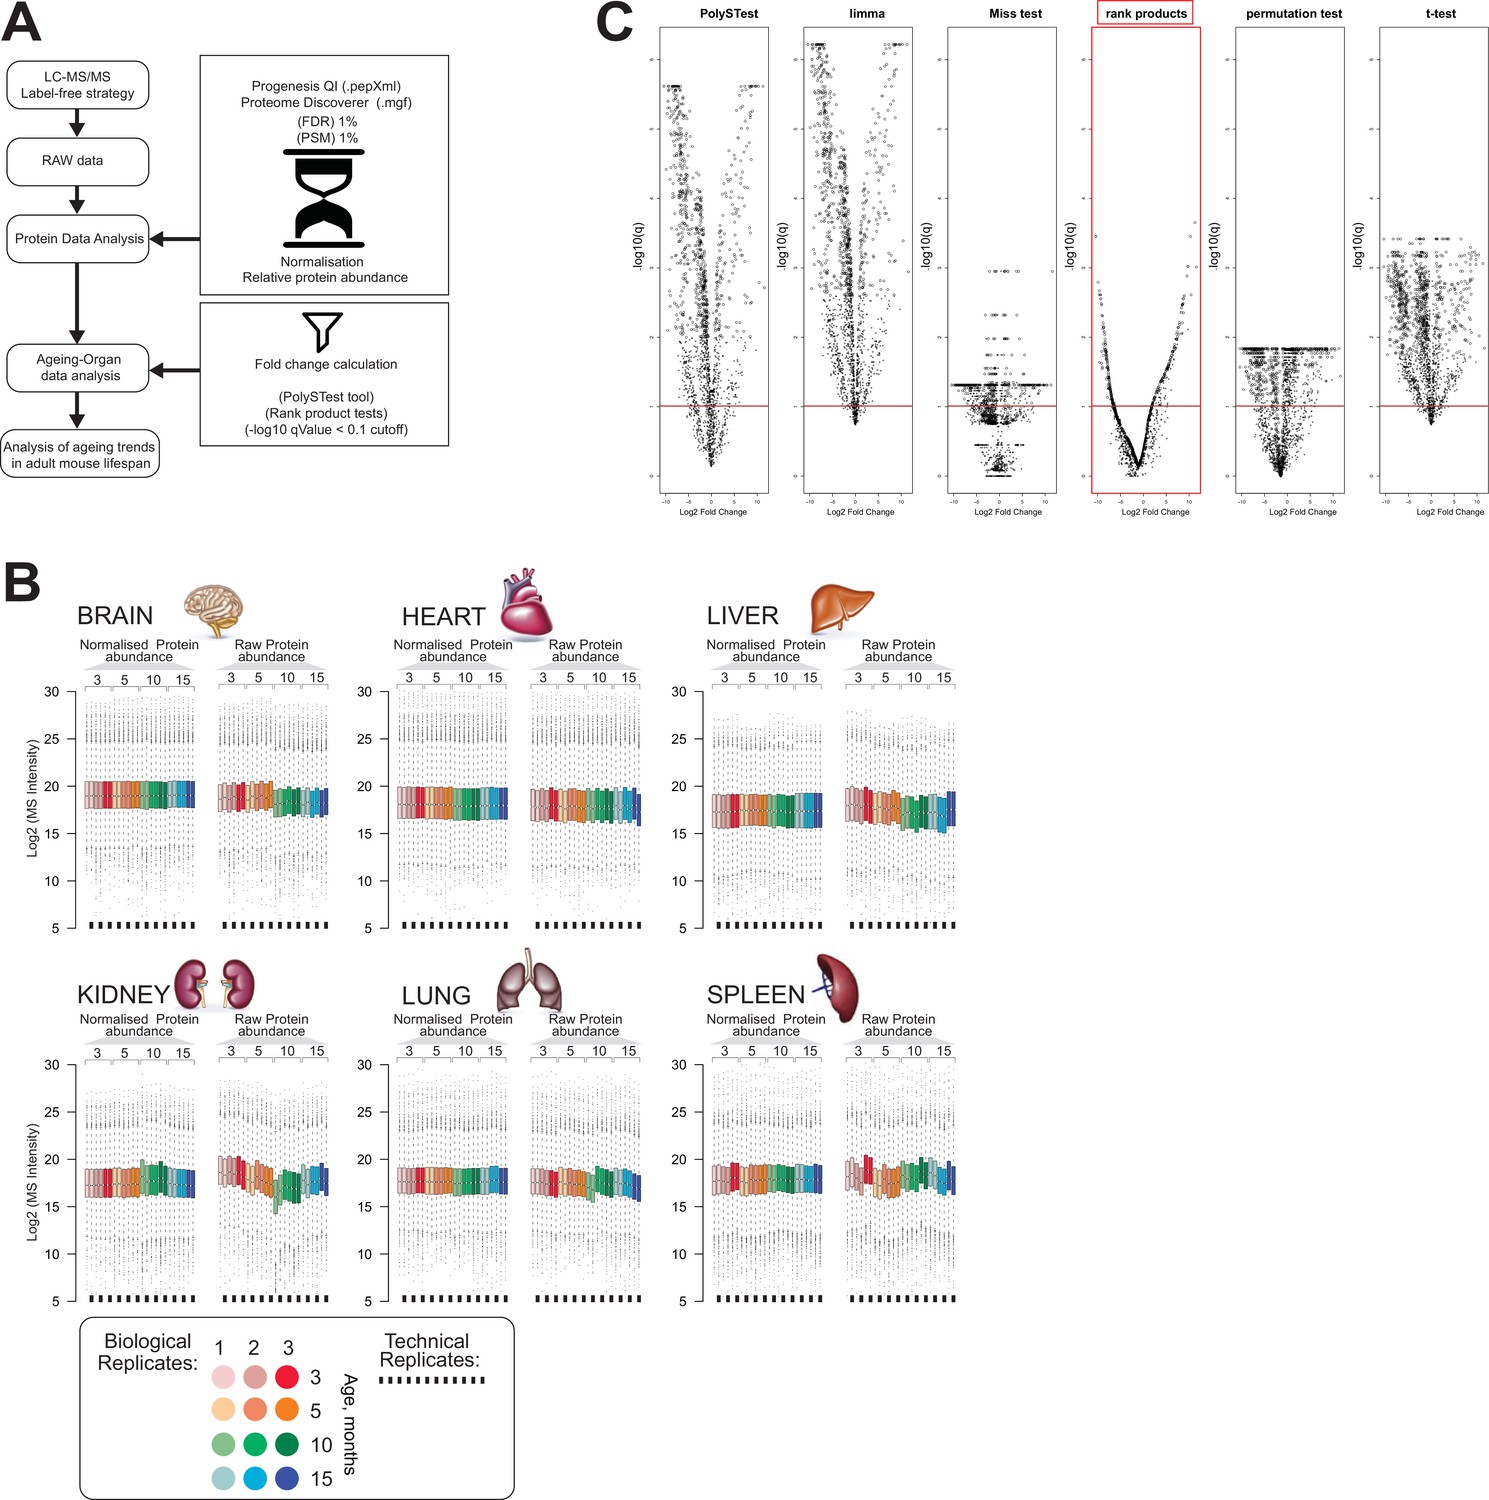
Evaluation of protein expression changes in mouse organs during ageing.
(A) Workflow of the proteome data analysis. (B) Box plots of protein expression profile before and after normalisation across six organs (brain, heart, kidney, lung, liver, and spleen) over time. Colour subgroups represent each mouse adult lifespan point, being 3, 5, 10, and 15 months, respectively. The square black line underneath each box plot represents a technical replicate of each biological set. (C) Volcano plots of differentially regulated proteins in mouse brain using the PolySTest statistical analysis tool. Specific enrichments for each protein were calculated by Rack test. Adjusted q-values were calculated to correct for multiple testing (-log10 q-value <0.1 cutoff).
Figure 5—figure supplement 2
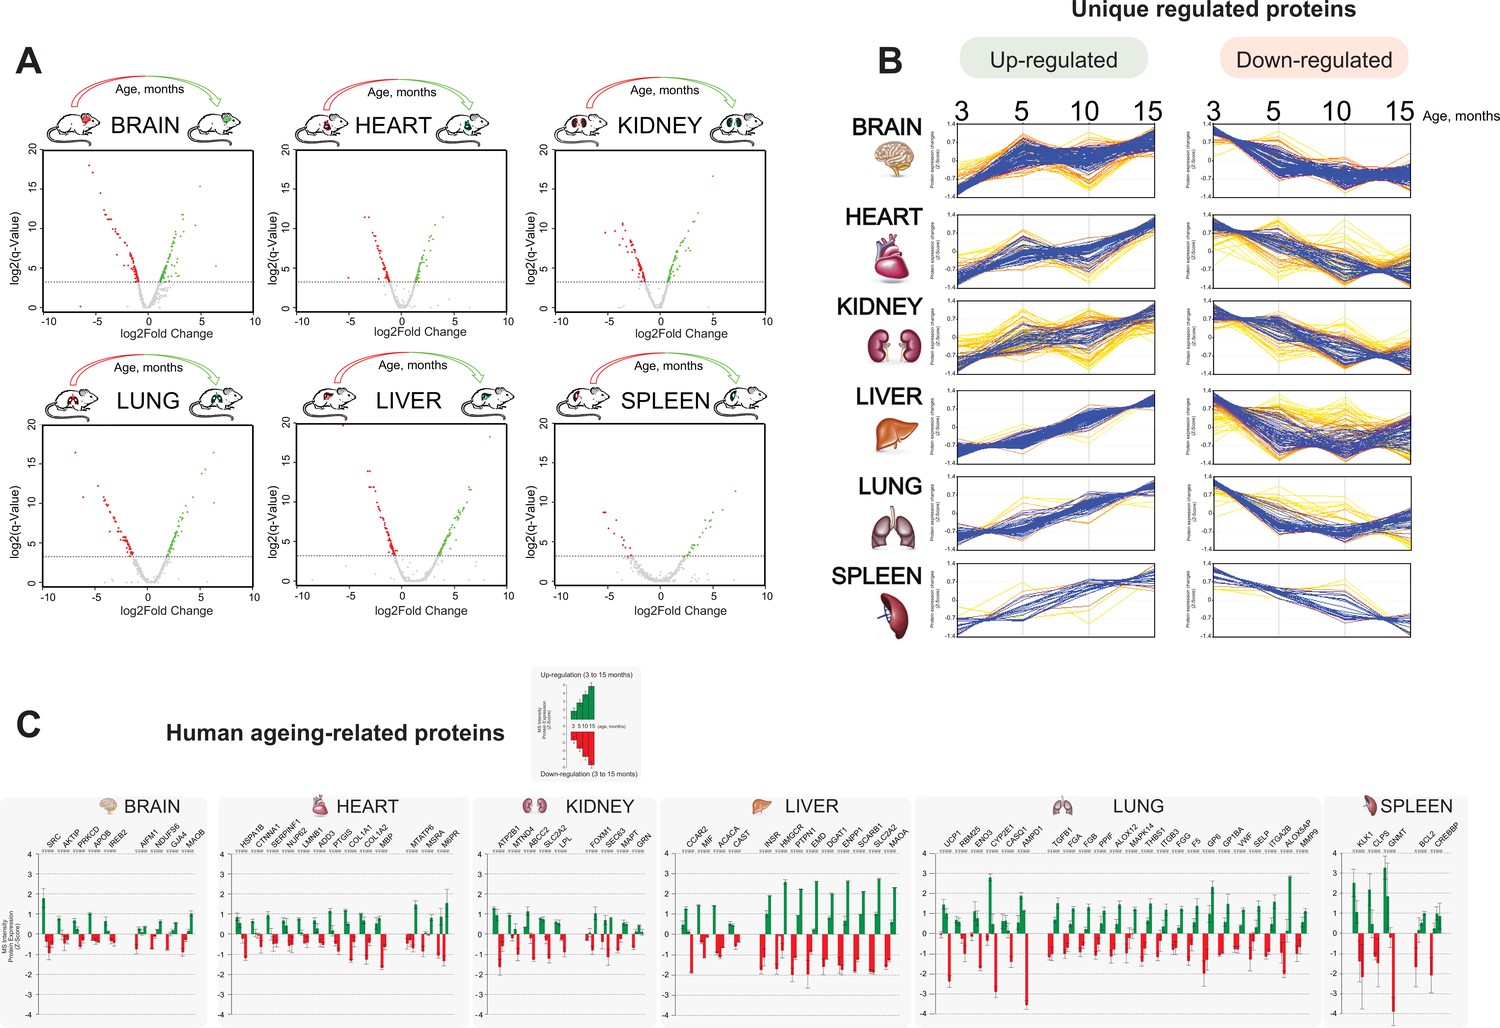
Distinct organ ageing profiles are defined by unique differential protein expression.
(A) Volcano plots of differentially regulated proteins across six organs (brain, heart, kidney, lung, liver, and spleen) between the early (3 months) and the late (15 months) adult mouse lifespan. Expressed protein significantly changed highlighted in red and green show respectively downregulation and upregulation during the mouse lifespan. Specific enrichments for each protein were calculated by Rack test. Adjusted q-values were calculated to correct for multiple testing (-log10 q-value <0.1 cutoff) (B) Co-expression cluster profile, extrapolated from the hierarchical clustering heatmap, shows the ‘unique differentially expressed protein’ trend changed over time in each organ.(C) Metadata analysis reported the quantitative changed expression profile of human ageing biomarker candidates obtained from the ‘Human Ageing Genomic Resources’ and ‘GenAge machine learning databank’.
Figure 6

Identification of differentially regulated organ-specific profiles that map to ageing, epigenetic processes, and other biochemical processes.
Dot plot of functional annotation Gene Ontology (GO) analysis of the biological processes (BP) showing the enrichment pathway terms among ageing. GO categories are sorted by four group labels: gene expression, ageing/development, cellular metabolic process, and structure organisation and biogenesis. The left panel indicates the significant top 30 annotation categories shared between all organs and changing during the mouse lifespan. The centre panel shows the distinctive ageing pathway related to their organ sources. The right panel shows the enrichment pathway terms that changed during ageing among all organs. Red and green highlights represent the protein downregulation and upregulation between early (3 months) and late (15 months) ageing stages. The dot colour represents the significant p-value of the pathway.
Figure 7
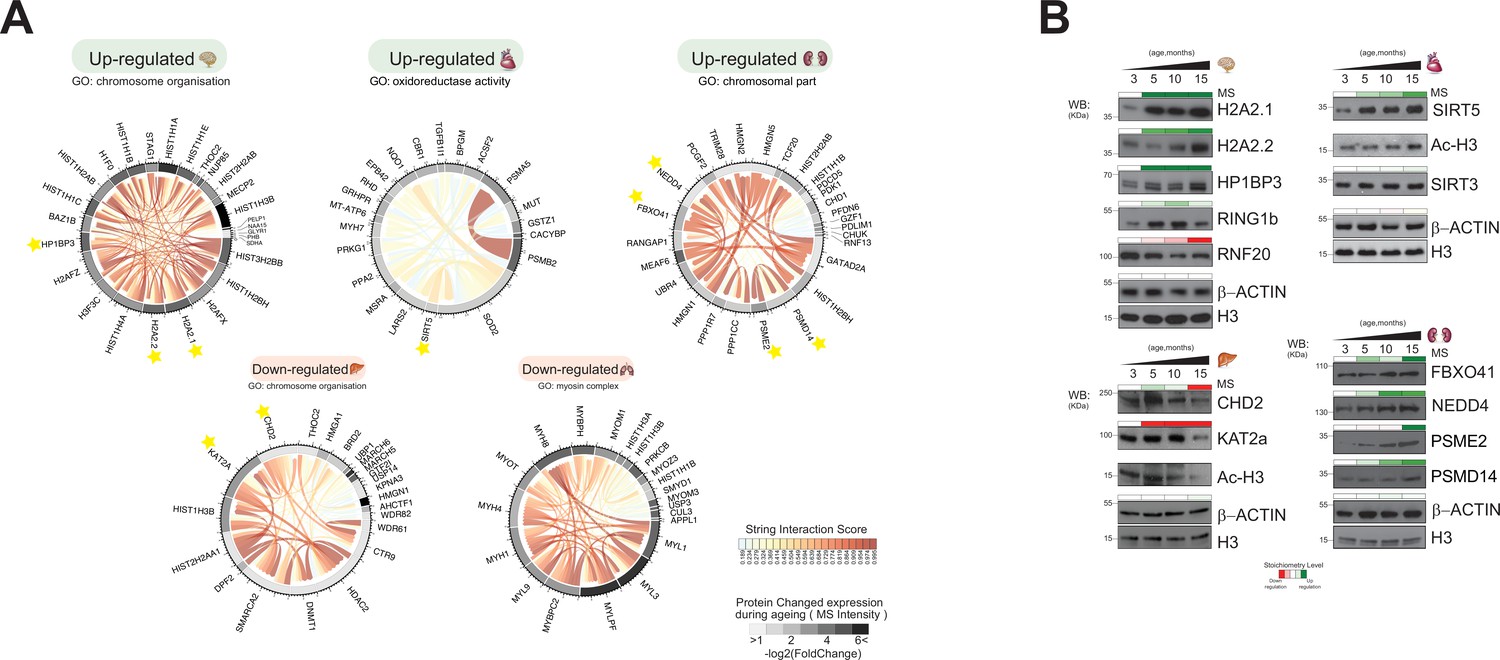
Distinct organ ageing profiles are defined by unique chromatin-associated proteins.
(A) Protein interaction modules (obtained from the STRING database) are shown for Gene Ontology categories found to be significantly up- or downregulated in five organs. Each chord corresponds to a protein-protein interaction while the STRING interaction score is indicated by colour (red for high confidence). The quantitative differential protein expression during the mouse lifespan between 3 and 15 months is shown on the outer circle on a grey-black intensity scale. (B) Biochemical validation of four protein module responses to ageing identified using chromatin-associated proteomics. Organ lysates (from the brain, heart, liver, and kidney) were immunoblotted with the indicated antibodies. The bar above the blots corresponds to the quantitative protein expression levels determined in our proteomics experiments over time (green/red scale up- or downregulated, respectively).
-
Figure 7—source data 1
Original Western blotting data.
- https://cdn.elifesciences.org/articles/73524/elife-73524-fig7-data1-v2.pdf
-
Figure 7—source data 2
Original Western blotting data.
- https://cdn.elifesciences.org/articles/73524/elife-73524-fig7-data2-v2.pdf
-
Figure 7—source data 3
Original Western blotting data.
- https://cdn.elifesciences.org/articles/73524/elife-73524-fig7-data3-v2.pdf
-
Figure 7—source data 4
Original Western blotting data.
- https://cdn.elifesciences.org/articles/73524/elife-73524-fig7-data4-v2.pdf
Tables
Table 1
Number of chromatin enzymes detected in mouse embryonic stem cell (mESC).
| Chromatin remodelling complex | Whole-cell lysate | Chromatin-enriched lysate |
|---|---|---|
| BHC | 2 | 6 |
| CCR4-NOT | 2 | 6 |
| ING | 1 | 15 |
| INO80 | 2 | 9 |
| MEDIATOR | 8 | 20 |
| MLL | 15 | 56 |
| NUA4HAT | 17 | 8 |
| NURD | 2 | 35 |
| NURF | 10 | 2 |
| ORC | 1 | 30 |
| POLYCOMB | 7 | 30 |
| READER | 8 | 33 |
| SAGA | 8 | 8 |
| SET1 | 3 | 6 |
| SIN3A | 1 | 26 |
| SWI/SNF | 5 | 43 |
| Other chromatin enzymes | 10 | 80 |
Table 2
Number of proteins detected across six mouse organs over four time points and their annotated subcellular location.
Detected number of unique proteins across all organs are shown for each subcellular location.
| Chromatin proteomes during the mouse lifespan | |||||||
|---|---|---|---|---|---|---|---|
| Organ | Brain | Heart | Liver | Kidney | Lung | Spleen | Unique proteins across all organs |
| Chromatin | 936 | 457 | 648 | 714 | 713 | 1113 | 1542 |
| Nuclear | 615 | 323 | 355 | 426 | 442 | 556 | 930 |
| Other | 1559 | 1272 | 1483 | 1465 | 1477 | 1457 | 3456 |
Table 3
‘Core’ proteins shared in all six mouse organs over time sorted to their cell compartments.
| Chromatin proteome during the mouse lifespan | ||||||||
|---|---|---|---|---|---|---|---|---|
| Shared proteins | Unique proteins | |||||||
| Core | Brain | Heart | Liver | Kidney | Lung | Spleen | ||
| Chromatin | 289 | 119 | 18 | 27 | 22 | 17 | 242 | |
| Nuclear | 157 | 69 | 21 | 33 | 16 | 15 | 54 | |
| Other | 417 | 605 | 175 | 329 | 196 | 211 | 286 | |
| Total | 863 | 793 | 214 | 389 | 234 | 243 | 582 | |
Key resources table
| Reagent type (species) or resource | Designation | Source or reference | Identifiers | Additional information |
|---|---|---|---|---|
| Antibody | HRP goat anti- mouse(mouse polyclonal) | Merck | Cat# 401253;RRID:AB_437779 | WB (1:10,000) |
| Antibody | HRP goat anti-rabbit(rabbit polyclonal) | Sigma | Cat# A0545;RRID:AB_257896 | WB (1:10,000) |
| Antibody | HRP anti-guinea pig (guinea pig polyclonal) | Gift from Benny Garfinkel | WB (1:10,000) | |
| Antibody | Anti-SIRT3(rabbit monoclonal) | Cell Signaling Technology | Cat# 2627S;RRID:AB_2188622 | WB (1:1000) |
| Antibody | Anti-NEDD4 (rabbit polyclonal) | Cell Signaling Technology | Cat# 2740S;RRID:AB_2149312 | WB (1:500) |
| Antibody | Anti-PSME2 (rabbit polyclonal) | Cell Signaling Technology | Cat# 2409S;RRID:AB_2171085 | WB (1:500) |
| Antibody | Anti-SIRT5 (rabbit monoclonal) | Cell Signaling Technology | Cat# 8782S;RRID:AB_2716763 | WB (1:1000) |
| Antibody | Anti-CHD2 (rabbit polyclonal) | Cell Signaling Technology | Cat# 4170S;RRID:AB_10621947 | WB (1:500) |
| Antibody | Anti-KAT2A/GCN5 (rabbit monoclonal) | Cell Signaling Technology | Cat# 3305;RRID:AB_2128281 | WB (1:500) |
| Antibody | Anti-PSMD14 (rabbit monoclonal) | Cell Signaling Technology | Cat# 4197S;RRID:AB_11178935 | WB (1:1000) |
| Antibody | Anti-RING1B/RNF2 (rabbit monoclonal) | Cell Signaling Technology | Cat# 5694P;RRID:AB_10705604 | WB (1:500) |
| Antibody | Anti-H3 (rabbit polyclonal) | Abcam | Cat# ab1791;RRID:AB_302613 | WB (1:20,000) |
| Antibody | Anti-macroH2A.1 (rabbit polyclonal) | Abcam | Cat# ab37264;RRID:AB_883064 | WB (1:1000) |
| Antibody | Anti-macroH2A2.2 (rabbit polyclonal) | Abcam | Cat# ab4173;RRID:AB_2115110 | WB (1:1000) |
| Antibody | Anti-RNF20 (rabbit polyclonal) | Cell Signaling Technology | Cat# 9425S;RRID:AB_2797700 | WB (1:1000) |
| Antibody | Anti-H3acetyl (rabbit polyclonal antibody) | Active motif | Cat# 39139;RRID:AB_2687871 | WB (1:500) |
| Antibody | Anti-beta actin (mouse monoclonal) | Sigma | Cat# A5441; RRID:AB_476744 | WB (1:5000) |
| Antibody | Anti-FBX041 (rabbit polyclonal) | Protein Tech | Cat# 24519-1-AP; RRID:AB_2879586 | WB (1:500) |
| Antibody | Anti-HP1BP3(guinea pig polyclonal) | Gift from Benny Garfinkel | WB (1:2000) | |
| Software, algorithm | Xcalibur software | Thermo Scientific | RRID:SCR_014593 | |
| Software, algorithm | Progenesis QI v2.2 | Waters | RRID:SCR_018923 | |
| Software, algorithm | Proteome Discoverer v2.1.0.81 | Thermo Scientific | RRID:SCR_014477 | |
| Software, algorithm | PolySTest | RRID:SCR_021942 | http://computproteomics.bmb.sdu.dk:8192/app_direct/PolySTest/ |
Additional files
-
Supplementary file 1
Supplemental Table S1.
- https://cdn.elifesciences.org/articles/73524/elife-73524-supp1-v2.xlsx
-
Supplementary file 2
Supplemental Table S2.
- https://cdn.elifesciences.org/articles/73524/elife-73524-supp2-v2.xlsx
-
Supplementary file 3
Supplemental Table S3.
- https://cdn.elifesciences.org/articles/73524/elife-73524-supp3-v2.xlsx
-
Supplementary file 4
Supplemental Table S4.
- https://cdn.elifesciences.org/articles/73524/elife-73524-supp4-v2.xlsx
-
Supplementary file 5
Supplemental Table S5.
- https://cdn.elifesciences.org/articles/73524/elife-73524-supp5-v2.xlsx
-
Transparent reporting form
- https://cdn.elifesciences.org/articles/73524/elife-73524-transrepform1-v2.pdf
-
Source data 1
Raw and annotated Western blot images.
- https://cdn.elifesciences.org/articles/73524/elife-73524-data1-v2.zip
Download links
A two-part list of links to download the article, or parts of the article, in various formats.
Downloads (link to download the article as PDF)
Open citations (links to open the citations from this article in various online reference manager services)
Cite this article (links to download the citations from this article in formats compatible with various reference manager tools)
Distinct and diverse chromatin proteomes of ageing mouse organs reveal protein signatures that correlate with physiological functions
eLife 11:e73524.
https://doi.org/10.7554/eLife.73524


