Microtubule assembly by tau impairs endocytosis and neurotransmission via dynamin sequestration in Alzheimer’s disease synapse model
- Cellular and Molecular Synaptic Function Unit, Okinawa Institute of Science and Technology - Graduate University, Japan
- Faculty of Life and Medical Sciences, Doshisha University, Japan
- Institute of Science and Technology Austria (IST Austria), Austria
- Molecular Neuroscience Unit, Okinawa Institute of Science and Technology Graduate University, Japan
- Department of Neuroscience, Graduate school of Medicine, Dentistry and Pharmaceutical Sciences, Okayama University, Japan
Figures
Figure 1 with 1 supplement

Wild-type (WT) human tau (h-tau) loaded in presynaptic terminals inhibited excitatory synaptic transmission.
(A) In simultaneous pre- and postsynaptic whole-cell recordings, intra-terminal infusion of WT h-tau at 10 µM (blue filled circles) or 20 µM (black filled circles), from a tube in a presynaptic patch pipette (top illustration), caused a concentration-dependent rundown of EPSCs evoked by presynaptic action potentials at 1 Hz. In the time plots, EPSC amplitudes averaged from 60 events are sampled for data points and normalized to the mean amplitude of baseline EPSCs before h-tau infusion. Sample records of EPSCs 5 min before (i) and 30 min after (ii) tau infusion are superimposed and shown on the left panels. The EPSC amplitude remaining 30 min after infusion was 23% ± 9% and 65% ± 5%, respectively, for 10 and 20 µM h-tau (means and SEMs, 6 synapses from 6 slices, p < 0.01 in paired t-test between before and after h-tau infusion). Infusion of microtubule (MT)-binding site-deleted h-tau mutant (del-MTBD, 20 µM, Figure 1—figure supplement 1A) had no effect on the EPSC amplitude (open circles, sample EPSC traces shown on the left bottom panel). (B) The amplitude of EPSCs evoked at 0.1 Hz remained unchanged after h-tau infusion (85% ± 12%, 5 synapses from 5 slices, p = 0.22 in paired t-test). Sample records of EPSCs before (i) and 30 min after (ii) h-tau infusion at 0.1 Hz are superimposed on the left panel. (C) Taxol (1 µM) caused activity-dependent rundown of EPSC amplitude to 41.4% ± 12% at 1 Hz (p < 0.01, 5 synapses from 5 slices), but remained unchanged when stimulated at 0.1 Hz (105% ± 3.0%, open circles, 4 synapses from 4 slices). Sample records of EPSCS at 0.1 and 1 Hz are superimposed on the left panels.
-
Figure 1—source data 1
Wild-type (WT) h-tau loaded in presynaptic terminals inhibited excitatory synaptic transmission.
- https://cdn.elifesciences.org/articles/73542/elife-73542-fig1-data1-v2.xlsx
Figure 1—figure supplement 1
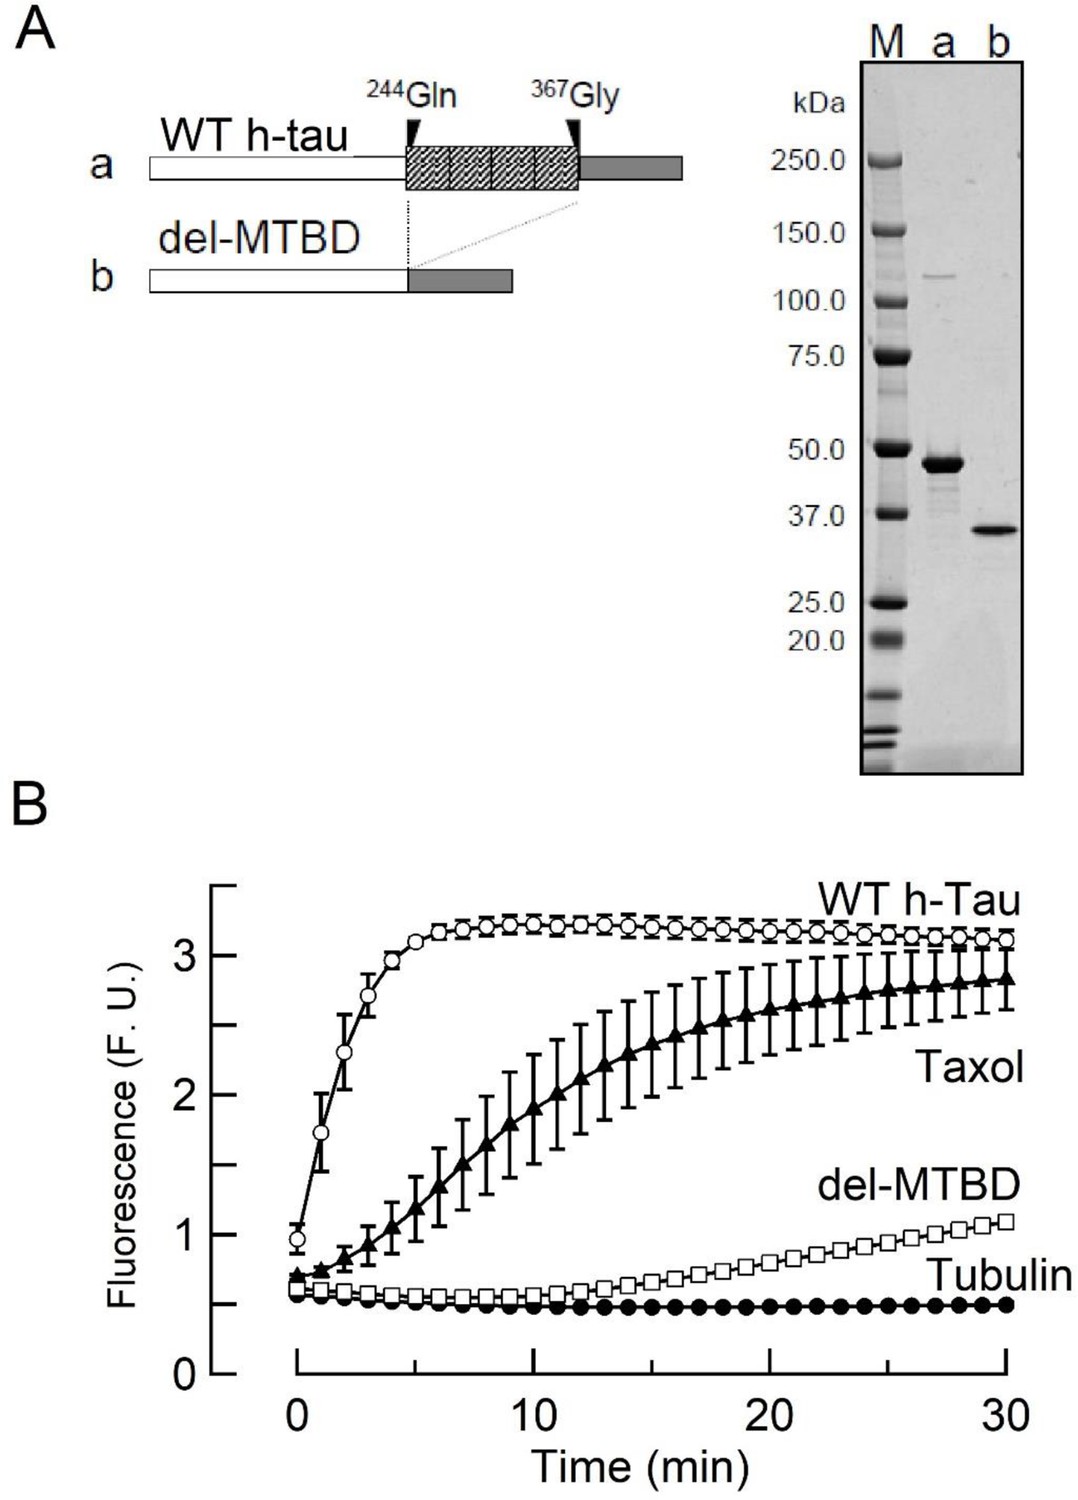
Tubulin polymerization assay for purified 0N4R wild-type (WT) human tau (h-tau) and microtubule (MT)-binding region-deleted mutant.
(A) Left panel, schematic drawings of WT 0N4R h-tau (a) and h-tau deletion mutant lacking the MT-binding region (del-MTBD) (b). Right panel, purified recombinant WT 0N4R h-tau (a) and del-MTBD (b) in SDS-PAGE with molecular markers (M) on the left lane. (B) In vitro tubulin polymerization assay, showing MT assembly by WT h-tau (10 µM, open circles) or taxol (1 µM, filled triangles), but not by del-MTBD (10 µM, open squares) or tubulin alone (filled circles). Data points and bars represent means and SEMs (n = 3).
-
Figure 1—figure supplement 1—source data 1
Raw SDS-PAGE gel data from Figure 1—figure supplement 1A.
- https://cdn.elifesciences.org/articles/73542/elife-73542-fig1-figsupp1-data1-v2.pptx
-
Figure 1—figure supplement 1—source data 2
Data from Figure 1—figure supplement 1B.
- https://cdn.elifesciences.org/articles/73542/elife-73542-fig1-figsupp1-data2-v2.xlsx
Figure 2
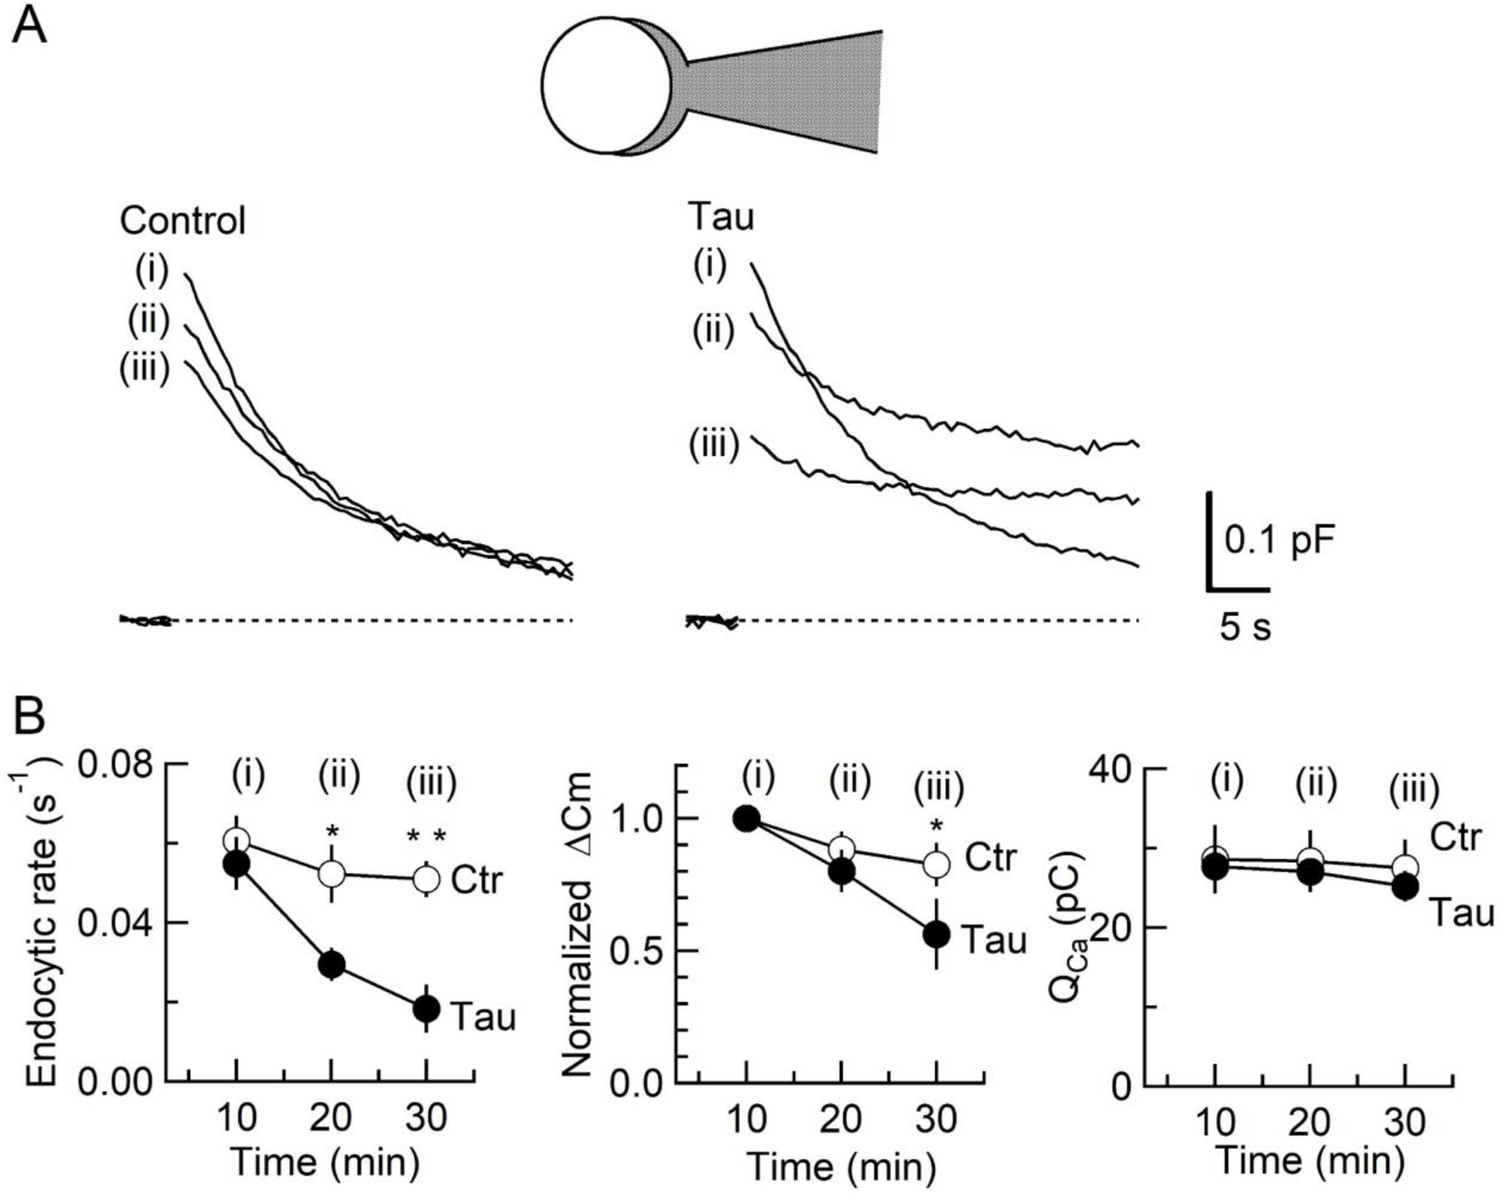
Inhibition of synaptic vesicle (SV) endocytosis is the primary effect of wild-type (WT) human tau (h-tau) loading.
(A) Exo-endocytic membrane capacitance changes in presynaptic terminals without (Control) or after direct loading of WT h-tau (20 µM; Tau). WT h-tau was directly loaded by diffusion into a terminal from a whole-cell patch pipette (illustration). Capacitance traces were sampled from (i) 10, (ii) 20, and (iii) 30 min after patch membrane rupture (superimposed). Left panel, non-loading control. Right panel, WT h-tau-loaded terminal. Capacitance changes were evoked every 2 min by Ca2+ currents induced by a 20 ms depolarizing pulse (not shown). (B) Time plots of endocytic rate (left panel), exocytic magnitude (middle panel), and presynaptic Ca2+ current charge (right panel). Data points represent averaged values from five events from 4 min before and 4 min after the time points. In calyceal terminals, 20 min after patch membrane rupture with a pipette containing WT h-tau (filled circles; Tau), endocytic rate was significantly prolonged (*p < 0.05 compared to controls, open circles, repeated-measures two-way ANOVA with post hoc Scheffe test, n = 5 from 5 slices), whereas exocytic magnitude remained similar to controls (p = 0.45). Thirty minutes after rupture, endocytic rate was further prolonged (**p < 0.01) and exocytic magnitude became significantly less than controls (*p < 0.05). Ca2+ current charge (QCa) remained unchanged throughout recording.
-
Figure 2—source data 1
Inhibition of synaptic vesicle (SV) endocytosis is the primary effect of wild-type (WT) human tau (h-tau) loading.
- https://cdn.elifesciences.org/articles/73542/elife-73542-fig2-data1-v2.xlsx
Figure 3
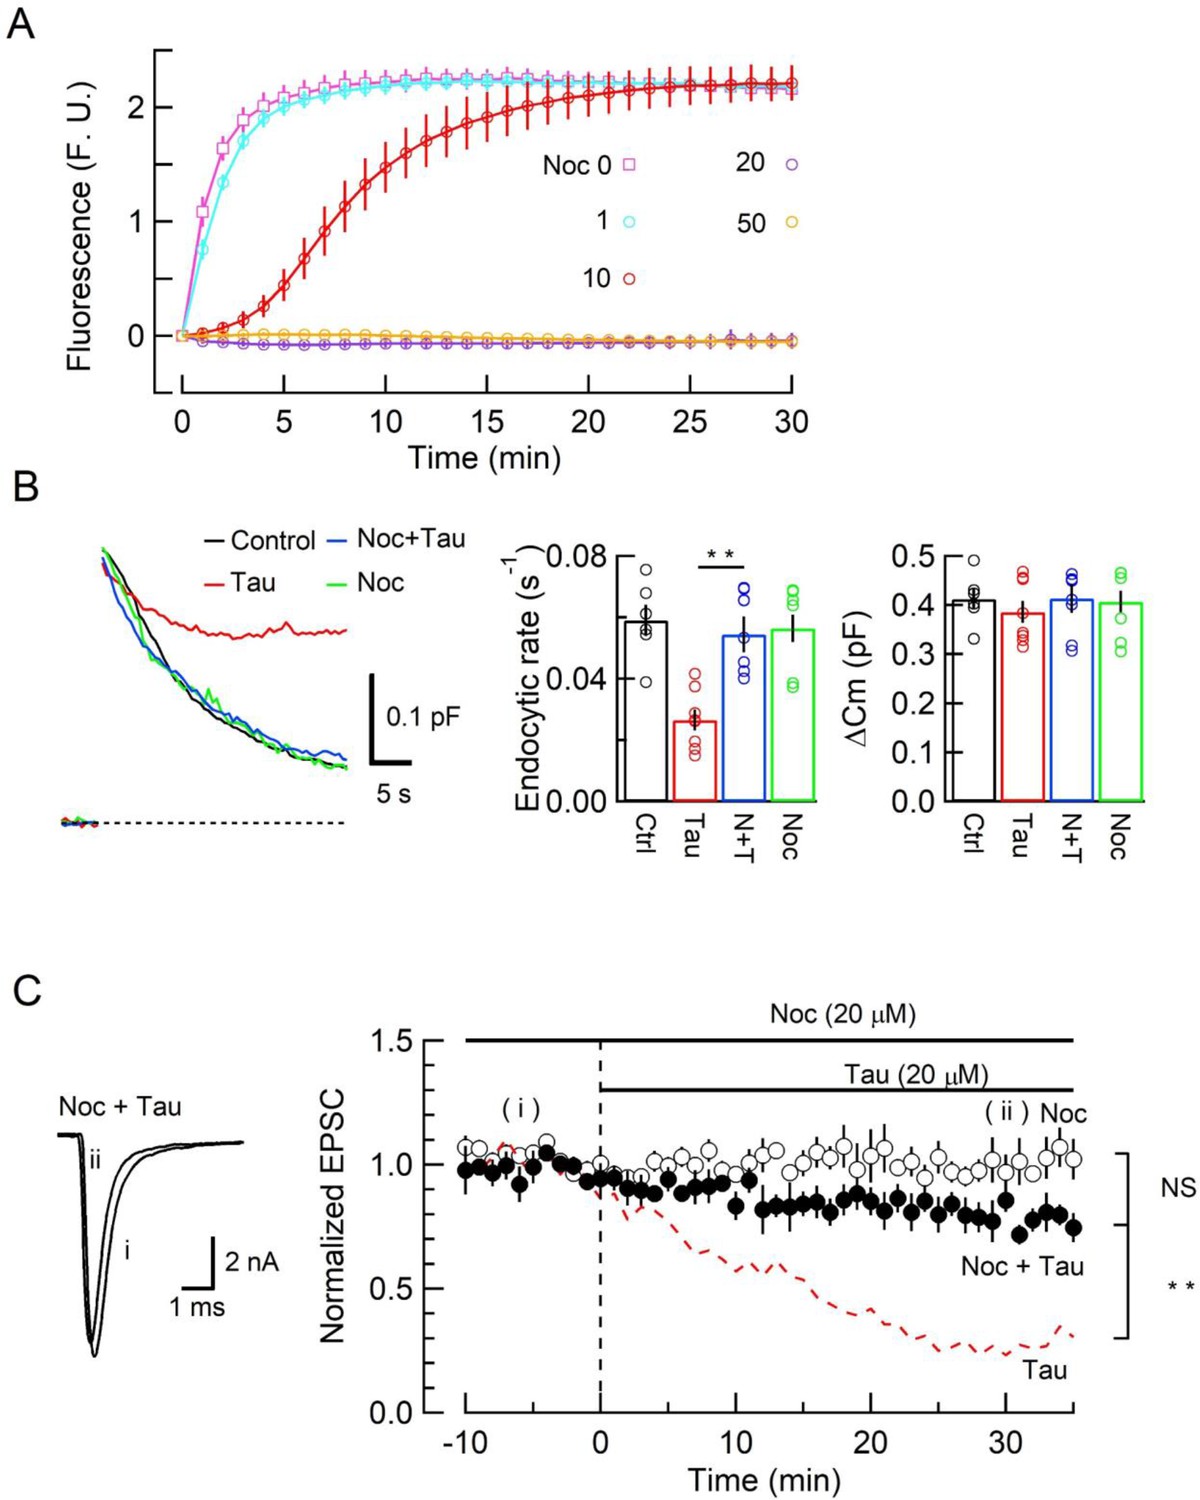
The microtubule (MT) assembly blocker nocodazole prevented tau-induced block of synaptic vesicle (SV) endocytosis and EPSC rundown.
(A) Concentration-dependent inhibitory effects of nocodazole on MT assembly in tubulin polymerization assay. MT assembly by 0N4R human tau (h-tau) (20 µM) in the absence (pink symbols and a fitting line) or presence of nocodazole at 1 µM (blue), 10 µM (red), 20 µM (purple), and 50 µM (orange). Data points and error bars in all graphs represent means and SEMs (n = 3). (B) Nocodazole prevented h-tau-induced block of SV endocytosis. Presynaptic membrane capacitance changes (superimposed traces) 25 min after loading h-tau alone (20 µM, red trace), h-tau and nocodazole (20 µM, blue), nocodazole alone (20 µM, green), and controls with no loading (black). Bar graphs indicate endocytic rates in non-loading controls (Ctr, black, 6 terminals from 6 slices), h-tau-loaded terminals (Tau, red, 8 terminals from 8 slices), co-loading of nocodazole with h-tau (N + T, blue, 7 terminals from 7 slices), and nocodazole alone (Noc, green, 8 terminals from 8 slices). Nocodazole co-loading fully prevented endocytic block by h-tau (**p < 0.01, between Tau and N-T) to control level (one-way ANOVA with Scheffe post hoc test). (C) Nocodazole prevented EPSC rundown caused by wild-type (WT) h-tau. Nocodazole (20 µM) co-loaded with WT h-tau (20 µM) prevented EPSC rundown (filled circles, 4 synapses from 4 slices, **p < 0.01, unpaired t-test). Data of WT h-tau effect on EPSCs (Figure 1A) is shown as a red dashed line for comparison. Nocodazole alone (20 µM) had no effect on EPSC amplitude throughout (open circles, 4 synapses from 4 slices).
-
Figure 3—source data 1
The microtubule (MT) assembly blocker nocodazole prevented tau-induced block of synaptic vesicle (SV) endocytosis and EPSC rundown.
- https://cdn.elifesciences.org/articles/73542/elife-73542-fig3-data1-v2.xlsx
Figure 4 with 2 supplements
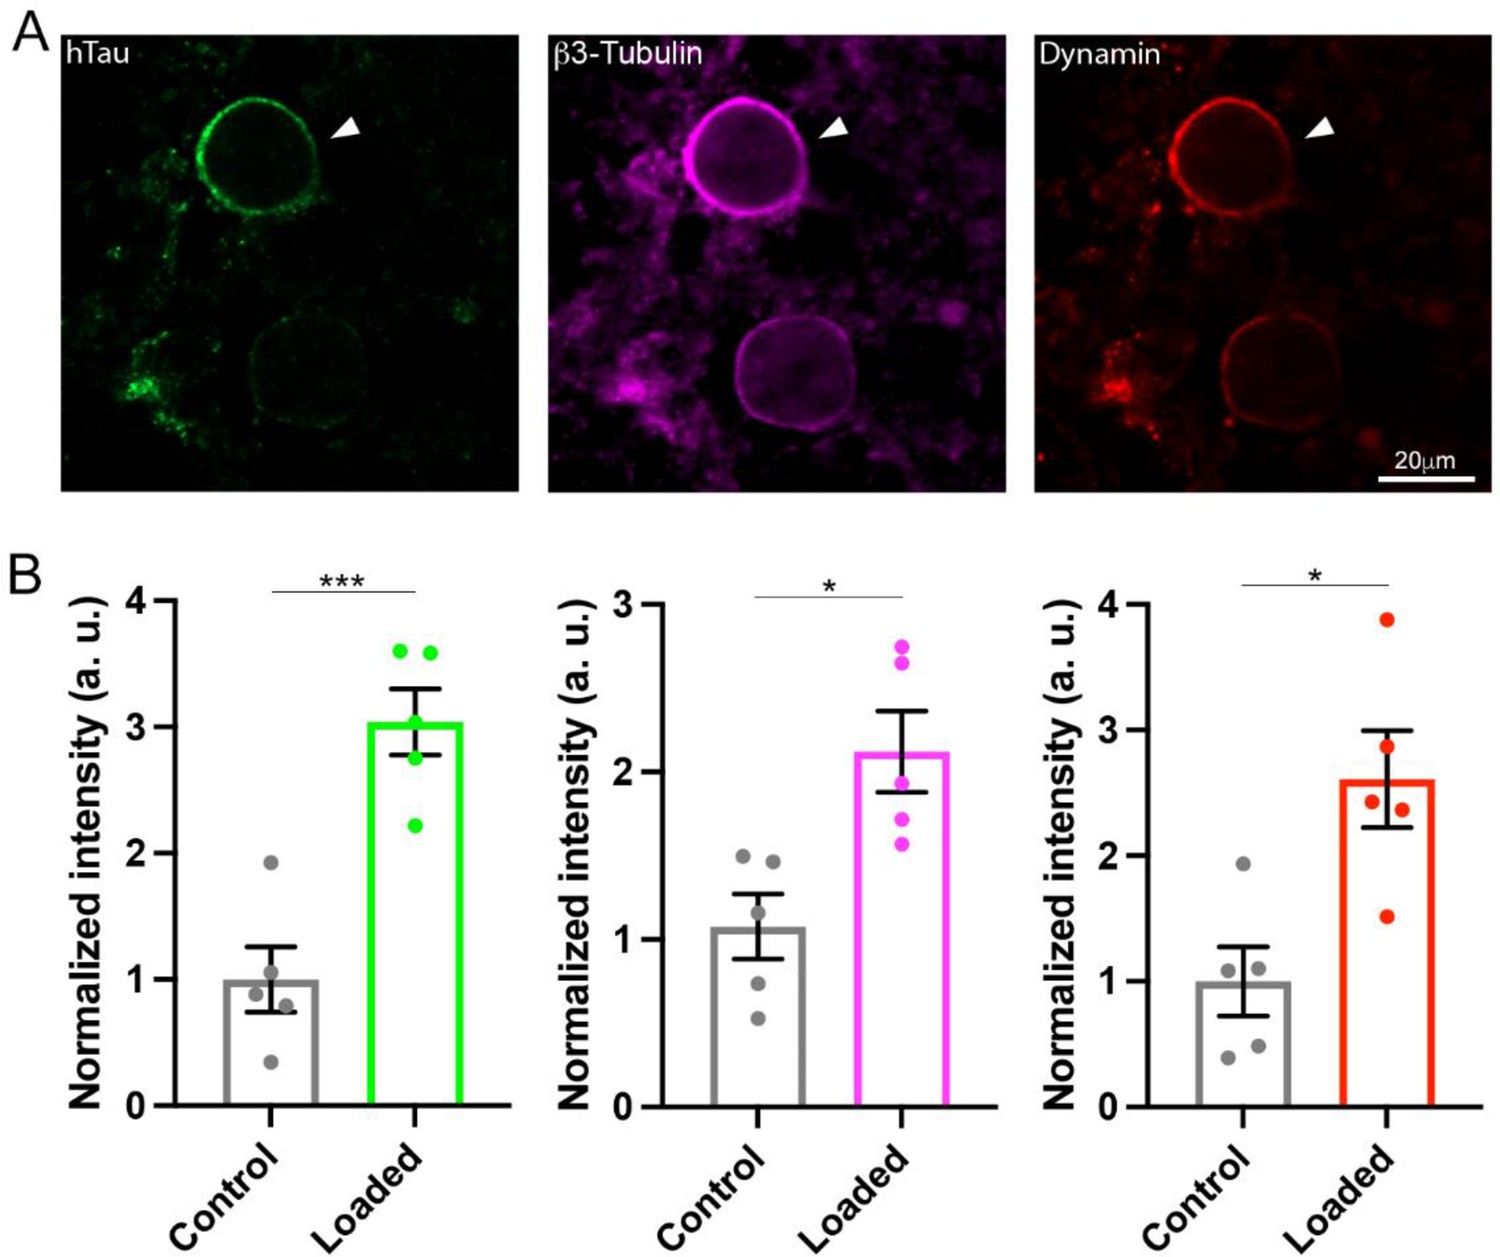
Wild-type (WT) human tau (h-tau) assembled microtubules (MTs) and increased bound-form dynamins in calyceal terminals.
(A) Immunofluorescence images of brainstem slices showing loaded WT h-tau (green, left, arrowhead) labeled with anti h-tau/Alexa Fluor 488 antibodies (green, left panel), newly assembled MTs labeled with anti-β3-tubulin/Alexa Fluor 647 antibodies (magenta, middle), and increased bound-form dynamin labeled with anti-dynamin 1/Alexa Fluor 568 antibodies (red, right panel). (B) Bar graphs showing immunofluorescence intensities of h-tau (green), β3-tubulin (magenta), and dynamin (red) relative to controls with no loading (black bars). WT h-tau loading significantly increased β3-tubulin (p = 0.0105) and dynamin 1 (p = 0.0109) intensity in terminals compared to control terminals without WT h-tau loading (n = 5 terminals from 5 slices for each data set, two-tailed unpaired t-test with Welch’s correction; *p < 0.05, ***p < 0.001).
-
Figure 4—source data 1
Raw immunofluorescence images from Figure 4A.
- https://cdn.elifesciences.org/articles/73542/elife-73542-fig4-data1-v2.pptx
-
Figure 4—source data 2
Data from Figure 4B.
- https://cdn.elifesciences.org/articles/73542/elife-73542-fig4-data2-v2.xlsx
Figure 4—figure supplement 1
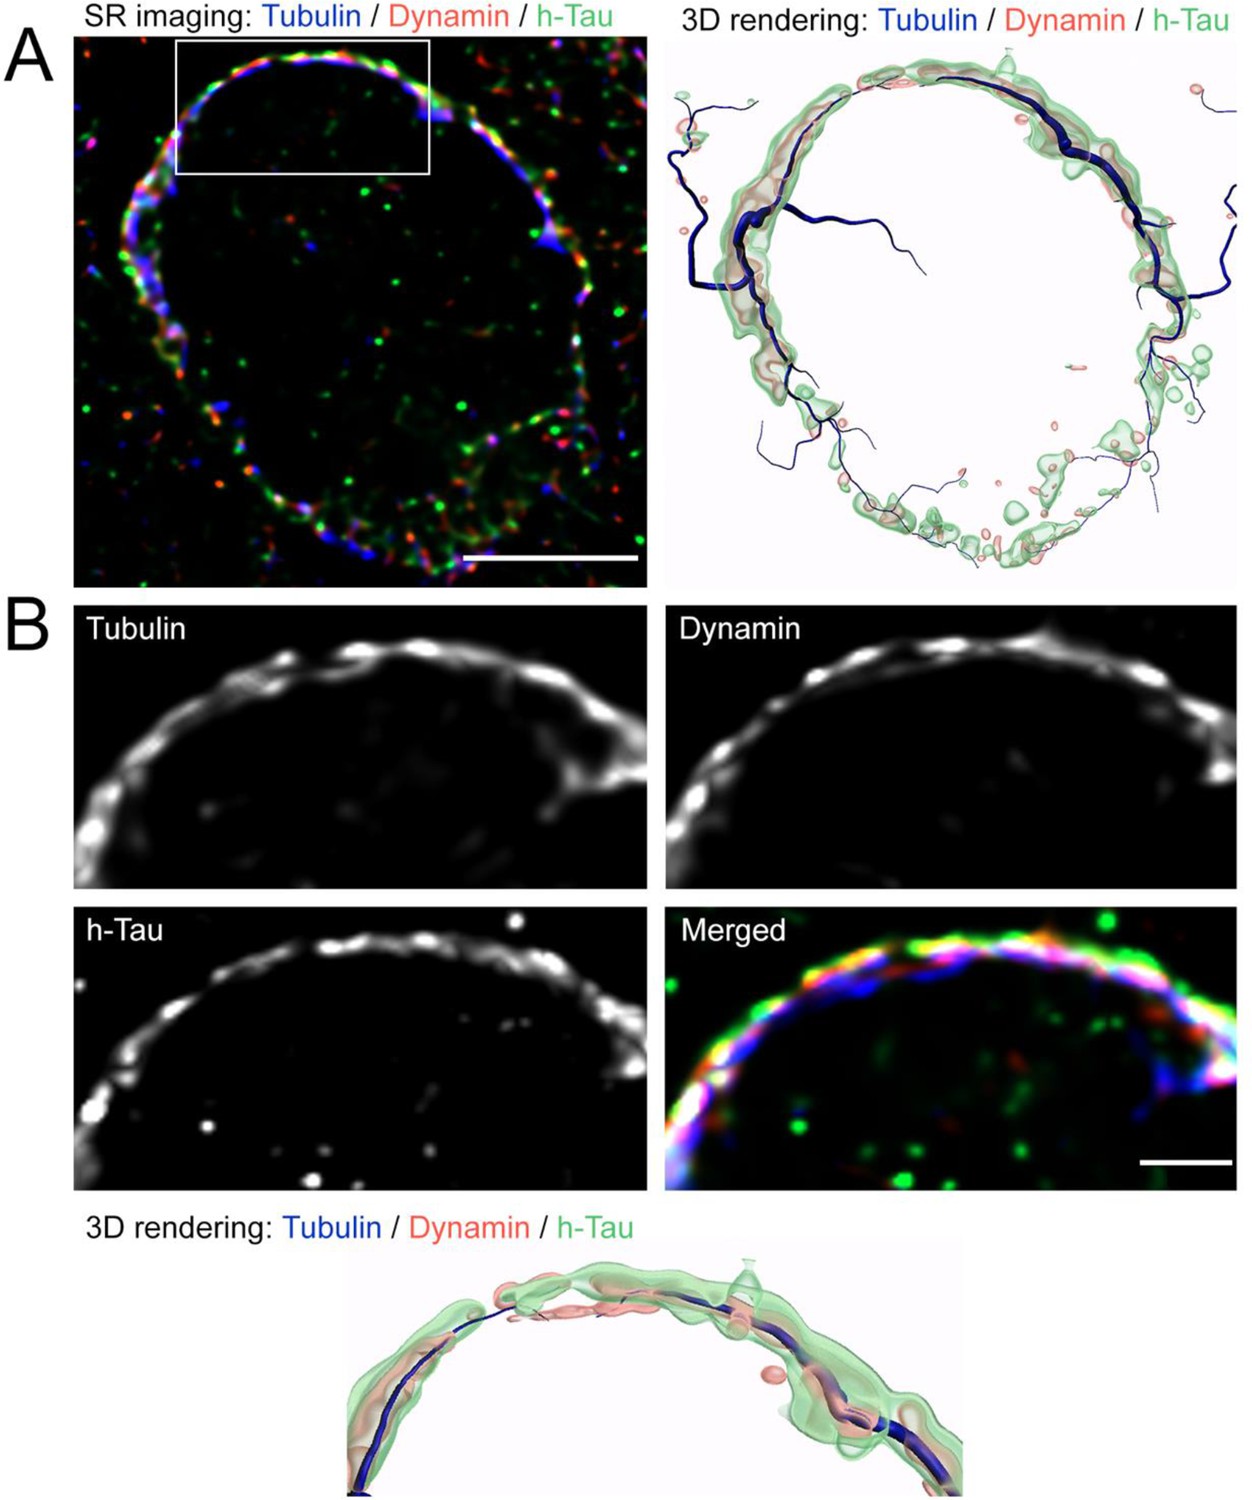
Super-resolution imaging of human tau (h-tau)-infused calyx of Held.
(A) Low magnification image of the terminal showing h-tau (green), β3-tubulin (blue), and dynamin 1 (red). Images were acquired on LSM900 with Airyscan 2 super-resolution module followed by 3D deconvolution. Scale bar, 5 µm. Corresponding 3D surface rendering image is shown on the right panel. (B) Expanded views of the delineated area in panel A, showing close localization of dynamin 1 with microtubule (MT) bundles in the presynaptic terminal infused with h-tau, and corresponding 3D surface rendering image (bottom panel). Scale bar, 1 µm.
-
Figure 4—figure supplement 1—source data 1
Raw images from Figure 4—figure supplement 1.
- https://cdn.elifesciences.org/articles/73542/elife-73542-fig4-figsupp1-data1-v2.pptx
Figure 4—figure supplement 2
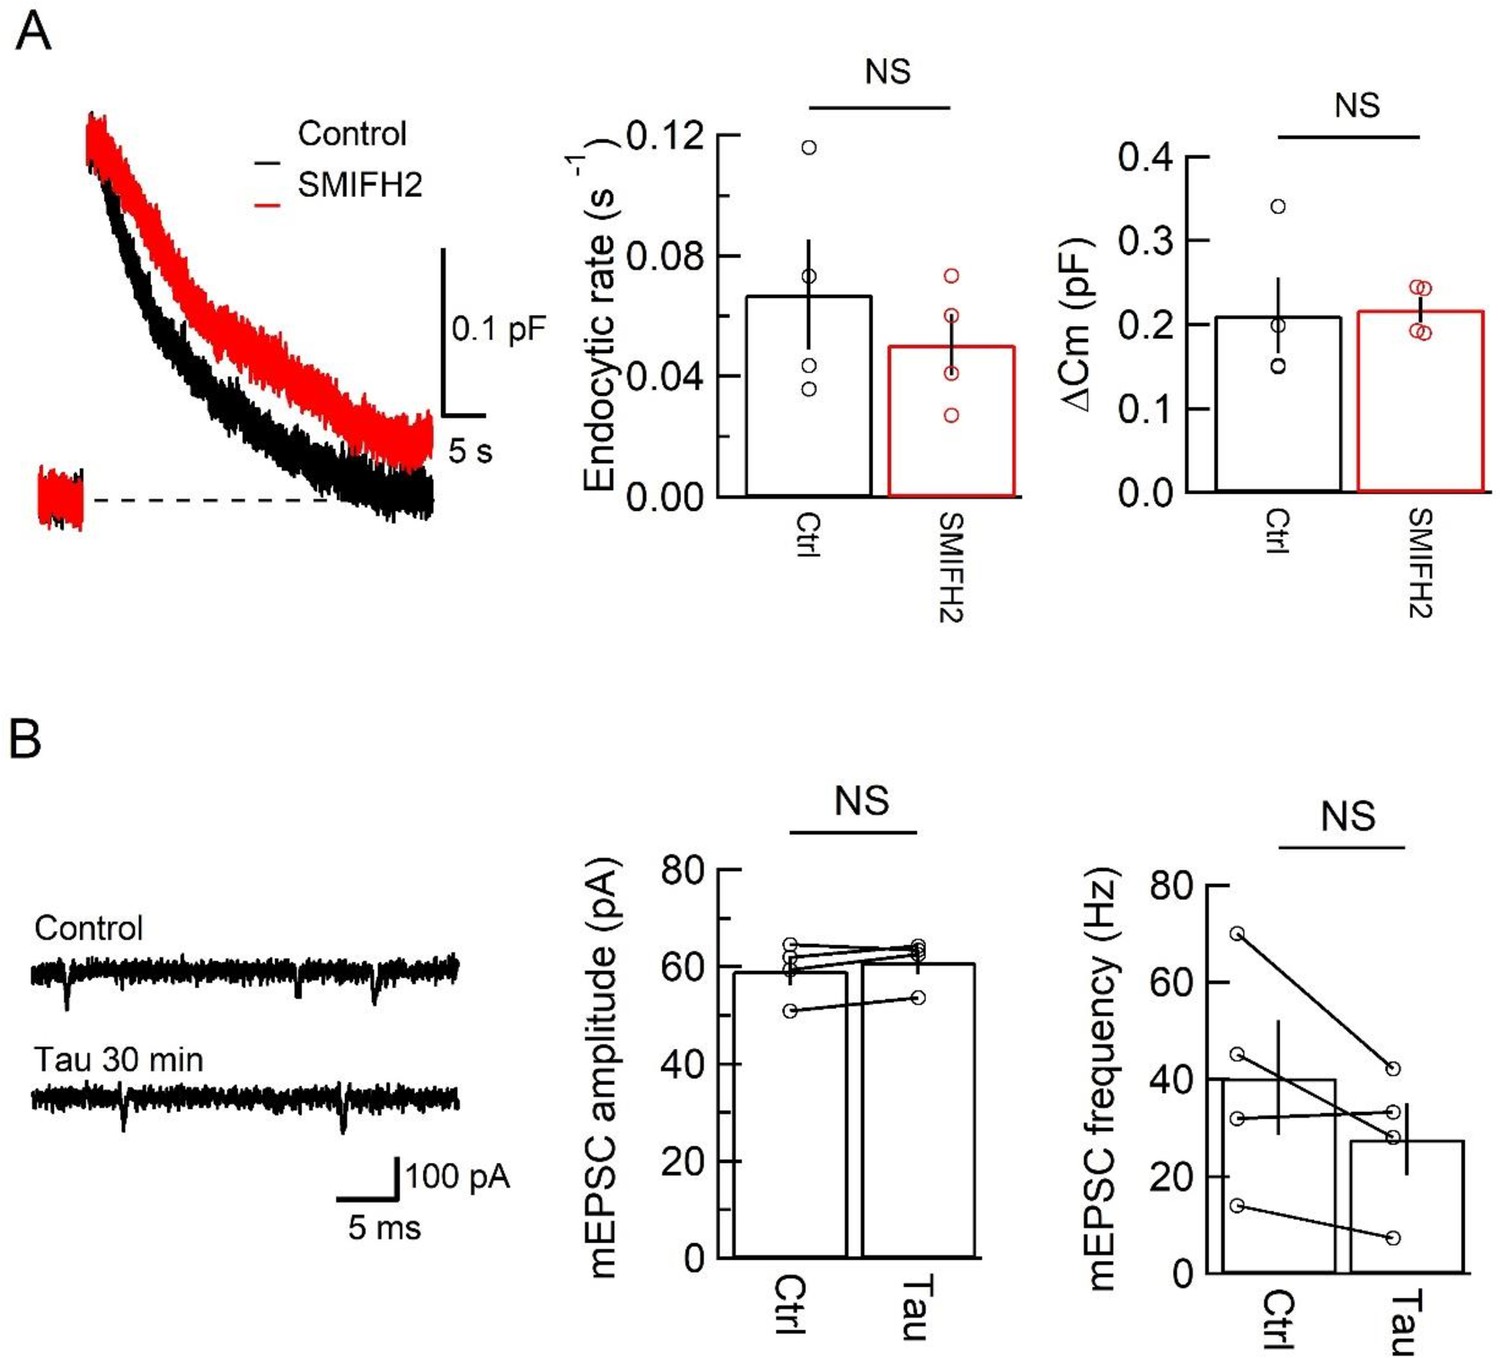
Effects of a formin mDia inhibitor on synaptic vesicle (SV) endocytosis and tau infusion on the quantal EPSCs.
(A) Formin mDia inhibitor SMIFH2 (50 µM) has no significant effect on SV endocytic rate (middle panel bar graphs, p = 0.45, n = 4) or exocytic magnitude (right panel bar graphs, p = 0.88, n = 4) at the calyx of Held of post-hearing mice (P13–14). Sample traces of capacitance changes evoked by a 20 ms pule with (red) or without (black) SMIFH2 are superimposed in the left panel. (B) Intra-terminal h-tau infusion had no effect on the mean amplitude (p = 0.08, t-test, n = 4) or frequency (p = 0.07, t-test, n = 4) of spontaneous miniature EPSCs. Left panel, sample trace 5 min before (control, upper trace) and 30 min after tau infusion (lower trace) in a simultaneous pre- and postsynaptic recording experiment.
-
Figure 4—figure supplement 2—source data 1
Data from Figure 4—figure supplement 2.
- https://cdn.elifesciences.org/articles/73542/elife-73542-fig4-figsupp2-data1-v2.xlsx
Figure 5 with 2 supplements
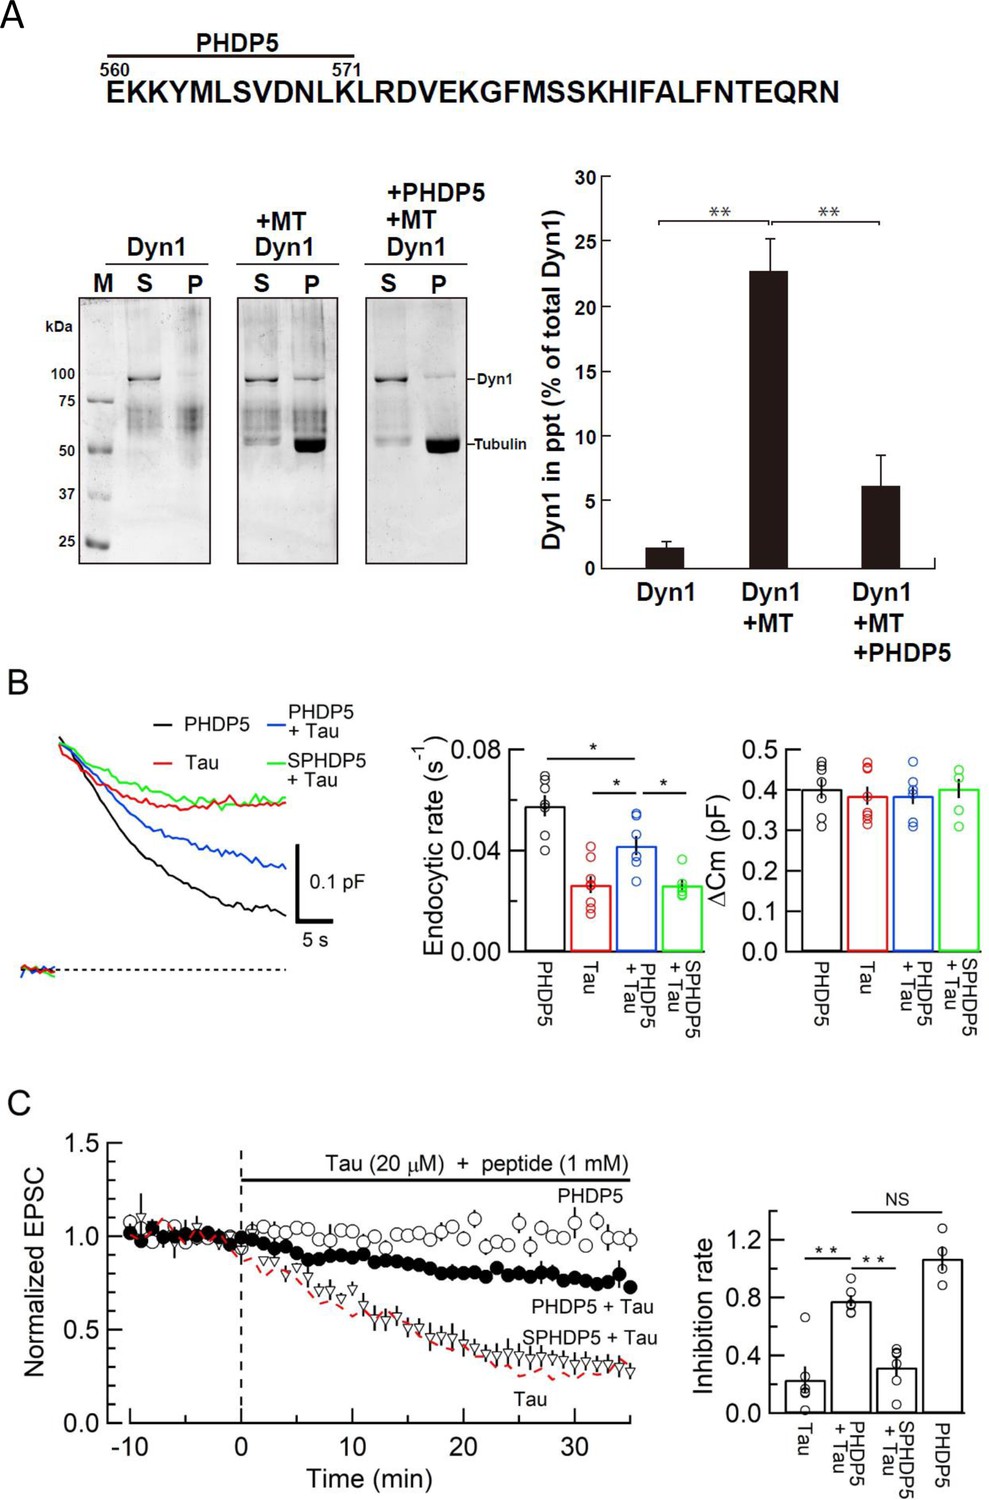
Dynamin 1 pleckstrin-homology (PH) domain peptide inhibited microtubule (MT)-dynamin 1 binding and prevented endocytic slowing and EPSC rundown caused by wild-type (WT) human tau (h-tau).
(A) Top, partial amino acid sequence of PH domain of mouse dynamin 1 indicating the sequence of the synthetic dodecapeptide PHDP5 (560–571). Left, SDS-PAGE of MT-dynamin 1-binding assay. S, supernatant; P, precipitates. Dyn1, dynamin 1. Right, quantification of MT-dynamin 1 interaction. The bars indicate the percentage of dynamin 1 found in precipitates relative to total amount. PHDP5 significantly inhibited MT-dynamin 1 interaction (**p < 0.01, n = 3). (B) Presynaptic membrane capacitance records (superimposed) after loading h-tau alone (20 µM, red trace, taken from Figure 4B), h-tau co-loaded with DPHP5 (0.25 mM, blue) or scrambled DPHP5 (SDPHP5, green). DPHP5 alone (0.25 mM, black trace, 7 terminals from 7 slices) had no effect on capacitance changes compared to non-loading terminal controls (taken from Figure 3B). Bar graphs of endocytic rates (middle panel) indicate significant difference (*p < 0.05, 7 terminals from 7 slices) between tau (red bar, 8 terminals from 8 slices) and DPHP5 + tau (blue, 7 terminals from 7 slices) as well as between SDPHP5 + tau (blue) and DPHP5 + tau (green, n = 6 terminals from 6 slices). The magnitudes of exocytic capacitance changes were not significantly different between the groups, recorded 25 min after rupture. (C) DPHP5 attenuated h-tau-induced EPSC rundown. The EPSC rundown after h-tau infusion (20 µM, red dashed line; data taken from Figure 1A) was attenuated by DPHP5 (1 mM) co-loaded with h-tau (filled circles) but not by scrambled DPHP5 peptide (SDPHP5, open triangles, 1 mM). DPHP5 alone (1 mM, open circles) had no effect on EPSC amplitude throughout. Bar graphs indicate EPSC amplitude (normalized to that before infusion) 30 min after infusion. Significant difference (**p < 0.01) between tau and tau + DPHP5, between tau + DPHP5 and tau + SDPHP5. The difference between DPHP5 alone and DPHP5 + tau was not significant (p = 0.09), indicating the partial antagonistic effect of DPHP5 against h-tau-induced EPSC rundown.
-
Figure 5—source data 1
Data from Figure 5A.
- https://cdn.elifesciences.org/articles/73542/elife-73542-fig5-data1-v2.xlsx
-
Figure 5—source data 2
Data from Figure 5B and C.
- https://cdn.elifesciences.org/articles/73542/elife-73542-fig5-data2-v2.xlsx
-
Figure 5—source data 3
Images from Figure 5A.
- https://cdn.elifesciences.org/articles/73542/elife-73542-fig5-data3-v2.pptx
Figure 5—figure supplement 1
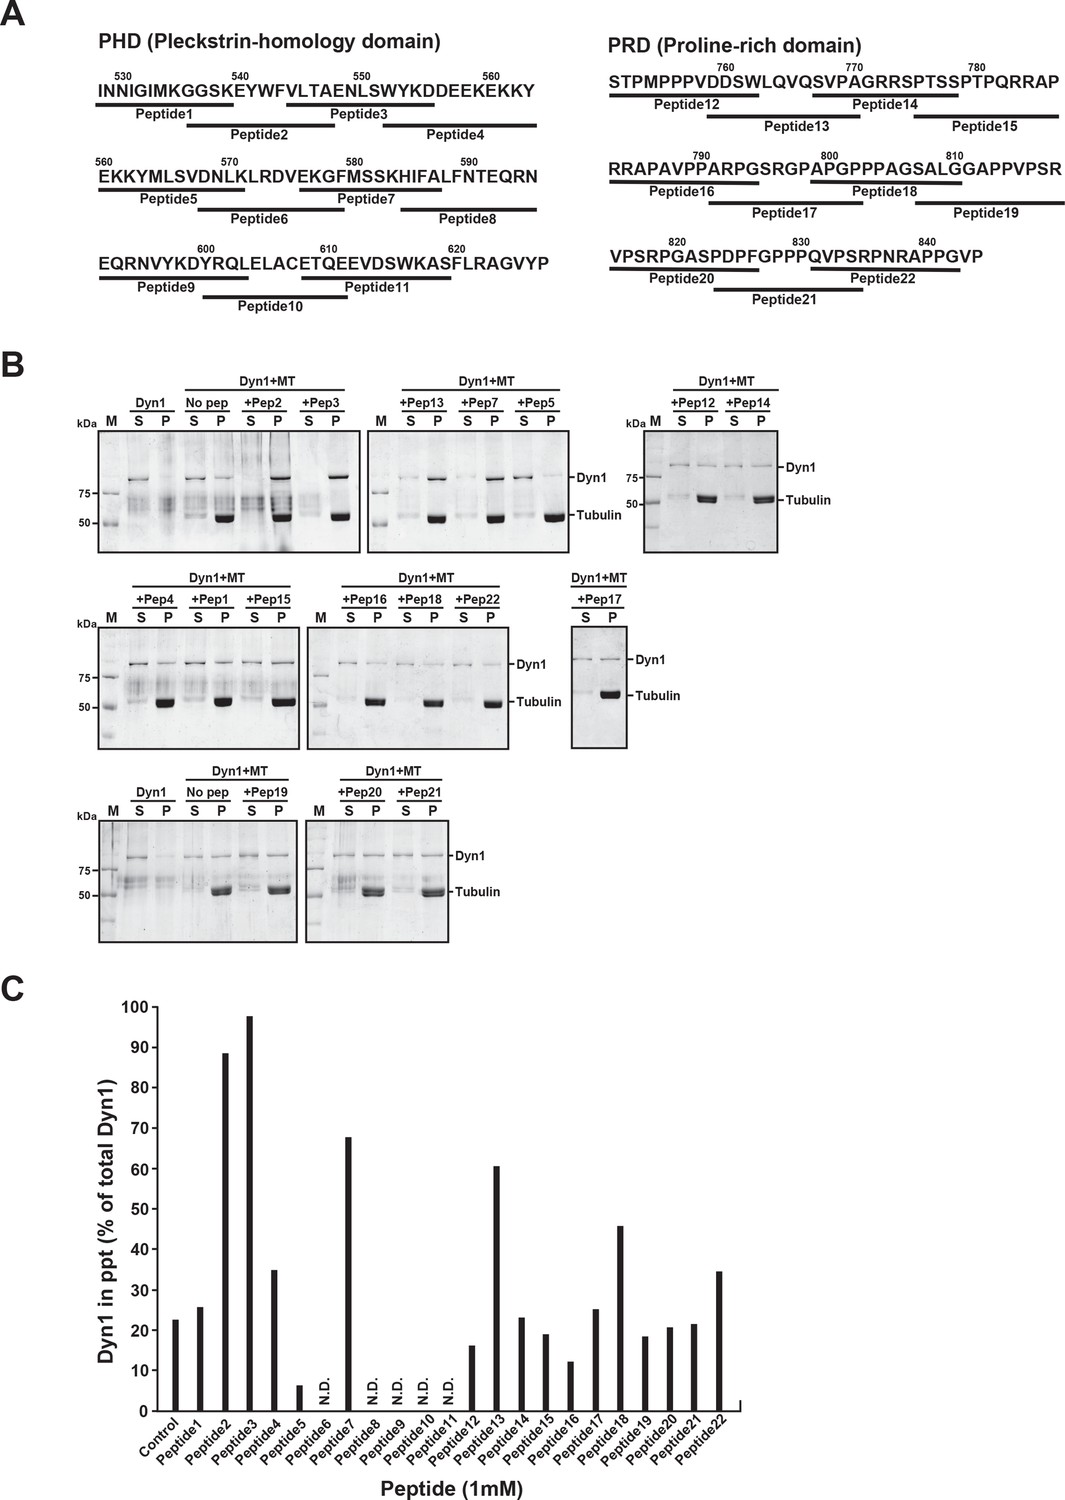
PHDP5 strongly inhibited dynamin 1 binding to microtubules (MTs).
(A) Peptide sequences in mouse dynamin 1 used in the dominant-negative (DN) peptide screening. In total, 24 peptides covering the pleckstrin-homology (PH) domain and the proline-rich domain were synthesized. (B) SDS-PAGE of the MT-binding assay, showing that PHDP5 strongly inhibits the MT-dynamin 1 binding (‘+Pep5’ in the top right panel). Since five peptides (peptide6, peptide8, peptide9, peptide10, peptide11) were insoluble in water or dimethyl sulfoxide, their effects were not tested. (C) Effects of the synthetic peptides at 1 mM on MT-dynamin 1 binding. Bar graphs indicate the percentage of dynamin 1 found in precipitates relative to total amount.
-
Figure 5—figure supplement 1—source data 1
Images from Figure 5—figure supplement 1.
- https://cdn.elifesciences.org/articles/73542/elife-73542-fig5-figsupp1-data1-v2.pptx
-
Figure 5—figure supplement 1—source data 2
Data from Figure 5—figure supplement 1.
- https://cdn.elifesciences.org/articles/73542/elife-73542-fig5-figsupp1-data2-v2.xlsx
Figure 5—figure supplement 2
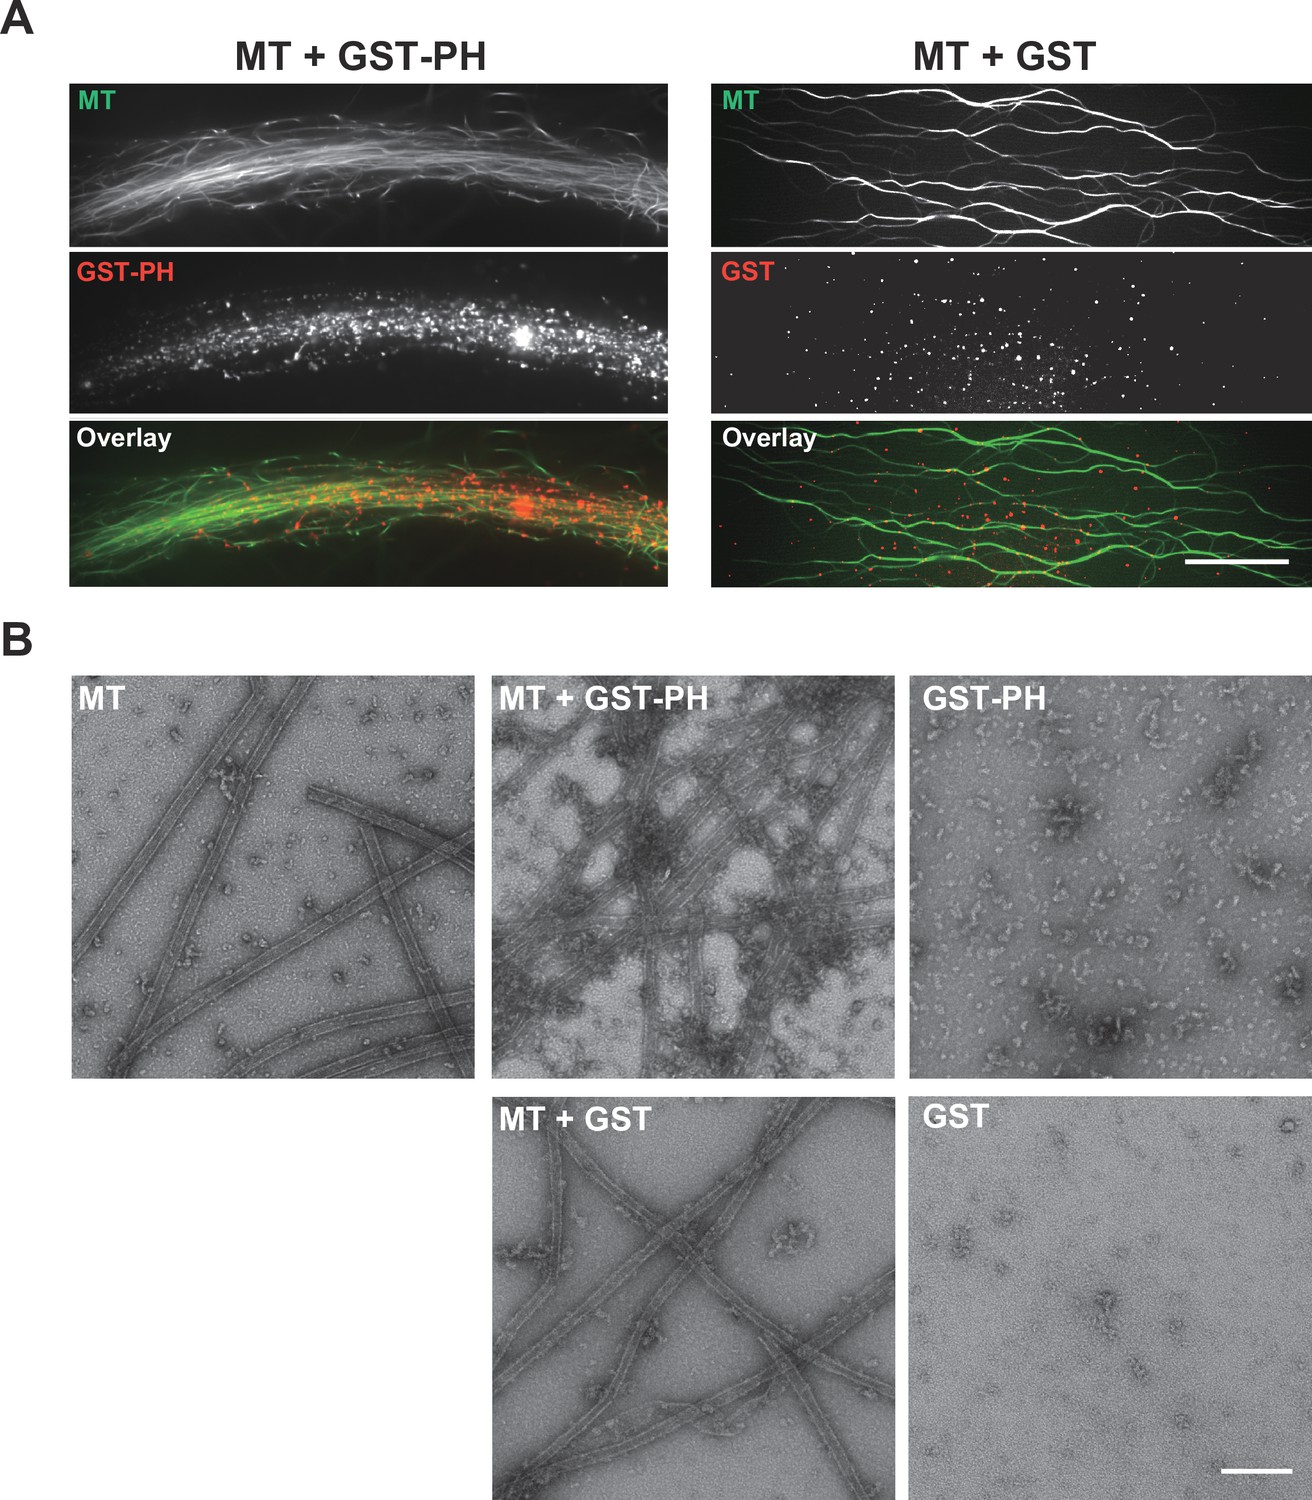
Pleckstrin-homology (PH) domain of dynamin 1 directly binds to microtubules.
(A) Left panels, glutathione transferase-tagged PH domain (GST-PH) labeled with HiLyte Fluor-555 (red, GST-PH) highly localized with fluorescent microtubules (green, MTs). Scale bar, 20 µm. Right panels, GST without PH did not co-localize with MTs. (B) Electron micrograph of negatively stained MTs (upper left panel), MTs plus GST-PH (upper middle panel), GST-PH alone (upper right panel), MTs plus GST (lower left panel), GST alone (lower right panel). GST-PH binds and crosslinks MTs. GST-PH forms larger complexes compared to GST. Scale bar, 200 nm.
-
Figure 5—figure supplement 2—source data 1
Images from Figure 5—figure supplement 2.
- https://cdn.elifesciences.org/articles/73542/elife-73542-fig5-figsupp2-data1-v2.pptx
Additional files
Download links
A two-part list of links to download the article, or parts of the article, in various formats.
Downloads (link to download the article as PDF)
Open citations (links to open the citations from this article in various online reference manager services)
Cite this article (links to download the citations from this article in formats compatible with various reference manager tools)
Microtubule assembly by tau impairs endocytosis and neurotransmission via dynamin sequestration in Alzheimer’s disease synapse model
eLife 11:e73542.
https://doi.org/10.7554/eLife.73542


