The Mutationathon highlights the importance of reaching standardization in estimates of pedigree-based germline mutation rates
- Section for Ecology and Evolution, Department of Biology, University of Copenhagen, Denmark
- Department of Molecular Medicine, Aarhus University, Denmark
- Department of Genetics, Washington University School of Medicine, United States
- Center for Evolution and Medicine, School of Life Sciences, Arizona State University, United States
- Department of Biology and Department of Computer Science, Indiana University, United States
- Department of Biology, Stanford University, United States
- Bioinformatics Research Centre, Aarhus University, Denmark
- Department of Genome Sciences, University of Washington, Computational Biology Division, Fred Hutchinson Cancer Research Center, United States
- California Academy of Sciences, United States
- Department of Molecular and Cell Biology, Center for Computational Biology, University of California, Berkeley, United States
- Center for Evolution and Medicine, Center for Mechanisms of Evolution, School of Life Sciences, Arizona State University, United States
- Department of Biology, Duke University, United States
Figures
Figure 1
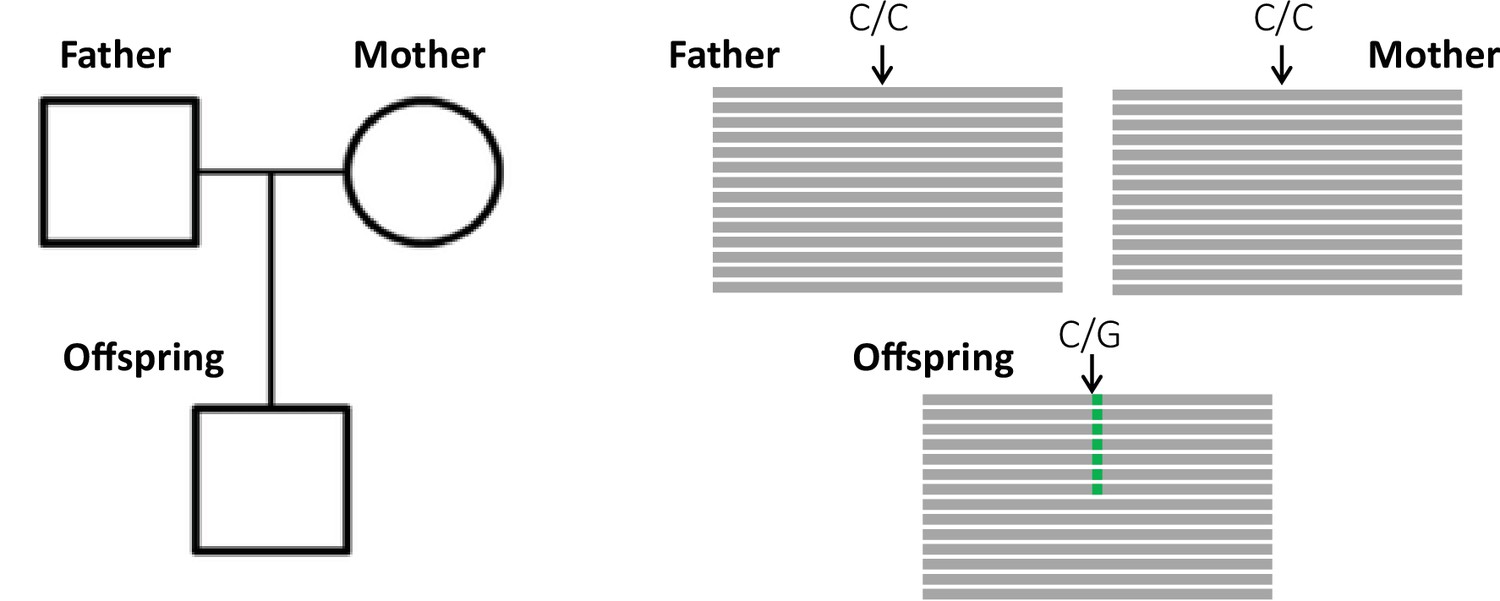
Detection of a de novo mutation (DNM) in a trio sample (mother, father, and offspring).
Potential candidates for DNMs are sites where approximately half of the reads (indicated as gray bars) from the offspring have a variant (indicated in green) that is absent from the parental reads.
Figure 2
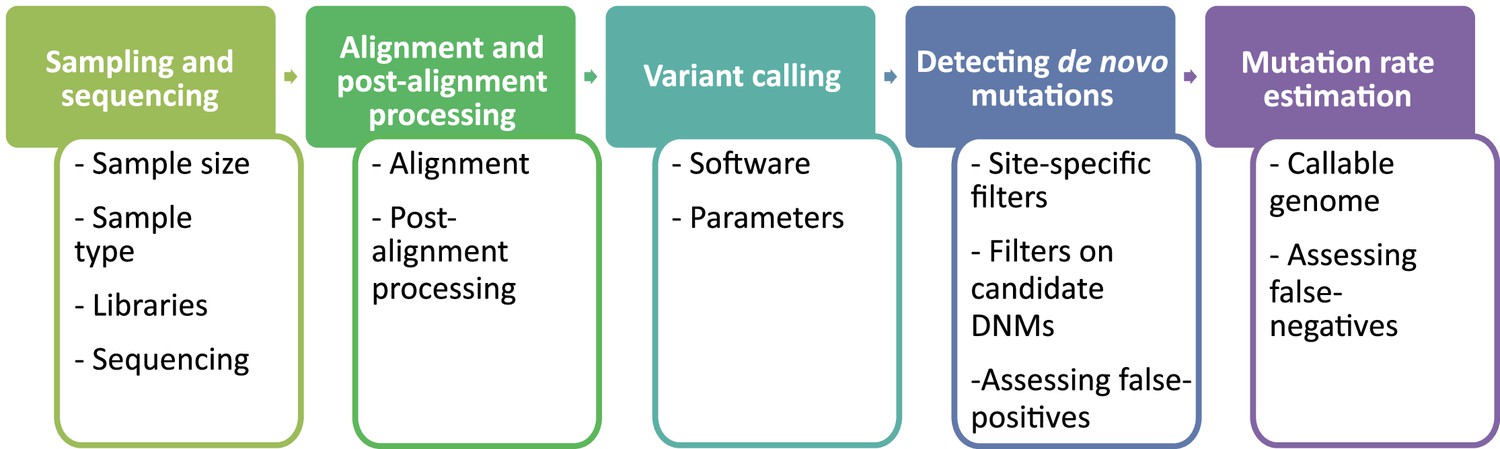
Flow of the main steps to call de novo mutations (DNMs) from pedigree samples.
Each step lists the various choices in study design and methodology that might impact mutation rate estimates.
Figure 3 with 1 supplement
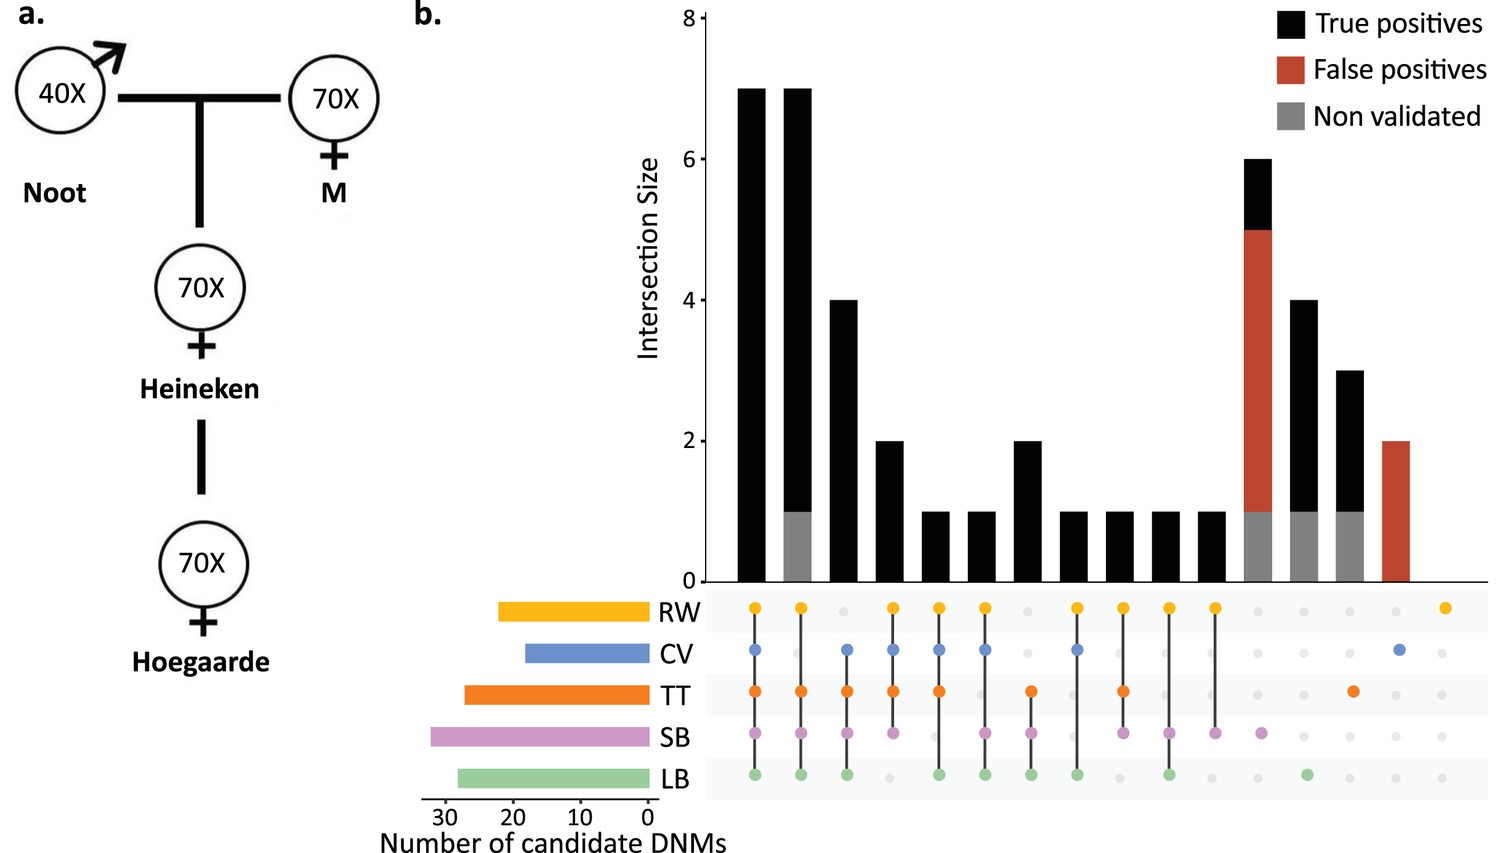
Candidate de novo mutations (DNMs) from the Mutationathon.
(a) The pedigree of three generations of rhesus macaques was sequenced and shared with five groups of researchers. Sequencing coverage is indicated for each individual. (b) Upset plot of the 43 candidate DNMs found in Heineken by each research group (LB: Lucie Bergeron; SB: Søren Besenbacher; CV: Cyril Versoza; TT: Tychele Turner; RW: Richard Wang) detected a total of 43 candidate DNMs in Heineken. The first six vertical bars are the candidates shared by at least four different groups. The PCR amplification and Sanger sequencing validation showed that 33 candidates were true-positive DNMs, 6 were false-positive calls (red bars), and 4 did not successfully amplify (gray bars). See Materials and methods for details on the experiment and Figure 3—source data 2 for the results of the PCR experiment.
-
Figure 3—source data 1
PCR validation of the candidate DNMs found by the various pipelines during the Mutationathon.
TP means validated as true positive DNM and FP appeared as false positive. The genotypes of all individuals as shown by the PCR validation are presented.
- https://cdn.elifesciences.org/articles/73577/elife-73577-fig3-data1-v3.xlsx
-
Figure 3—source data 2
Sanger sequencing chromatograms of the 39 DNM candidate sites that were successfully amplified for the four individuals, i.e. father (Noot), mother (M), offspring (Heineken), and second-generation offspring (Hoegaarde).
For each alignment, the candidate germline mutation position is located under the black square. The last six chromatograms (surrounded by red boxes) are the candidates that were detected as false-positive candidates.
- https://cdn.elifesciences.org/articles/73577/elife-73577-fig3-data2-v3.pdf
Figure 3—figure supplement 1
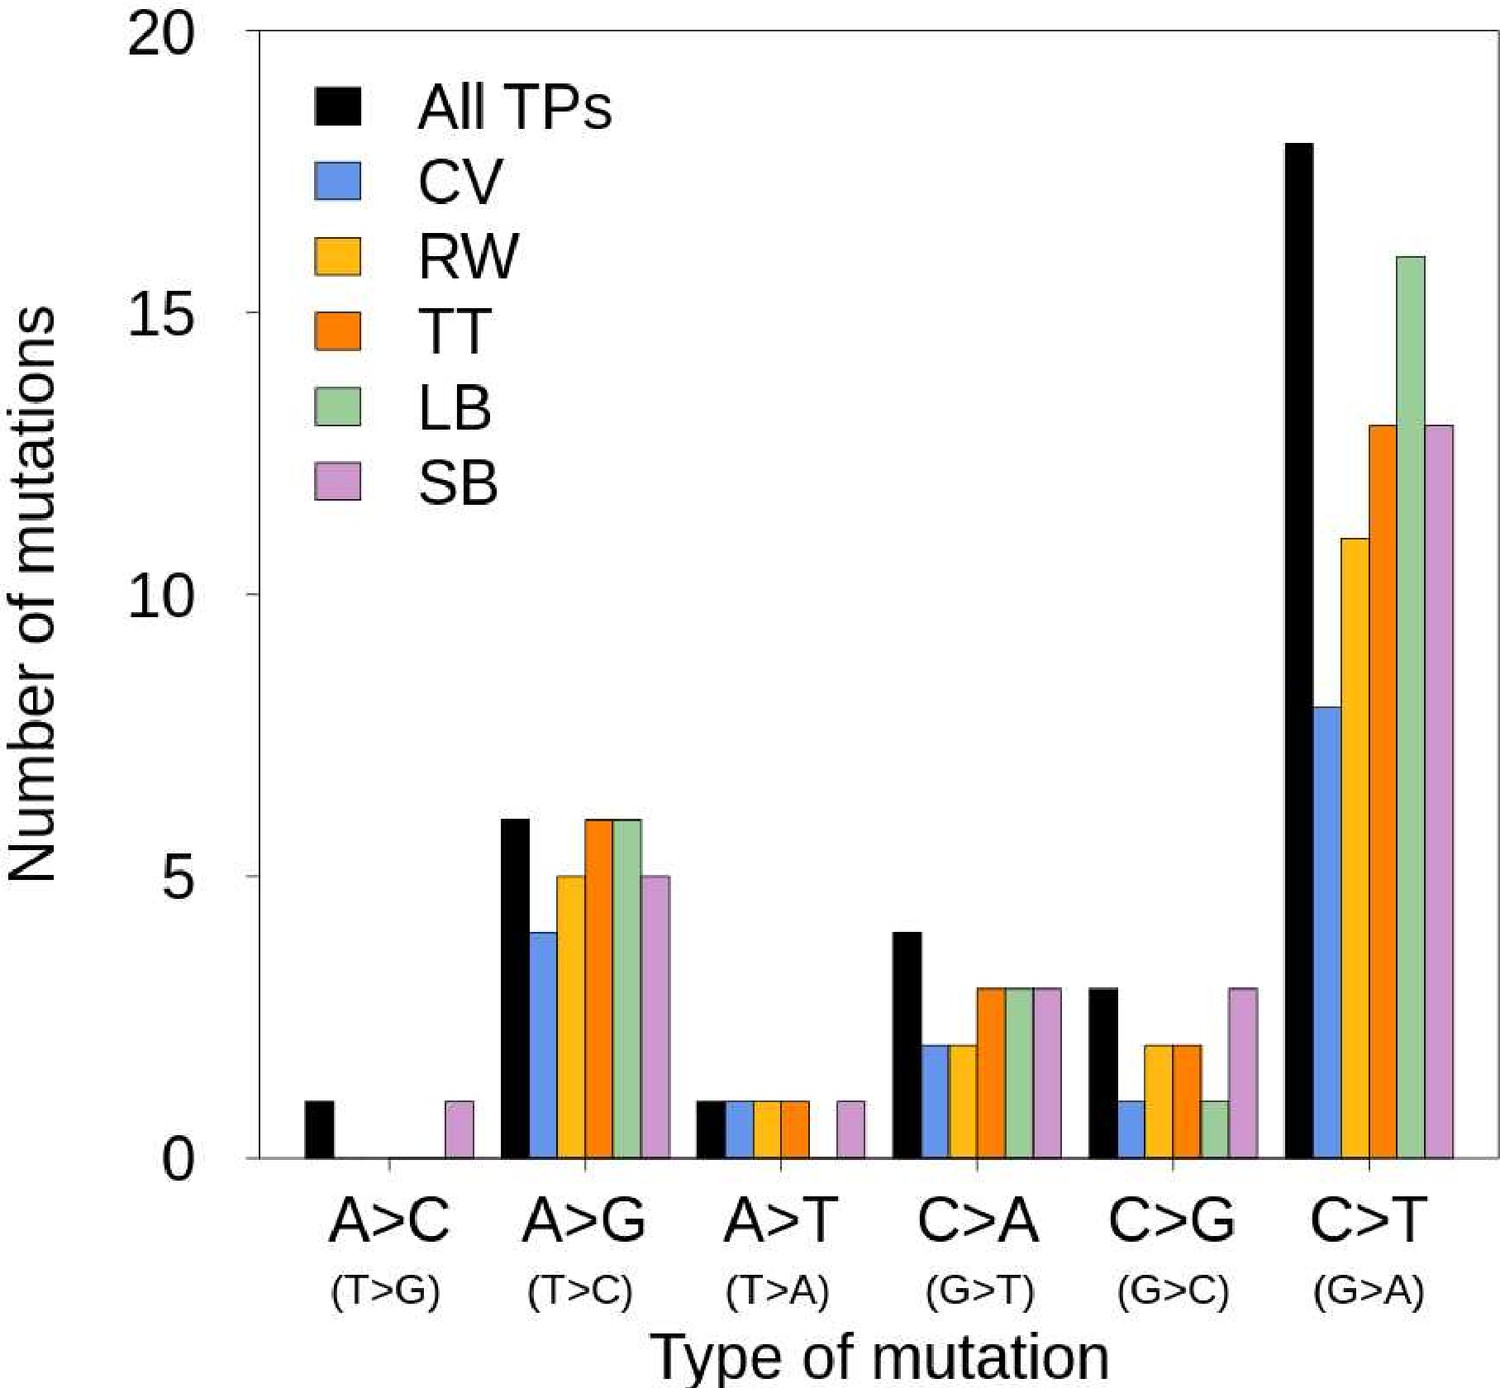
Mutation spectrum of the trio of rhesus macaques.
’All TPs’ correspond to all true-positive de novo mutations (DNMs) validated by the PCR experiment. The different colors correspond to the true-positive DNMs found by each pipeline (LB: Lucie Bergeron; SB: Søren Besenbacher; CV: Cyril Versoza; TT: Tychele Turner; RW: Richard Wang).
Figure 4
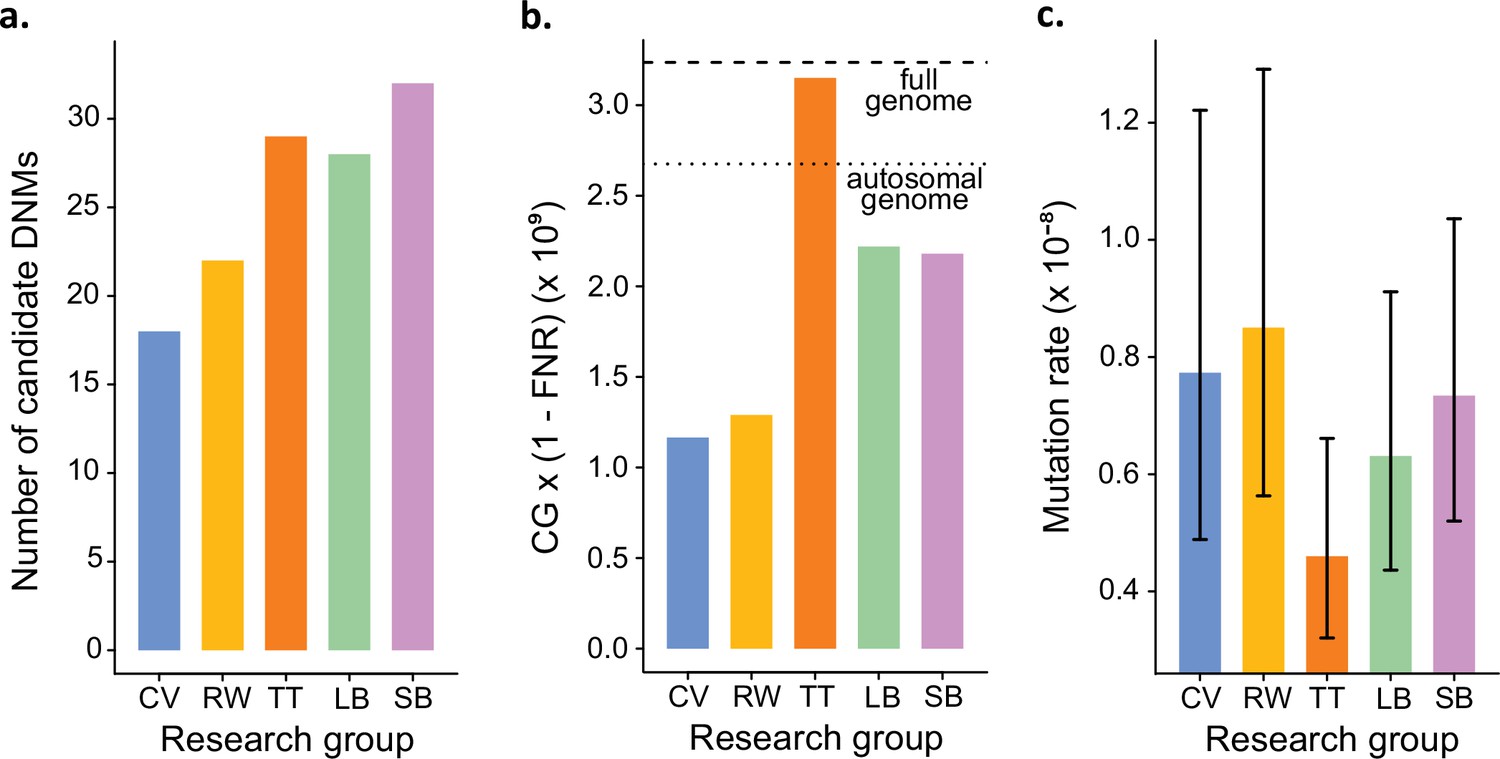
Estimated germline mutation rates from the Mutationathon.
(a) Number of candidate de novo mutations (DNMs) found by each group (Tychele Turner found two candidates on a sex chromosome). (b) Estimation of the denominator (i.e., the callable genome corrected by the false-negative rate [FNR]) by each group. (c) Estimated mutation rate per site per generation, the error bars correspond to the confidence intervals for binomial probabilities (calculated using the R package 'binconf').
-
Figure 4—source data 1
Number of candidate DNMs, estimated callable genome and per generation mutation rate by each researcher group.
- https://cdn.elifesciences.org/articles/73577/elife-73577-fig4-data1-v3.xlsx
Figure 5
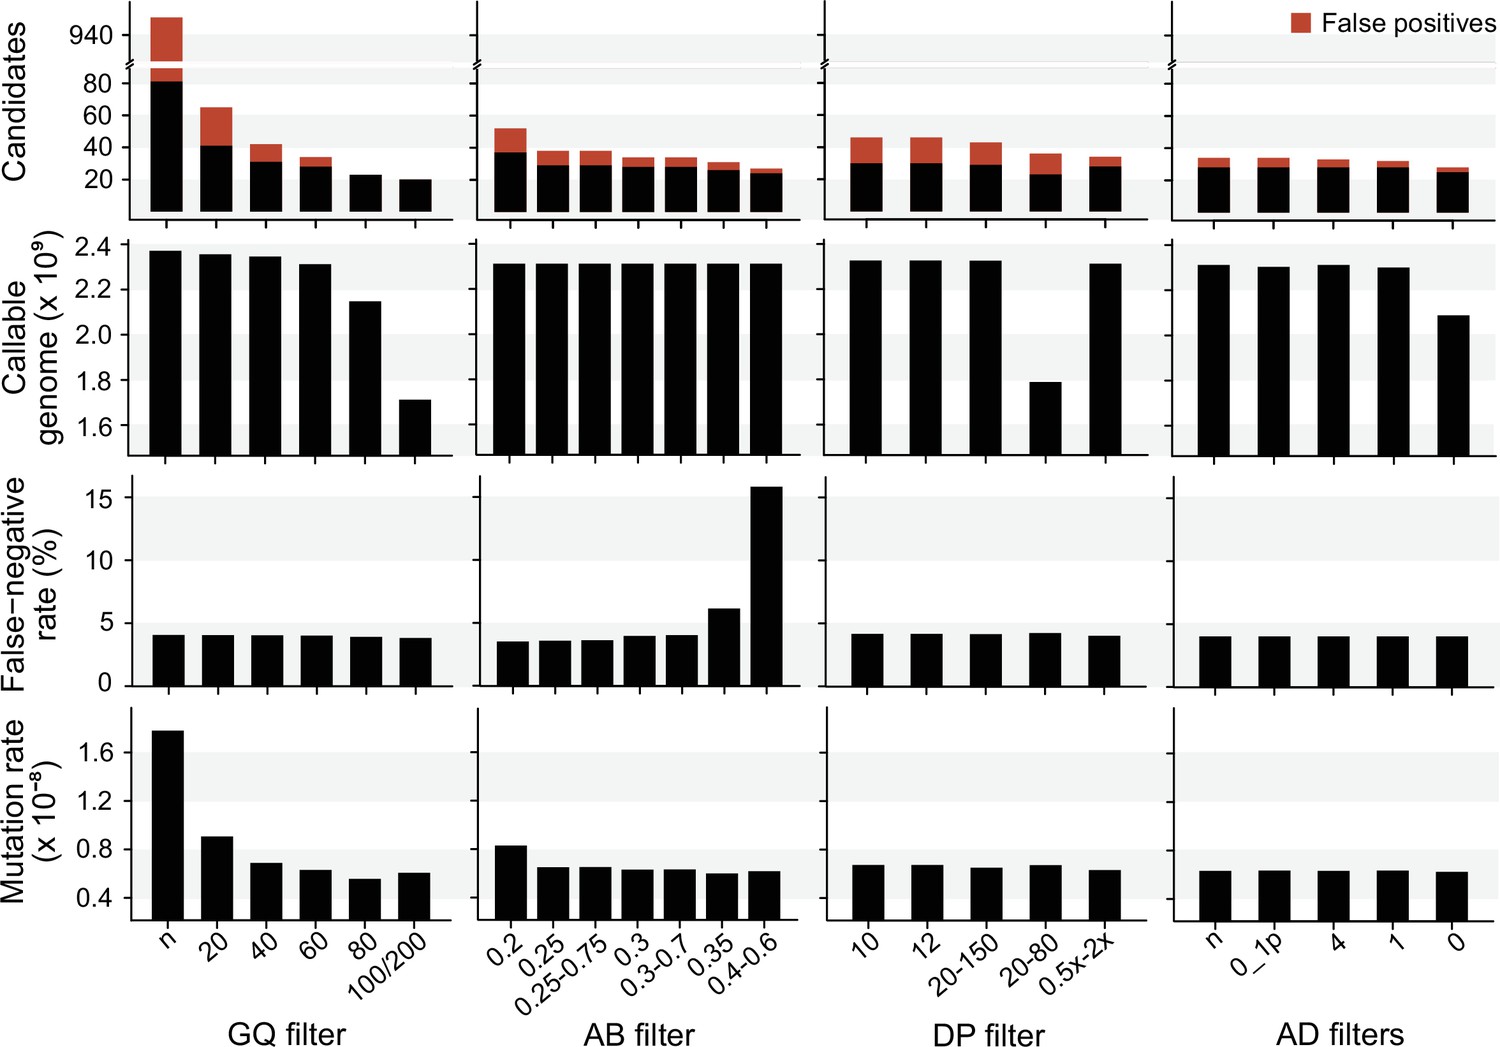
The impact of individual filters on the estimated rate of a trio of rhesus macaques.
The default filters used by Lucie Bergeron (LB) pipeline were DP < 0.5 × depth individual; DP > 2 × depthindividual; GQ < 60; AB < 0.3; AB > 0.7, no AD filter.
-
Figure 5—source data 1
Details on the number of candidate DNMs, the number of false positive calls, the size of the callable genome, the false negative rate and the final estimated mutation rate using various individual filters.
- https://cdn.elifesciences.org/articles/73577/elife-73577-fig5-data1-v3.xlsx
Tables
Table 1
Vertebrate species with a direct estimate of the mutation rate using a pedigree approach.
The list of species includes 10 primates, 5 nonprimate mammals, 1 bird, and 4 fish (see Supplementary file 1b for differences in study design and methodology).
| Species | Mutation rate per site per generation: µ × 10–8 | Number of trios | Parental age* | Reference |
|---|---|---|---|---|
| Orangutan (Pongo abelii) | 1.66 | 1 | ♂: 31.00 and ♀: 15.00 | Besenbacher et al., 2019 |
| Human (Homo sapiens) | 1.17 0.97 1.20 1.20 1.28 1.05 1.29 1.28 1.30 1.10 1.22 | 1 (CEU) 1 (YRI) 78 269 13 719 1550 150 516 593 1449 | Unspecified Unspecified ♂: 29.10 and ♀: 26.50 Unspecified ♂: 29.80 ♂: 33.40 Unspecified ~27.70 ♂: 33.40 ♂: 29.10 and ♀: 26.00 ♂: 29.70 and ♀: 26.90 | Conrad et al., 2011 Conrad et al., 2011 Kong et al., 2012 Francioli et al., 2015 Rahbari et al., 2016 Wong et al., 2016 Jónsson et al., 2017 Maretty et al., 2017 Turner et al., 2017 Sasani et al., 2019 Kessler et al., 2020 |
| Chimpanzee (Pan troglodytes) | 1.20 1.48 1.26 | 6 1 7 | ♂: 18.90 and ♀: 15.00 ♂: 24.00 and ♀: 24.00 ♂: 19.30 and ♀: 15.90 | Venn et al., 2014 Tatsumoto et al., 2017 Besenbacher et al., 2019 |
| Gorilla (Gorilla gorilla) | 1.13 | 2 | ♂: 14.50 and ♀: 20.50 | Besenbacher et al., 2019 |
| Baboon (Papio anubis) | 0.57 | 12 | ♂: 10.70 and ♀: 10.20 | Wu et al., 2020 |
| Rhesus macaque (Macaca mulatta) | 0.58 0.77 | 14 19 | ♂: 7.80 and ♀: 7.10 ♂: 12.40 and ♀: 8.40 | Wang et al., 2020 Bergeron et al., 2021a |
| Green monkey (Chlorocebus sabaeus) | 0.94 | 3 | ♂: 8.70 and ♀: 4.70 | Pfeifer, 2017 |
| Owl monkey (Aotus nancymaae) | 0.81 | 14 | ♂: 6.60 and ♀: 6.50 | Thomas et al., 2018 |
| Marmoset (Callithrix jacchus) | 0.43 | 1 | ~2.80 | Yang et al., 2021 |
| Gray mouse lemur (Microcebus murinus) | 1.52 | 2 | ♂: 4.55 and ♀: 1.45 | Campbell et al., 2021 |
| Mouse (Mus musculus) | 0.57 0.39 | 8 15 | Unspecified ~0.47 | Milholland et al., 2017 Lindsay et al., 2019 |
| Cattle (Bos taurus) | 1.17 | 5 | Unspecified | Harland et al., 2017 |
| Wolf (Canis lupus) | 0.45 | 4 | ♂: 4.00 and ♀: 2.25 | Koch et al., 2019 |
| Domestic cat (Felis catus) | 0.86 | 11 | ♂: 4.70 and ♀: 2.90 | Wang et al., 2021b |
| Platypus (Ornithorhynchus anatinus) | 0.70 | 2 | Unspecified | Martin et al., 2018 |
| Collared flycatcher (Ficedula albicollis) | 0.46 | 7 | Unspecified | Smeds et al., 2016 |
| Herring (Clupea harengus) | 0.20 | 12 | Unspecified | Feng et al., 2017 |
| Cichlid (Astatotilapia calliptera, Aulonocara stuartgranti, and Lethrinops lethrinus) | 0.35 | 9 | Unspecified | Malinsky et al., 2018 |
-
*
Depending on the study, the parental ages are reported as average paternal age (♂), average maternal age (♀), average parental age (~), or unspecified.
Table 2
Site-specific and sample-specific filters used by the different groups to detect de novo mutations (DNMs) in Heineken (difference in the other steps of the pipeline in Table 2—source data 1).
| Research group | Candidate DNMs | Site-specific filters | Sample-specific filters | Additional filters |
|---|---|---|---|---|
| CV | 18 | GATK Best Practices hard filter criteria | 0.5 × dpind < DP < 2 × dpind GQ > 40 AD > 0 0.25 < AB < 0.75 | |
| RW | 22 | QD < 2.0 MQ < 40.0 FS > 60.0 SOR > 3.0 MQRankSum < –12.5 ReadPosRankSum < –8.0 | 20 < DP < 80 GQ > 20 AD > 0 0.35 < AB | Alternative allele on both strands |
| TT | 27 | Remove variants in recent repeats or in homopolymers of AAAAAAAAAA or TTTTTTTTTT | DP > 10 GQ > 20 AD > 0 0.25 < AB | Overlap three different variant callers Filter on LCR |
| LB | 28 | QD < 2.0 FS > 20.0 MQ < 40.0 MQRankSum < –2.0 MQRankSum > 4.0 ReadPosRankSum < –3.0 ReadPosRankSum > 3.0 SOR > 3.0 | 0.5 × dpind < DP < 2 × dpind GQ > 60 AD none 0.3 < AB < 0.7 | Manual curation (six candidates removed) |
| SB | 32 | FS > 30.0 MQRankSum < –10 MQRankSum > 10 ReadPosRankSum < –2.5 ReadPosRankSum > 2.5 BaseQRankSum < –13 BaseQRankSum > 13 | 10 < DP < 2× dpind GQ > 55 AD > 0 0.3 < AB | Alternative allele in both strands. lowQ AD2 > 1 |
-
LB: Lucie Bergeron; SB: Søren Besenbacher; CV: Cyril Versoza; TT: Tychele Turner; RW: Richard Wang.
-
Table 2—source data 1
Details on the methodology and filtering criteria applied by the five different pipelines to estimate the mutation rate on the common pedigree.
- https://cdn.elifesciences.org/articles/73577/elife-73577-table2-data1-v3.xlsx
Table 3
Information that should ideally be reported when presenting results on de novo mutations (DNMs).
See Table 2—source data 1 for an example of this table filled out for the five pipelines used to analyze the trio of rhesus macaques.
| Step of the analysis | Information to report |
|---|---|
| 1. Sampling and sequencing | Type of sample (tissue, etc.) |
| Storage duration, buffer, temperature | |
| Type of library preparation | |
| Average sequencing coverage | |
| Sequencing technology and read lengths | |
| 2. Alignment and post-alignment processing | Trimming of adaptors and low-quality reads |
| Reference assembly version Autosomes only or whole genome? | |
| Mapping software and version | |
| Duplicate removal software and version | |
| Base quality score recalibration (yes/no) | |
| If yes, which type of data used as known variants? | |
| Realignments around indels? | |
| Other filters? | |
| 3. Variant calling | Software and version |
| Mode: joint genotyping? GVCF blocks? GVCF in base-pair resolution? | |
| 4. Detecting DNMs | Site filters on .vcf files and justification |
| Individual filters, threshold, and remaining candidates after each filter | |
| False discovery rate estimation method: PCR validation? Manual curation? Transmission rate deviation? Removal of low-complexity regions, cluster mutations, or recurrent mutations? | |
| 5. Mutation rate estimation | Callable genome estimation method: File used? Filters taken into account? |
| False-negative rate estimation method: simulation? Filters? Probability? |
Additional files
-
Supplementary file 1
Four supplementary tables with details on the methods used in the literature, Genome Analysis ToolKit (GATK) site filters, site-specific and sample-specific filters used in the literature, and the PCR experiment.
- https://cdn.elifesciences.org/articles/73577/elife-73577-supp1-v3.docx
-
Transparent reporting form
- https://cdn.elifesciences.org/articles/73577/elife-73577-transrepform1-v3.docx
Download links
A two-part list of links to download the article, or parts of the article, in various formats.
Downloads (link to download the article as PDF)
Open citations (links to open the citations from this article in various online reference manager services)
Cite this article (links to download the citations from this article in formats compatible with various reference manager tools)
The Mutationathon highlights the importance of reaching standardization in estimates of pedigree-based germline mutation rates
eLife 11:e73577.
https://doi.org/10.7554/eLife.73577


