Temporal transcriptional response of Candida glabrata during macrophage infection reveals a multifaceted transcriptional regulator CgXbp1 important for macrophage response and fluconazole resistance
- Faculty of Health Sciences, University of Macau, China
- Gene Expression, Genomics and Bioinformatics Core, Faculty of Health Sciences, University of Macau, China
- Institute of Translational Medicine, Faculty of Health Sciences, University of Macau,Avenida da Universidade, China
- MoE Frontiers Science Center for Precision Oncology, University of Macau, China
Figures
Figure 1 with 6 supplements
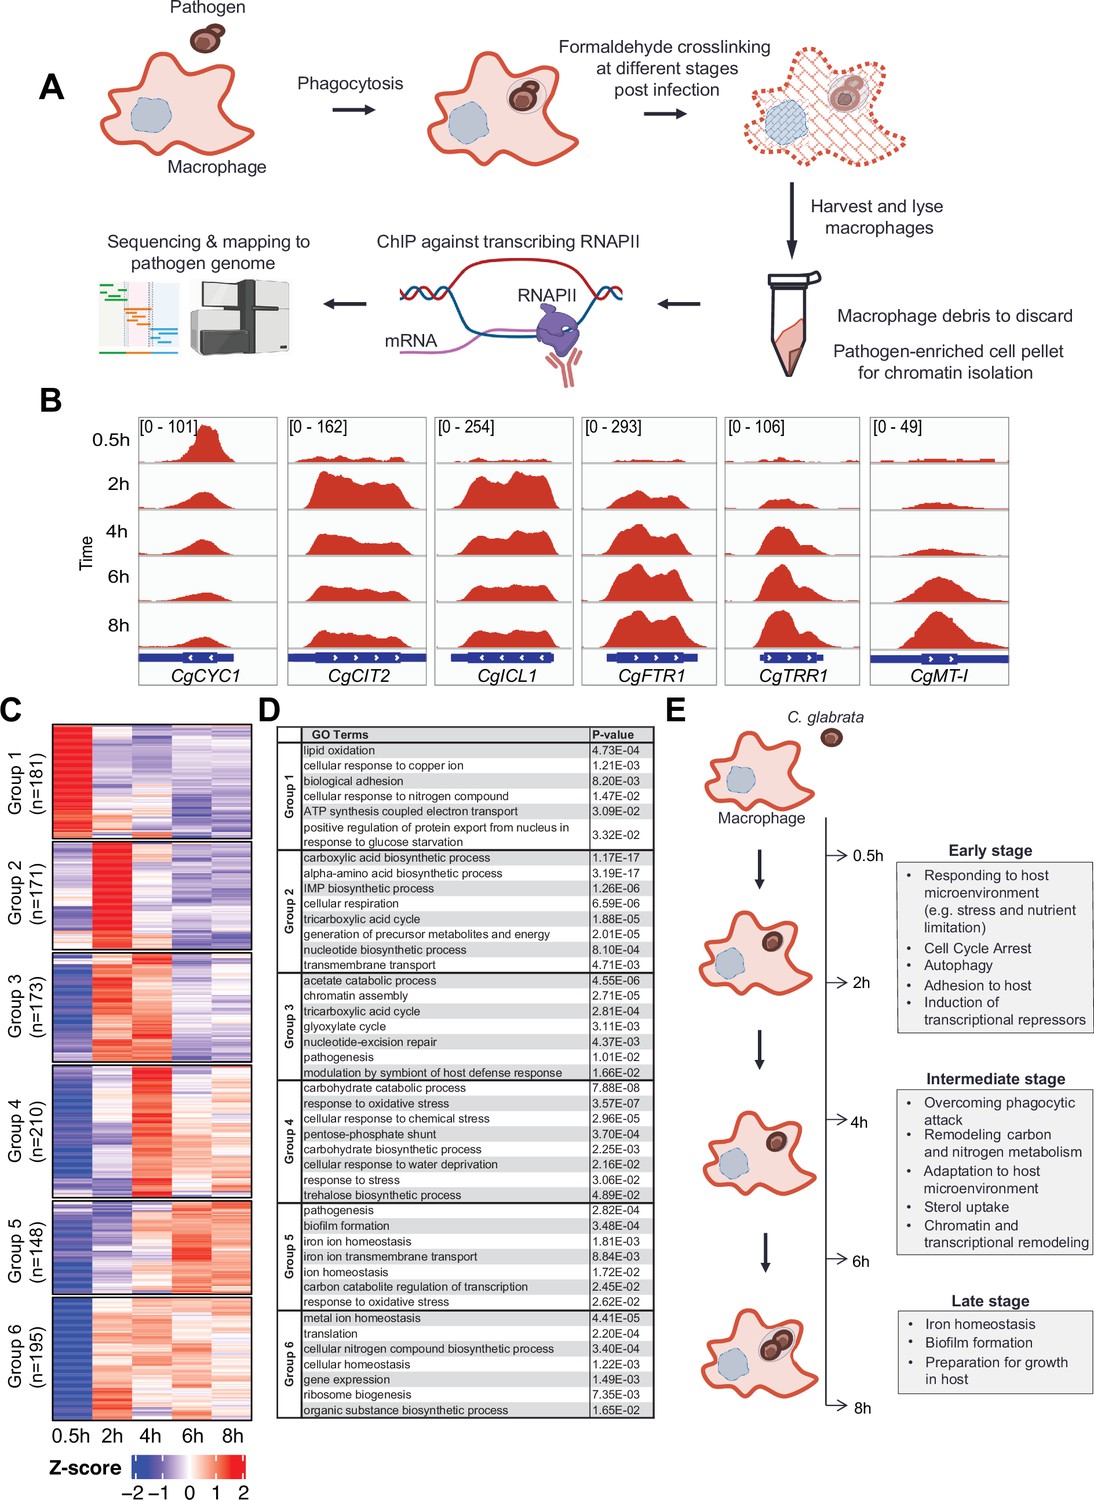
C. glabrata mounts a dynamic chronological transcriptional response upon macrophage infection.
(A) A schematic diagram showing the overall methodology used in this study. (B) Genome browser views of RNA polymerase II (RNAPII) Chromatin Immuno-precipitation followed by the Next Generation Sequencing (ChIP-seq) signals on CgCYC1, CgCIT2, CgICL1, CgFTR1, CgTRR1, and CgMT-I genes at indicated time points. Numbers in the square brackets indicate the y-axis scale range of normalized RNAPII ChIP-seq signal used for the indicated genes across different datasets. (C) A heatmap showing temporal expression patterns of transcribed genes in C. glabrata during 0.5–8 hr macrophage infection in a time-course experiment. The colour scale represents the Z-score of the normalized RNAPII ChIP-seq signal. The groups were determined by k-means clustering. (D) A table showing significantly enriched gene ntology o(GO) biological processes (p-value ≤0.05) for the six groups of temporally transcribed genes. (E) A schematic diagram showing C. glabrata transcriptional responses (broadly classified into early, intermediate, and late stages) during macrophage infection.
Figure 1—figure supplement 1
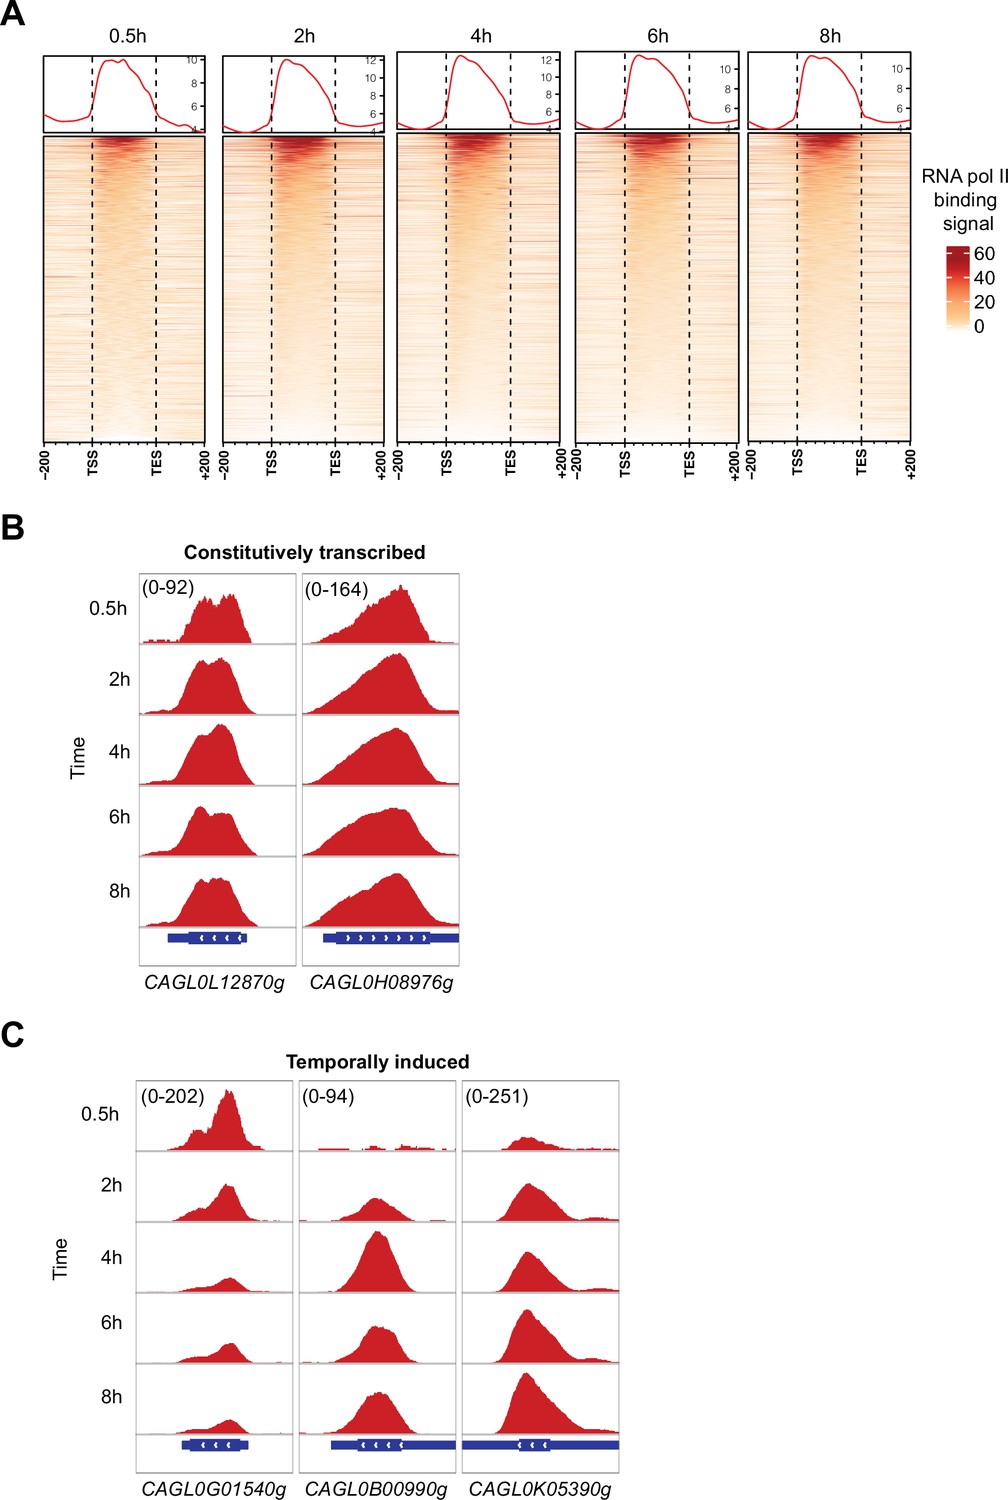
High-resolution RNA polymerase II (RNAPII) Chromatin Immuno-precipitation followed by the Next Generation Sequencing (ChIP-seq) can capture genome-wide active and temporally induced transcription activities in C. glabrata during macrophage infection.
(A) A heatmap displaying RNAPII ChIP-seq signal over the gene body and 200 bp upstream and downstream regions for all C. glabrata genes after 0.5, 2, 4, 6, and 8 hr of THP-1 macrophage infection. The color scale represents the normalized RNAPII ChIP-seq signal. (B) Genome browser screenshots showing RNAPII ChIP-seq signal on selected constitutively transcribed genes. (C) Genome browser screenshots showing RNAPII ChIP-seq signal on selected temporally induced C. glabrata genes. Numbers in the square brackets indicate the y-axis scale range of normalized RNAPII ChIP-seq signal used for the indicated genes across different datasets.
Figure 1—figure supplement 2
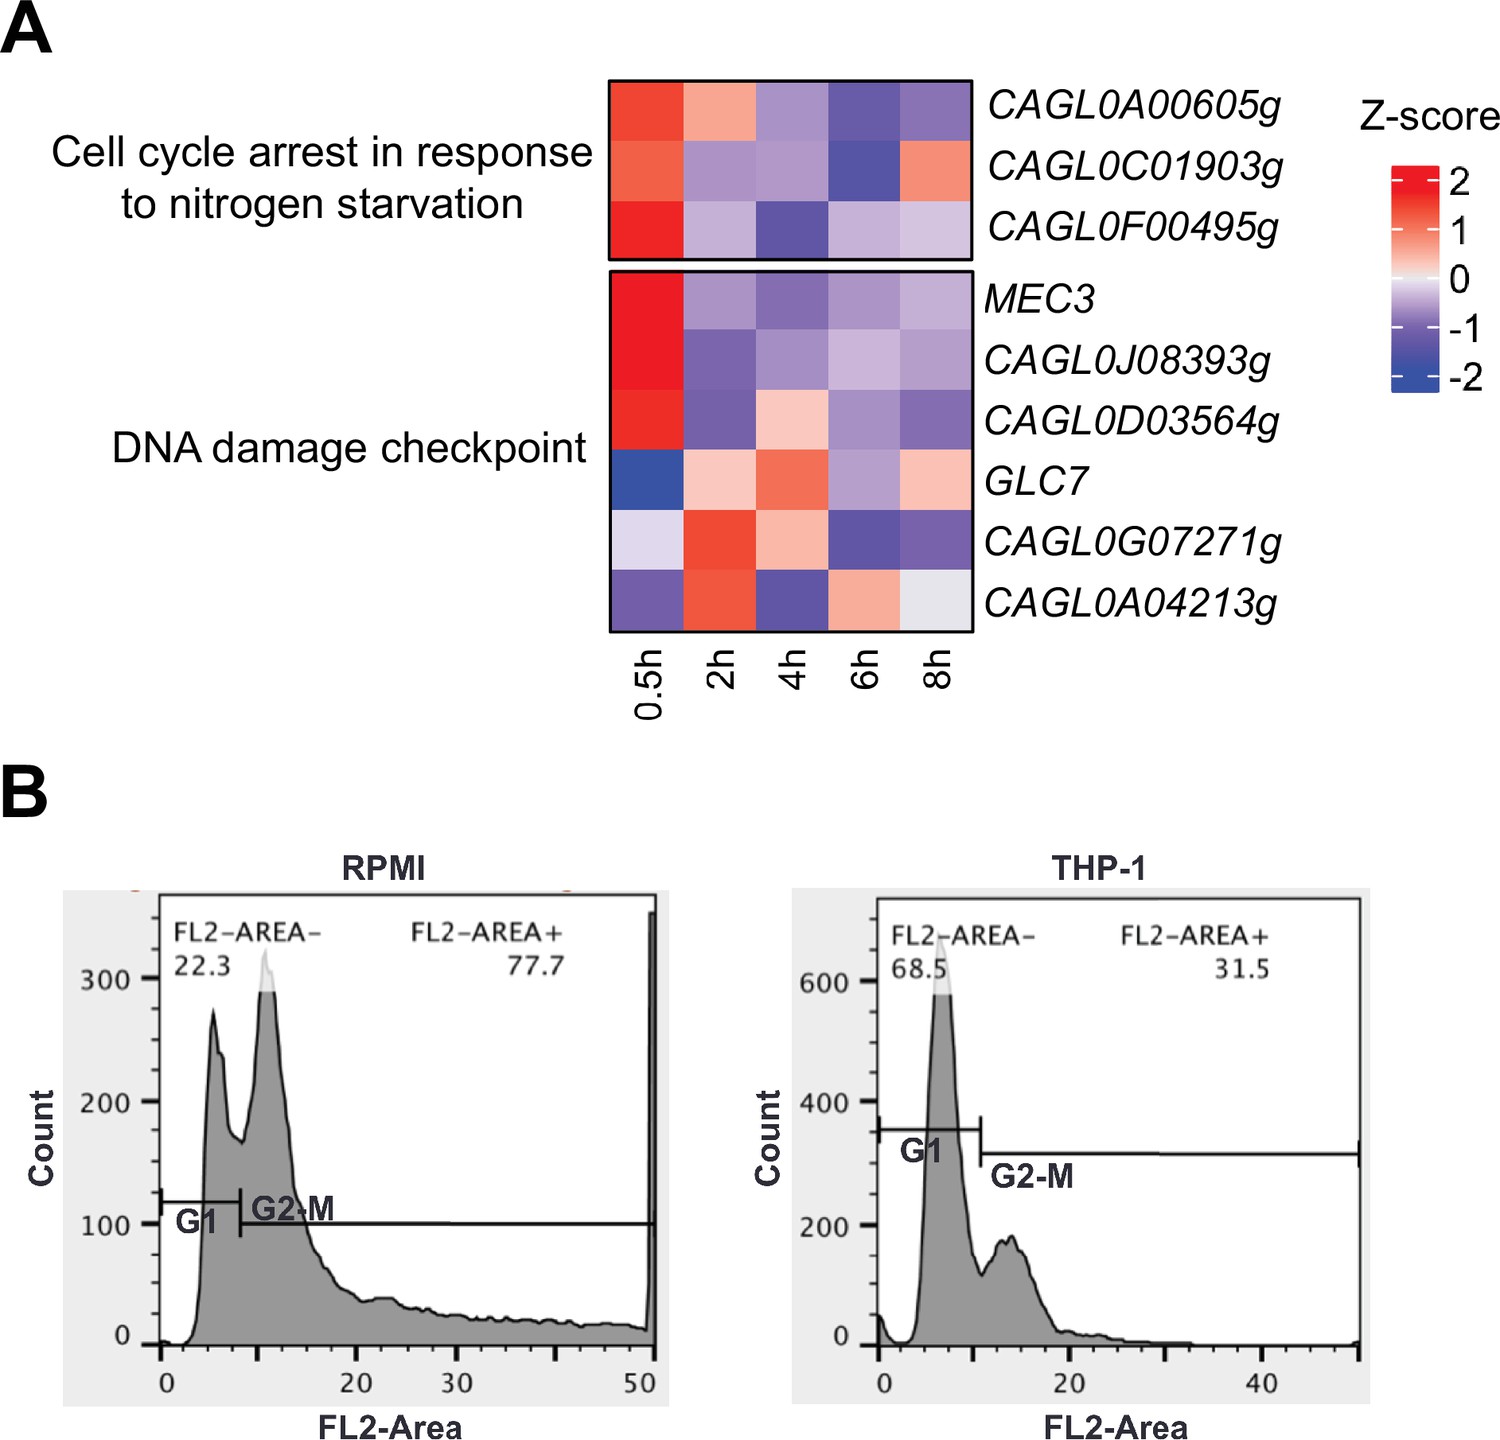
C. glabrata undergoes cell cycle arrest upon macrophage phagocytosis.
(A) Heatmaps showing the expression pattern for cell cycle and DNA damage checkpoint genes during macrophage infection. The colour scale represents the Z-score of the normalized RNA polymerase II (RNAPII) Chromatin Immuno-precipitation followed by the Next Generation Sequencing (ChIP-seq) signal. (B) A density plot displaying the distribution of C. glabrata cells at different cell cycle stages based on FACS analysis at 2 hr after THP-1 macrophage infection.
Figure 1—figure supplement 3
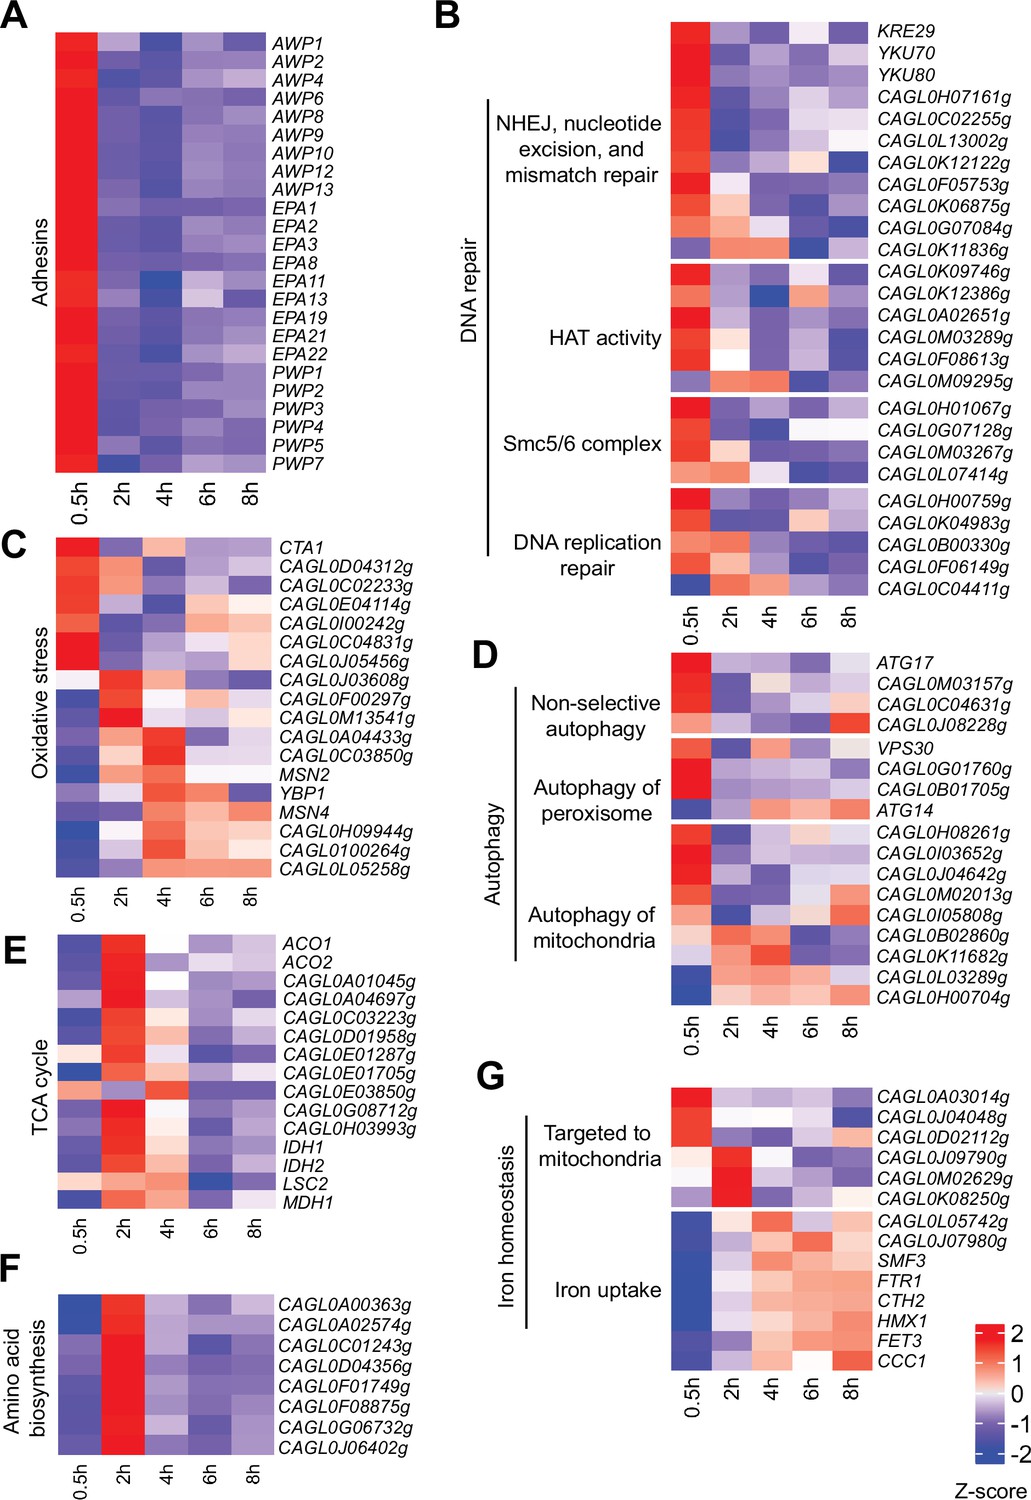
Virulence-centric biological processes are temporally activated in C.glabrata at different stages of macrophage infection.
(A–G) Heatmaps displaying the expression pattern for genes associated with biological processes (A) Adhesion, (B) DNA repair, (C) Response to oxidative stress, (D) Autophagy, (E) tricarboxylic acid (TCA) cycle, (F) Amino acid biosynthesis, and (G) Iron homeostasis during THP-1 macrophage infection. The colour scale represents the Z-score of the normalized RNA polymerase II (RNAPII) Chromatin Immuno-precipitation followed by the Next Generation Sequencing (ChIP-seq) signal.
Figure 1—figure supplement 4
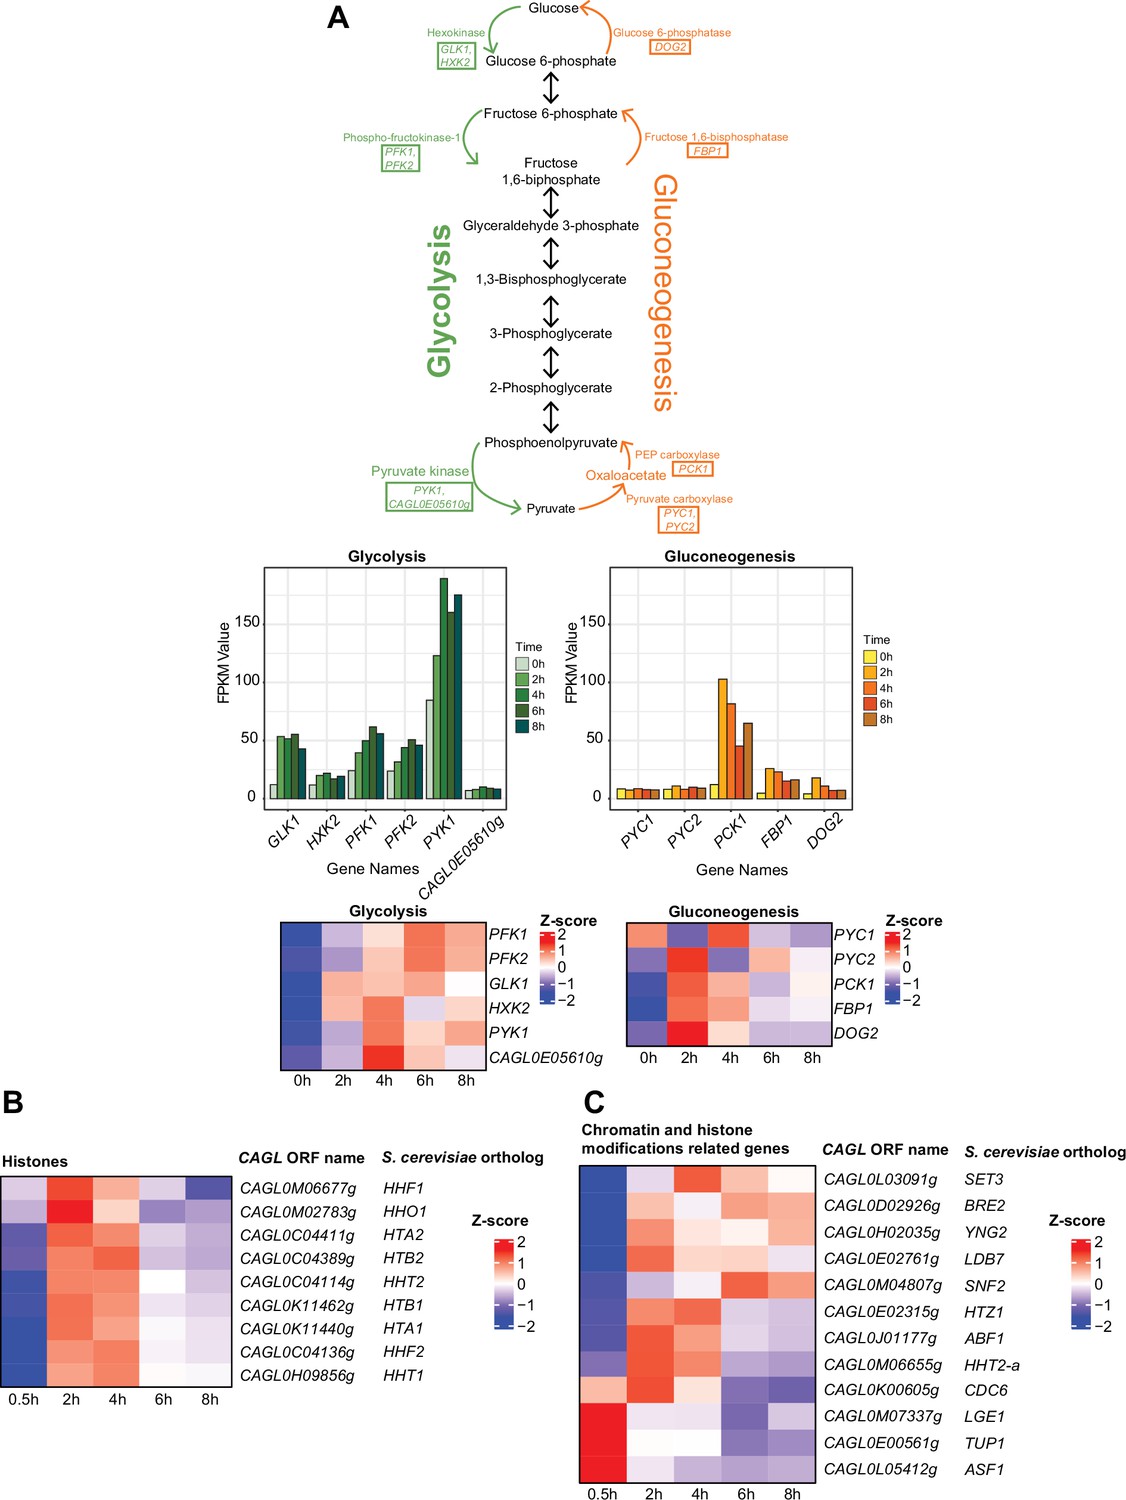
Genes encoding histones or proteins involved in glycolysis, gluconeogenesis pathways, and chromatin modification and remodelling are transcriptionally induced in C. glabrata during the macrophage infection.
(A) Pathway maps showing the enzymes in rate-limiting steps of glycolysis and gluconeogenesis reactions, bar charts, and heatmaps displaying the changes in expression levels for glycolysis and gluconeogenesis genes. The enzymes taking part in the irreversible rate-limiting steps are highlighted in the boxes of the pathway maps. The bar charts present the expression pattern in FPKM values. The heatmaps present the expression pattern in the Z-score of the normalized RNA polymerase II (RNAPII) Chromatin Immuno-precipitation followed by the Next Generation Sequencing (ChIP-seq) signal. (B, C) Heatmaps showing the expression pattern for (B) histone H2A, H2B, H3, and H4 genes and putative (C) chromatin and histone modifiers genes during THP-1 macrophage infection. The colour scale represents the Z-score of the normalized RNAPII ChIP-seq signal.
Figure 1—figure supplement 5
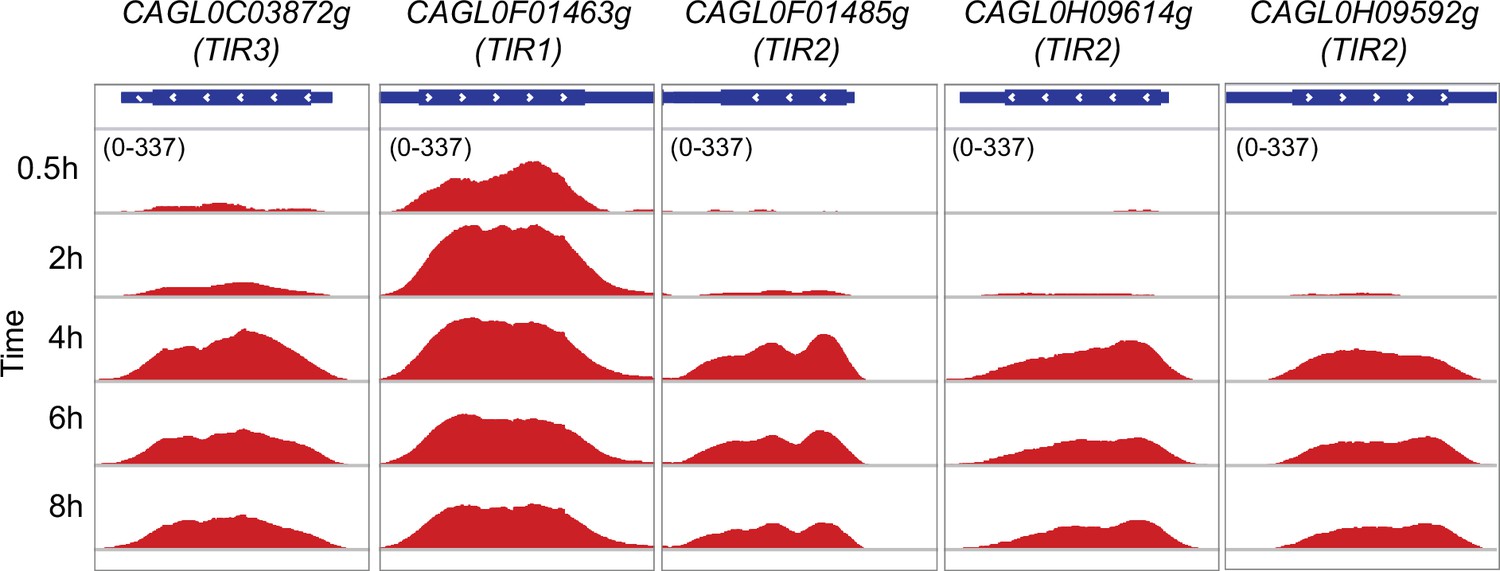
Tip1-related (TIR) family genes for sterol uptake displaying co-expression during macrophage infection.
Genome browser screenshots showing RNA polymerase II (RNAPII) Chromatin Immuno-precipitation followed by the Next Generation Sequencing (ChIP-seq) profile on putative TIR family genes for sterol uptake during THP-1 macrophage infection.
Figure 1—figure supplement 6
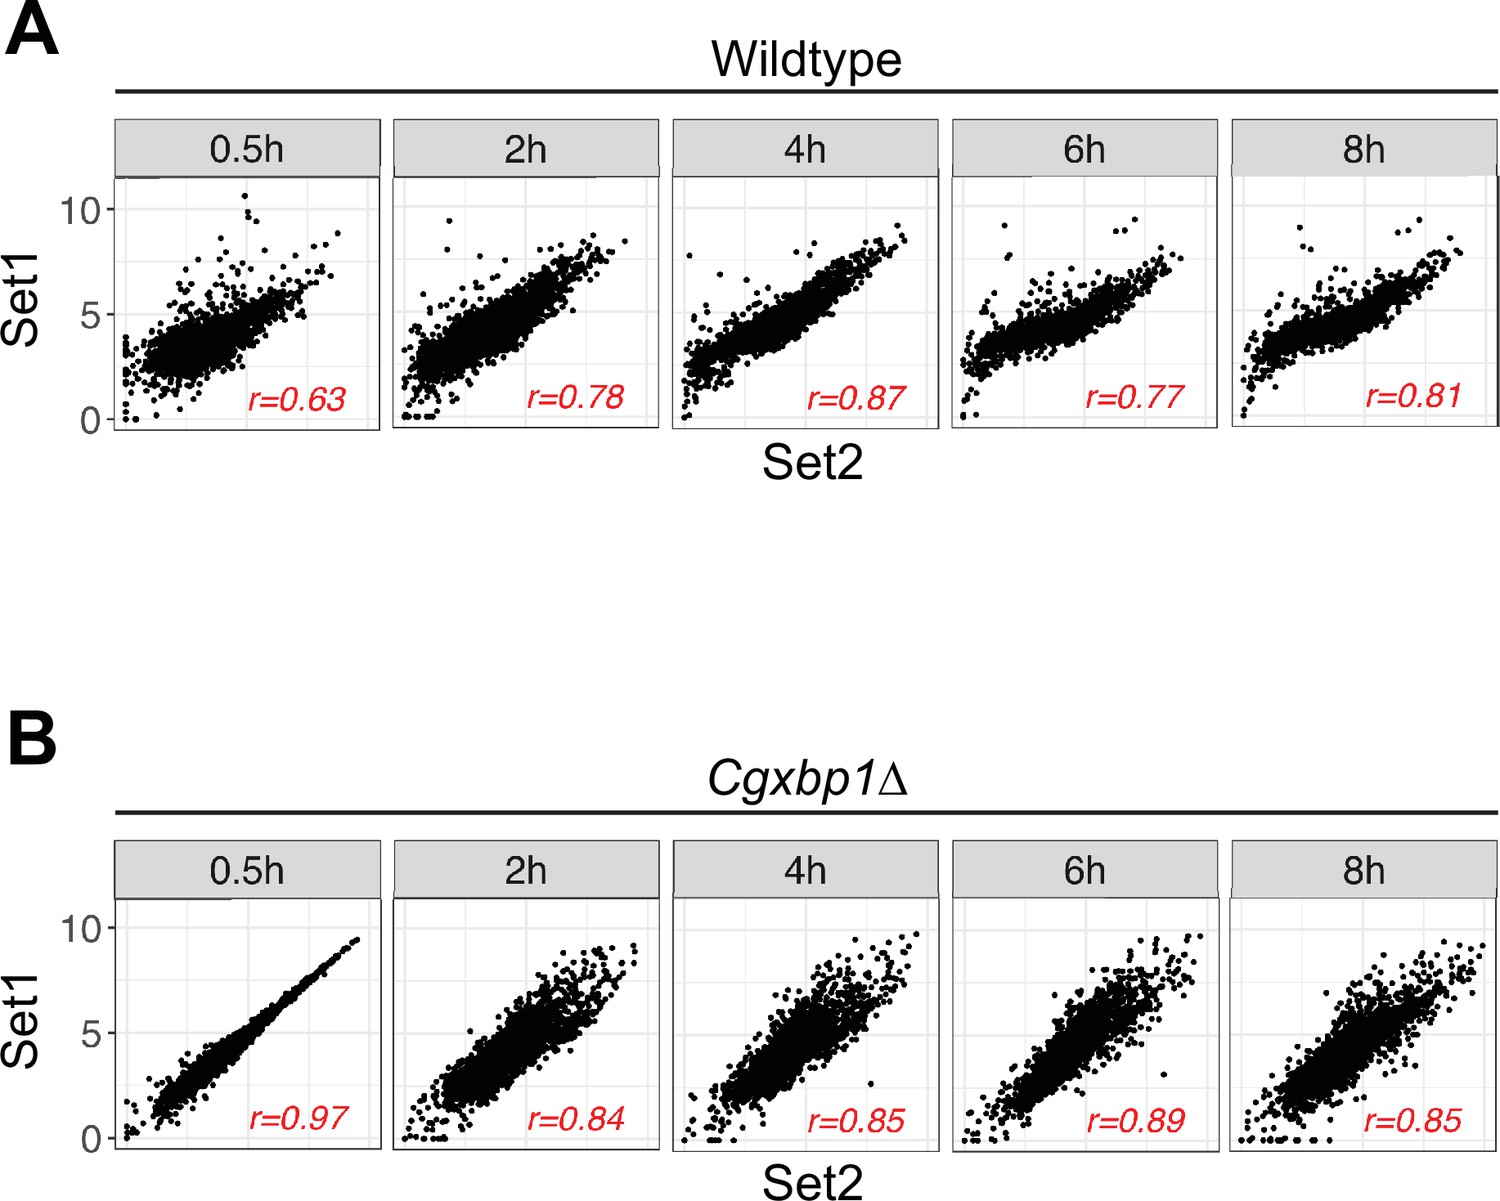
Correlation between independent biological repeats of the RNA polymerase II (RNAPII) Chromatin Immuno-precipitation followed by the Next Generation Sequencing (ChIP-seq) experiment for wild-type and the Cgxbp1∆ mutant.
(A, B) Scatterplots showing RNAPII ChIP-seq signals between two independent biological repeats for (A) wild-type and (B) the Cgxbp1∆ mutant at the indicated times. The correlation coefficient (r) for each comparison is presented.
Figure 2 with 2 supplements
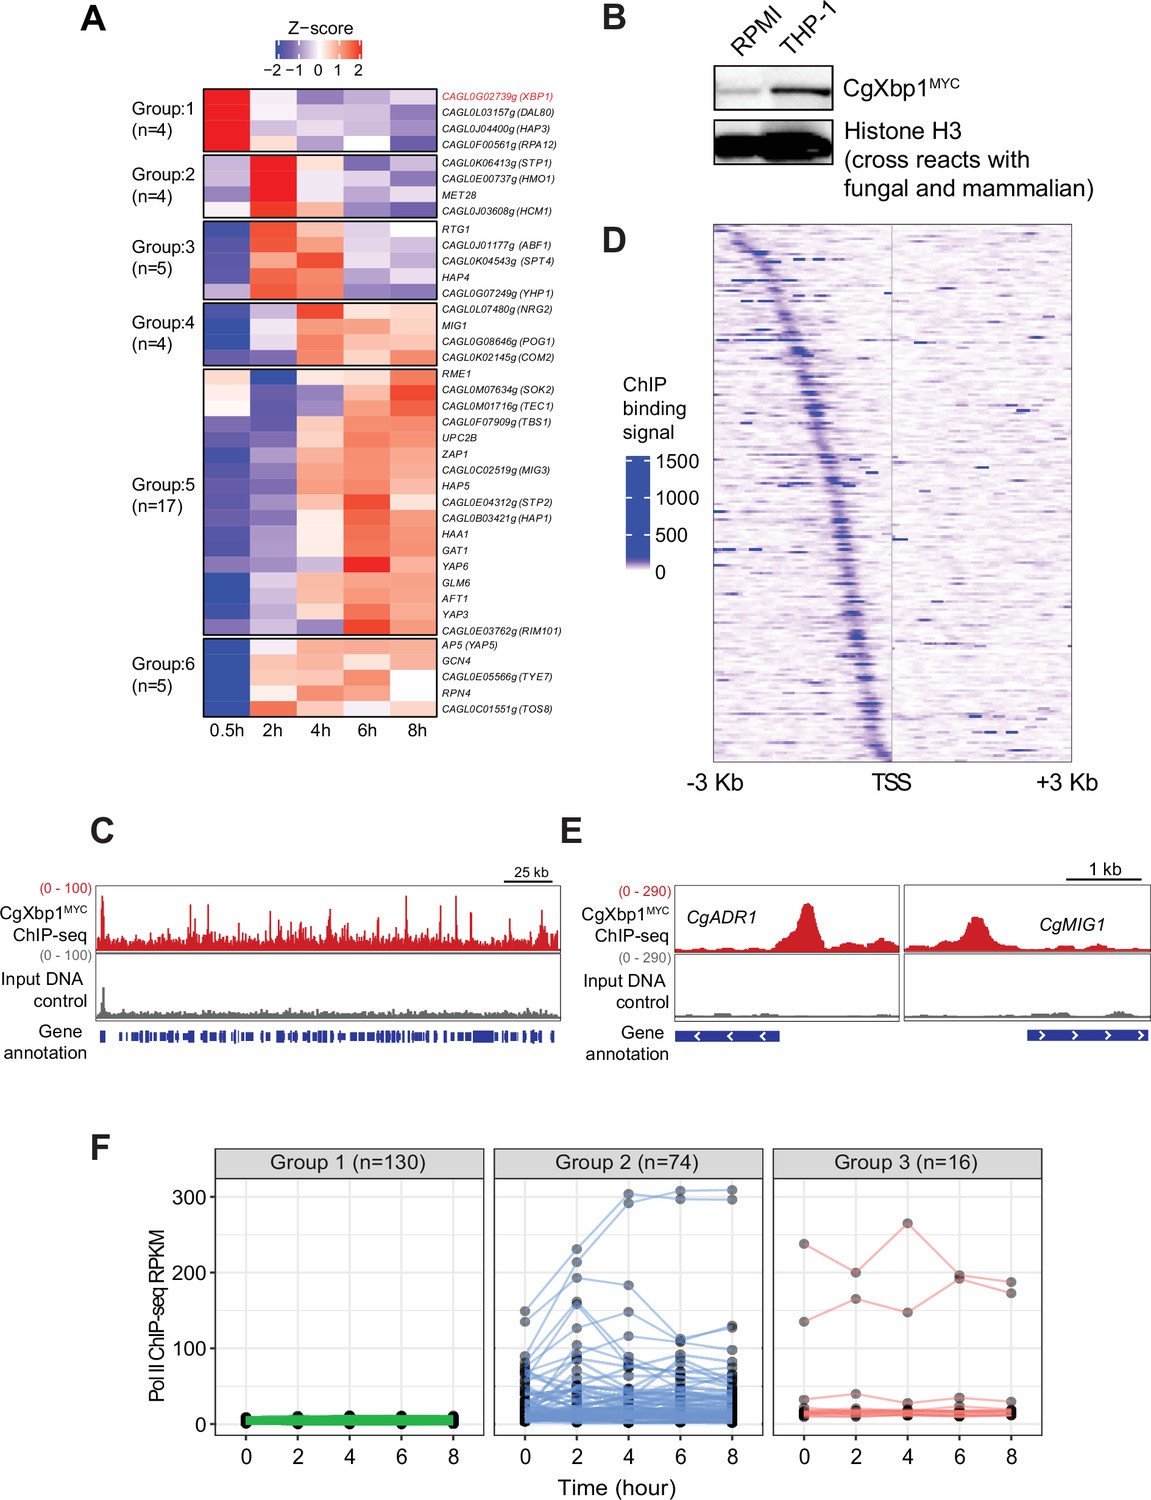
CgXbp1 is central in orchestrating the dynamic transcriptional response of C.glabrata during macrophage infection.
(A) A heatmap showing temporal expression patterns of C. glabrata transcription factor genes transcribed during THP-1 macrophage infection. Color scale represents the Z-score of the normalized RNAPII ChIP-seq signal. The groups of temporally induced genes were determined by k-means clustering. (B) Western blot analysis of CgXbp1 expression during THP1 macrophage infection. (C) Representative genome-browser screenshots showing CgXbp1MYC ChIP-seq signal on a chromosomal region. (D) A Heat map of ChIP-seq signals on promoters of CgXbp1 target genes. The colour scale indicates normalized ChIP-seq signal on 3 kb upstream and downstream flanking regions from the transcription start site (TSS) of the target genes. (E) Representative genome-browser screenshots showing CgXbp1MYC ChIP-seq signal on the promoters of CgMIG1 and CgADR1. (F) CgXbp1 target genes displaying RNAP II binding signal at indicated time points during macrophage infection. The groups were classified based on gene expression patterns. Group 1 includes minimally transcribed genes with FPKM values less than 12. Group 2 contains the genes with FPKM values greater than 12 and a highly variable expression pattern (fold change between maximum and minimum is greater than 1.5). Group 3 involves the genes with FPKM greater than 12 but less variable expression levels (fold change between maximum and minimum is less than 1.5).
-
Figure 2—source data 1
Original files for the western blots shown in Figure 2B.
- https://cdn.elifesciences.org/articles/73832/elife-73832-fig2-data1-v2.zip
-
Figure 2—source data 2
A Microsoft Word file containing original western blots for Figure 2B, indicating the relevant bands and treatments.
- https://cdn.elifesciences.org/articles/73832/elife-73832-fig2-data2-v2.zip
Figure 2—figure supplement 1
CgXbp1 is a key transcription regulator of the temporal transcriptional response of C.glabrata during macrophage infection.
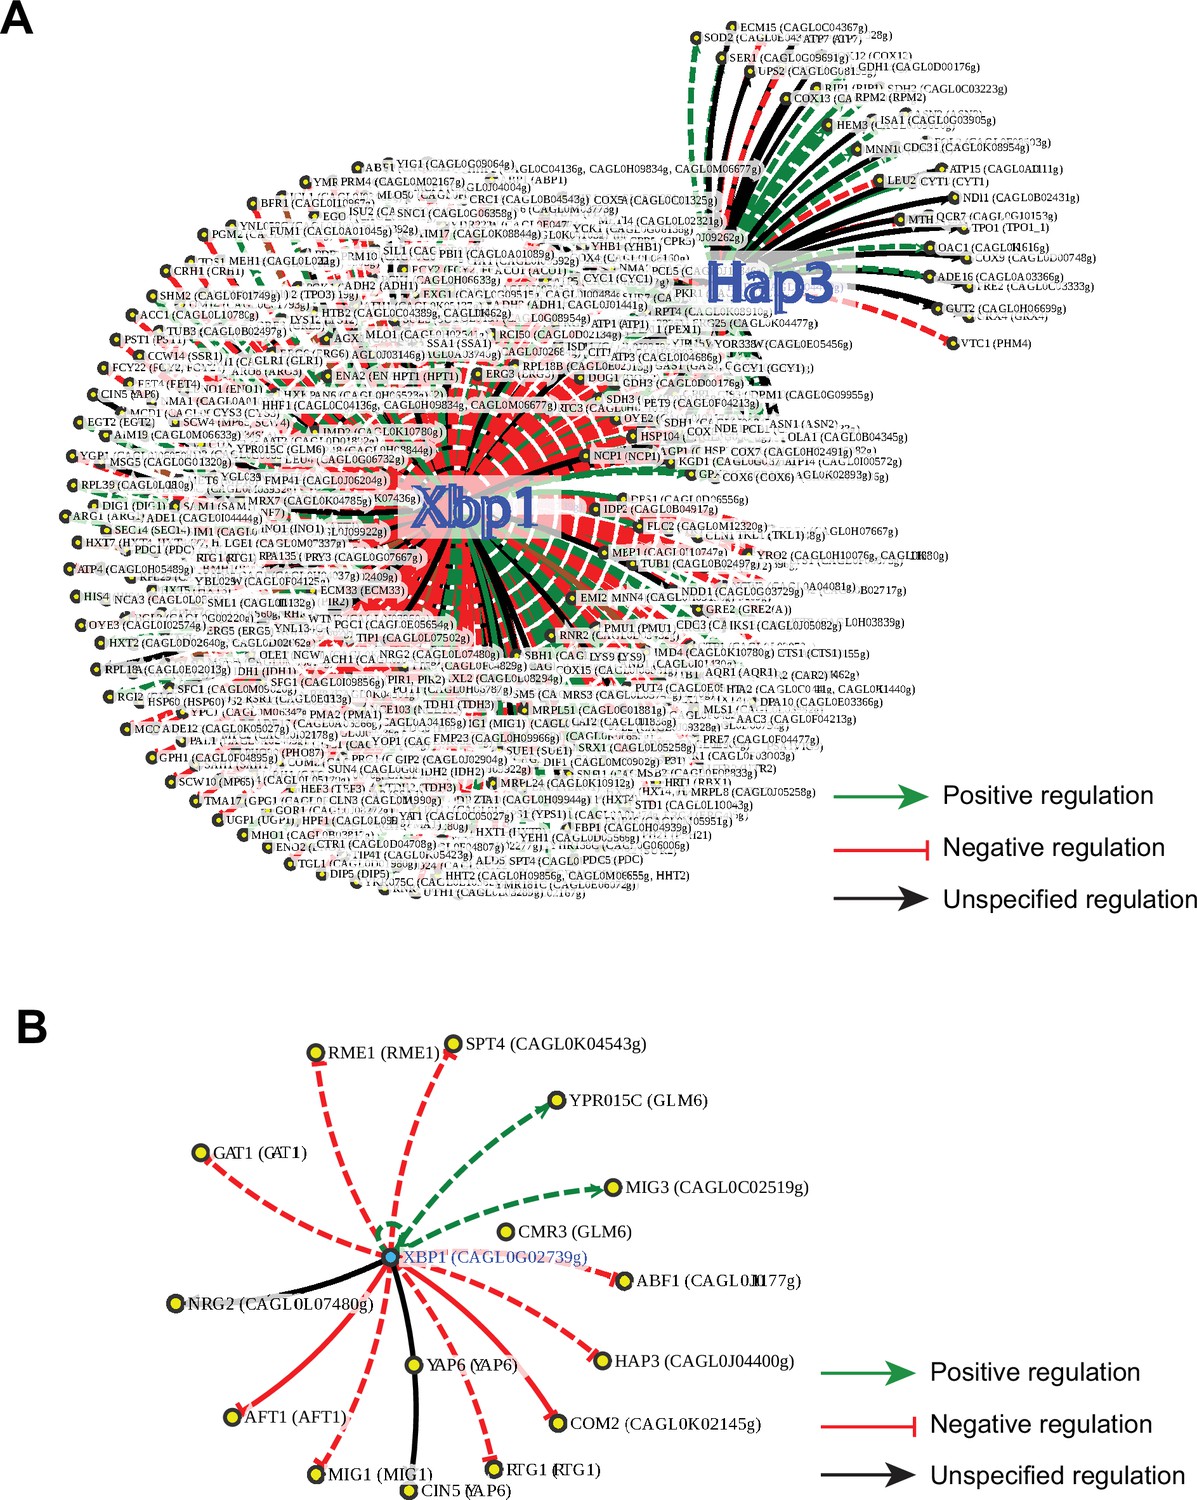
(A) A regulatory network of Xbp1 and Hap3 for the orthologue of macrophage infection-induced genes in S. cerevisiae based on published regulatory information available on the PathoYeastract database. Green, red, and black arrows indicate positive, negative, and unspecified regulation, respectively. Solid and dashed lines represent DNA binding or expression-based evidence, respectively. (B) A regulatory network of CgXBP1 for a subset of infection-induced transcription factor (TF) genes based on published regulatory information available on the PathoYeastract database.
Figure 2—figure supplement 2
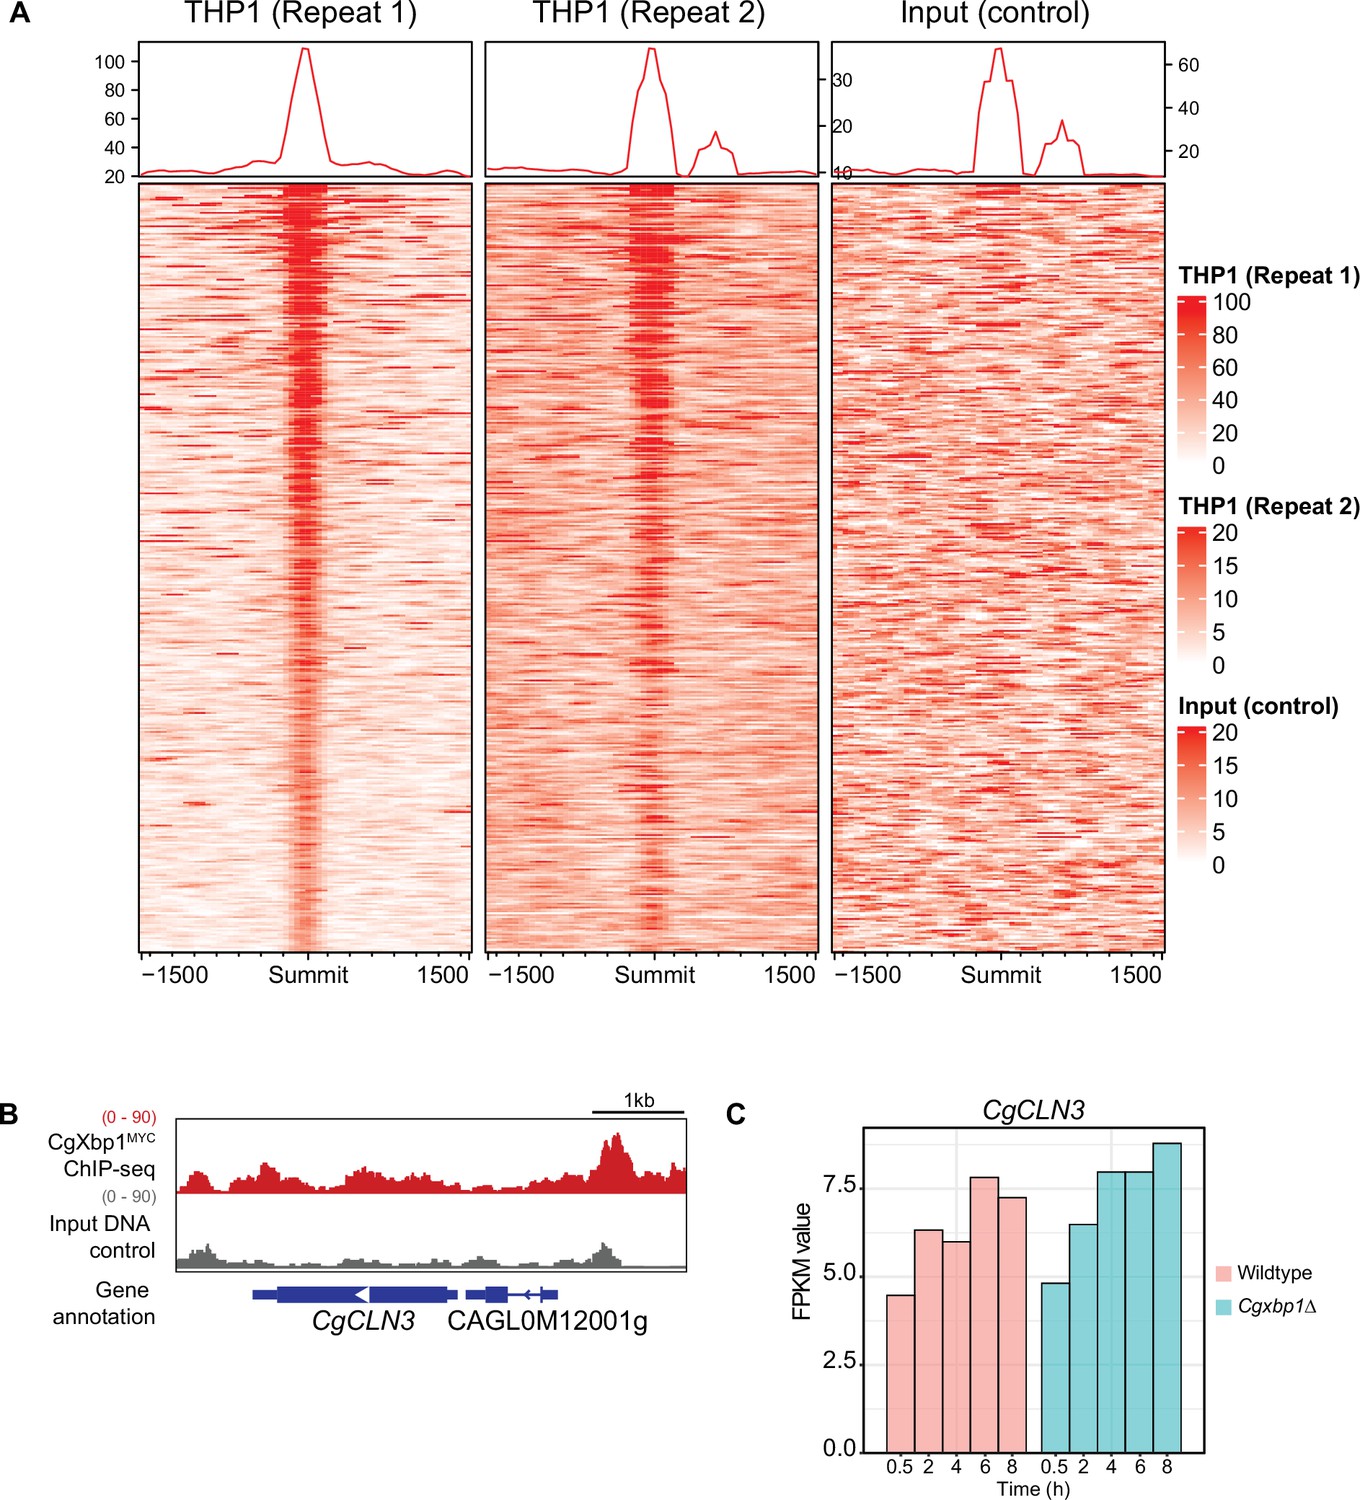
CgXbp1MYC ChIP-seq binding signals during macrophage infection.
(A) Heatmap showing ChIP-seq signals on CgXbp1MYC peak summits and 1500 bp flanking regions for two independent biological repeats and the input control. (B) A genome browser screenshot showing CgXbp1 and input Chromatin Immuno-precipitation followed by the Next Generation Sequencing (ChIP-seq) profile on the CgCLN3 gene during THP-1 macrophage infection. (C) A histogram showing RNA polymerase II (RNAPII) ChIP-seq signals of CgCLN3 during macrophage infection.
Figure 3 with 1 supplement
Loss of CgXBP1 affects the expression level and timing of multiple genes of diverse physiological pathways upon macrophage phagocytosis.
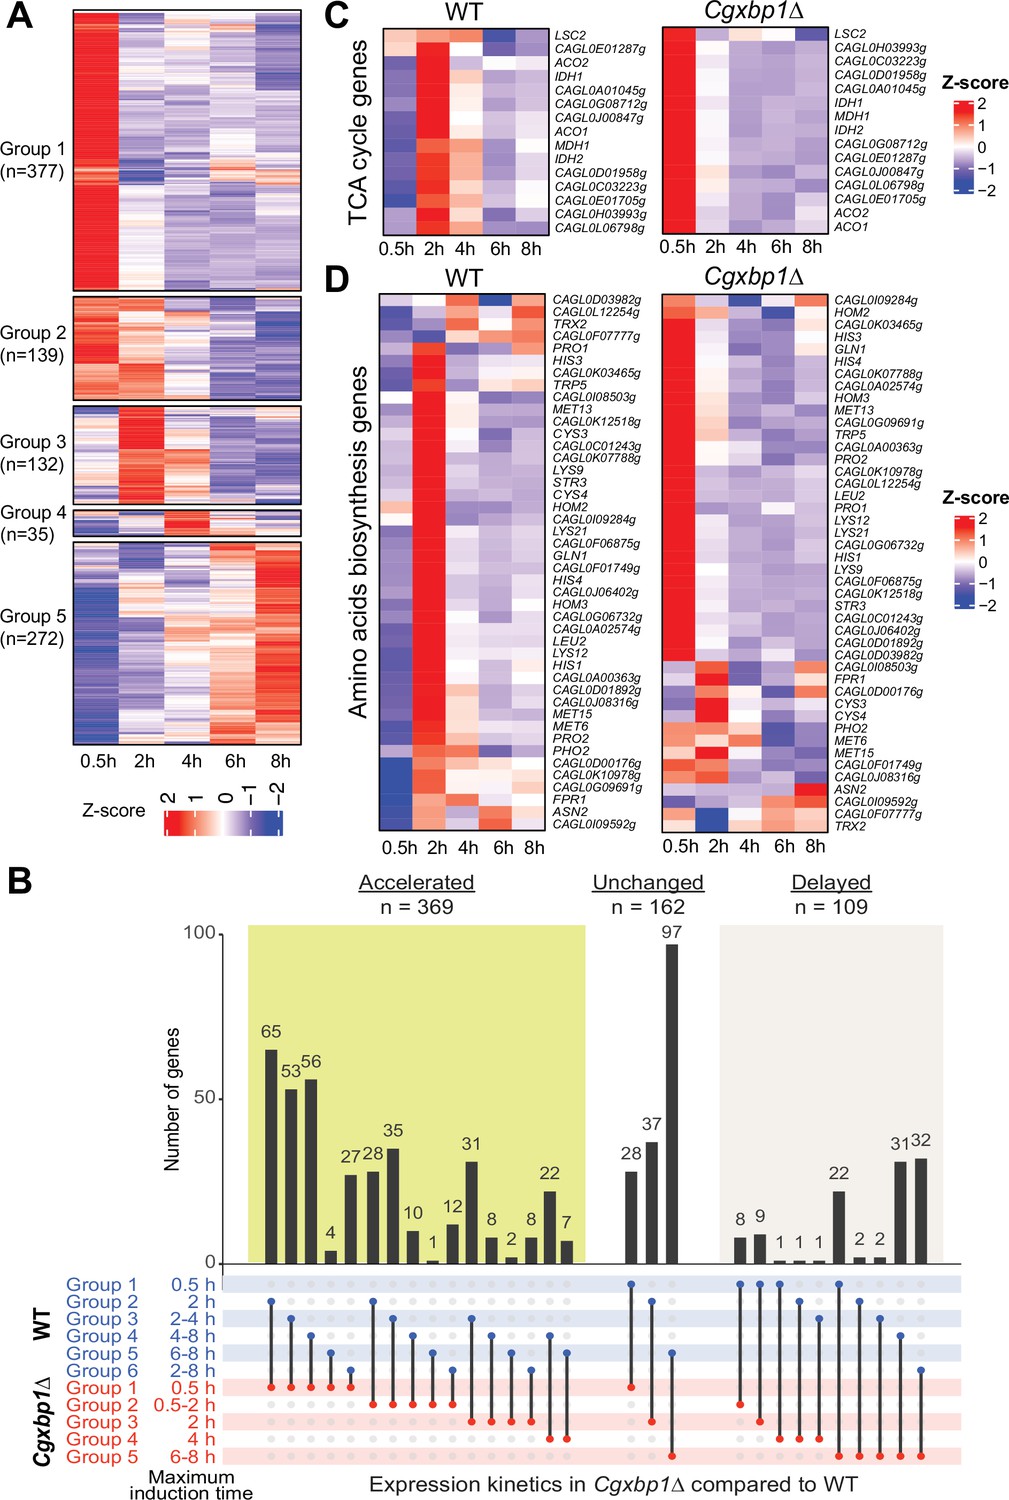
(A) A heatmap showing temporal expression patterns of transcribed genes in the Cgxbp1∆ mutant during 0.5–8 hr THP-1 macrophage infection in a time-course experiment. Groups were assigned by k-means clustering. (B) An UpSet plot showing the number of genes induced at the indicated time points in wild-type (WT) and the Cgxbp1∆ mutant during THP-1 macrophage infection. (C and D) Heat maps showing transcription activities of genes belonging to (C) tricarboxylic acid (TCA) and (D) amino acid biosynthesis during THP1 macrophage infection in wild-type and the Cgxbp1∆ mutant.
Figure 3—figure supplement 1
CgXbp1 is essential for the chronological transcriptional response of C. glabrata during macrophage infection.
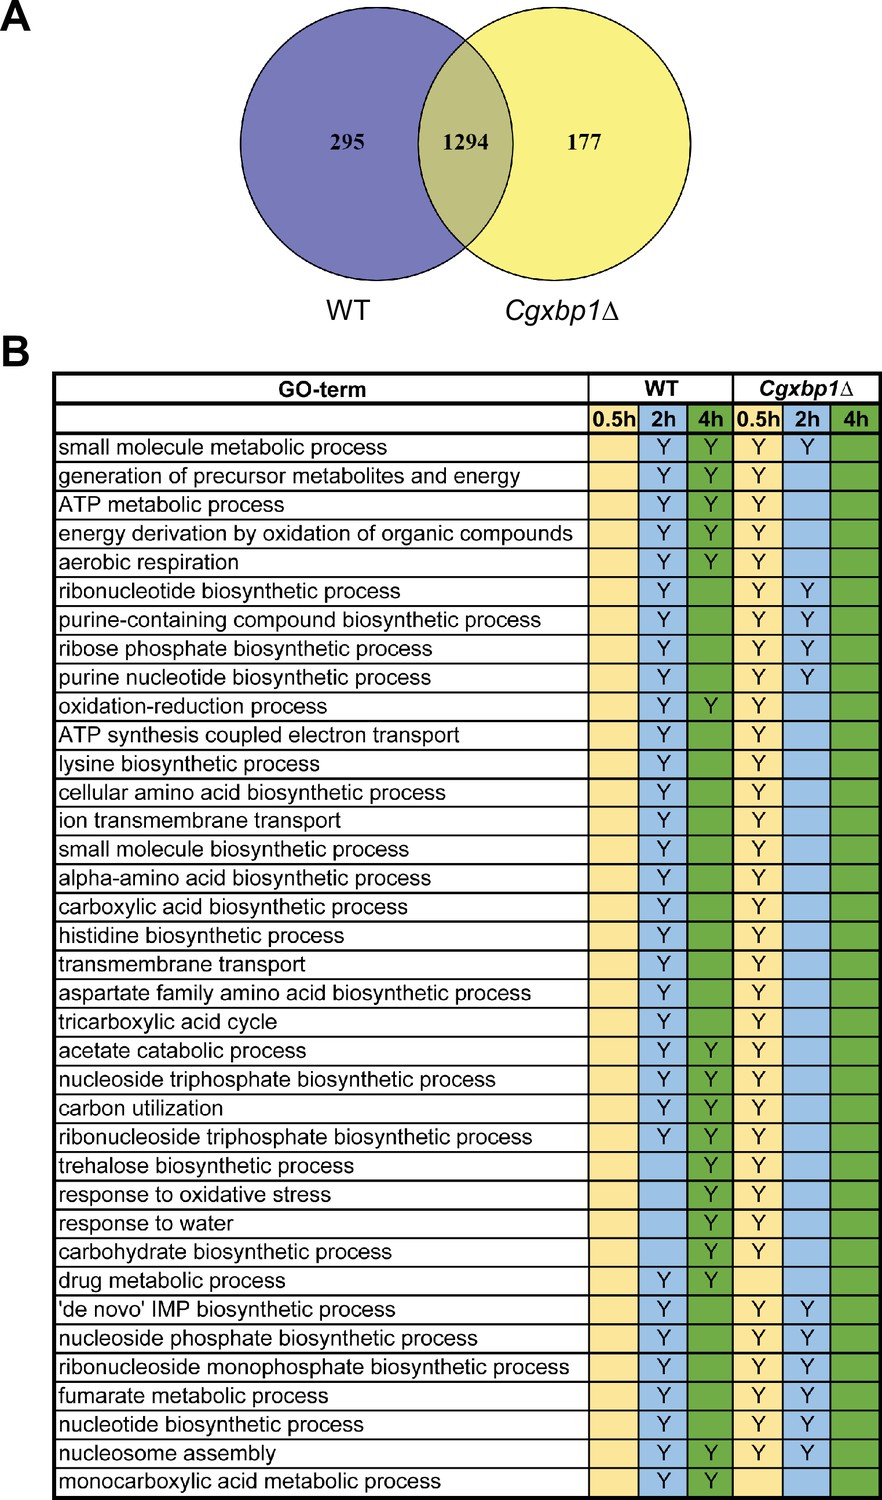
(A) Venn diagram of actively transcribing genes in wild-type and the Cgxbp1∆ mutant during macrophage infection. (B) A table summarises the enrichment of gene ontology (GO)-terms among the transcribed C. glabrata genes at the indicated time points during THP-1 macrophage infection by wild type and the Cgxbp1∆ mutant. ‘Y’ indicates a statistically significant enrichment (p-value <0.05) in a given GO term, while a blank box means no significant enrichment.
-
Figure 3—figure supplement 1—source data 1
Table shown in Figure 3—figure supplement 1B.
- https://cdn.elifesciences.org/articles/73832/elife-73832-fig3-figsupp1-data1-v2.docx
Figure 4 with 1 supplement
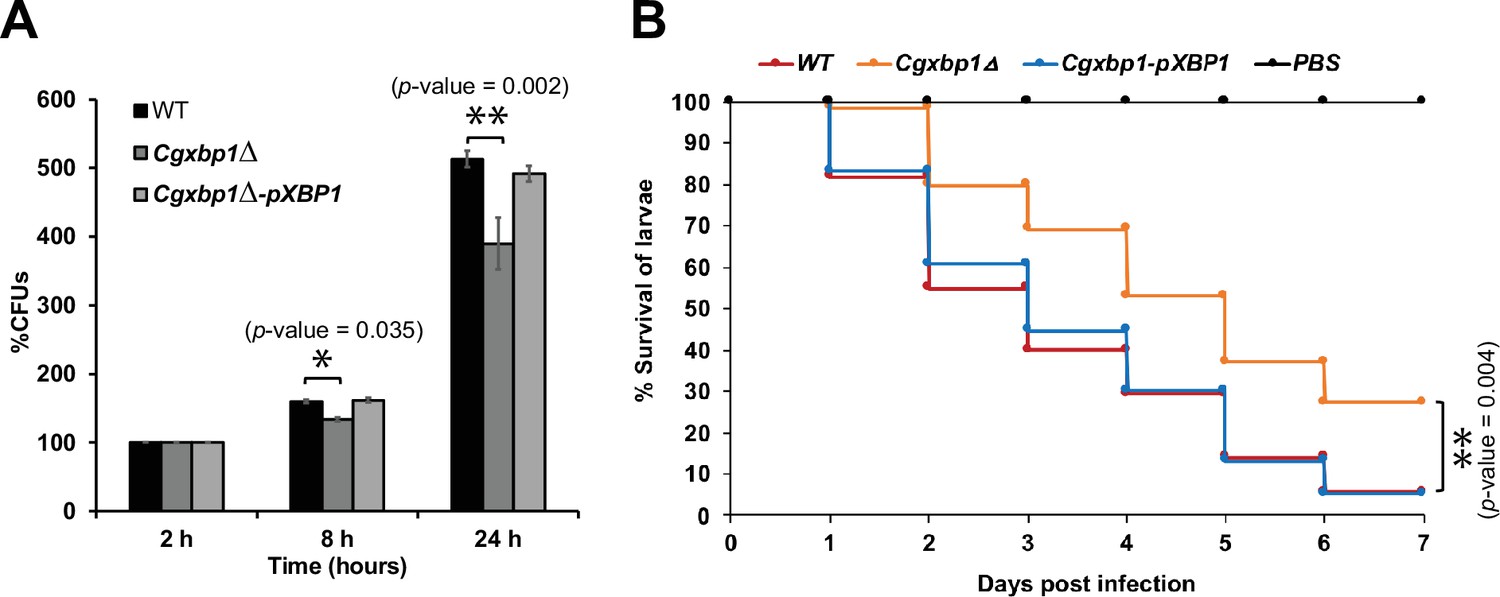
Loss of CgXBP1 affects C. glabrata proliferation in human macrophages and attenuates virulence in the Galleria mellonella model of candidiasis.
(A) Bar chart of colony forming units (CFUs) obtained from C. glabrata cells harvested from THP-1 macrophages at indicated time points. Error bars represent the standard error of the mean (± SEM) from three independent experiments. Statistical significance was determined by two-sided unpaired Student’s t-test, p-value ≤0.05, p-value ≤0.01. (B) Cumulative survival curve of G. mellonella larvae infected with indicated C. glabrata strains. At least 16 larvae were used in each of the three independent infection experiments. The graph represents the percent survival of larvae infected with the indicated strains from three independent infection experiments. Statistical significance was determined by a two-sided unpaired Student’s t-test, p-value ≤0.01.
Figure 4—figure supplement 1
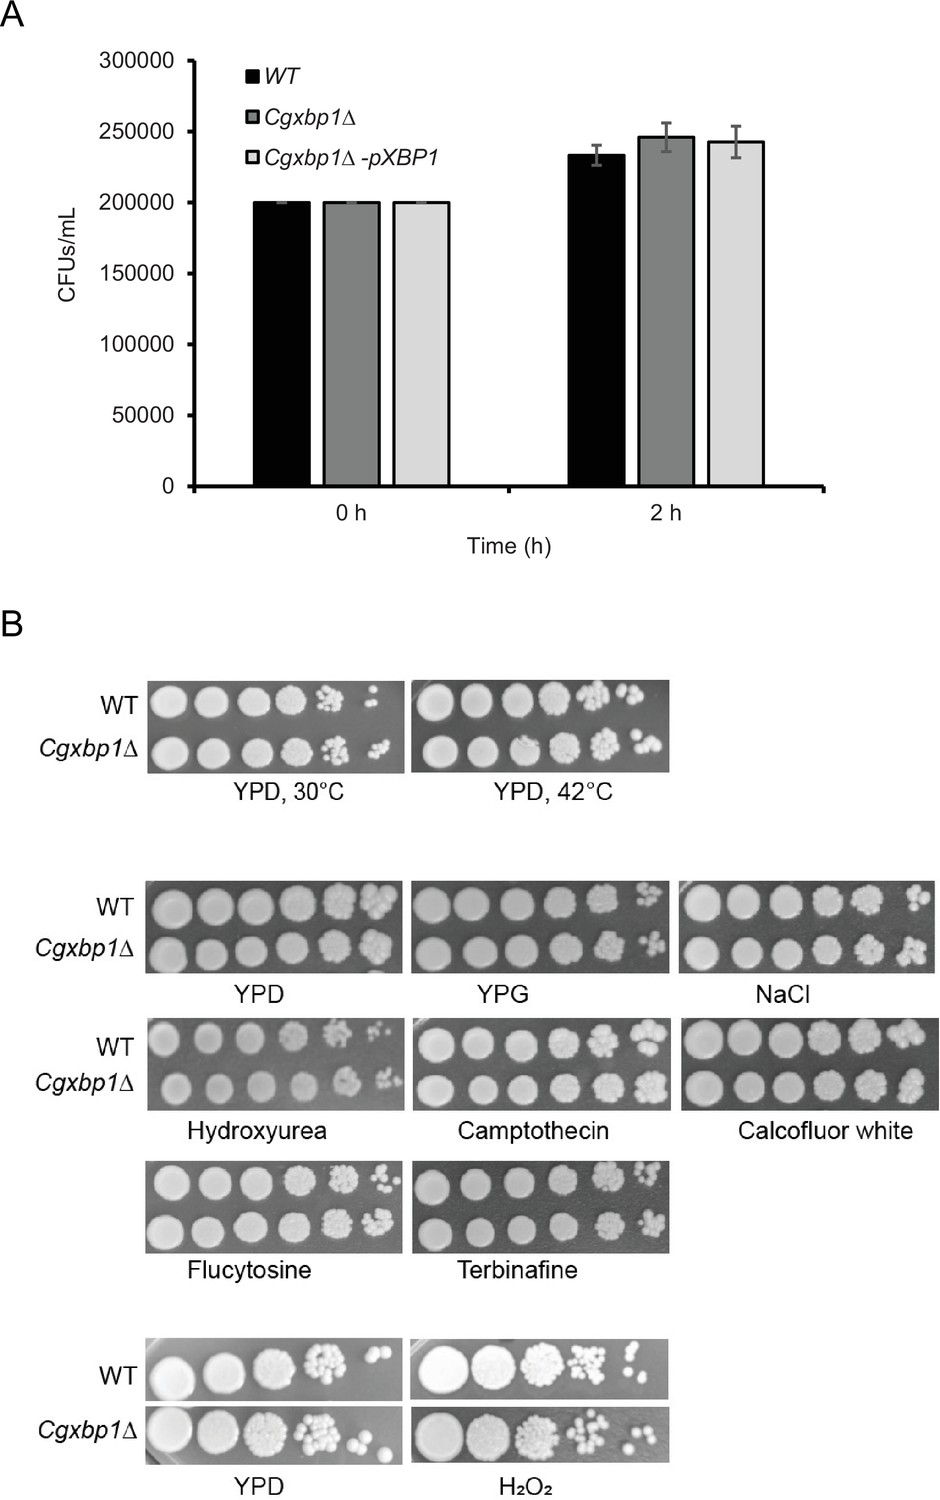
Phagocytosis rate is not affected by CgXbp1 deletion.
(A) Bar diagram displaying colony forming units obtained before macrophage infection and 2 hr post-infection. Error bars represent mean ± standard deviation from three independent experiments. (B) Serial dilution spotting assay of wild-type and the Cgxbp1∆ mutant on indicated growth medium and presence of environmental stressors.
Figure 5
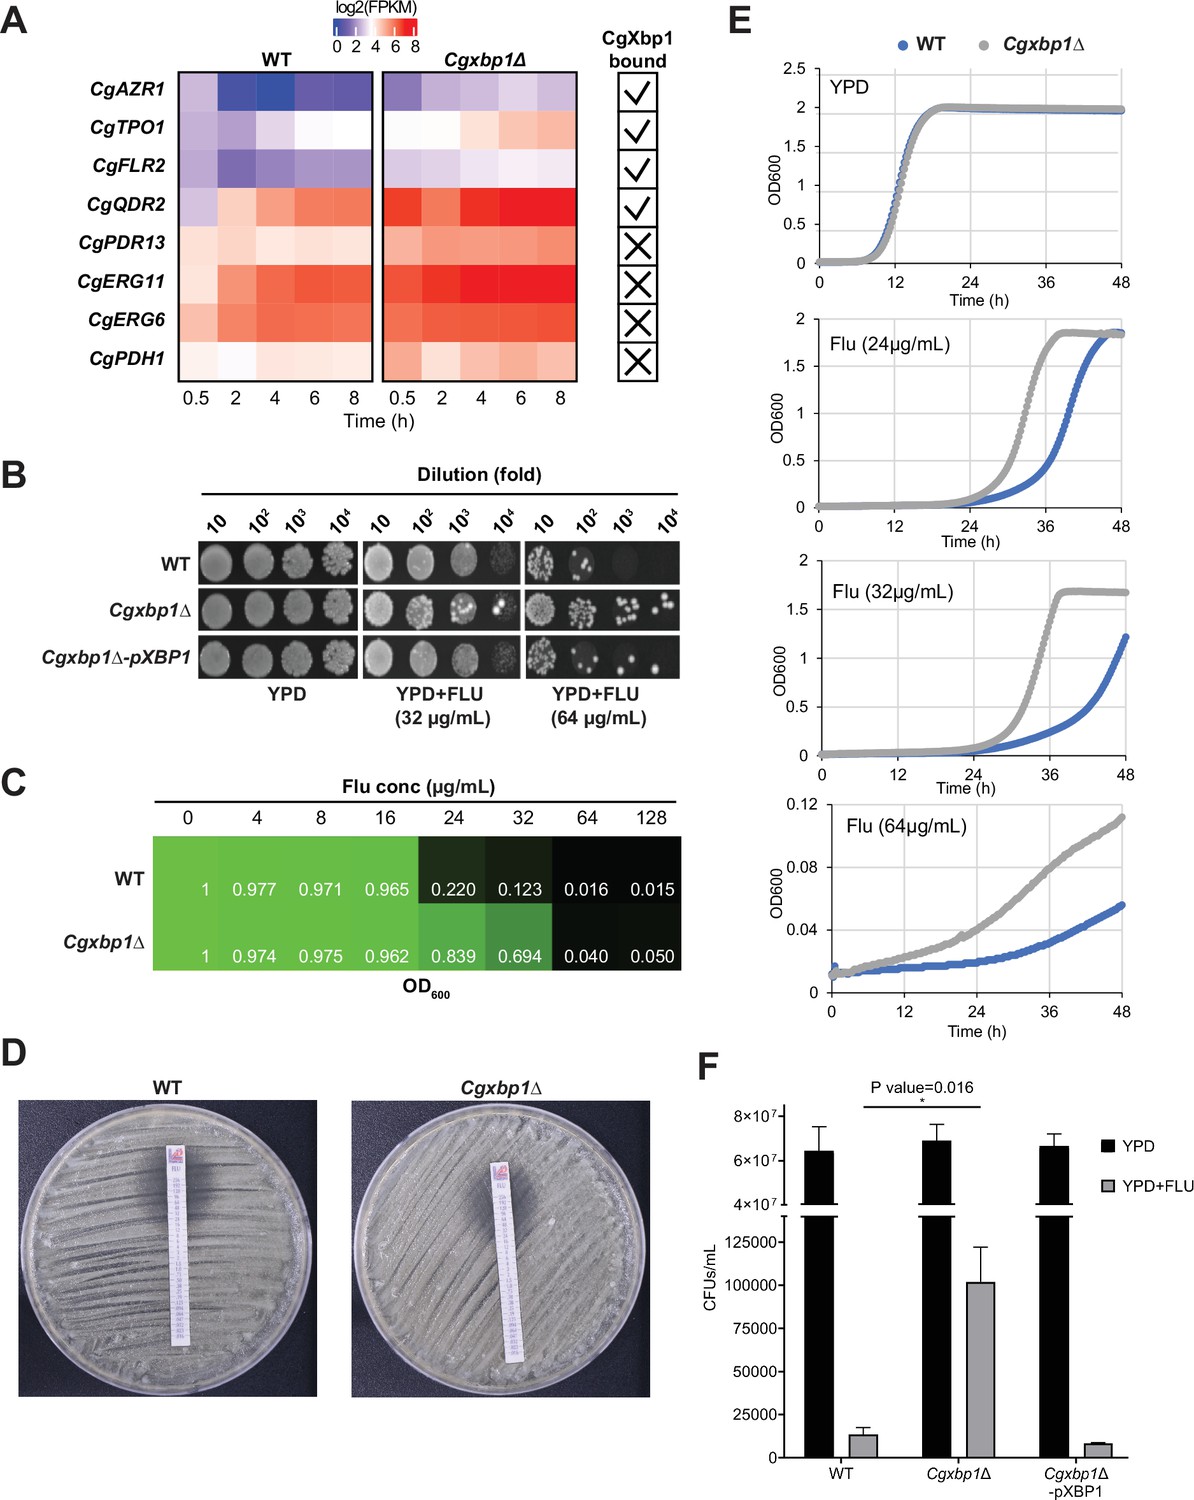
CgXbp1 regulates fluconazole resistance in C. glabrata.
(A) Heatmap showing the genes related to fluconazole resistance with misregulated expression pattern in Cgxbp1∆ mutant. The ticks and crosses inside the boxes are displaying whether the gene is bound by CgXbp1. (B) Serial dilution spotting assay on YPD medium in the presence of different fluconazole concentrations (0, 32, or 64 µg/mL). (C) MIC50 assay displaying growth of wild-type and Cgxbp1∆ mutant strains at indicated fluconazole concentration. (D) MIC50 determination using fluconazole strips for wild-type and Cgxbp1∆ mutant strains. (E) Growth curve of wild-type and Cgxbp1∆ mutant in YPD medium in the presence or absence of fluconazole (24, 32, 64 µg/mL). (F) Bar graph displaying CFUs/mL obtained for indicated strains on YPD agar plates in the presence or absence of fluconazole (64 µg/mL) post 3 days of spread plating. Error bars represent mean ± SEM from three independent experiments. Statistical significance was determined by a two-sided unpaired Student’s t-test, p-value ≤0.05.
Figure 6 with 2 supplements
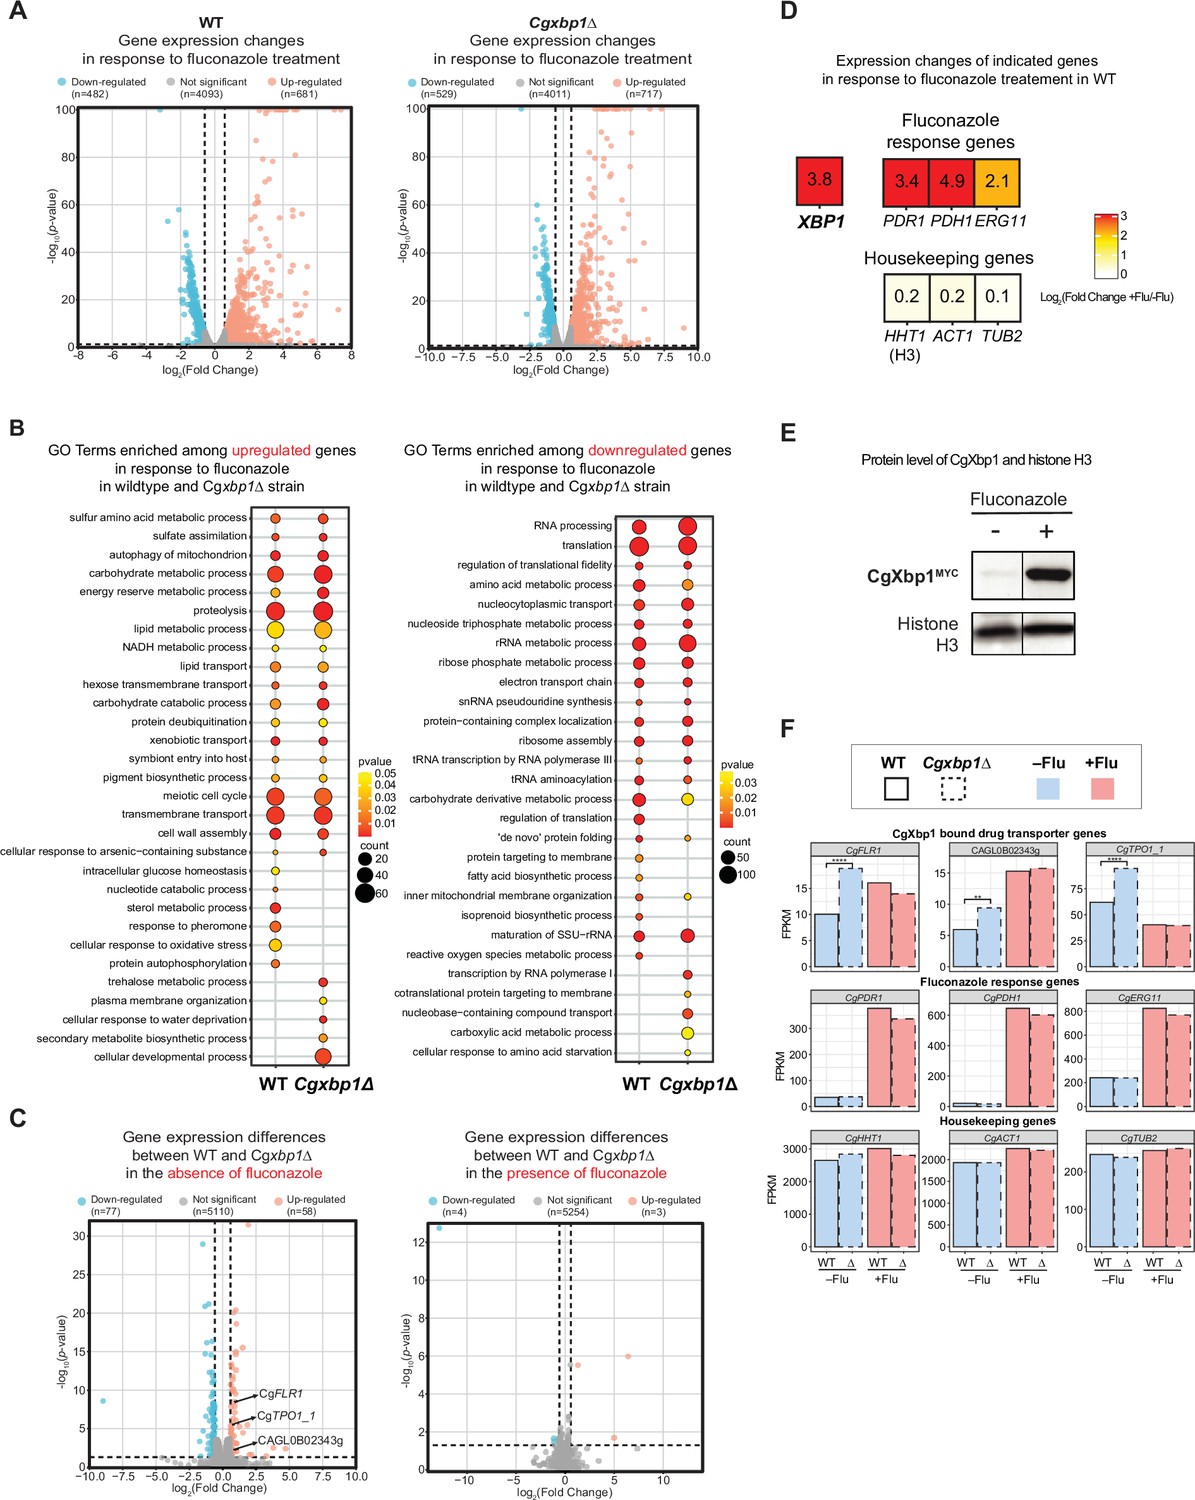
RNAseq analysis revealed up-regulation of drug transporters in Cgxbp1∆.
(A) Volcano plots showing expression changes of all genes and their p-values in wild-type and Cgxbp1∆ strains grown under conditions with and without fluconazole. Down- and up-regulated genes are coloured blue and red, respectively, while genes with no significant change in expression are in gray. The number of genes in each group is indicated in parentheses. (B) GO terms enriched among the up- (left panel) and down-regulated (right panel) in response to fluconazole treatment in wild-type and Cgxbp1∆ strains. The colour scale depicts p-values and the size of the circles shows the number of DEGs associated with each gene ontology (GO) term. (C) Volcano plots showing expression changes of all genes and their p-values comparing between wild-type and Cgxbp1∆ strains grown in the absence (left panel) and presence (right panel) of fluconazole. Down- and up-regulated genes are coloured blue and red, respectively, while genes with no significant change in expression are in gray. The number of genes in each group is indicated in parentheses. (D) Heat boxes showing the expression changes of CgXBP1 (XBP1), fluconazole response genes [CgPDR1 (PDR1), CgPDH1 (PDH1), CgERG11 (ERG11)], and housekeeping genes [CgHHT1 (HHT1), CgACT1 (ACT1), CgTUB2 (TUB2)] after fluconazole treatment. The levels of change are expressed in log2 fold change and presented in a coloured scale and within the box. (E) Western Blot showing the expression level of the CgXbp1MYC and histone H3 proteins upon fluconazole treatment. (F) Bar chart displaying the gene expression of drug transporter genes (first row), fluconazole response genes (second row), and housekeeping genes (last row) for wild-type (WT) and Cgxbp1∆ (∆) mutant in the presence or absence of fluconazole. Wild-type and Cgxbp1∆ are framed with solid line borders and dashed line borders, respectively. No fluconazole treatment (-flu) is coloured blue and fluconazole treatment (+flu) is coloured red. Statistical significance was calculated by p-value in DEseq2, **<i>p-value ≤0.01, ****<i>p-value ≤0.0001.
-
Figure 6—source data 1
Original files for the western blots shown in Figure 6E.
- https://cdn.elifesciences.org/articles/73832/elife-73832-fig6-data1-v2.zip
-
Figure 6—source data 2
A Microsoft Word file containing original western blots for Figure 6E, indicating the relevant bands and treatments.
- https://cdn.elifesciences.org/articles/73832/elife-73832-fig6-data2-v2.zip
Figure 6—figure supplement 1
Cgxbp1 deletion does not affect the overall fluconazole response.
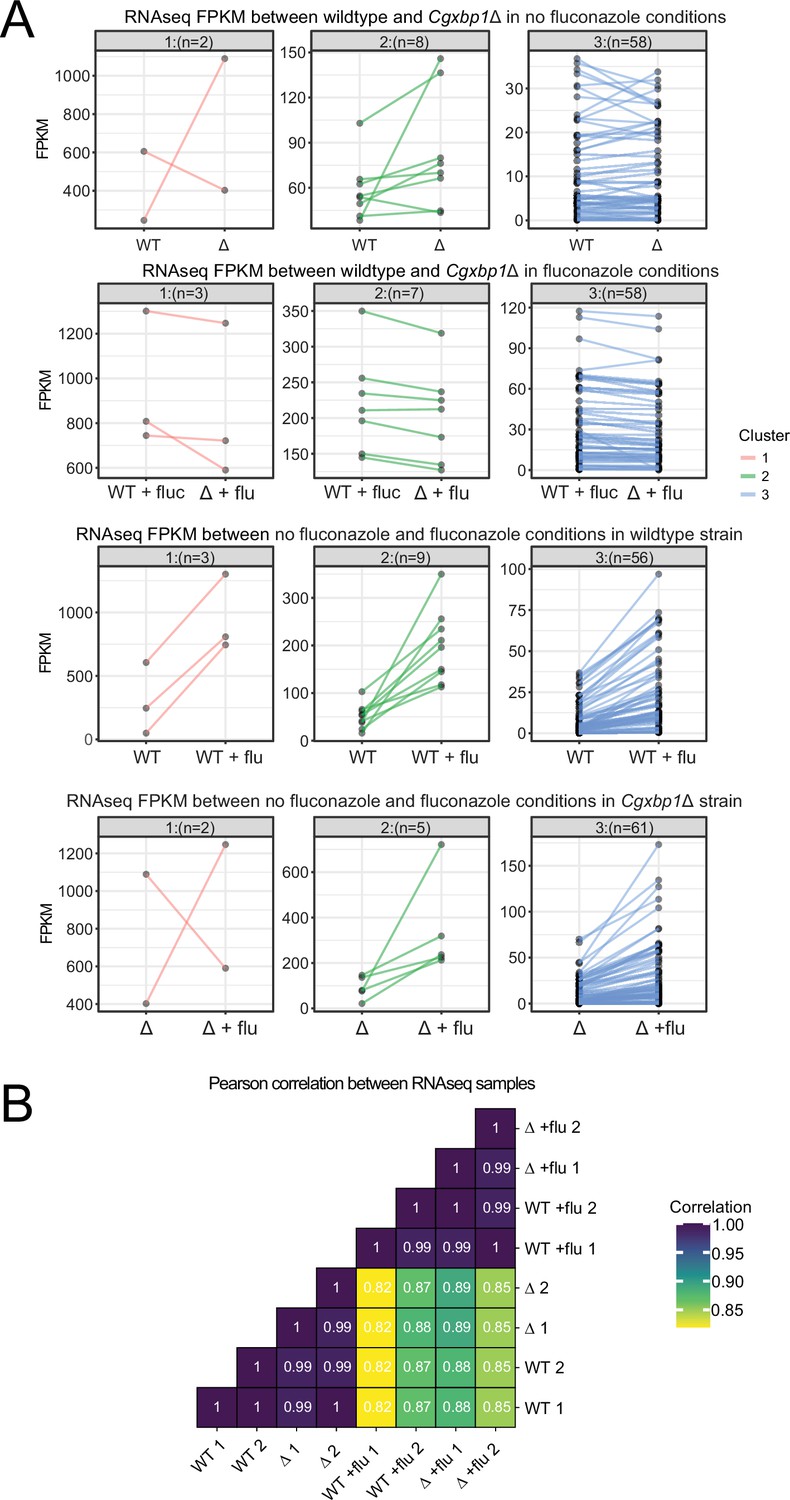
(A) Line plots showing expression (expressed in FPKM) of fluconazole responsive genes (i.e. genes induced by fluconazole) in wild-type (WT) and Cgxbp1∆ (∆) (top row), in wild-type (WT) and Cgxbp1∆ in the presence of fluconazole (flu) (second row), in wild-type with and without fluconazole (third row), and in Cgxbp1∆ with and without fluconazole (last row). The genes were clustered by k-means. The number of genes within each cluster is given in parentheses. (B) Correlations of genome-wide expression between WT and Cgxbp1∆ (∆) in the presence and absence of fluconazole (flu). The correlation values are presented inside the boxes.
Figure 6—figure supplement 2
Effect of Cgxbp1∆ under normal growth conditions.
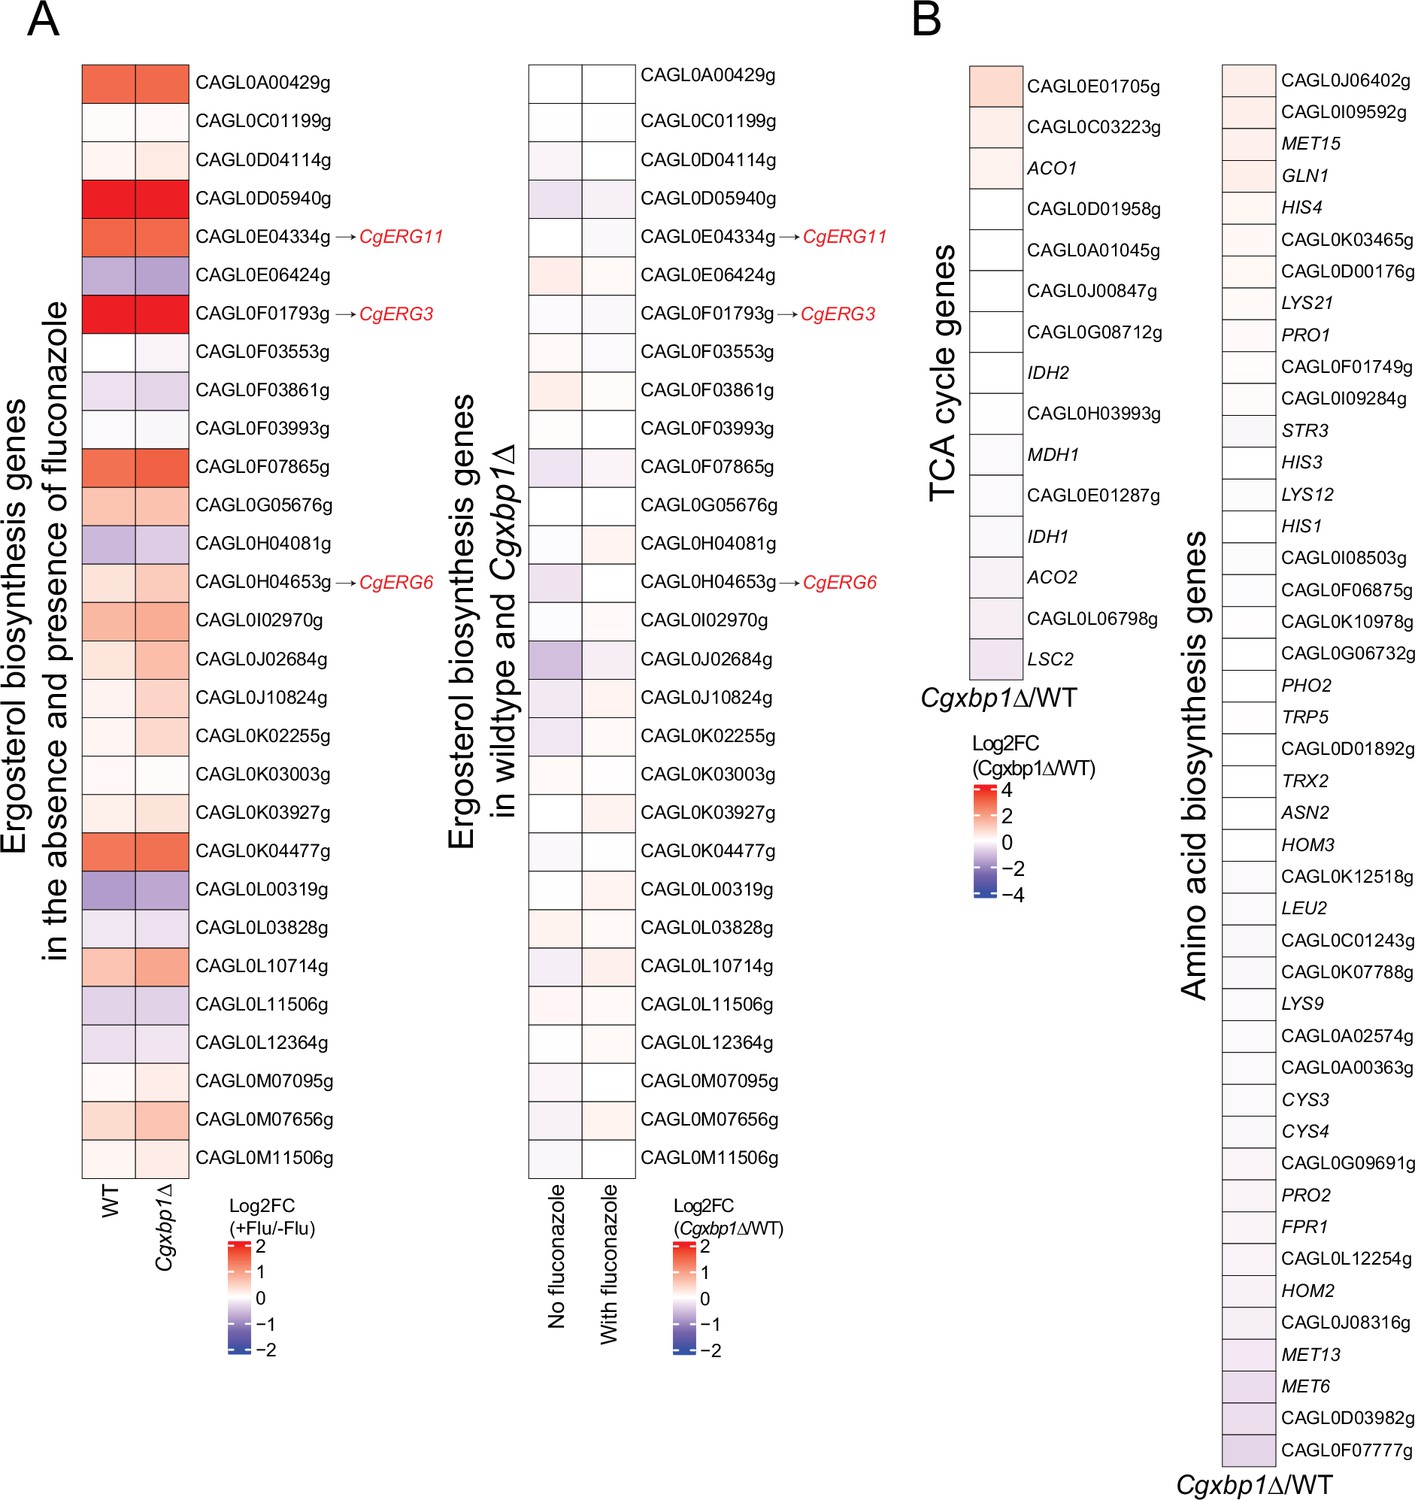
(A) Heatmaps illustrating regulation of ergosterol biosynthetic genes under fluconazole treatment. Left panel: the change of expression levels upon fluconazole treatment in wild-type and Cgxbp1∆ strains. Right panel: the expression levels change between Cgxbp1∆ and wild-type strains under the presence and absence of fluconazole. The color scale represents the log2 fold change. (B) Heatmaps showing the expression pattern for the TCA cycle and amino acid biosynthesis genes under normal conditions without fluconazole. The colour scale represents the log2 fold change of normalized RNA-seq expression values between Cgxbp1∆ mutant and wild-type strains.
Figure 7
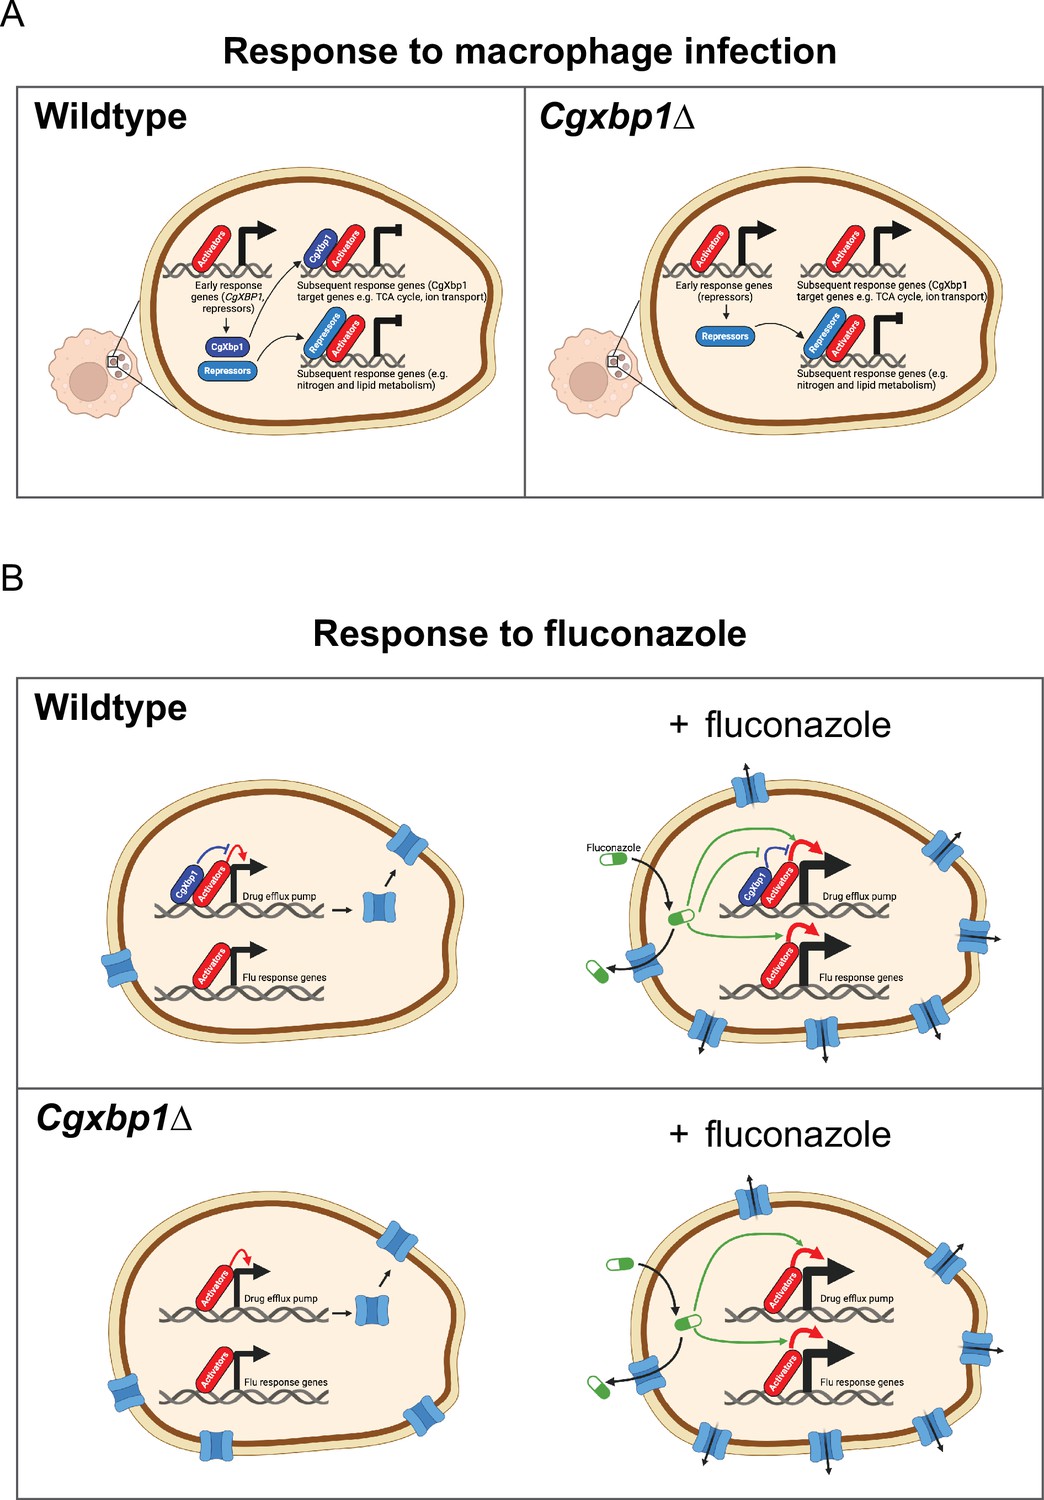
Schematic models for the role of CgXbp1 during macrophage infection and in fluconazole resistance.
(A) Upon macrophage infection, the gene of Cgxbp1 and several transcriptional repressors are transcriptionally induced at the early stage of macrophage infection. CgXbp1 and the other repressors then inhibit the expression of their target genes, which are expressed at the subsequent stages. In the absence of CgXbp1, induction of these intermediate/late response genes is temporally advanced. Therefore, CgXbp1 (presumably the other repressors) acts to delay the expression of different subsets of genes until later. When C. glabrata cells are adjusted to the macrophage host, CgXbp1 repression of its target genes is relieved through transcriptional down-regulation, allowing their functions to be expressed. We propose that, in addition to activators, repressors also play an important role in orchestrating the dynamic temporal transcription response of C. glabrata during macrophage infection. (B) CgXbp1 also has a role in fluconazole resistance. In the absence of fluconazole, CgXbp1 negatively regulates the expression of several drug efflux transporters, which are expressed at low but detectable levels in the wild-type. On the other hand, Cgxbp1∆ expresses the drug transporters at a higher level than wild-type cells, so the Cgxbp1∆ cell has more efflux transporters and, therefore, can pump out fluconazole (and other drugs) more rapidly. Consequently, Cgxbp1∆ cells can adapt better and initiate growth faster than wild type when exposed to fluconazole. After a prolonged exposure to fluconazole, our RNAseq data revealed that both wild-type and Cgxbp1∆ cells produce the same transcriptional response to fluconazole, indicating that CgXbp1 is not involved in the response (flu-responsive genes). The lack of CgXbp1 effect also suggests that CgXbp1’s function is inhibited by fluconazole. We propose that CgXbp1 controls the drug efflux potential in wild-type C. glabrata cells. This model was created in BioRender (https://biorender.com/y60k027 and https://www.biorender.com/q03d823).
Tables
Table 1
Constitutively transcribed or temporally induced C. glabrata transcription factor genes during macrophage infection.
| Temporally induced | ||||
|---|---|---|---|---|
| Group number | Cg common name | Cg ORF name | Sc common name | Sc gene desc |
| Group:1:(n=4) | CAGL0G02739g | CAGL0G02739g | XBP1 | XhoI site‐Binding Protein |
| Group:1:(n=4) | CAGL0L03157g | CAGL0L03157g | DAL80 | Degradation of Allantoin |
| Group:1:(n=4) | CAGL0J04400g | CAGL0J04400g | HAP3 | Heme Activator Protein |
| Group:1:(n=4) | CAGL0F00561g | CAGL0F00561g | RPA12 | RNA Polymerase A |
| Group:2:(n=4) | CAGL0K06413g | CAGL0K06413g | STP1 | Species‐specific tRNA Processing |
| Group:2:(n=4) | CAGL0E00737g | CAGL0E00737g | HMO1 | High MObility group (HMG) family |
| Group:2:(n=4) | MET28 | CAGL0K08668g | MET28 | METhionine |
| Group:2:(n=4) | CAGL0J03608g | CAGL0J03608g | HCM1 | High‐Copy suppressor of Calmodulin |
| Group:3:(n=5) | RTG1 | CAGL0C05335g | RTG1 | ReTroGrade regulation |
| Group:3:(n=5) | CAGL0J01177g | CAGL0J01177g | ABF1 | ARS‐Binding Factor 1 |
| Group:3:(n=5) | CAGL0K04543g | CAGL0K04543g | SPT4 | SuPpressor of Ty’s |
| Group:3:(n=5) | HAP4 | CAGL0K08624g | HAP4 | Heme Activator Protein |
| Group:3:(n=5) | CAGL0G07249g | CAGL0G07249g | YHP1 | Yeast Homeo‐Protein |
| Group:4:(n=4) | CAGL0L07480g | CAGL0L07480g | NRG2 | Negative Regulator of Glucose‐controlled genes |
| Group:4:(n=4) | MIG1 | CAGL0A01628g | MIG1 | Multicopy Inhibitor of GAL gene expression |
| Group:4:(n=4) | CAGL0G08646g | CAGL0G08646g | POG1 | Promoter Of Growth |
| Group:4:(n=4) | CAGL0K02145g | CAGL0K02145g | COM2 | Cousin of Msn2 |
| Group:5:(n=17) | RME1 | CAGL0K04257g | RME1 | Regulator of MEiosis |
| Group:5:(n=17) | CAGL0M07634g | CAGL0M07634g | SOK2 | Suppressor Of Kinase |
| Group:5:(n=17) | CAGL0M01716g | CAGL0M01716g | TEC1 | Transposon Enhancement Control |
| Group:5:(n=17) | CAGL0F07909g | CAGL0F07909g | TBS1 | ThiaBendazole Sensitive |
| Group:5:(n=17) | UPC2B | CAGL0F07865g | UPC2 | UPtake Control |
| Group:5:(n=17) | ZAP1 | CAGL0J05060g | ZAP1 | Zinc‐responsive Activator Protein |
| Group:5:(n=17) | CAGL0C02519g | CAGL0C02519g | MIG3 | Multicopy Inhibitor of Growth |
| Group:5:(n=17) | HAP5 | CAGL0K09900g | HAP5 | Heme Activator Protein |
| Group:5:(n=17) | CAGL0E04312g | CAGL0E04312g | STP2 | protein with similarity to Stp1p |
| Group:5:(n=17) | CAGL0B03421g | CAGL0B03421g | HAP1 | Heme Activator Protein |
| Group:5:(n=17) | HAA1 | CAGL0L09339g | HAA1 | Homolog of Ace1 Activator |
| Group:5:(n=17) | GAT1 | CAGL0K07634g | GAT1 | Transcriptional activator of nitrogen catabolite repression genes |
| Group:5:(n=17) | YAP6 | CAGL0M08800g | YAP6 | Yeast homolog of AP‐1 |
| Group:5:(n=17) | GLM6 | CAGL0J01595g | #N/A | #N/A |
| Group:5:(n=17) | AFT1 | CAGL0H03487g | AFT1 | Activator of Ferrous Transport |
| Group:5:(n=17) | YAP3b | CAGL0M10087g | #N/A | #N/A |
| Group:5:(n=17) | CAGL0E03762g | CAGL0E03762g | RIM101 | Regulator of IME2 |
| Group:6:(n=5) | AP5 | CAGL0K08756g | YAP5 | Yeast AP‐1 |
| Group:6:(n=5) | GCN4 | CAGL0L02475g | GCN4 | General Control Nonderepressible |
| Group:6:(n=5) | CAGL0E05566g | CAGL0E05566g | TYE7 | Ty1‐mediated Expression |
| Group:6:(n=5) | RPN4 | CAGL0K01727g | RPN4 | Regulatory Particle Non‐ATPase |
| Group:6:(n=5) | CAGL0C01551g | CAGL0C01551g | TOS8 | Target Of Sbf |
| Constitutively transcribed | ||||
| Group | Cg common name | Cg ORF name | Sc common name | Sc gene desc |
| Constitutively transcribed | PHO2 | CAGL0L07436g | PHO2 | PHOsphate metabolism |
| Constitutively transcribed | AP1 | CAGL0H04631g | YAP1 | Yeast AP‐1 |
| Constitutively transcribed | CAGL0M04983g | CAGL0M04983g | MBF1 | Multiprotein Bridging Factor |
| Constitutively transcribed | MSN4 | CAGL0M13189g | MSN4 | Multicopy suppressor of SNF1 mutation |
| Constitutively transcribed | CAGL0E00891g | CAGL0E00891g | STB3 | Sin Three Binding protein |
| Constitutively transcribed | CAD1 | CAGL0F03069g | CAD1 | CADmium resistance |
| Constitutively transcribed | CAGL0A04257g | CAGL0A04257g | TOD6 | Twin Of Dot6p |
| Constitutively transcribed | CAGL0I08635g | CAGL0I08635g | BUR6 | Bypass UAS Requirement |
| Constitutively transcribed | YAP7 | CAGL0F01265g | YAP7 | Yeast AP‐1 |
| Constitutively transcribed | CAGL0L02013g | CAGL0L02013g | IXR1 | Intrastrand cross (X)‐link Recognition |
| Constitutively transcribed | CAGL0M01474g | CAGL0M01474g | NCB2 | Negative Cofactor B |
| Constitutively transcribed | CAGL0F06259g | CAGL0F06259g | ARG80 | ARGinine requiring |
| Constitutively transcribed | SWI5 | CAGL0E01331g | SWI5 | SWItching deficient |
| Constitutively transcribed | CAGL0M09955g | CAGL0M09955g | SFP1 | Split Finger Protein |
Table 2
Table of significantly enriched and non-redundant gene ontology (GO)-terms for biological processes among CgXbp1 target genes during macrophage infection.
| GO-term for biological processes | p-value | Genes in the background | CgXbp1 bound genes |
|---|---|---|---|
| regulation of transcription, DNA-templated | 0.0012 | 468 | 33 |
| transmembrane transport | 0.0001 | 302 | 27 |
| positive regulation of transcription, DNA-templated | 0.0007 | 257 | 22 |
| carbohydrate metabolic process | 0.0029 | 215 | 18 |
| cellular carbohydrate metabolic process | 0.013 | 125 | 11 |
| negative regulation of transcription, DNA-templated | 0.0448 | 151 | 11 |
| regulation of filamentous growth | 0.0455 | 133 | 10 |
| cCarbohydrate catabolic process | 0.0074 | 56 | 7 |
| iInterspecies interaction between organisms | 0.019 | 67 | 7 |
| polysaccharide biosynthetic process | 0.0156 | 50 | 6 |
| regulation of cell growth | 0.0156 | 50 | 6 |
| positive regulation of pseudohyphal growth | 0.0013 | 21 | 5 |
| pyruvate metabolic process | 0.0068 | 30 | 5 |
| regulation of pseudohyphal growth | 0.0148 | 36 | 5 |
| regulation of carbohydrate metabolic process | 0.0356 | 45 | 5 |
| sphingolipid metabolic process | 0.0419 | 47 | 5 |
| development of symbiont in host | 0.002 | 14 | 4 |
| response to copper ion | 0.0043 | 17 | 4 |
| cellular glucose homeostasis | 0.0095 | 21 | 4 |
| glycolytic process | 0.0112 | 22 | 4 |
| nucleoside diphosphate phosphorylation | 0.0153 | 24 | 4 |
| nucleotide phosphorylation | 0.023 | 27 | 4 |
| sphingolipid biosynthetic process | 0.0443 | 33 | 4 |
| (1->3)-beta-D-glucan biosynthetic process | 0.0066 | 10 | 3 |
| glutamate metabolic process | 0.0114 | 12 | 3 |
| regulation of Rho protein signal transduction | 0.0143 | 13 | 3 |
| transfer RNA gene-mediated silencing | 0.0143 | 13 | 3 |
| glucose-mediated signaling pathway | 0.0177 | 14 | 3 |
| chromatin silencing by small RNA | 0.0256 | 16 | 3 |
| Rho protein signal transduction | 0.0302 | 17 | 3 |
| response to glucose | 0.0352 | 18 | 3 |
| cellular response to carbohydrate stimulus | 0.0352 | 18 | 3 |
Table 3
Strains used in this study.
| Strain Number | Strain Name | Genotype |
|---|---|---|
| CWF28 | wild-type | BG2 |
| CWF236 | Cgxbp1Δ | CgXBP1::hph1 |
| CWF1325 | CgXBP1MYC | CgXBP1MYC; hph1 |
| CWF1327 | Cgxbp1Δ-pXBP1 | CgXBP1::hph1, pCN-CgXBP1 |
Additional files
-
Supplementary file 1
List of actively transcribing genes in wild-type C. glabrata upon macrophage infection.
- https://cdn.elifesciences.org/articles/73832/elife-73832-supp1-v2.xlsx
-
Supplementary file 2
List of gene ontology (GO)-terms enriched from temporally induced genes in wild-type C. glabrata in response to macrophage infection.
- https://cdn.elifesciences.org/articles/73832/elife-73832-supp2-v2.xlsx
-
Supplementary file 3
Lists of iron response genes in wild-type C. glabrata during macrophage infection.
- https://cdn.elifesciences.org/articles/73832/elife-73832-supp3-v2.xlsx
-
Supplementary file 4
Gene regulatory associations between indicated transcription factors (TFs) and the macrophage infection-induced genes reported in the PathoYeastract database.
- https://cdn.elifesciences.org/articles/73832/elife-73832-supp4-v2.xlsx
-
Supplementary file 5
List of orthologues for the macrophage infection-induced transcription factor (TF) and non-TF genes of C. glabrata previously shown to have a regulatory association with Xbp1 or Hap3 in S. cerevisiae obtained from the PathoYeastract database.
- https://cdn.elifesciences.org/articles/73832/elife-73832-supp5-v2.xlsx
-
Supplementary file 6
CgXbp1MYC binding sites upon macrophage infection identified in biological replicates by MACS2 (Model-based Analyses for ChIP-seq) peak-calling.
- https://cdn.elifesciences.org/articles/73832/elife-73832-supp6-v2.xlsx
-
Supplementary file 7
List of C. glabrata genes having CgXbp1MYC binding sites in their promoters upon macrophage infection.
- https://cdn.elifesciences.org/articles/73832/elife-73832-supp7-v2.xlsx
-
Supplementary file 8
List of enriched gene ontology (GO)-terms for biological processes from CgXbp1 targets upon macrophage infection.
- https://cdn.elifesciences.org/articles/73832/elife-73832-supp8-v2.xlsx
-
Supplementary file 9
List of transcription factors with CgXbp1 binding at their promoters during macrophage infection.
- https://cdn.elifesciences.org/articles/73832/elife-73832-supp9-v2.xlsx
-
Supplementary file 10
List of actively transcribing genes in Cgxbp1∆ mutant upon macrophage infection.
- https://cdn.elifesciences.org/articles/73832/elife-73832-supp10-v2.xlsx
-
Supplementary file 11
List of gene ontology (GO)-terms enriched from temporally induced genes in Cgxbp1∆ in response to macrophage infection.
- https://cdn.elifesciences.org/articles/73832/elife-73832-supp11-v2.xlsx
-
Supplementary file 12
Summarized tables of DEGs for wild-type and Cgxbp1∆ mutant upon fluconazole treatment.
- https://cdn.elifesciences.org/articles/73832/elife-73832-supp12-v2.xlsx
-
Supplementary file 13
List of enriched gene ontology (GO)-terms for biological processes in Cgxbp1∆ mutant compared to wild-type C. glabrata cells.
- https://cdn.elifesciences.org/articles/73832/elife-73832-supp13-v2.xlsx
-
MDAR checklist
- https://cdn.elifesciences.org/articles/73832/elife-73832-mdarchecklist1-v2.pdf
Download links
A two-part list of links to download the article, or parts of the article, in various formats.
Downloads (link to download the article as PDF)
Open citations (links to open the citations from this article in various online reference manager services)
Cite this article (links to download the citations from this article in formats compatible with various reference manager tools)
Temporal transcriptional response of Candida glabrata during macrophage infection reveals a multifaceted transcriptional regulator CgXbp1 important for macrophage response and fluconazole resistance
eLife 13:e73832.
https://doi.org/10.7554/eLife.73832


