Co-aggregation and secondary nucleation in the life cycle of human prolactin/galanin functional amyloids
- Department of Biosciences and Bioengineering, Indian Institute of Technology Bombay, India
- Department of Biotechnology, Indian Institute of Technology Madras, India
- School of Biological Sciences, National Institute of Science Education and Research, India
Figures
Figure 1 with 2 supplements
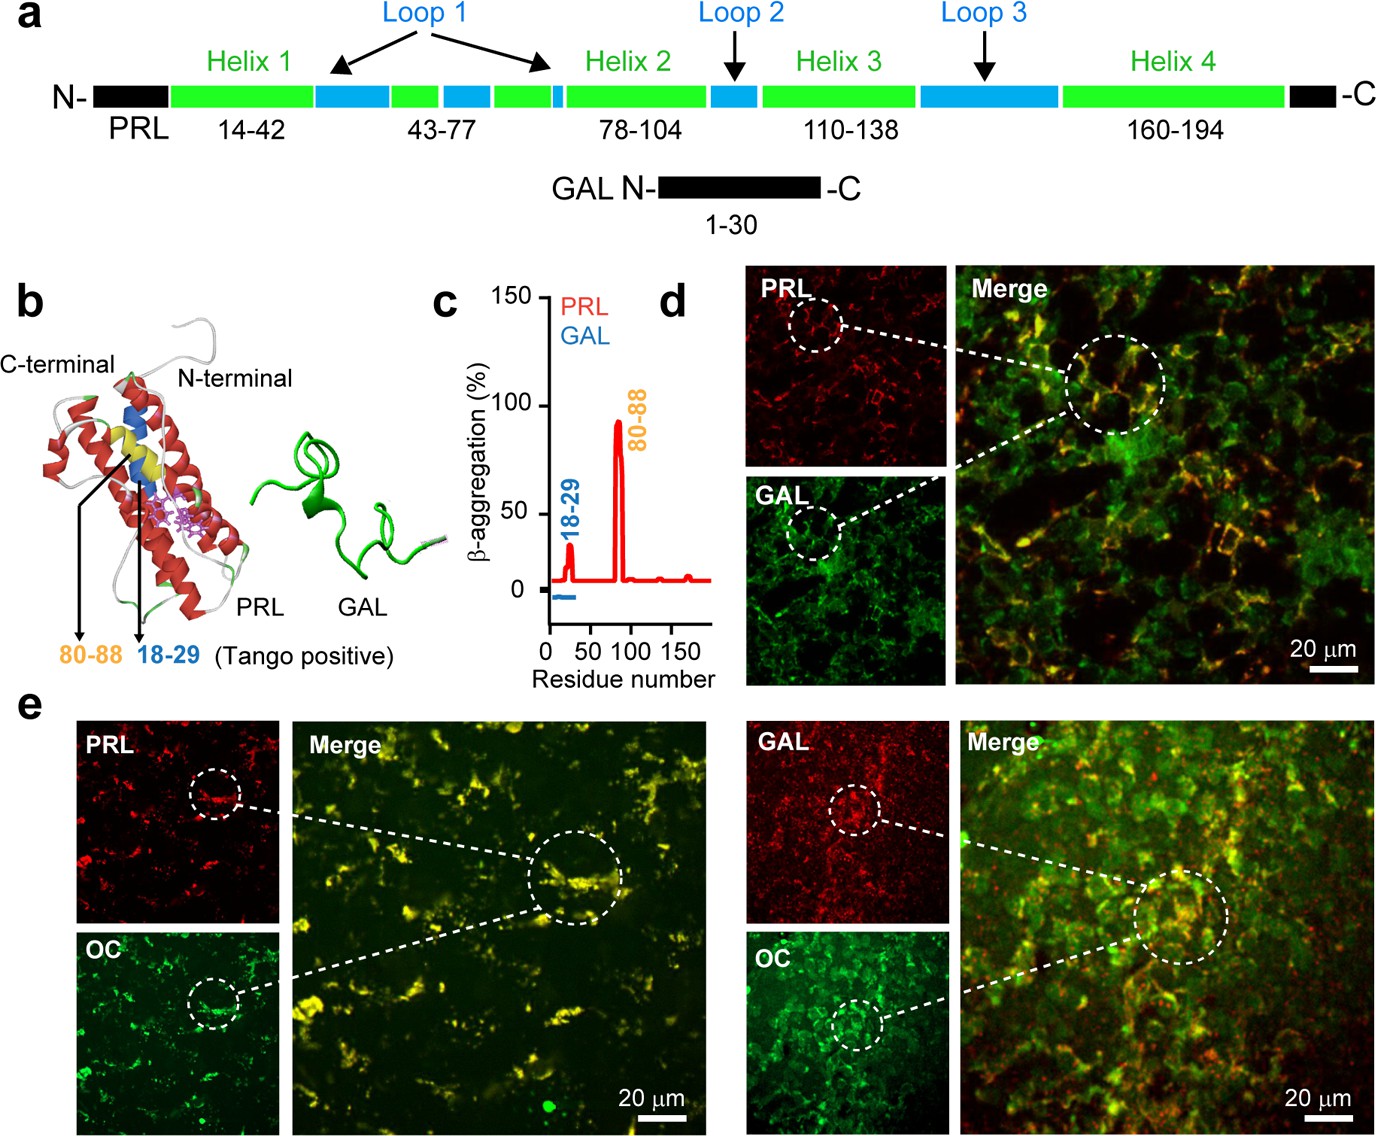
Amyloid propensity and co-storage of PRL and GAL.
(a) Schematic showing amino acid sequence and secondary structures of PRL & GAL with different color codes. (Upper panel) PRL is 191 amino acids in length and contains a four-helix bundle (green). The short helix and loop regions are also represented between helix-1 and helix 2 (shown in green and blue colors, respectively). (Lower panel) GAL showing 30 residue peptide with no definite secondary structure (Evans and Shine, 1991; Bersani et al., 1991). (b) (Left panel) The three-dimensional structure (obtained in Pymol) (Teilum et al., 2005) of PRL showing its major helices and two tryptophan residues (shown in purple) (PDB ID: 1RW5). (Right panel) Natively unstructured conformation of GAL is also shown. (c) TANGO algorithm showing the aggregation-prone residues of PRL and GAL at pH 6.0 (SGs relevant pH). The residues 18–29 and 80–88 of PRL showing amyloid aggregation potential. However, TANGO analysis of GAL revealed no amyloid aggregation propensity. Immunofluorescence studies showing (d) colocalization of PRL (red) and GAL (green) in the female rat anterior pituitary. (e) (left panel) Colocalization of amyloid fibrils (OC, green) and PRL (red) and amyloid fibrils (OC, green) and GAL (red) (Right panel) in the anterior pituitary of female rat. The merged microscopic image showing colocalization (yellow). The experiments (d-e) are performed three times with similar observations.
-
Figure 1—source data 1
TANGO β-Aggregation propensity.
- https://cdn.elifesciences.org/articles/73835/elife-73835-fig1-data1-v2.xlsx
-
Figure 1—source data 2
Protein/peptide hormone sequence used in this study.
- https://cdn.elifesciences.org/articles/73835/elife-73835-fig1-data2-v2.docx
Figure 1—figure supplement 1
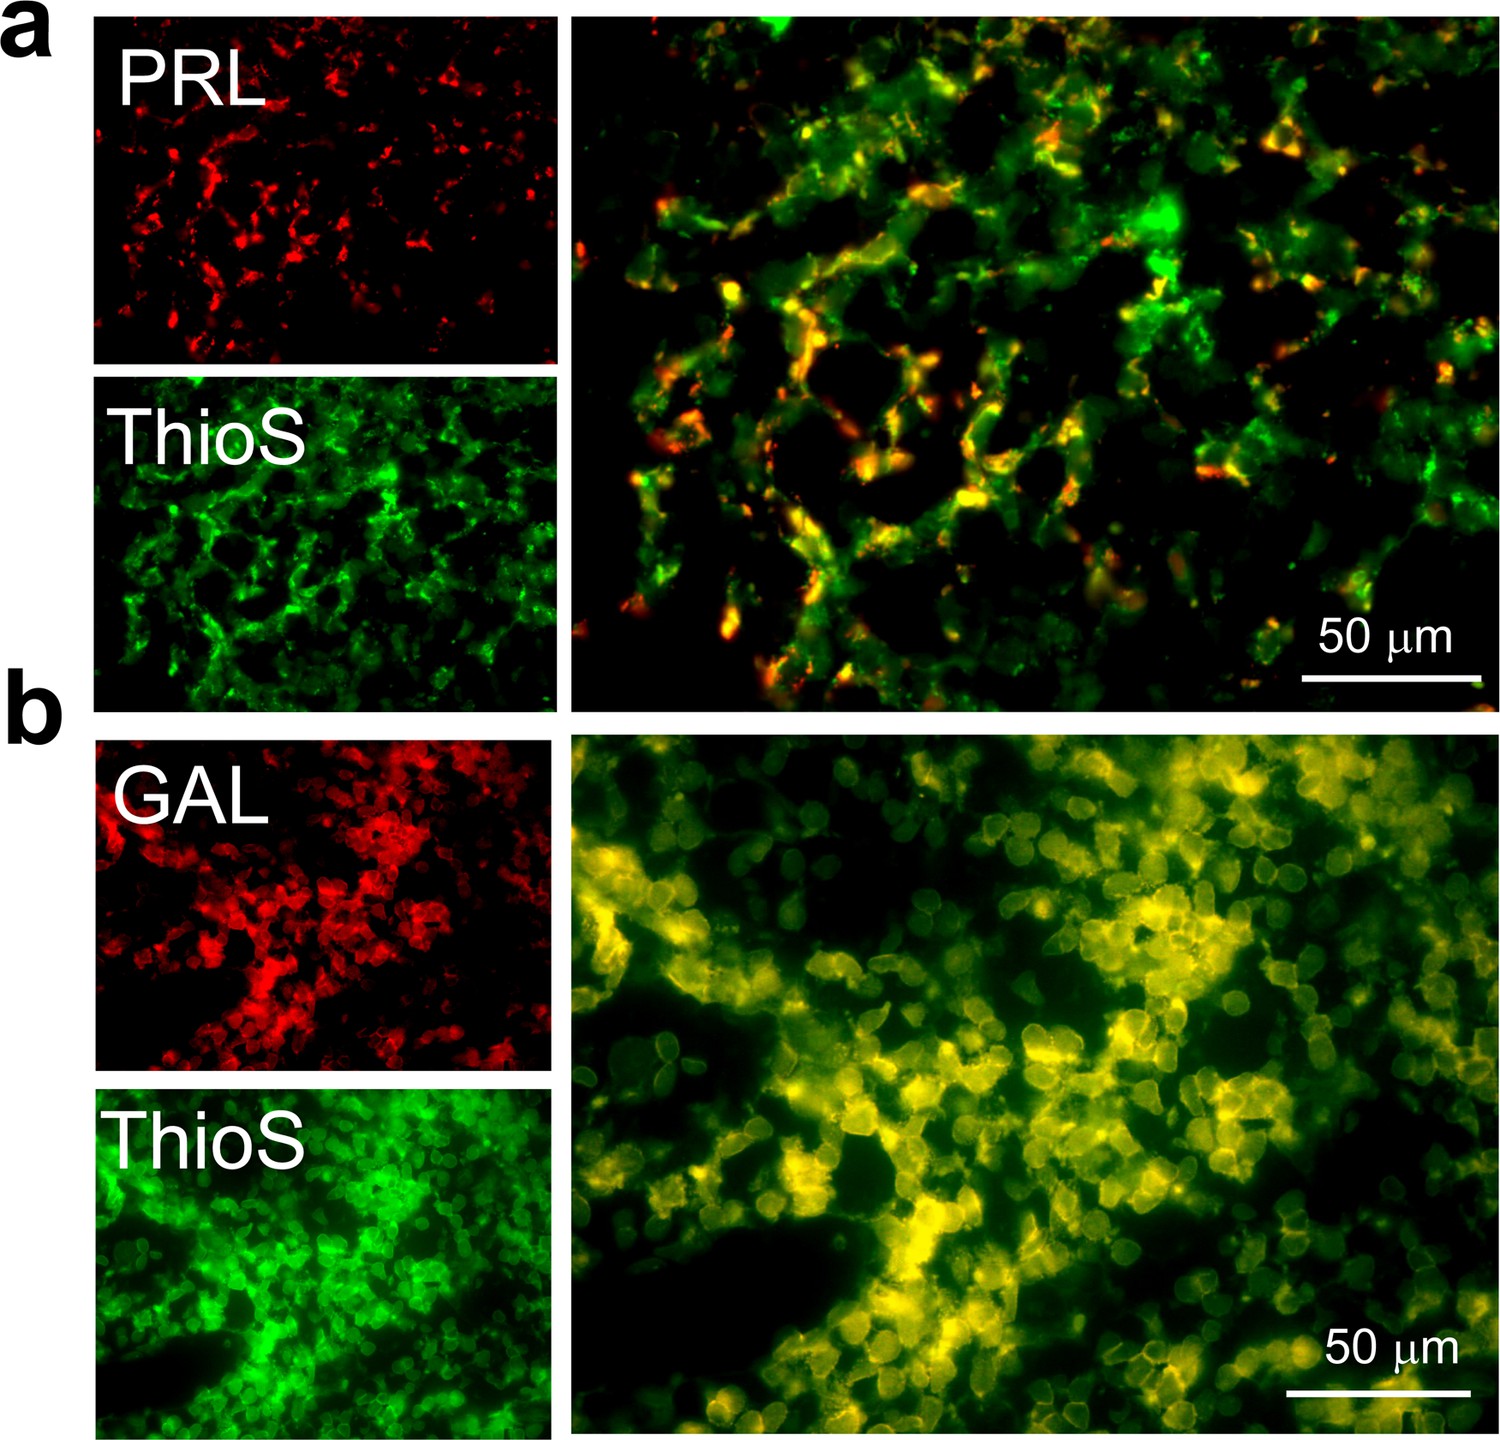
ThioS co-localization of PRL and GAL expressing cells in female rat pituitary tissue.
Representative fluorescence photomicrographs of female rat anterior pituitary tissue (after immunostaining) showing ThioS staining (green) in the GAL or PRL expressing cells (red). The data indicate that PRL and GAL are stored as amyloid in SGs. (a) PRL (red) and ThioS (green) shows co-localization (yellow). (b) GAL (red) and ThioS (green) shows co-localization (yellow). The experiment is performed three times with similar observations.
Figure 1—figure supplement 2
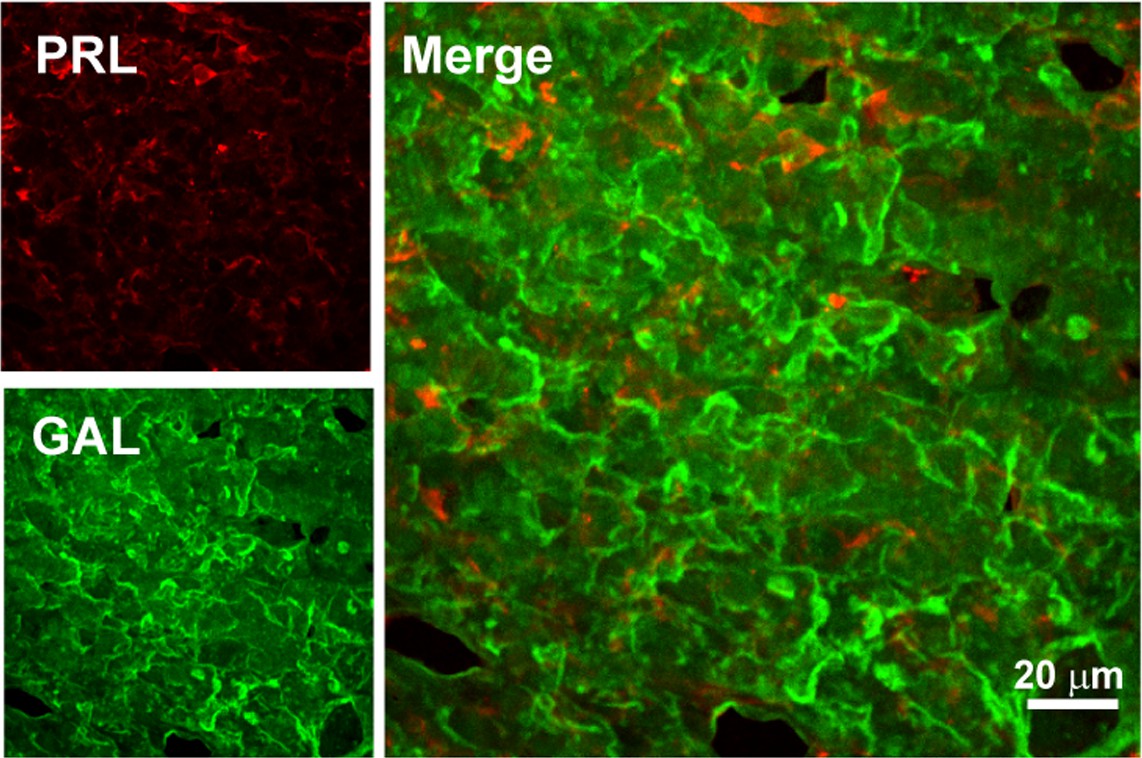
Double immunofluorescence of PRL-GAL in male rat pituitary tissue.
Double immunofluorescence showing PRL (red) and GAL (green) co-localization in the anterior pituitary of male rat. The merged microscopic image (Right) shows no colocalization between PRL and GAL. The data indicate that PRL and GAL are not co-stored in the male rat anterior pituitary. The experiments were performed three times with similar observations.
Figure 2 with 4 supplements
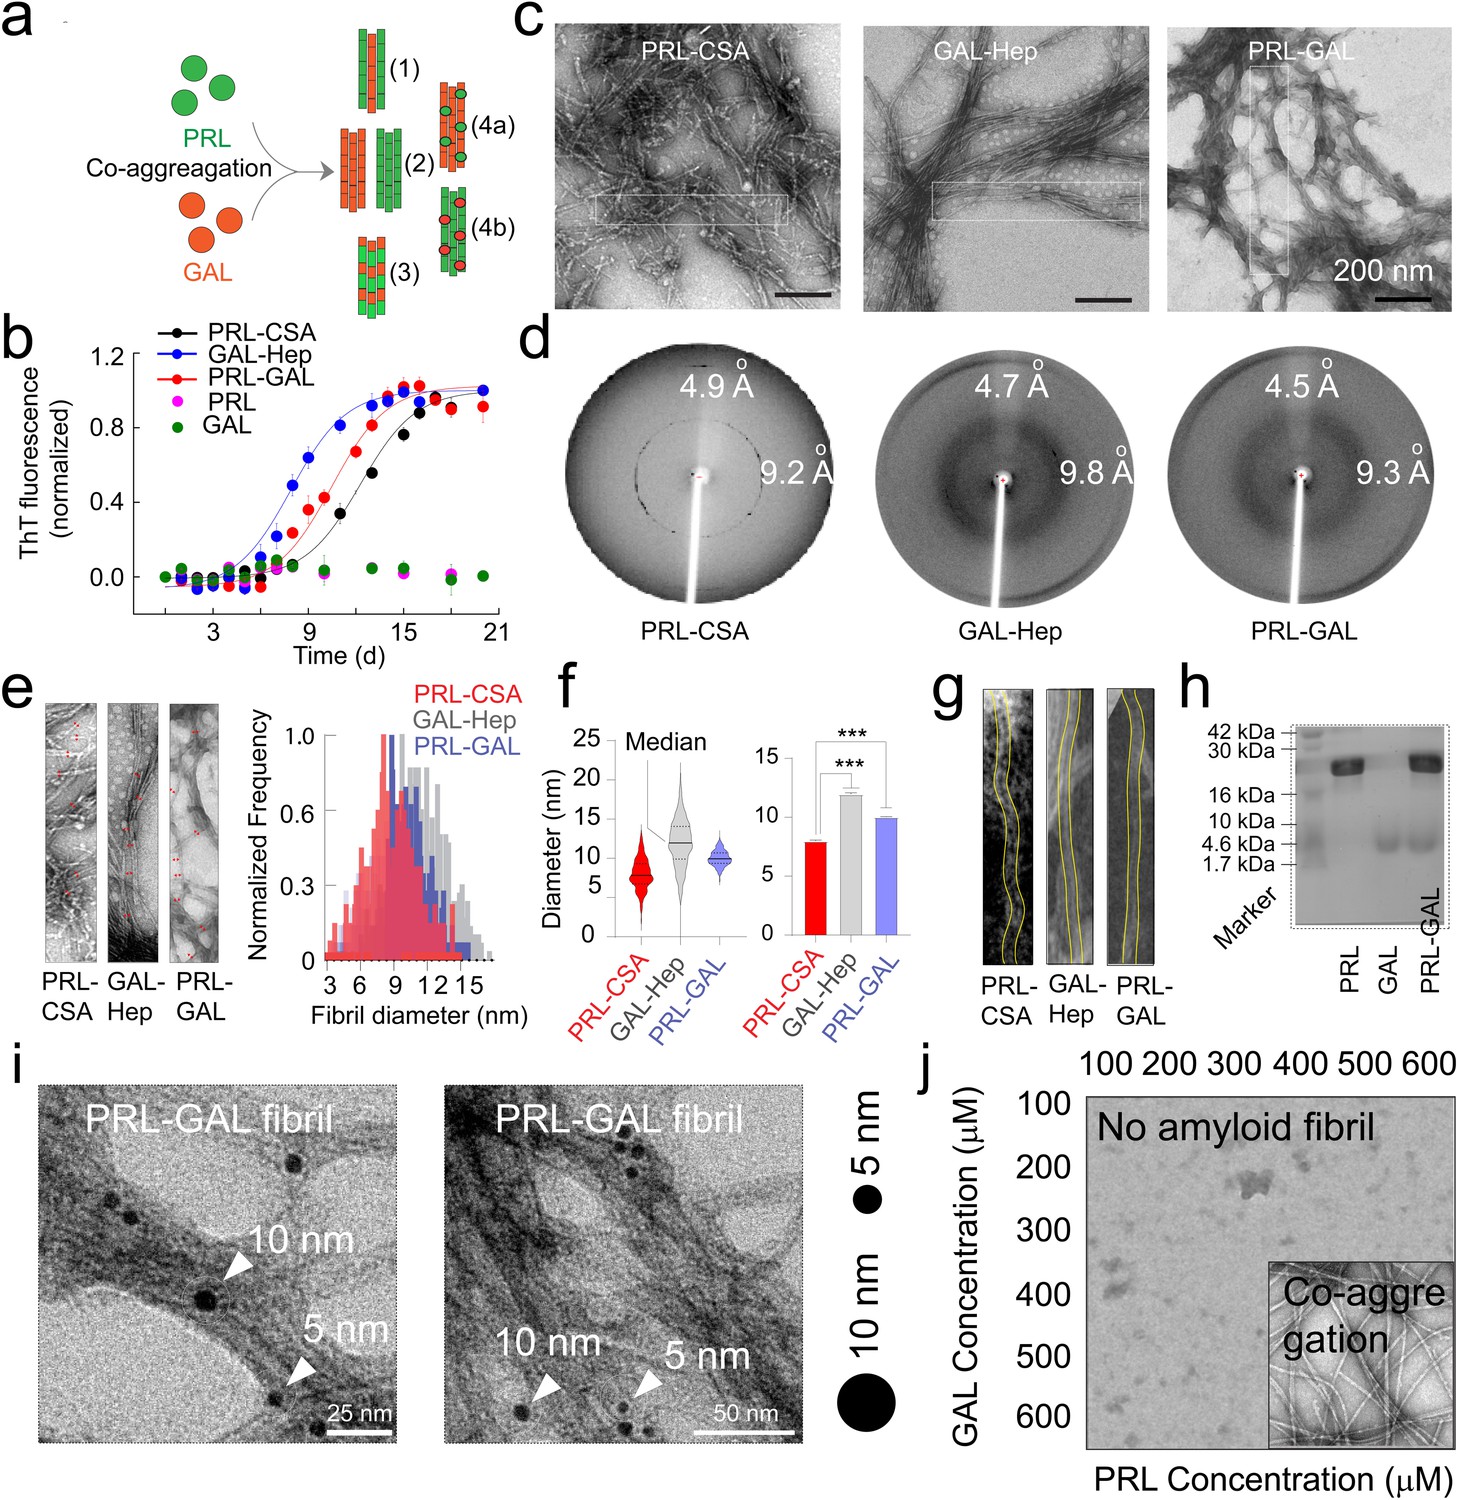
Amyloid aggregation kinetics & co-fibril formation by PRL and GAL.
(a) Schematic showing different possibilities for the formation of PRL-GAL co-fibrils. (b) Normalized ThT fluorescence intensity over time showing faster aggregation kinetics for GAL-Hep followed by PRL-GAL and PRL-CSA. The experiment is performed three times with similar results. Values represent mean ± SEM. (c) TEM images showing amyloid fibrils for PRL-CSA, GAL-Hep, and PRL-GAL after 15 days of incubation. Representative images are shown. The dotted box marks are the representative area from which the fibril diameters are measured. (d) XRD of PRL-CSA, GAL-Hep, and PRL-GAL fibrils at day 15 showing ~4.7 Å meridional and ~10 Å equatorial reflections, as commonly seen for most amyloid fibrils (Sunde et al., 1997; Sunde and Blake, 1997). (e) (Left panel) Representative TEM images showing fibril diameter measured at random positions (marked with red arrows) on individual fibrils. (Right panel) The normalized frequency distribution of fibril diameters of PRL-CSA, GAL-Hep, and PRL-GAL fibrils is shown. 200 data points are collected for individual samples for n = 3 independent experiments. (f) (Left panel) Median values of different fibril diameters are shown with violin plots. (Right panel) Average values of different fibril diameters are shown. Values represent mean ± SD. The statistical significance (***p ≤ 0.001, **p ≤ 0.01) is calculated by one-way ANOVA followed by an SNK post hoc test with a 95% confidence interval. (g) Representative TEM images of PRL-CSA, GAL-Hep, and PRL-GAL fibrils (scale bar-200 nm). From a single fibril, 200 data points are collected along the length to calculate the diameter. (h) SDS-PAGE depicting two bands for isolated aggregates from the PRL-GAL mixture (lane 3). The two bands correspond to PRL and GAL, which suggests that the isolated aggregates are composed of both PRL and GAL. (i) Amyloid fibrils obtained from the PRL-GAL mixture showing 10 nm gold particles (against GAL primary) and 5 nm gold particles (against PRL primary), confirming synergistic co-fibril formation by PRL and GAL (Left and Right panel). The experiment is performed three times with similar observations. (j) Schematic representation of incubation of PRL and GAL at various concentrations showing optimum concentration is required to initiate PRL-GAL co-aggregation.
-
Figure 2—source data 1
Amyloid aggregation kinetics & co-fibril formation by PRL and GAL.
- https://cdn.elifesciences.org/articles/73835/elife-73835-fig2-data1-v2.xlsx
Figure 2—figure supplement 1
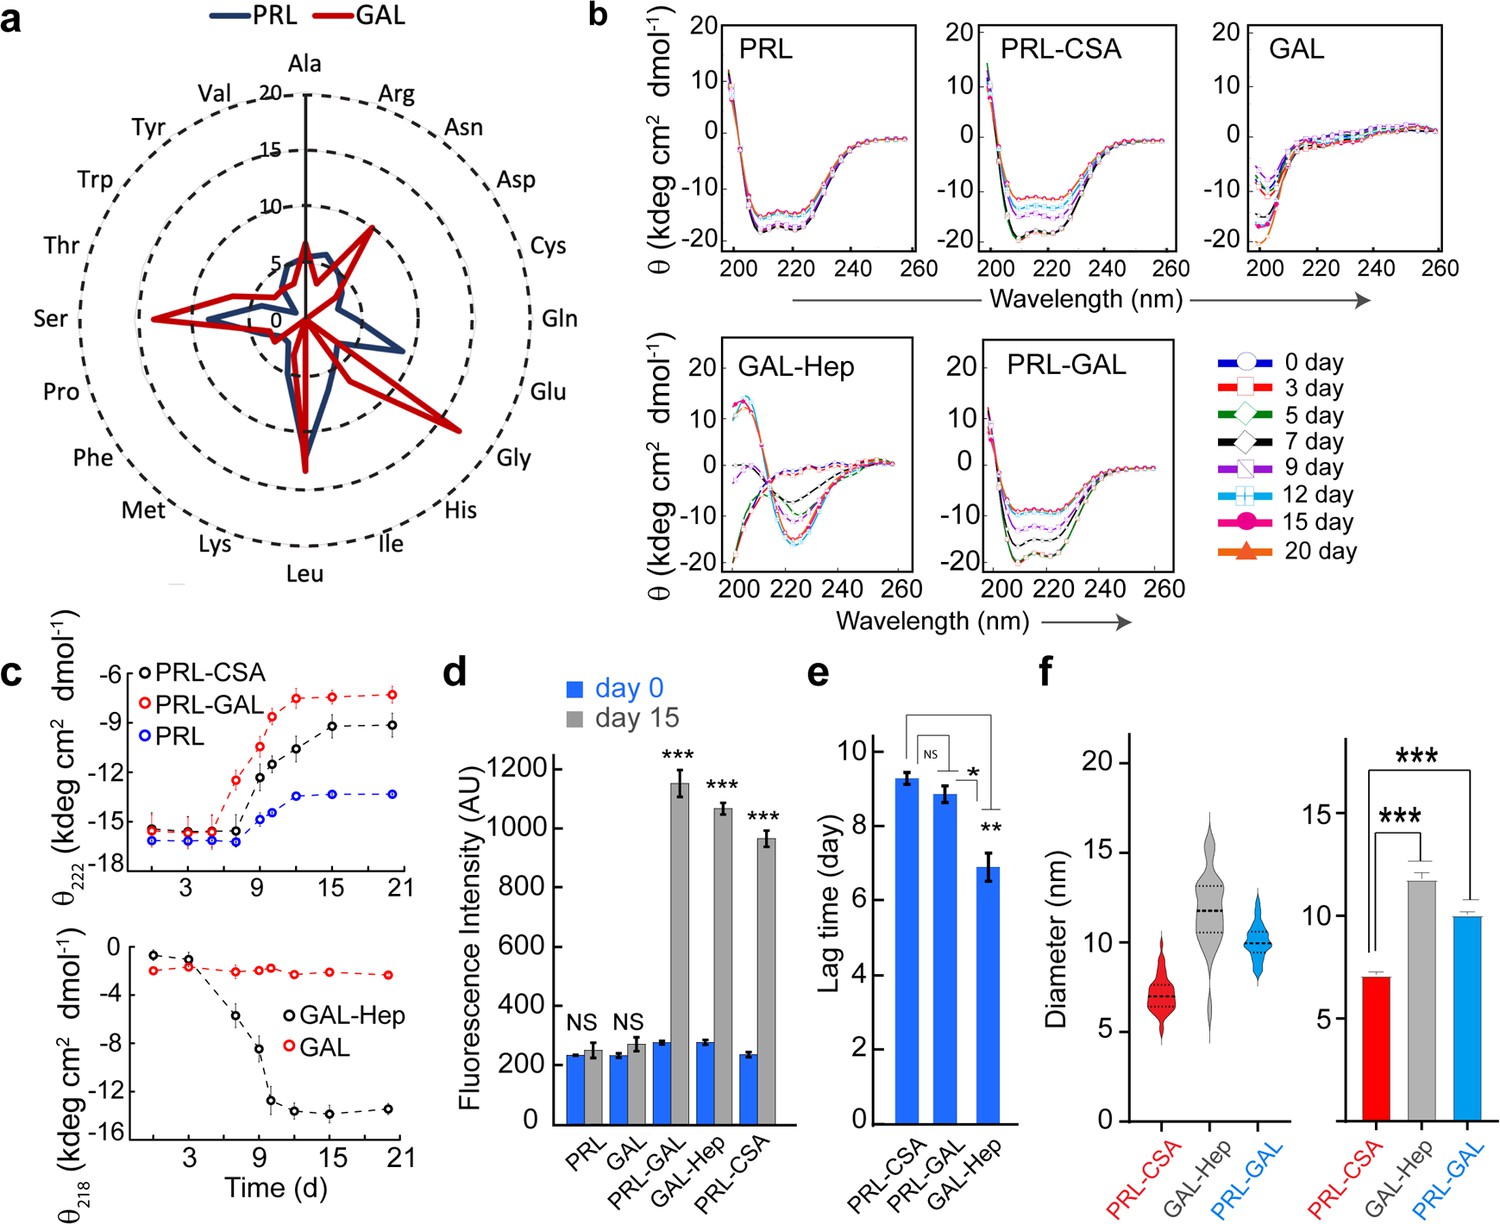
Conformational transition and aggregation by PRL and GAL.
(a) Radar plot showing no significant sequence similarities between PRL and GAL. (b) CD spectra showing secondary structural changes during incubation. PRL-GAL and PRL-CSA show a decrease in helicity with time. GAL-Hep shows a structural transition from RC to the β-sheet structure during incubation. The experiment is performed three times with similar results. (c) (Top panel) The plot of molar ellipticity value (θ) at 222 nm (characteristic minima for α-helix) with time showing a faster decrease in molar ellipticity value in the case of PRL-GAL in comparison to PRL-CSA. This suggests PRL-GAL is undergoing structural changes at a faster rate compared to PRL-CSA. PRL alone showed no considerable change in molar ellipticity value suggesting it did not undergo amyloid aggregation. (Bottom panel) The plot of molar ellipticity value (θ) at 218 nm (characteristic minima for β-sheet) with time showing an increase in molar ellipticity value (negative θ) for GAL-Hep suggesting GAL-Hep is undergoing major structural changes with time. GAL alone showed no considerable change in molar ellipticity value. (d) ThT fluorescence at day 0 and day 15 for PRL, GAL, GAL-Hep, PRL-GAL, and PRL-CSA is shown. The data showed a significant increase in ThT fluorescence for GAL-Hep, PRL-GAL & PRL-CSA after 15 days of incubation. PRL and GAL alone do not show any significant ThT binding even after 15 days of incubation. Values represent mean ± SEM for n = 3 independent experiments. Statistical significance is calculated for each sample using paired Student’s t-test. (e) Lag time of aggregation derived from ThT aggregation kinetics of PRL-CSA, PRL-GAL, and GAL-Hep. Values represent mean ± SEM for n = 3 independent experiments. The statistical significance (***p ≤ 0.001, **p ≤ 0.01, *p ≤ 0.05) is calculated by one-way ANOVA followed by an SNK post hoc test with a 95% confidence interval (f) (Left panel) Median values of different fibril diameters are shown with violin plots. (Right panel) Average values of different fibril diameters are shown. Values represent mean ± SEM. The statistical significance (***p ≤ 0.001, **p ≤ 0.01, *p ≤ 0.05) is calculated by one-way ANOVA followed by an SNK post hoc test with a 95% confidence interval.
-
Figure 2—figure supplement 1—source data 1
Conformational transition and aggregation by PRL-GAL.
- https://cdn.elifesciences.org/articles/73835/elife-73835-fig2-figsupp1-data1-v2.xlsx
Figure 2—figure supplement 2
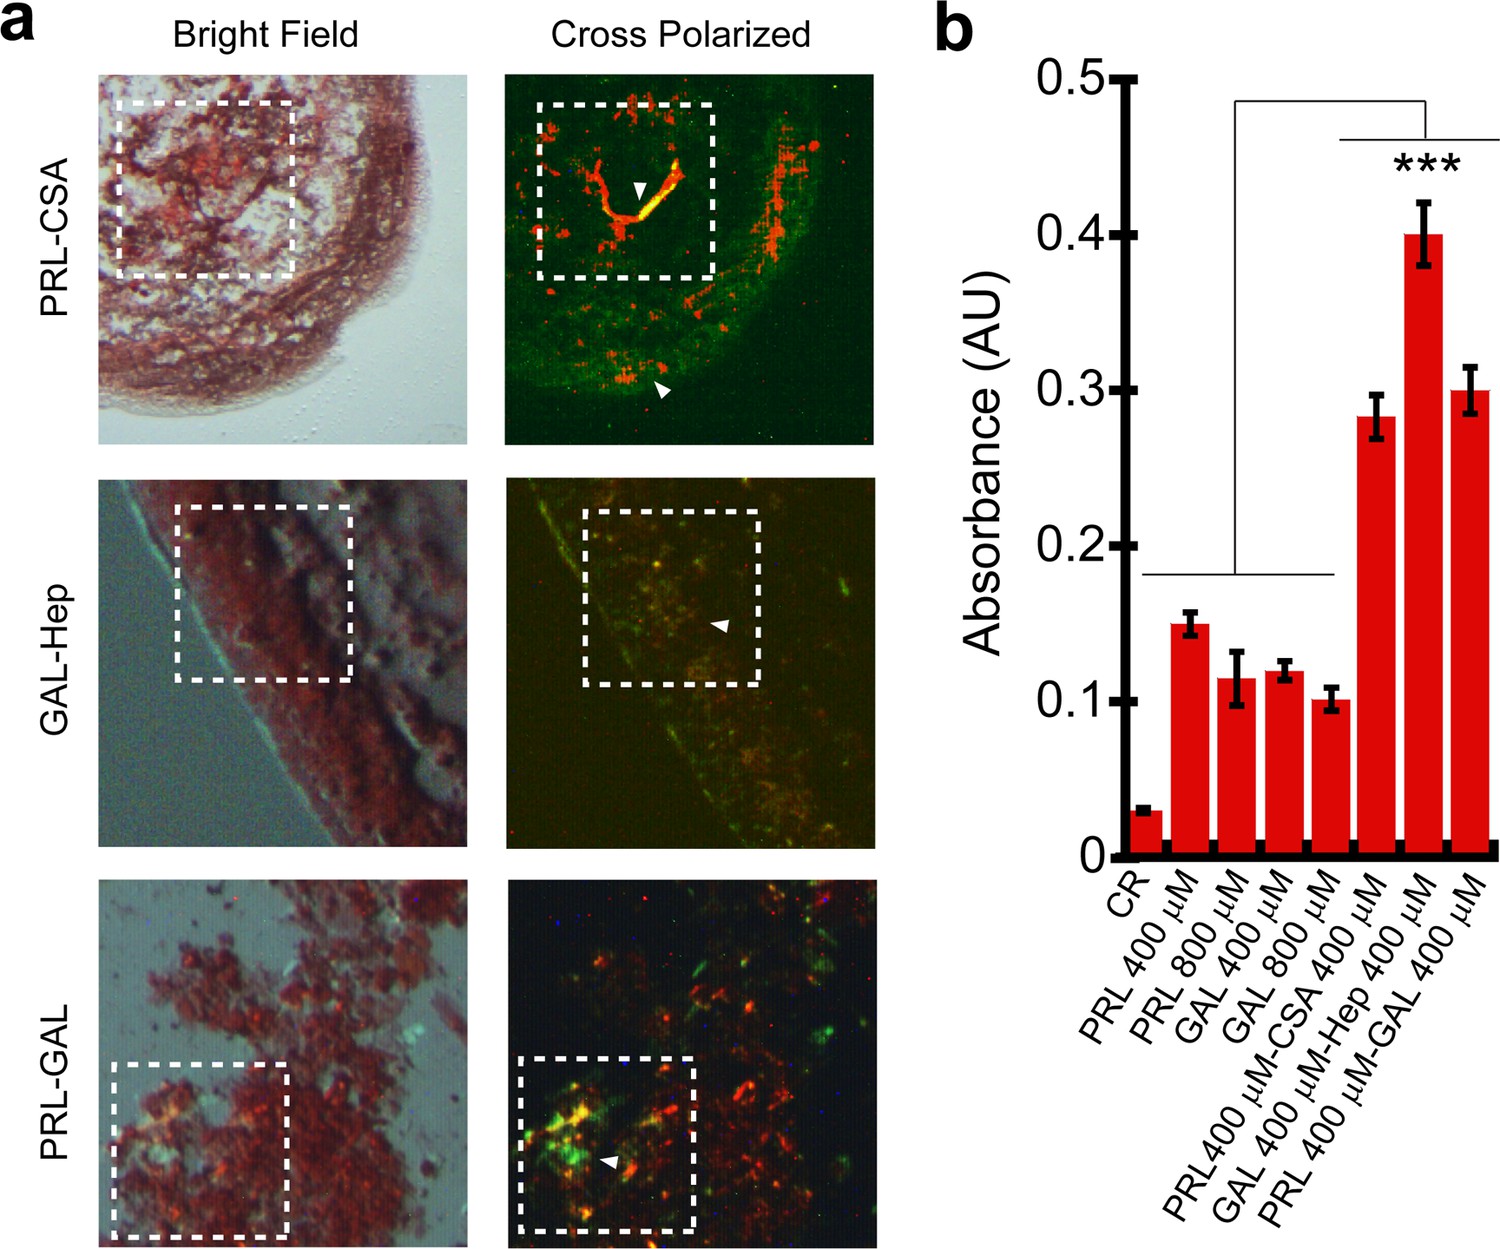
Congo red (CR) binding of hormone amyloids.
(a) Bright-field and cross-polarized images of the PRL-CSA, PRL-GAL, and GAL-Hep samples after 15 days of incubation are shown. The greenish-yellow CR birefringence under crossed polarized light indicates the presence of amyloid in all three samples. (b) PRL-CSA, GAL-Hep, and PRL-GAL showed higher CR absorbance (at 540 nm) compared to PRL or GAL alone (400/800 μM) samples. Values represent mean ± SEM for n = 3 independent experiments. The statistical significance (***p ≤ 0.001) is calculated by one-way ANOVA followed by the SNK post hoc test with a 95% confidence interval.
-
Figure 2—figure supplement 2—source data 1
Congo red binding of hormone amyloids.
- https://cdn.elifesciences.org/articles/73835/elife-73835-fig2-figsupp2-data1-v2.xlsx
Figure 2—figure supplement 3
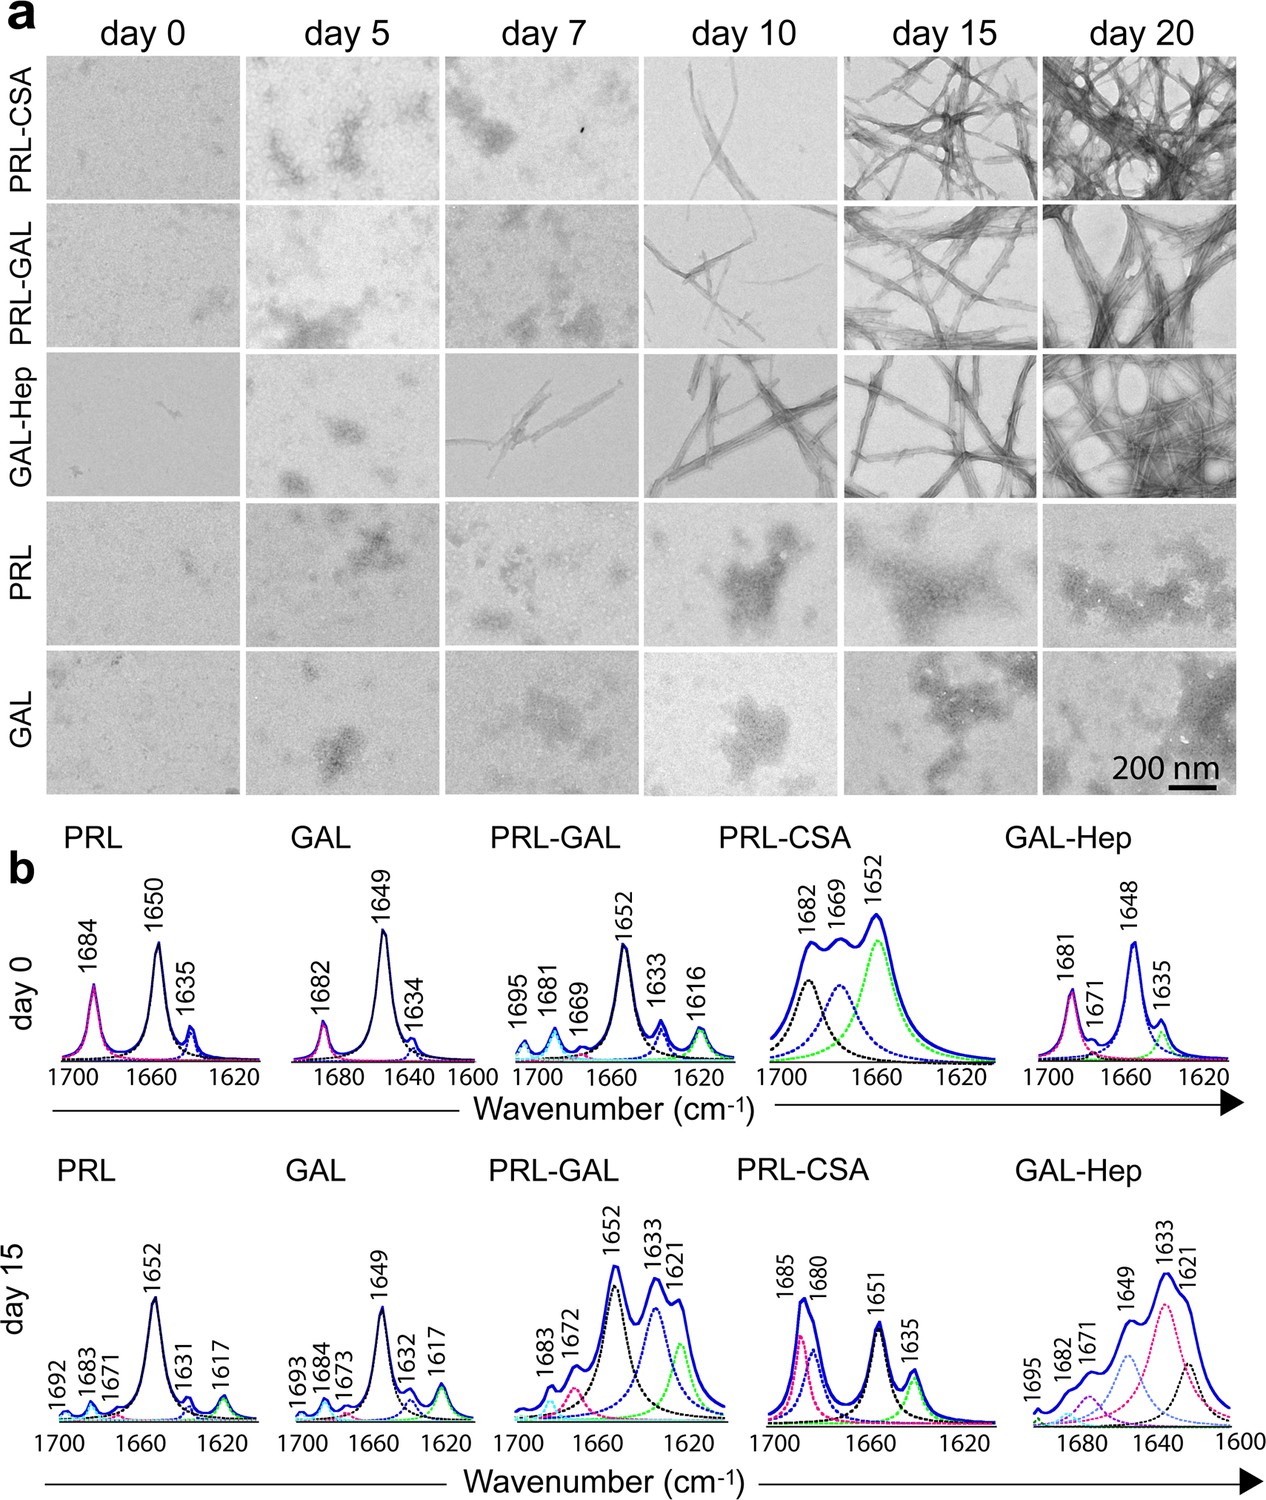
Time-dependent amyloid fibril formation by hormones using TEM and FTIR study.
(a) The morphology of the formation of the aggregates was monitored by TEM at different incubation times. The data shows the appearance of fibrillar structure for GAL-Hep in an earlier time point followed by PRL-GAL and PRL-CSA. Only PRL and/or GAL show amorphous morphology throughout the aggregation time-course. The experiment is performed three times with similar observations. The scale bar is 200 nm as shown. (b) FTIR spectra of PRL-GAL, PRL-CSA and GAL-Hep along with PRL and GAL alone samples at day 0 and day 15 are shown. On day 0, PRL, PRL-CSA, and PRL-GAL shows the major peak at 1651 cm–1, which is characteristic of the α-helical structure. GAL and GAL-Hep shows the major peak at 1648 cm–1, which is characteristic of random coil (RC) structure. At day 15, PRL-GAL shows two peaks at 1633 and 1621 cm–1, representing β-sheet conformation. PRL-CSA shows a peak at 1635 cm–1 and GAL-Hep shows peaks at 1621 and 1633 cm–1 representing the β-sheet structure. The experiment is performed three times with similar observations.
-
Figure 2—figure supplement 3—source data 1
Time-dependent amyloid fibril formation by hormones using FTIR study.
- https://cdn.elifesciences.org/articles/73835/elife-73835-fig2-figsupp3-data1-v2.xlsx
Figure 2—figure supplement 4
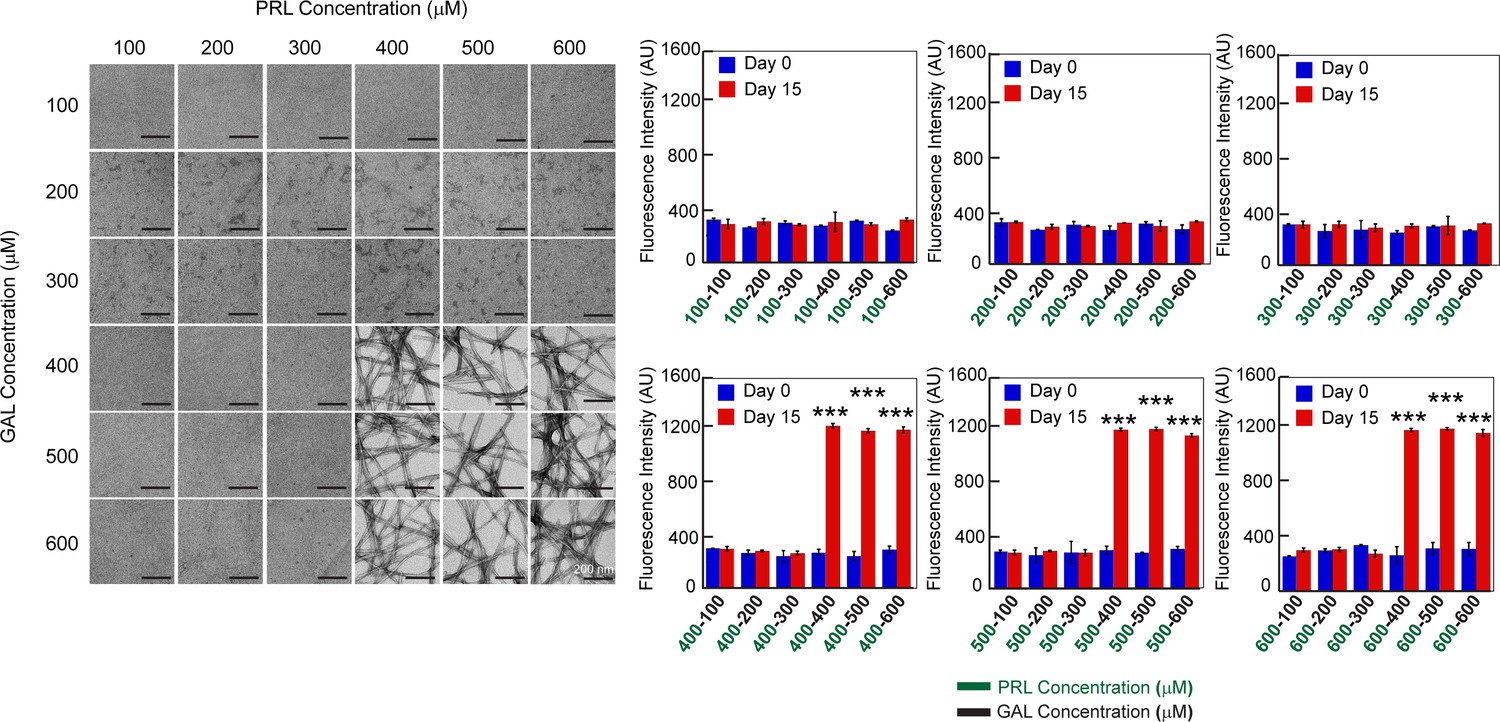
Concentration regime of PRL-GAL co-aggregation.
TEM images and ThT fluorescence of PRL-GAL co-aggregation at a varying concentration of PRL and GAL are shown. Both the (Left panel) TEM images and ThT fluorescence intensity at 480 nm (Right panel) suggest that PRL-GAL co-aggregation initiates above 400 µM concentration of each of the PRL and GAL as evident by the fibrillar morphology or high ThT fluorescence intensity at 480 nm. Values represent mean ± SD for n = 2 independent experiments. The statistical significance (***p ≤ 0.001) is calculated by one-way ANOVA followed by the SNK post hoc test with a 95% confidence interval.
-
Figure 2—figure supplement 4—source data 1
Concentration regime of PRL-GAL co-aggregation.
- https://cdn.elifesciences.org/articles/73835/elife-73835-fig2-figsupp4-data1-v2.xlsx
Figure 3 with 5 supplements
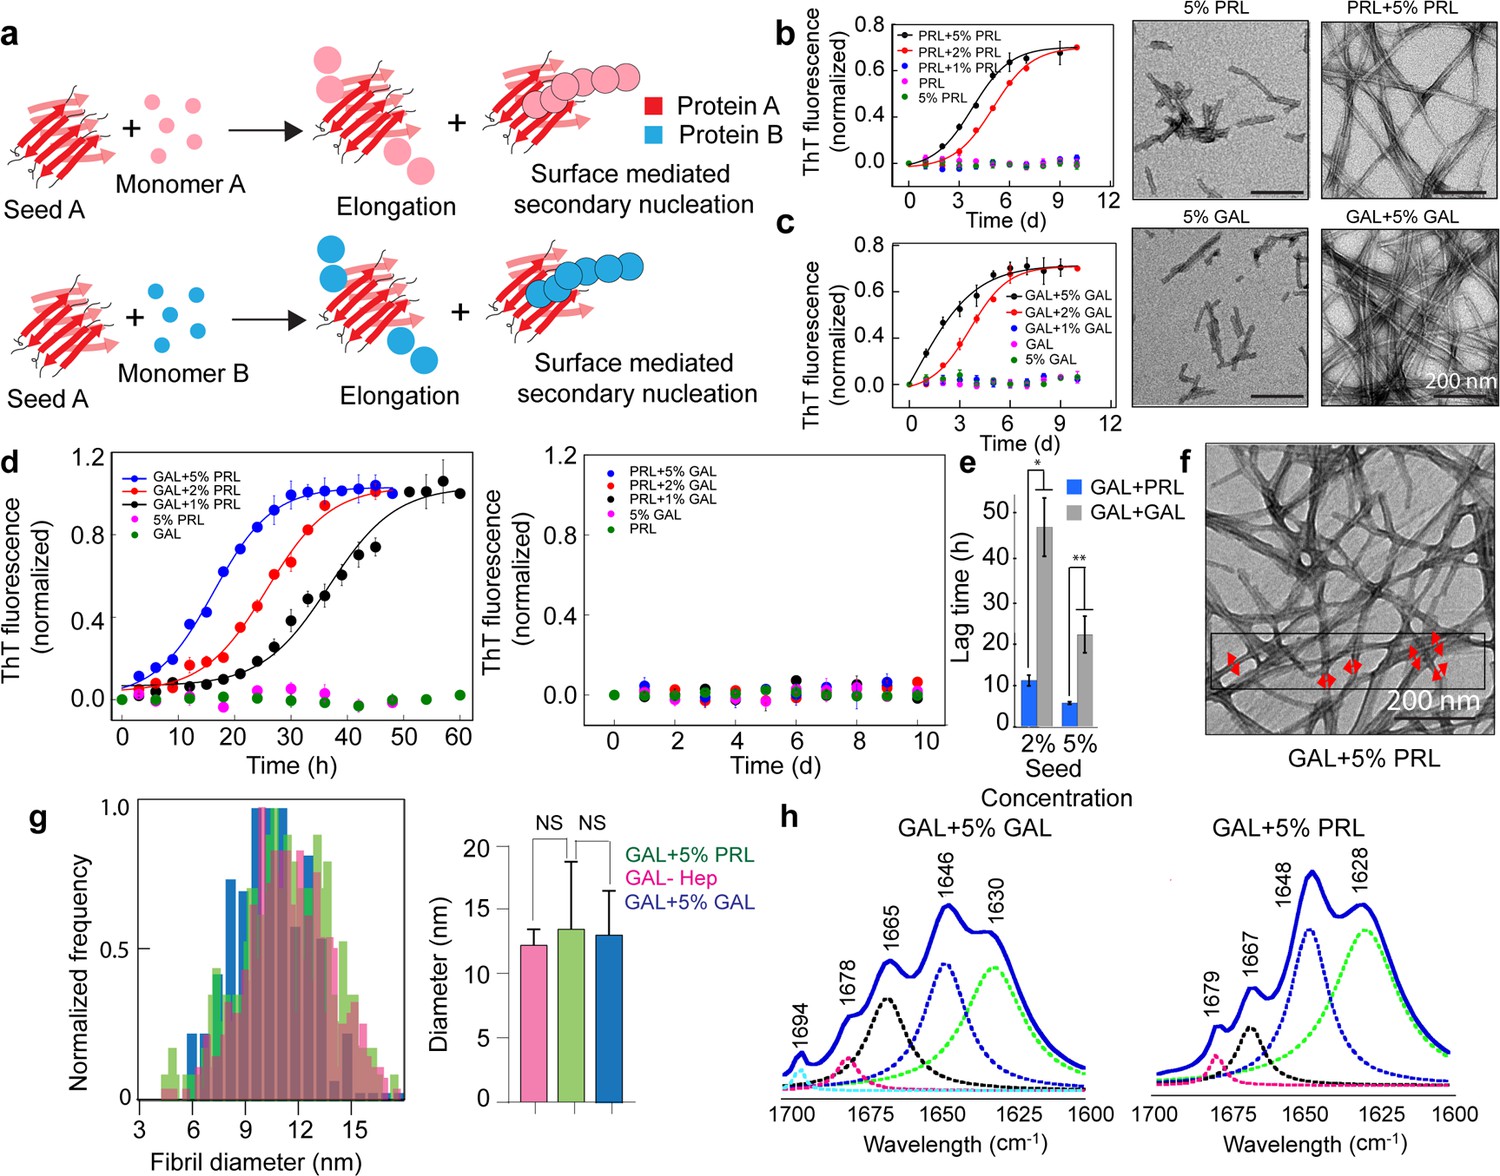
Seeding and cross-seeding of PRL and GAL.
(a) Schematic showing possible homo and hetero seeding with fibril elongation and surface-mediated secondary nucleation mechanism for seed-mediated fibril growth. (b–c) Homo-seeding of PRL and GAL. (Left panel) PRL and GAL homo-seeding. Normalized ThT fluorescence intensity values with time indicating aggregation of PRL/GAL and in the presence of different concentrations of PRL seeds and GAL seeds respectively (2% and 5% v/v). Only seeds and only PRL/GAL was used as controls. (Right panel) The corresponding EM images of PRL/GAL seeds alone and PRL/GAL monomer in presence of 5% PRL/GAL seeds showing fibrils formation by PRL/GAL homo-seeding. (d) Cross-seeding of PRL and GAL. (Left panel) Normalized ThT fluorescence intensity values with time indicating aggregation of GAL in the presence of different concentrations of PRL seeds (1%, 2%, and 5% v/v). However, PRL in presence of different percentages of GAL seeds does not show any aggregation (Right panel). Only seed and only GAL/PRL were used as controls where no aggregation is observed. (e) The lag times of GAL aggregation in presence of 2% and 5% (v/v) PRL seeds and GAL seeds are compared. The values represent mean ± SEM. The significance (***p ≤ 0.001) is calculated using one-way ANOVA followed by an SNK post hoc test with a 95% confidence interval. (f) TEM images of GAL fibrils formed in presence of PRL seeds are shown. GAL fibrils formed in presence of 5% (v/v) PRL seeds are analyzed for frequency distribution (red arrows indicating the diameter of the fibrils measured for analysis). (g) (Left panel) Normalized frequency distribution of fibril diameter showing GAL fibrils formed in presence of PRL seeds have a similar diameter to GAL-Hep fibrils. A total of 200 random data points from different individual fibrils were collected from n = 3 independent experiments for the frequency distribution analysis. (Right panel) Average values of different fibril diameters are shown. Values represent mean ± SD. The statistical significance (***p ≤ 0.001, **p ≤ 0.01) is calculated by one-way ANOVA followed by an SNK post hoc test with a 95% confidence interval. (h) FTIR spectra showing fibrils of GAL +5% GAL seed and GAL +5% PRL seed are of similar secondary structure.
-
Figure 3—source data 1
Seeding and cross-seeding of PRL and GAL.
- https://cdn.elifesciences.org/articles/73835/elife-73835-fig3-data1-v2.xlsx
Figure 3—figure supplement 1
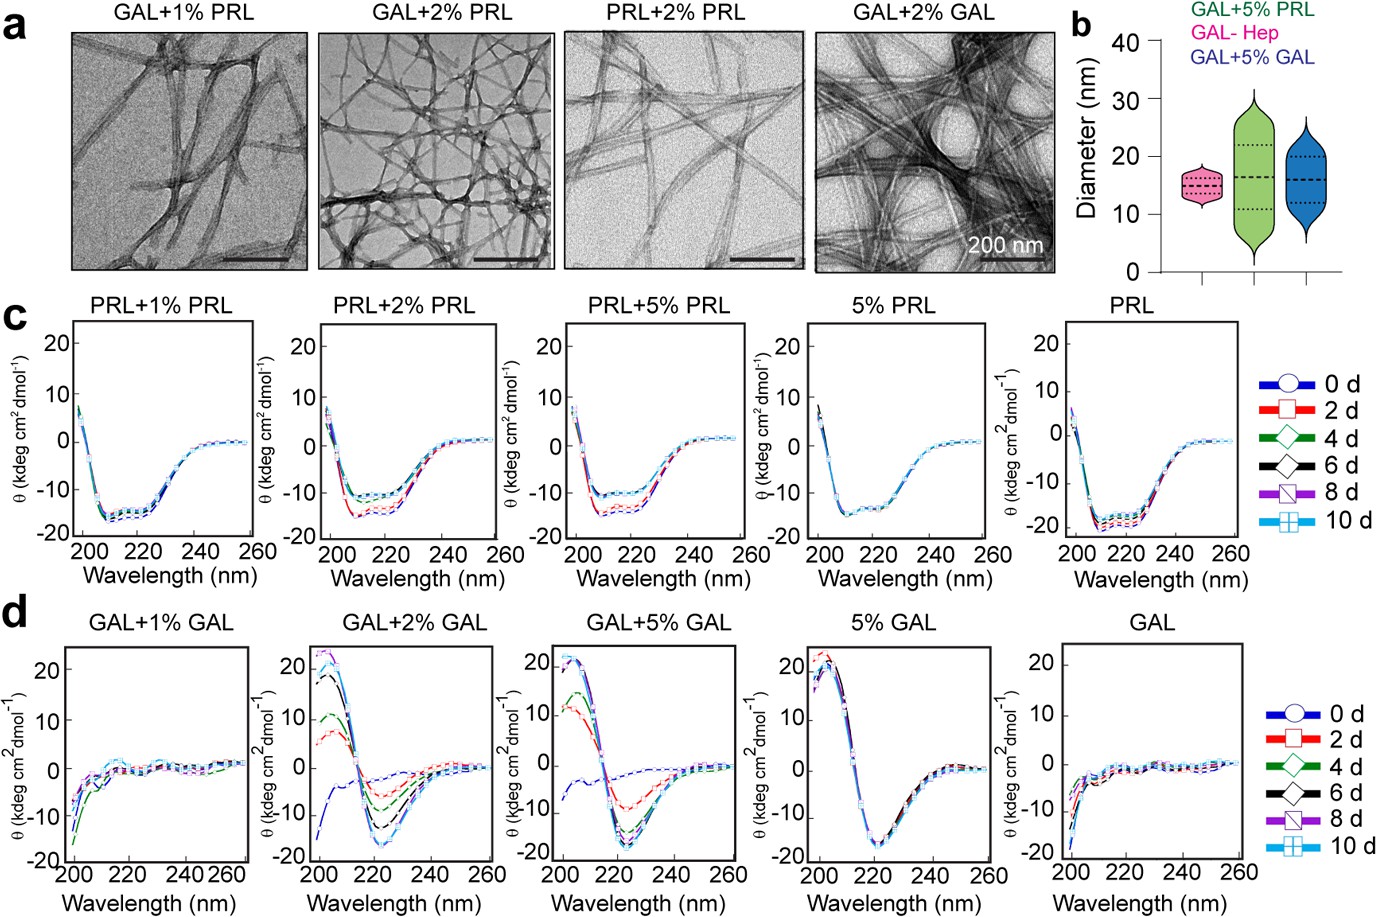
Aggregation and secondary structural transformations during seeding of PRL and GAL fibrils.
(a) TEM images showing the presence of amyloid fibrils of GAL when seeded with 1% and 2% (v/v) PRL seeds, respectively, and presence of amyloid fibrils of PRL and GAL when seeded with 2% (v/v) PRL and GAL seeds, respectively. (b) Median values of different fibril diameters are shown with violin plots. (c) CD spectra show the change in molar ellipticity of α-helical secondary structure of PRL in the presence of 2% and 5% PRL seeds, whereas 1% PRL seeds show no change in secondary structure. 5% PRL seed and PRL alone retain their secondary structure after incubation. (d) CD spectra show the change in GAL secondary structure from RC to β-sheet in presence of 2% and 5% GAL seeds; whereas 1% GAL seeds show no change in secondary structure. Only 5% GAL seed and GAL alone sample retain their secondary structure after incubation.
-
Figure 3—figure supplement 1—source data 1
Aggregation and secondary structural transformations during seeding of PRL and GAL fibrils.
- https://cdn.elifesciences.org/articles/73835/elife-73835-fig3-figsupp1-data1-v2.xlsx
Figure 3—figure supplement 2
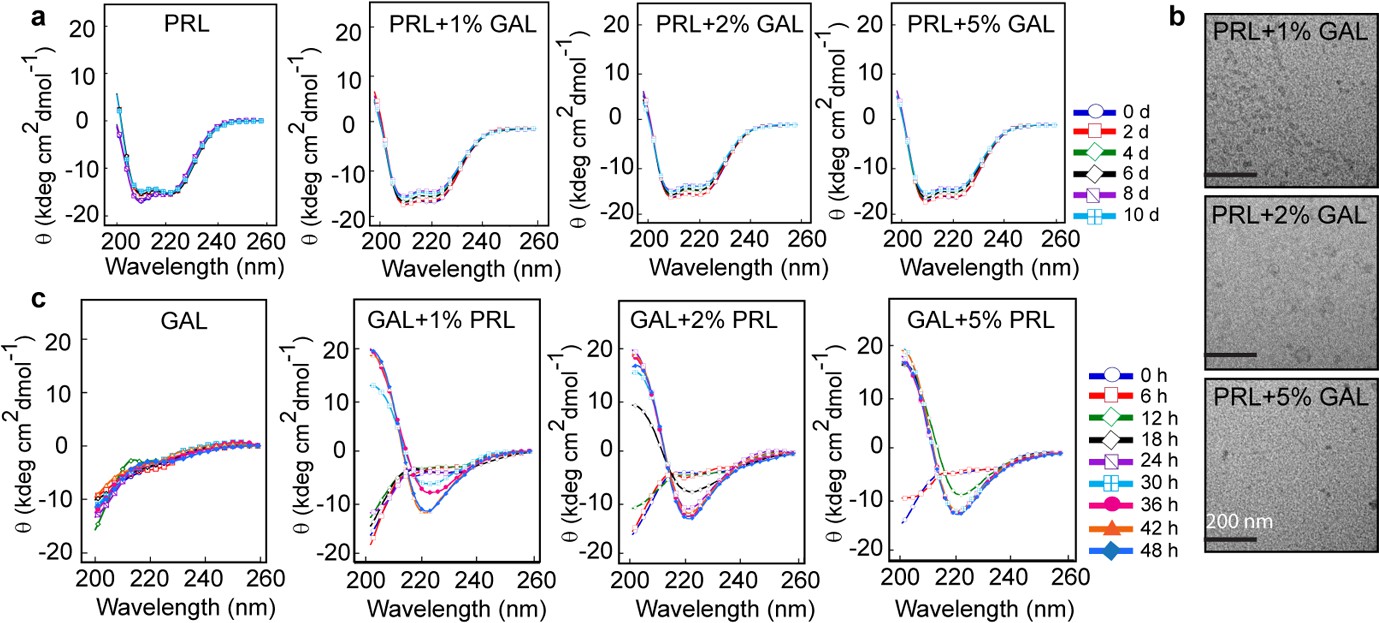
Secondary structural transformations due to cross-seeding of PRL and GAL fibrils.
(a) CD spectra showing no change in the α-helical secondary structure of PRL in the presence of a different concentration of GAL seeds (1%, 2%, and 5%). (b) TEM images show no fibril formation by PRL in the presence of 1%, 2%, and 5% GAL seeds. The scale bar is 200 nm as shown. (c) CD spectra showing changes in the secondary structure of GAL from RC to β-sheet in presence of different PRL seed (1%, 2%, and 5%) concentrations.
-
Figure 3—figure supplement 2—source data 1
Secondary structural transformations due to cross-seeding of PRL and GAL fibrils.
- https://cdn.elifesciences.org/articles/73835/elife-73835-fig3-figsupp2-data1-v2.xlsx
Figure 3—figure supplement 3
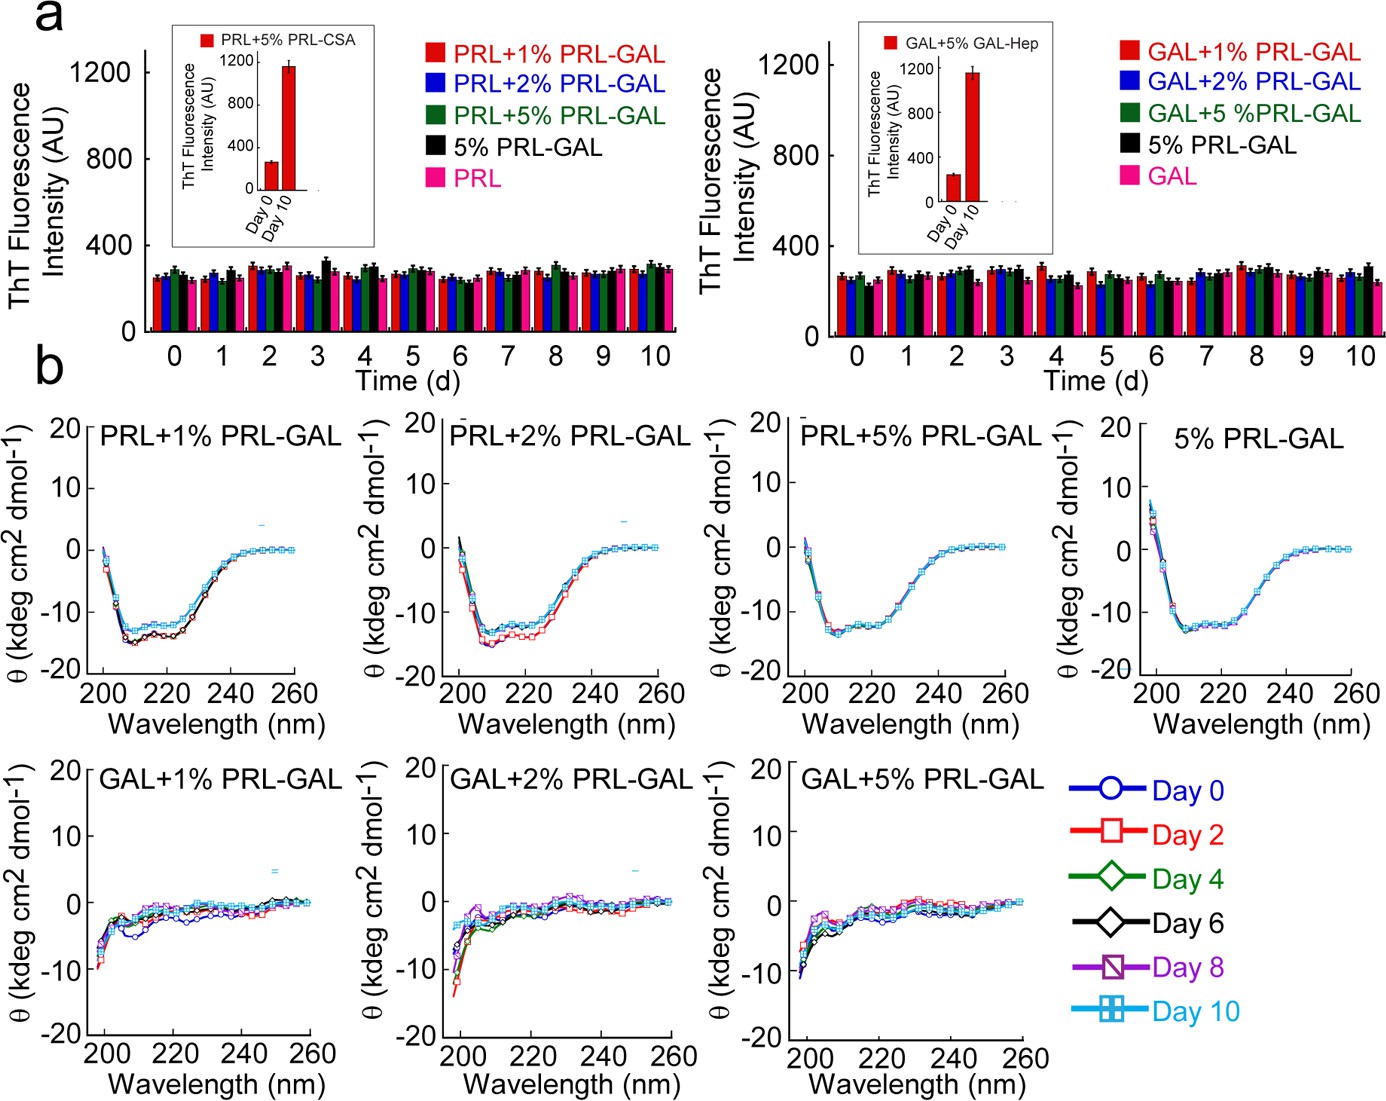
Cross-seeding of PRL and GAL by PRL-GAL co-fibrils.
(a) ThT fluorescence intensity values with time indicating no aggregation of PRL or GAL in presence of different concentrations of PRL-GAL co-fibrils seeds (1%, 2%, and 5% v/v). Only PRL-GAL seed and PRL/GAL monomer act as controls, which also showed no significant ThT binding. (b) CD spectra showing no change in the α-helical secondary structure of PRL or random-coil structure of GAL in presence of different concentrations of PRL-GAL co-fibril seeds (1%, 2%, and 5%) over time.
-
Figure 3—figure supplement 3—source data 1
Cross-seeding of PRL and GAL by PRL-GAL co-fibrils.
- https://cdn.elifesciences.org/articles/73835/elife-73835-fig3-figsupp3-data1-v2.xlsx
Figure 3—figure supplement 4

Electron microscopy of cross seeding of PRL and GAL by PRL-GAL co-fibril seed.
TEM images show no fibril formation by either PRL or GAL in presence of 1%, 2%, and 5% PRL-GAL seeds. TEM images of 5% PRL-GAL seeds and GAL +5% GAL-Hep seeds (as positive control) were shown. The scale bar is 200 nm as shown.
Figure 3—figure supplement 5

Fitting of PRL-GAL cross-seeding kinetics. (a, b, and c).
Global fitting of the normalized aggregation kinetics data using Amylofit for PRL seeded (1%, 2%, and 5%) aggregation of GAL monomer. Data shown to be satisfactorily fitted using secondary nucleation model comprising elongation and surface catalyzed secondary nucleation (Left panel) but not to the nucleation elongation model (Right panel). This is further supported by the relatively lower mean residual error (M.R.E.) in the surface-mediated secondary nucleation model compared to the nucleation elongation model.
-
Figure 3—figure supplement 5—source data 1
Fitting of PRL-GAL cross-seeding kinetics.
- https://cdn.elifesciences.org/articles/73835/elife-73835-fig3-figsupp5-data1-v2.xlsx
Figure 4 with 4 supplements
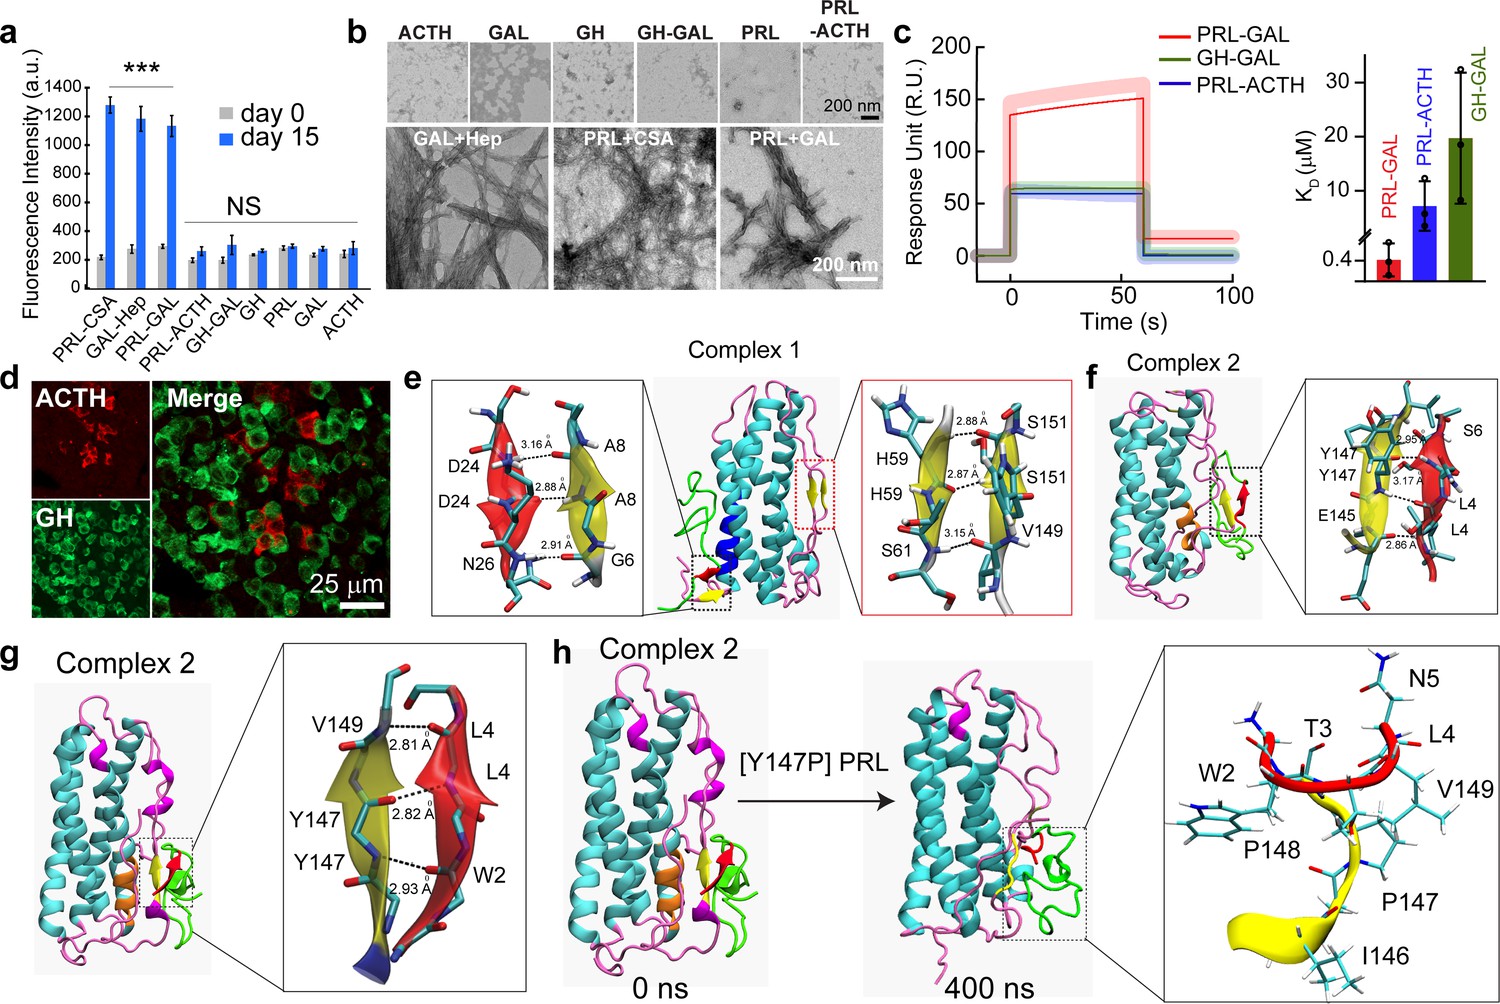
Specific interaction drives co-aggregation of PRL and GAL.
(a) Comparative ThT fluorescence showing amyloid formation by different pairs of hormones at days 0 and 15. PRL-CSA, GAL-Hep, PRL-GAL showed the highest ThT fluorescence signals after 15 days of incubation. Values represent mean ± SEM for n = 3 independent experiments. The statistical significance is calculated between day 0 and day 15 for each sample using a t-test. (b) The morphology observed under TEM for various hormones and the mixture of hormone samples is shown (after 15 days of incubation). Amorphous structures are seen for PRL-ACTH and GAL-GH; whereas PRL-GAL, PRL-CSA, GAL-Hep showed fibrillar morphology similar to amyloids. The experiment is performed three times with similar observations. (c) (Left panel) Surface Plasmon Resonance (SPR) spectra showing strong binding of PRL on immobilized GAL compared to other pairs of hormones. (Right panel) The dissociation constant (KD) of PRL to GAL showing strong interaction between PRL and GAL for their co-aggregation and co-storage. The experiments are performed three times with similar results. (d) Double immunofluorescence microscopic images of the anterior pituitary of female rats showing ACTH (red) and GH (green) expressing cells. The merged microscopic image (right) shows no co-localization of ACTH (red) and GH (green). The data indicate that ACTH and GH are not co-stored in the female rat anterior pituitary. The experiments were performed three times with similar observations. (e) Snapshot from in silico analysis (MD simulation) of PRL-GAL complex 1 using GROMOS 53a6 force field (when GAL is docked near residues 18–28 of PRL). (f) Snapshot showing MD simulation of PRL-GAL complex 2 (when GAL is docked near residues 80–88 of PRL) using GROMOS 53a6 force field. Complex 1 induced the formation of an antiparallel β-sheet at the PRL-GAL interface (6–8 PRL and 24–26 GAL) and also an intra-molecular parallel β-sheet in PRL itself (59–61 PRL and 149–151 PRL). Complex 2 shows the formation of a parallel β-sheet constituted by the β-strand from PRL and GAL (145–147 PRL and 4–6 GAL). (g) Snapshot of MD simulation of complex 2 using Amber ff99SB force field showing the appearance of parallel β-sheet at 147–149 residue of PRL and 2–4 residue of GAL. The snap-shot of complex 1 is included in Figure 4—figure supplement 3. (h) A point mutation is introduced in the PRL of the complex 2 structure, which is Y147P to examine if there is a loss in the β-sheet formation. The initial structure of the complex had the β-sheet formed between residues 147–149 of PRL and residues 2–4 of GAL (Left panel), which went missing during the 400 ns MD simulation run of the mutated system (right panel).
-
Figure 4—source data 1
Specific interaction drives co-aggregation of PRL and GAL.
- https://cdn.elifesciences.org/articles/73835/elife-73835-fig4-data1-v2.xlsx
-
Figure 4—source data 2
Parameter values for surface plasmon resonance spectroscopy (SPR) table.
- https://cdn.elifesciences.org/articles/73835/elife-73835-fig4-data2-v2.docx
-
Figure 4—source data 3
Parameter values for surface plasmon resonance spectroscopy (SPR).
- https://cdn.elifesciences.org/articles/73835/elife-73835-fig4-data3-v2.xlsx
Figure 4—figure supplement 1
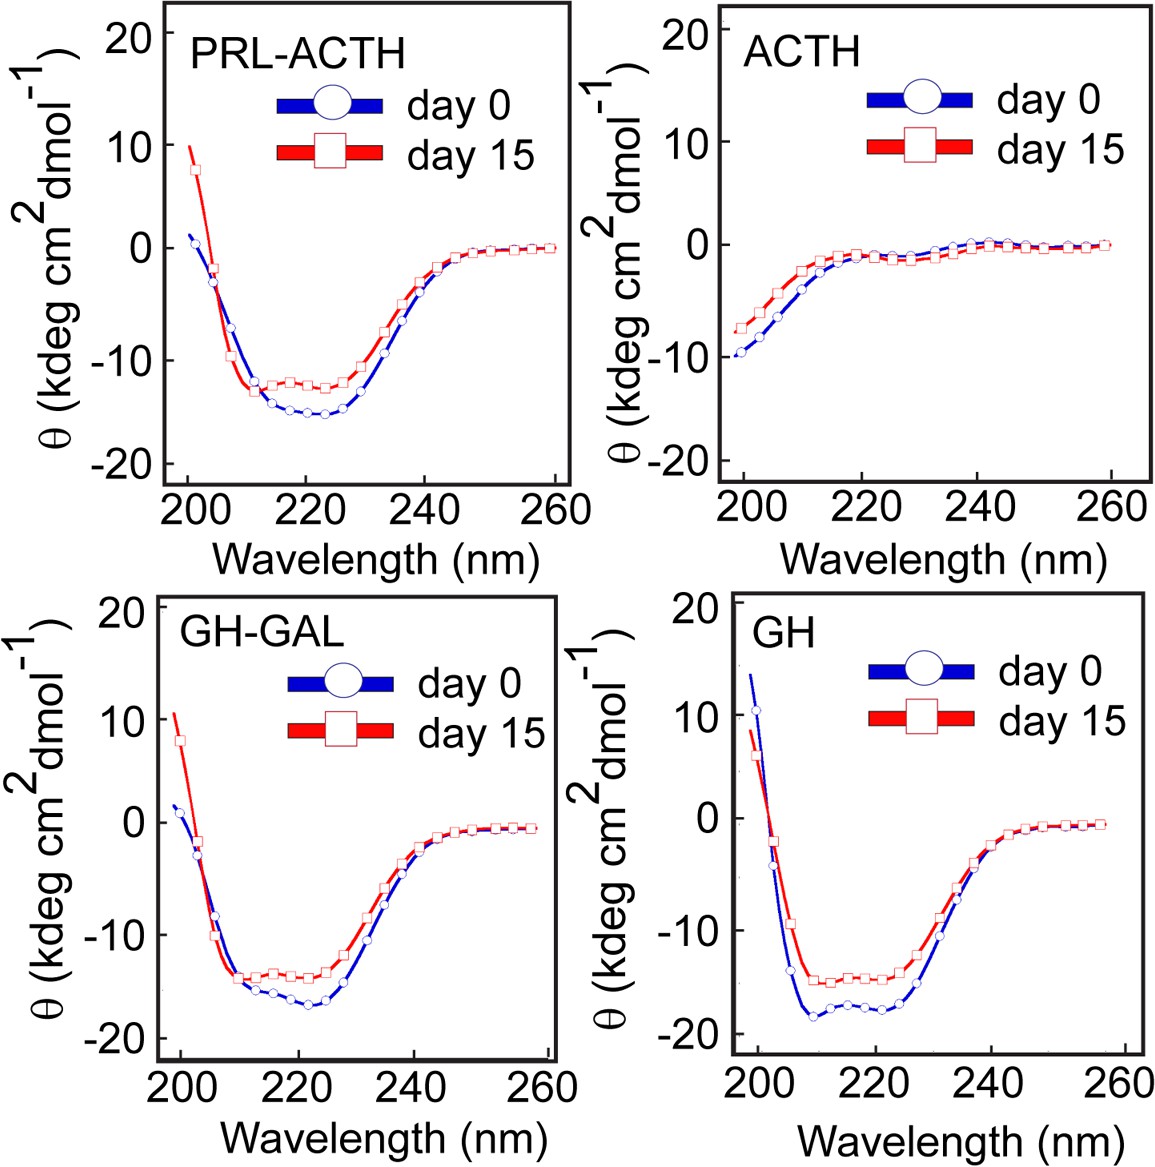
Conformational transition by different pairs of hormone co-aggregation using CD.
CD spectra show no significant secondary structural transformation of PRL-ACTH and GAL-GH indicating no synergistic aggregation of these hormone pairs. The experiment is performed three times with similar results.
-
Figure 4—figure supplement 1—source data 1
Conformational transition by different pairs of hormone co-aggregation using CD.
- https://cdn.elifesciences.org/articles/73835/elife-73835-fig4-figsupp1-data1-v2.xlsx
Figure 4—figure supplement 2
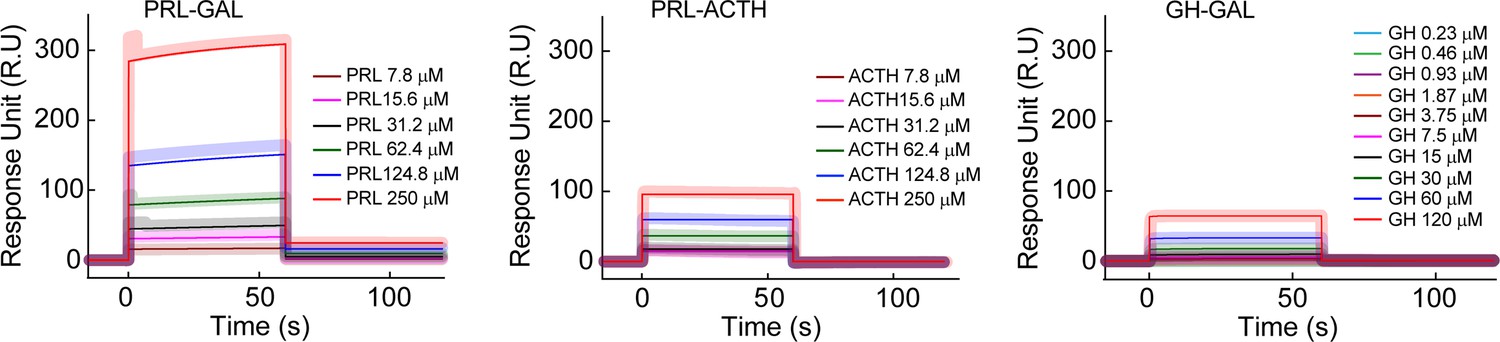
Surface plasmon resonance spectroscopy (SPR) for inter-hormone interactions.
The SPR plot shows a relatively strong interaction between PRL-GAL (higher response unit) in comparison to PRL-ACTH (lower response unit) and GH-GAL (lower response unit). The different color SPR spectrum indicated different concentrations of analytes, whereas other hormones in the pair were immobilized to the SPR chip. The thick line indicates the original spectrum and the corresponding thin line indicates the fitted spectra.
-
Figure 4—figure supplement 2—source data 1
Surface plasmon resonance spectroscopy (SPR) for inter-hormone interactions.
- https://cdn.elifesciences.org/articles/73835/elife-73835-fig4-figsupp2-data1-v2.xlsx
Figure 4—figure supplement 3
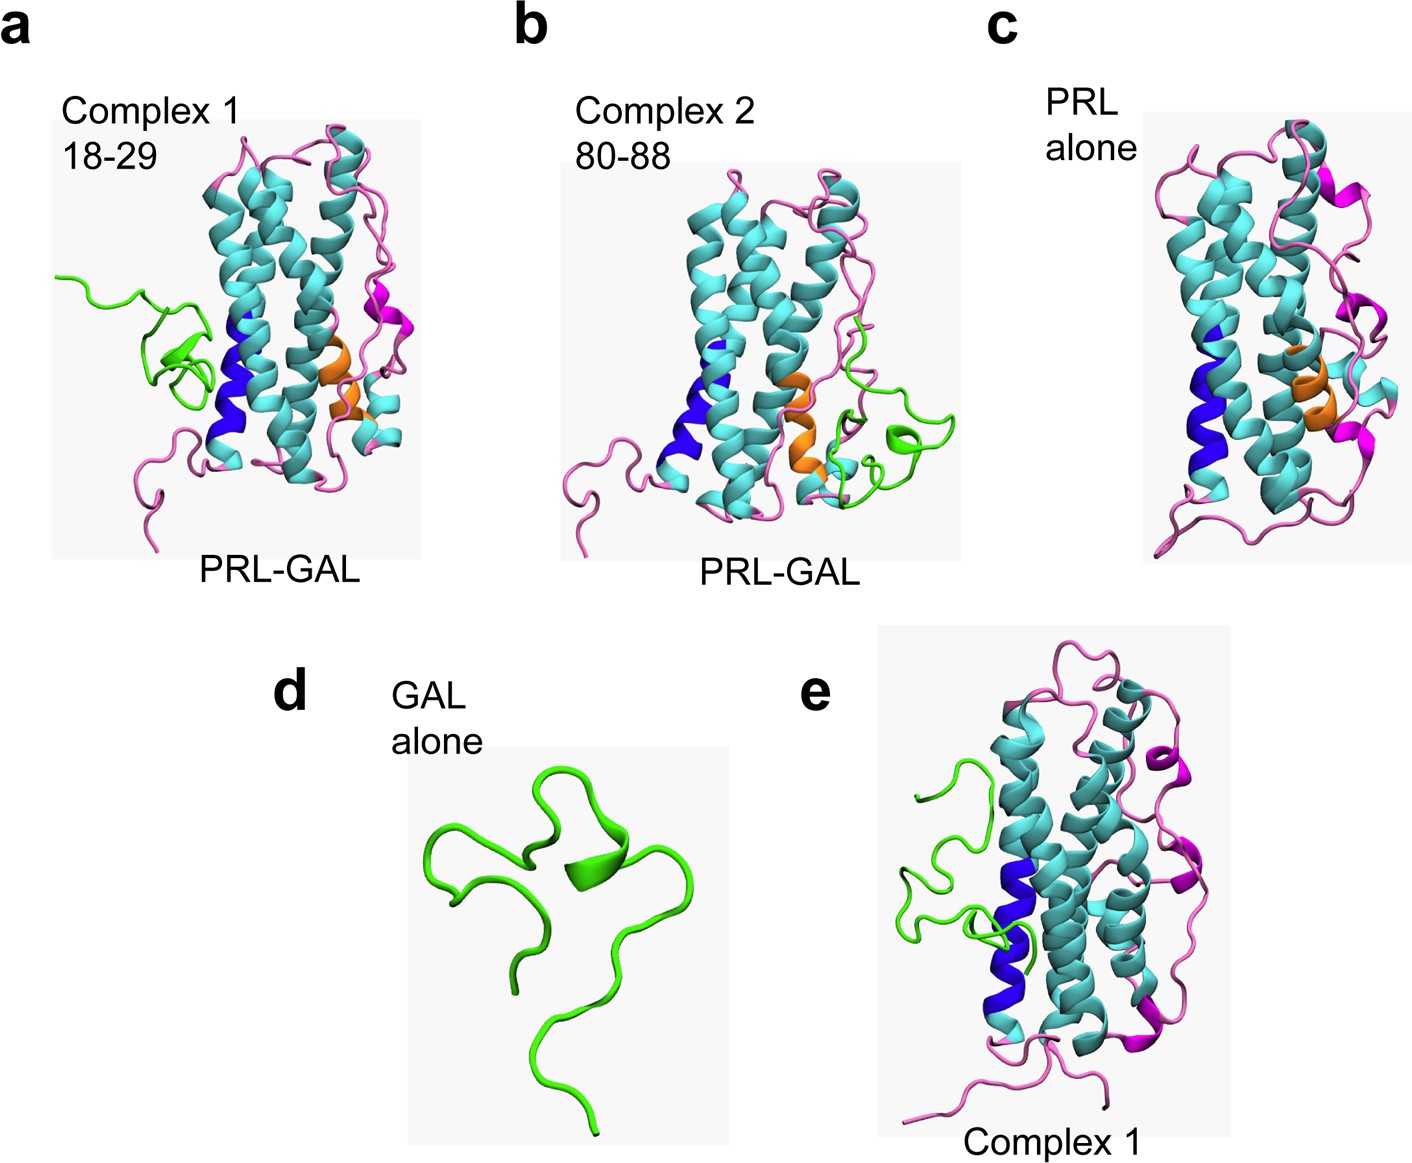
Protein-protein docking and MD simulations of PRL-GAL complexes.
(a–b) Structures of PRL-GAL docked complexes from protein-protein docking studies, which were subsequently used as the starting structures for MD simulations. The two lowest energy PRL-GAL complexes as obtained from docking studies are defined as follows – complex 1: GAL docked at PRL residues 18–28 (blue); complex 2: GAL docked at PRL residues 80–88 (orange). GAL is shown in green and PRL helices are shown in cyan and loops-coils are in magenta. (c) Snapshots from MD simulations of individual PRL. (d) Snapshots from MD simulations of individual GAL. (e) The structure of complex 1 shows no change in either of the PRL/GAL structures after simulation using amber ff99SB force field.
Figure 4—figure supplement 4
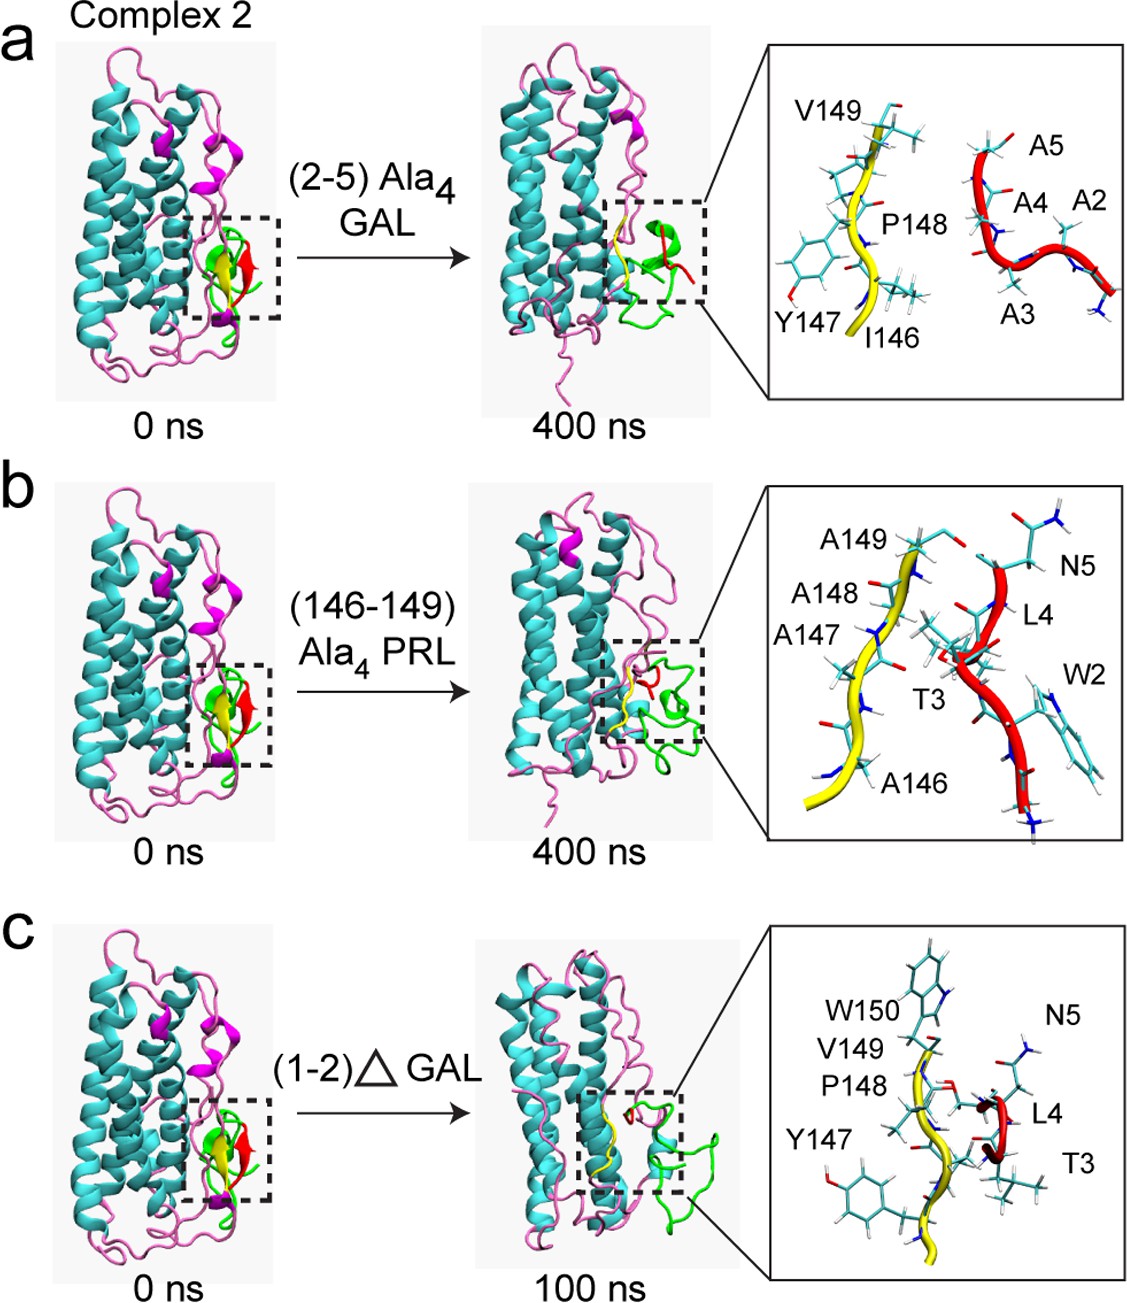
Mutation/deletion of certain interface residues disrupt PRL-GAL interaction.
MD simulation results are shown when - (a) GAL residues 2–5 (WTLN) are mutated to alanine (b) PRL residues 146–149 (IYPV) are mutated to alanine (c) N-terminal GAL residues 1–2 (GW) were deleted. The initial structure of the complex (complex 2 from AMBER) had the β-sheet formed between residues 147–149 of PRL and residues 2–4 of GAL (Left panel), which is missing in the mutated/deleted systems after 400/100 ns of simulations (Right panel).
Figure 5
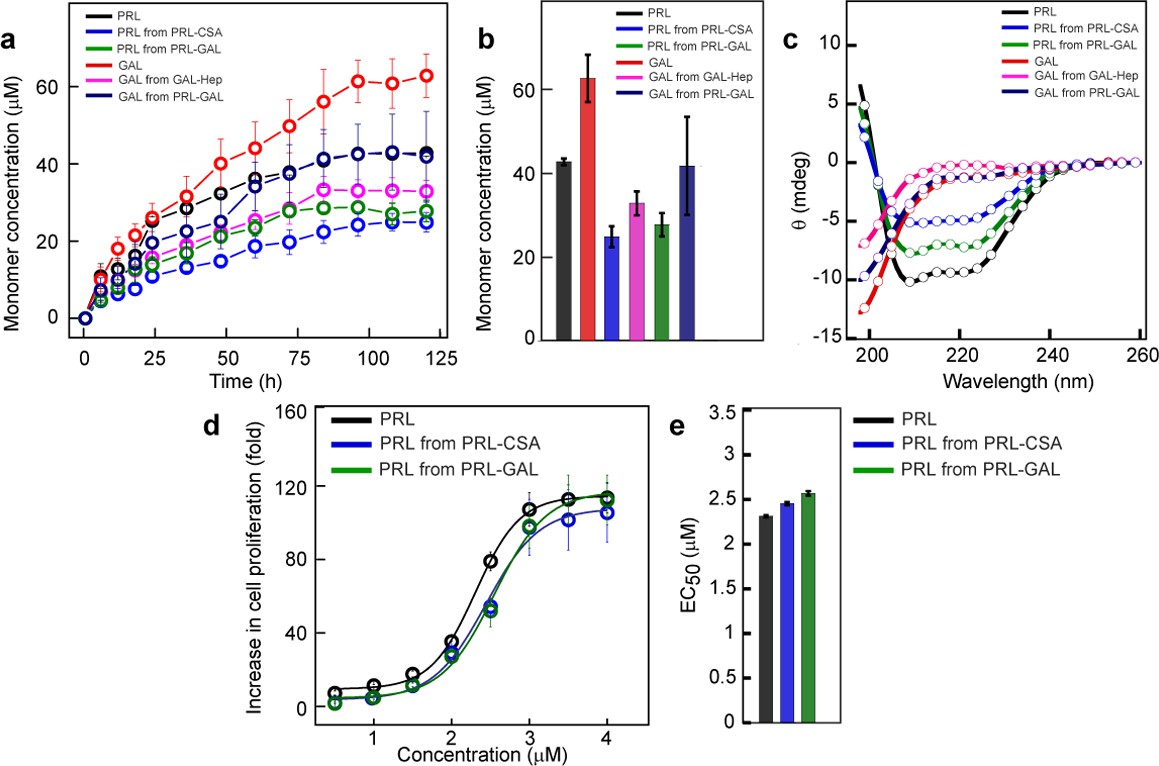
Monomer release from PRL and GAL amyloid.
(a) The kinetics of monomer release from various amyloids showing the continuous release of monomeric hormones. The experiment is performed three times with similar results. Values represent mean ± SEM for n = 3 independent experiments. (b) Saturation concentrations of different released monomers from fibrils along with the monomeric controls are shown. Values represent mean ± SEM for n = 3 independent experiments. (c) The secondary structure of released monomers showing their corresponding native secondary structures as confirmed by the CD. (d) Nb2 cell proliferation study showing biological activity of released PRL from either PRL-CSA or PRL-GAL fibrils. Freshly dissolved protein was used as a control. Values represent mean ± SEM for n = 3 independent experiments. (e) EC50 values showing the released PRL monomers have similar bioactivity compared to freshly dissolved monomeric PRL. Values represent mean ± SEM for n = 3 independent experiments.
-
Figure 5—source data 1
Monomer release from PRL and GAL amyloid.
- https://cdn.elifesciences.org/articles/73835/elife-73835-fig5-data1-v2.xlsx
Figure 6
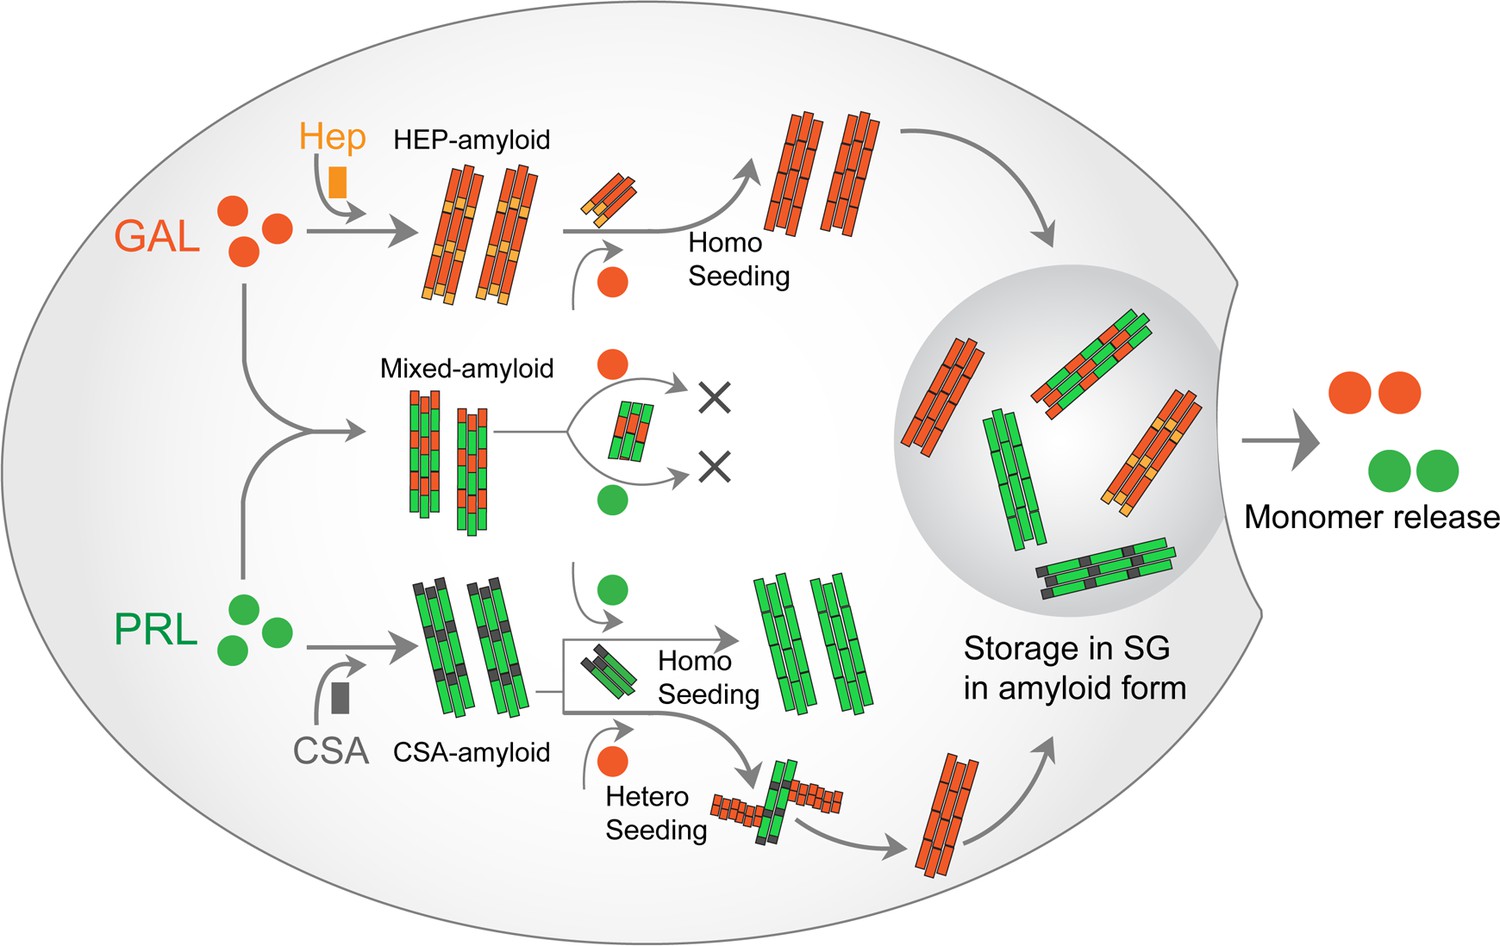
PRL-GAL homo and hetero amyloid life cycle for SGs.
PRL and GAL form the amyloid fibrils in the presence of specific glycosaminoglycans (CSA and Hep, respectively), which can be auto-catalytically amplified by their respective seeding with preformed fibrils. This seeding however does not require any glycosaminoglycans. PRL-GAL also synergistically co-aggregate to form hybrid amyloid fibrils, which are not capable of seeding either to PRL or GAL. These amyloid fibril species can together or individually reconstitute the SGs of PRL-GA storage, which can release functional PRL and GAL into the extracellular space.
Tables
Key resources table
| Reagent type (species) or resource | Designation | Source or reference | Identifiers | Additional information |
|---|---|---|---|---|
| Cell line (Rattus norvegicus) | Nb2 cells (rat lymphoma cells) | PMID:27277580Kind gift from Prof. Amulya K. Panda, National Institute of Immunology, New Delhi | ||
| Biological sample (Rattus norvegicus) | Rat pituitary tissue sections (Adult Sprague-Dawley rats) | NISER BhubaneswarInstitutional Animal Ethical Committee (IAEC) at NISER, Bhubaneswar | Protocol Numbers: NISER/SBS/AH-210 and NISER/SBS/AH-212 | Approved by the Committee for the Purpose of Control and Supervision of Experiments for Animals (CPCSEA), New Delhi, India |
| Antibody | Anti-PRL(guinea pig polyclonal) | A.F. Parlow,National Hormone and Pituitary Program (NHPP) | AFP7192490 | 1: 1500 |
| Antibody | Anti-GAL(mouse polyclonal) | Abcam | Ab216399 | 1:1500 |
| Antibody | OC antibody(rabbit polyclonal) | Abcam | Ab126468 | 1:500 |
| Antibody | Goat anti-rabbit FITC (polyclonal) | Thermo Fisher Scientific, USA | 65–6111 | 1:500 |
| Antibody | Goat anti-mouse FITC (polyclonal) | Thermo Fisher Scientific, USA | 31,569 | 1:500 |
| Antibody | Goat anti-guinea pig Alexa Fluor 555 (polyclonal) | Thermo Fisher Scientific, USA | A21435 | 1:500 |
| Antibody | Anti-ACTH (rabbit polyclonal) | PMID:22403619Kind gift from A.F. Parlow,National Hormone and Pituitary Program (NHPP) | 1:1000 | |
| Antibody | Anti-GH(goat polyclonal) | R&D Systems | AF1566 | 1:1000 |
| Antibody | Alexa Fluor-594 anti-rabbit (polyclonal) | Thermo Fisher Scientific, USA | A-21207 | 1:500 |
| Antibody | Goat anti-mouse Alexa fluor 555 (polyclonal) | Thermo Fisher Scientific, USA | A32727 | 1:500 |
| Antibody | Alexa fluor 488 anti goat (polyclonal) | Thermo Fisher Scientific, USA | A-11055 | 1:500 |
| Peptide, recombinant protein | Galanin | USV Limited (Mumbai, India) | Custom synthesis | |
| Software, algorithm | KaleidaGraph | Version 4.0 |
Additional files
Download links
A two-part list of links to download the article, or parts of the article, in various formats.
Downloads (link to download the article as PDF)
Open citations (links to open the citations from this article in various online reference manager services)
Cite this article (links to download the citations from this article in formats compatible with various reference manager tools)
Co-aggregation and secondary nucleation in the life cycle of human prolactin/galanin functional amyloids
eLife 11:e73835.
https://doi.org/10.7554/eLife.73835


