Targeting the Annexin A1-FPR2/ALX pathway for host-directed therapy in dengue disease
- Department of Morphology, Institute of Biological Sciences, Universidade Federal de Minas Gerais, Brazil
- Department of Biochemistry and Immunology, Institute of Biological Sciences, Universidade Federal de Minas Gerais, Brazil
- School of Medicine, Universidade Federal de Minas Gerais, Brazil
- William Harvey Research Institute, Barts and The London School of Medicine and Dentistry, Queen Mary University of London, United Kingdom
- Institute of Infection, Immunity and Inflammation, College of Medical, Veterinary and Life Sciences, University of Glasgow, United Kingdom
- Department of Microbiology, Institute of Biological Sciences, Universidade Federal de Minas Gerais, Brazil
- Department of Biology, Institute of Biological Sciences, Federal University of Juiz de Fora, Brazil
- Tropical Pathology and Public Health Institute, Universidade Federal de Goiás, Brazil
- Department of Clinical and Toxicological Analyses, School of Pharmacy, Universidade Federal de Minas Gerais, Brazil
- Centre for Inflammation and Therapeutic Innovation, Queen Mary University of London, United Kingdom
Figures
Figure 1

Annexin A1 (AnxA1) levels are reduced in dengue patients and mice infected with dengue virus (DENV).
(A) AnxA1 plasma levels in healthy and dengue patients. The latter group was stratified into non-severe dengue (non-SD, outpatients) and severe dengue (SD, inpatients) individuals. Each circle represents an individual participant and horizontal bars represent mean values for AnxA1 (ng/mL of plasma), assayed by ELISA. ****p<0.0001, **p<0.01 by two-tailed Mann–Whitney test. (B) Five-week-old BALB/c (n = 8) or (C) C57BL/6 (n = 5–6) WT mice were intravenously injected with 1 × 10⁶ PFU of DENV-2 and culled in the indicated time points for plasma collection. AnxA1 plasma levels analysed by ELISA are shown. ***p<0.001 and ****p<0.0001 versus mock-infected group; #p<0.05, ##p<0.01 and ####p<0.0001 versus 24-hr-infected group; &&p<0.01 and &&&&p<0.0001 versus 48-hr-infected group; $$$p<0.001 versus 72-hr-infected group (one-way ANOVA followed by Tukey’s post hoc test).
-
Figure 1—source data 1
Raw data for Figure 1A–C.
- https://cdn.elifesciences.org/articles/73853/elife-73853-fig1-data1-v2.xlsx
Figure 2 with 1 supplement
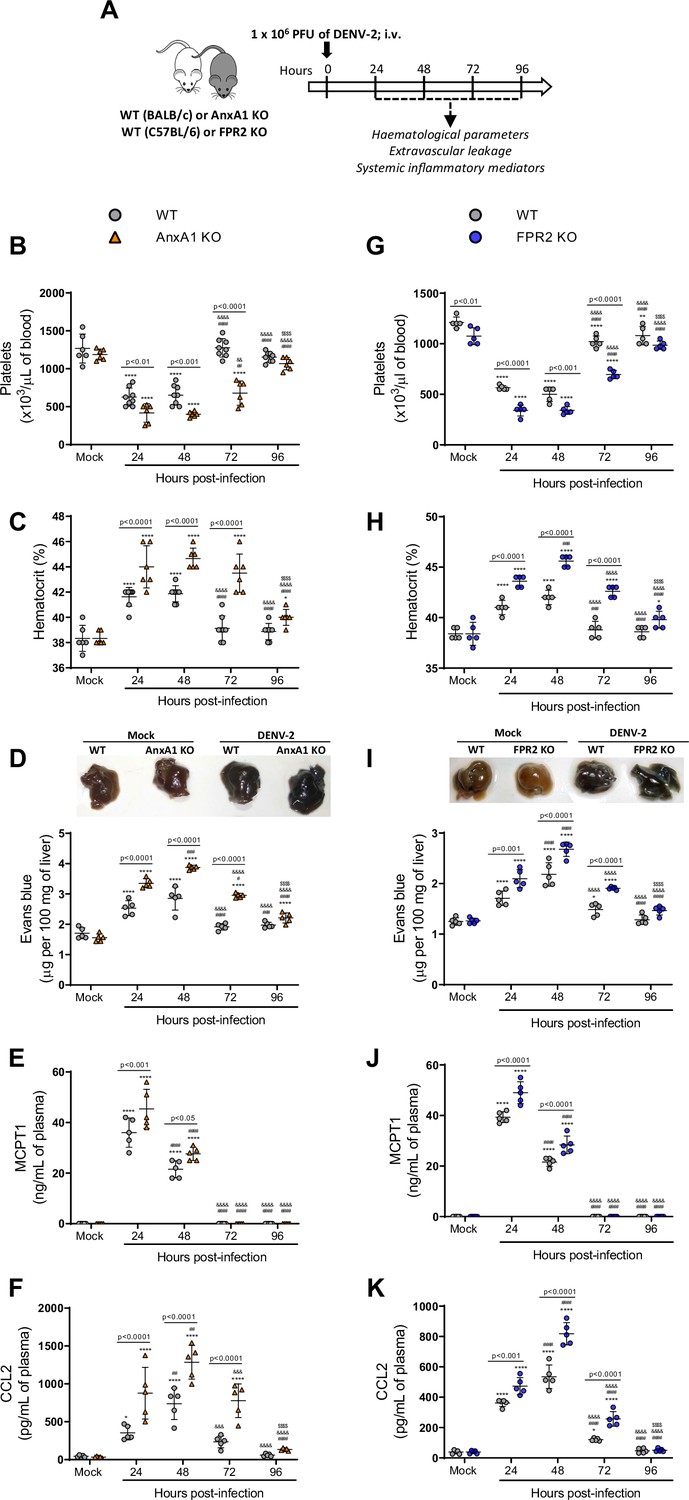
Mice are more susceptible to dengue virus (DENV-2) infection in the absence of Annexin A1 (AnxA1) or its receptor formyl peptide receptor 2 (FPR2).
(A) Experimental design. (B–F) Five-week-old BALB/c WT and AnxA1 KO or (G–K) C57BL/6 and FPR2 KO mice were intravenously inoculated with 1 × 10⁶ PFU DENV-2. Mice were culled in the indicated time points after infection and blood and tissue were collected for the following analysis: (B,G) platelet counts, shown as the number of platelets × 103/μL of blood; (C,H) haematocrit levels, shown as % volume occupied by red blood cells; (D,I) vascular leakage assay with Evans blue dye; concentrations of (E,J) MCPT-1 and (F,K) CCL2 in plasma, quantified by ELISA and shown as quantity per mL of plasma. B–C, n = 6–8 animals per group; D–K, n = 5. Differences over time were compared by two-way ANOVA followed by Turkey’s multiple comparison test: *p<0.05, **p<0.01, ***p<0.001, and ****p<0.0001 versus mock-infected group; #p<0.05, ##p<0.01, ###p<0.001, and ####p<0.0001 versus 24-hr-infected group; &p<0.05, &&p<0.01, &&&p<0.001, and &&&&p<0.0001 versus 48-hr-infected group; $p<0.05, $$p<0.01, $$$p<0.001, and $$$$p<0.0001 versus 72-hr-infected group. Differences between genotypes were compared by two-way ANOVA followed by Sidak’s multiple comparison test, as indicated in the graphs.
.
-
Figure 2—source data 1
Raw data for Figure 2B–K.
- https://cdn.elifesciences.org/articles/73853/elife-73853-fig2-data1-v2.xlsx
Figure 2—figure supplement 1
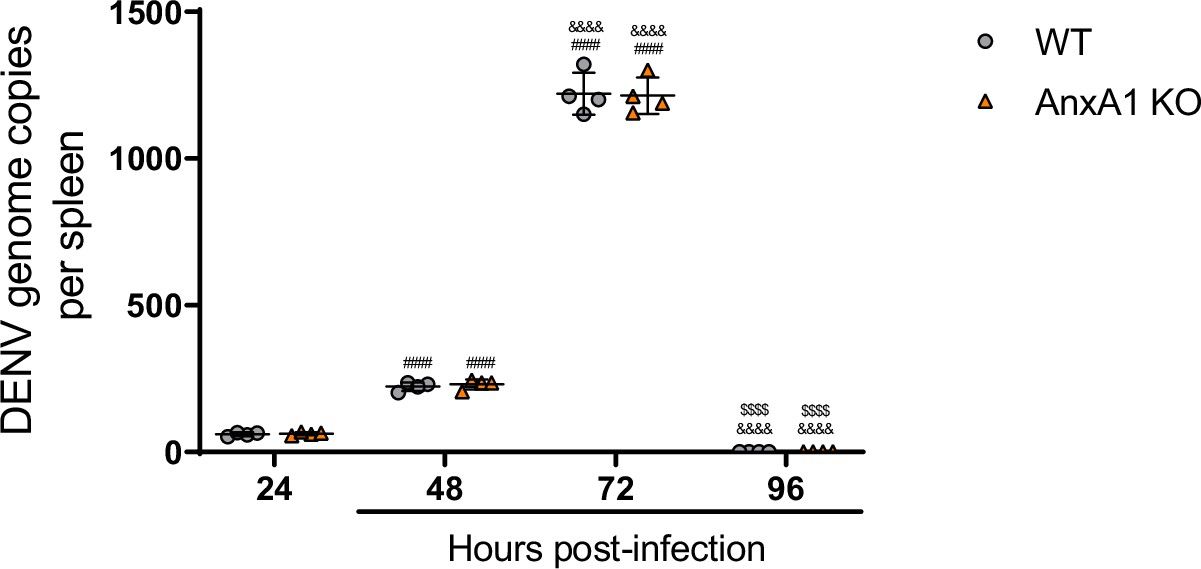
Dengue virus (DENV) replication is not altered by the absence of AnxA1.
Five-week-old C57BL/6 WT mice (n = 4) were inoculated with 1 × 10⁶ PFU of DENV-2 by the intravenous route. Mice were culled in the indicated time points after infection, and the spleen was harvested virus RNA quantification. After cDNA conversion, real-time reverse-transcription PCR was performed to quantitate DENV genome copies in the spleen, which was normalised to spleen mass. Results are expressed as mean (horizontal bars) ± SD. Differences over time were compared by two-way ANOVA followed by Turkey’s multiple comparison test: ####p<0.0001 versus 24-hr-infected group; &&&&p<0.0001 versus 48-hr-infected group; $$$$p<0.0001 versus 72-hr-infected group. There was no statistical difference between the genotypes, as evaluated by two-way ANOVA followed by Sidak’s multiple comparison test.
Figure 3 with 2 supplements
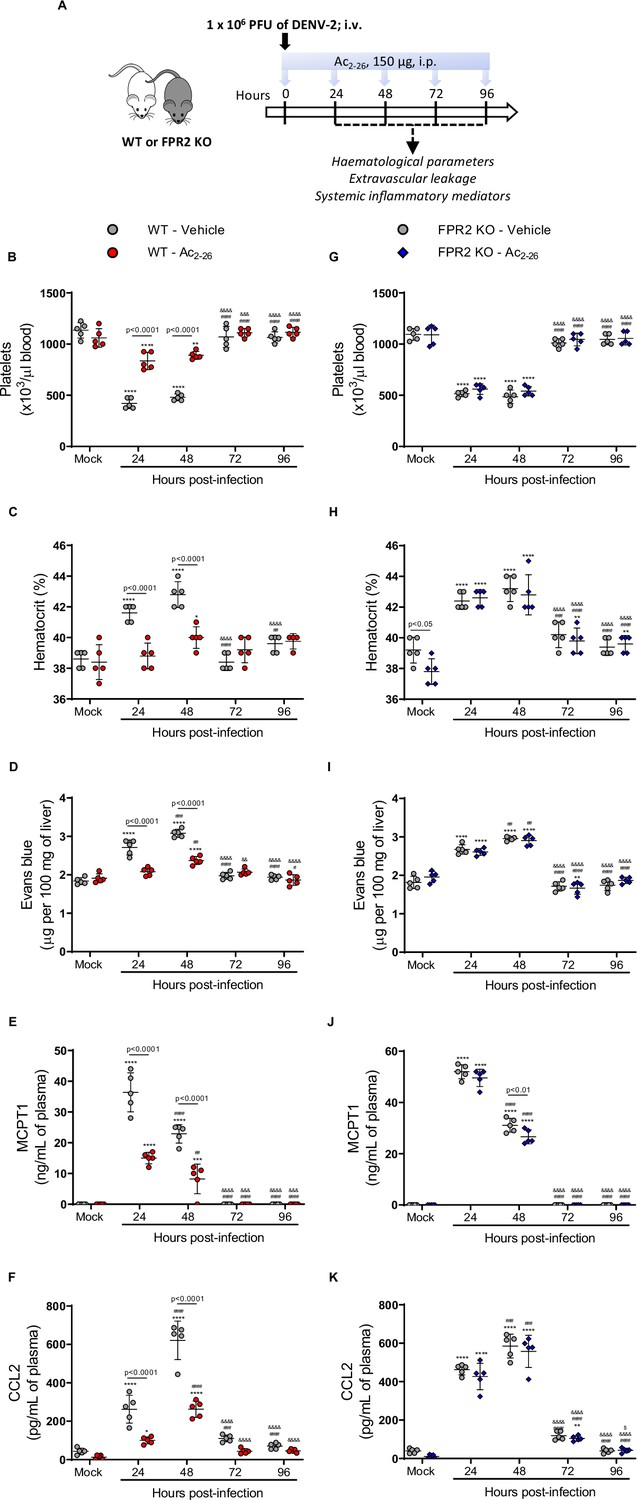
Annexin A1 mimetic peptide Ac2-26 improves DENV-induced manifestations in wild-type (WT) mice and does not affect animals lacking its receptor formyl peptide receptor 2 (FPR2).
(A) Experimental design. Five-week-old BALB/c WT (B–F) and FPR2 KO (G–K) mice were intravenously inoculated with 1 × 10⁶ PFU DENV-2. Mice were treated or not with 150 μg Ac2-26 at the time of infection and daily thereafter by the intraperitoneal route. Mice were culled in the indicated time points after infection, and blood and tissue were collected for the following analysis: (B,G) platelet counts, shown as the number of platelets × 103 /μL of blood; (C,H) haematocrit levels, shown as % volume occupied by red blood cells; (D,I) vascular leakage assay with Evans blue dye; concentrations of (E,J) MCPT-1 and (F,K) CCL2 in plasma, quantified by ELISA and shown as quantity per mL of plasma. N = 5 animals per group, except for graph C where n = 4–5. Differences over time were compared by two-way ANOVA followed by Turkey’s multiple comparison test: *p<0.05, **p<0.01, ***p<0.001, and ****p<0.0001 versus mock-infected group; #p<0.05, ##p<0.01, ###p<0.001, and ####p<0.0001 versus 24-hr-infected group; &p<0.05, &&p<0.01, &&&p<0.001, and &&&&p<0.0001 versus 48-hr-infected group; $p<0.05, $$p<0.01, $$$p<0.001, and $$$$p<0.0001 versus 72-hr-infected group. Differences between genotypes were compared by two-way ANOVA followed by Sidak’s multiple comparison test, as indicated in the graphs.
-
Figure 3—source data 1
Raw data for Figure 3B–K.
- https://cdn.elifesciences.org/articles/73853/elife-73853-fig3-data1-v2.xlsx
Figure 3—figure supplement 1
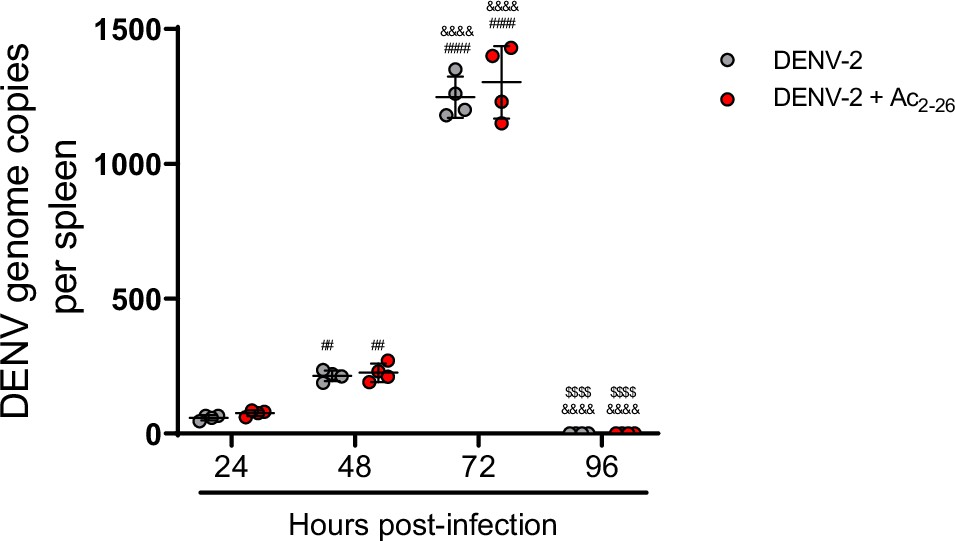
Dengue virus (DENV) replication is not altered by treatment with Annexin A1 mimetic peptide Ac2-26.
Five-week-old BALB/c WT mice (n = 4) were inoculated with 1 × 10⁶ PFU of DENV-2 by the intravenous (i.v.) route. Mice were treated or not with 150 μg of Ac2-26 at the time of infection and daily thereafter by the intraperitoneal (i.p.) route. Mice were culled in the indicated time points after infection, and the spleen was harvested virus RNA quantification. After cDNA conversion, RT-PCR was performed to quantitate DENV genome copies in the spleen, which was normalised to spleen mass. All results are expressed as mean values (horizontal bars). Results are expressed as mean (horizontal bars). Differences over time were compared by two-way ANOVA followed by Turkey’s multiple comparison test: ##p<0.01 and ####p<0.0001 versus 24-hr-infected group; &&&&p<0.0001 versus 48-hr-infected group; $$$$p<0.0001 versus 72-hr-infected group. There was no statistical difference between the treated and untreated groups, as evaluated by two-way ANOVA followed by Sidak’s multiple comparison test.
Figure 3—figure supplement 2
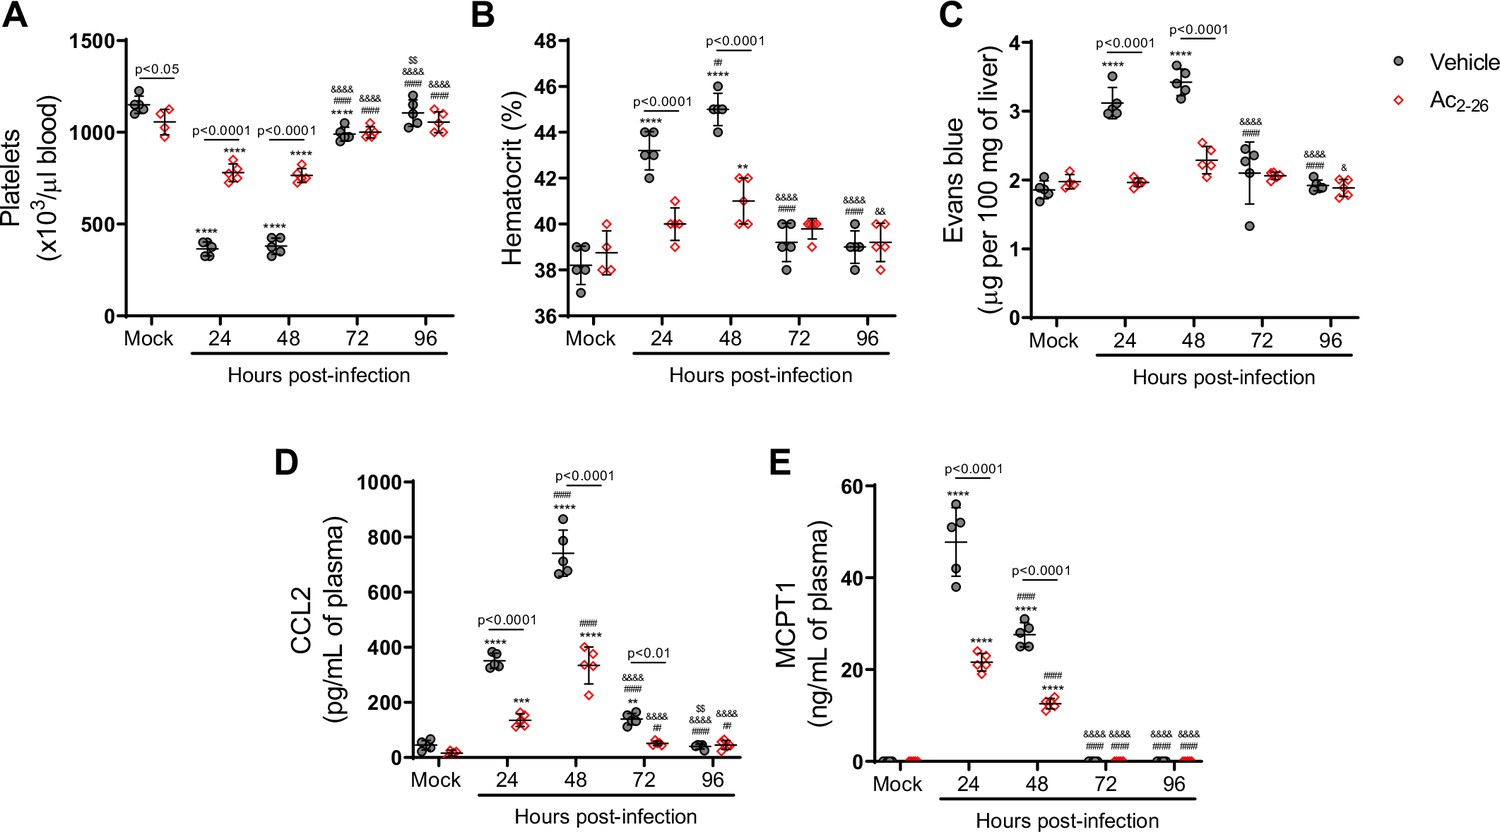
Ac2-26 peptide improve dengue virus (DENV)-induced manifestations in Annexin A1 (AnxA1) KO mice.
Five-week-old AnxA1 KO mice (BALB/c background) were mock-infected or inoculated with 1 × 10⁶ PFU of DENV-2 by the intravenous route (n = 5). Mice were treated with phosphate-buffered saline (grey circle) or 150 μg of Ac2-26 (red open diamond) at the time of infection and daily after that by the intraperitoneal route. Mice were culled in the indicated time points after infection, and blood and tissue were collected for the following analysis: (A) platelet counts, shown as the number of platelets × 103/μL of blood; (B) haematocrit levels, shown as % volume occupied by red blood cells; (C) vascular leakage assay with Evans’s blue dye, expressed as the amount of Evans Blue per 100 mg of the liver. Concentrations of (D) MCPT-1 and (E) CCL2 in plasma, quantified by ELISA and expressed as quantity per ml of plasma. All results are expressed as median (horizontal bars). All results are expressed as mean (horizontal bars). Differences over time were compared by two-way ANOVA followed by Turkey’s multiple comparison test: *p<0.05, **p<0.01, ***p<0.001, and ****p<0.0001 versus mock-infected group; #p<0.05, ##p<0.01, ###p<0.001, and ####p<0.0001 versus 24-hr-infected group; &p<0.05, &&p<0.01, &&&p<0.001, and &&&&p<0.0001 versus 48-hr-infected group; $p<0.05, $$p<0.01, $$$p<0.001, and $$$$p<0.0001 versus 72-hr-infected group; or as indicated in the graphs. Differences between vehicle- and AnxA1 peptide-treated animals were compared by two-way ANOVA followed by Sidak’s multiple comparison test, as indicated in the graphs.
Figure 4
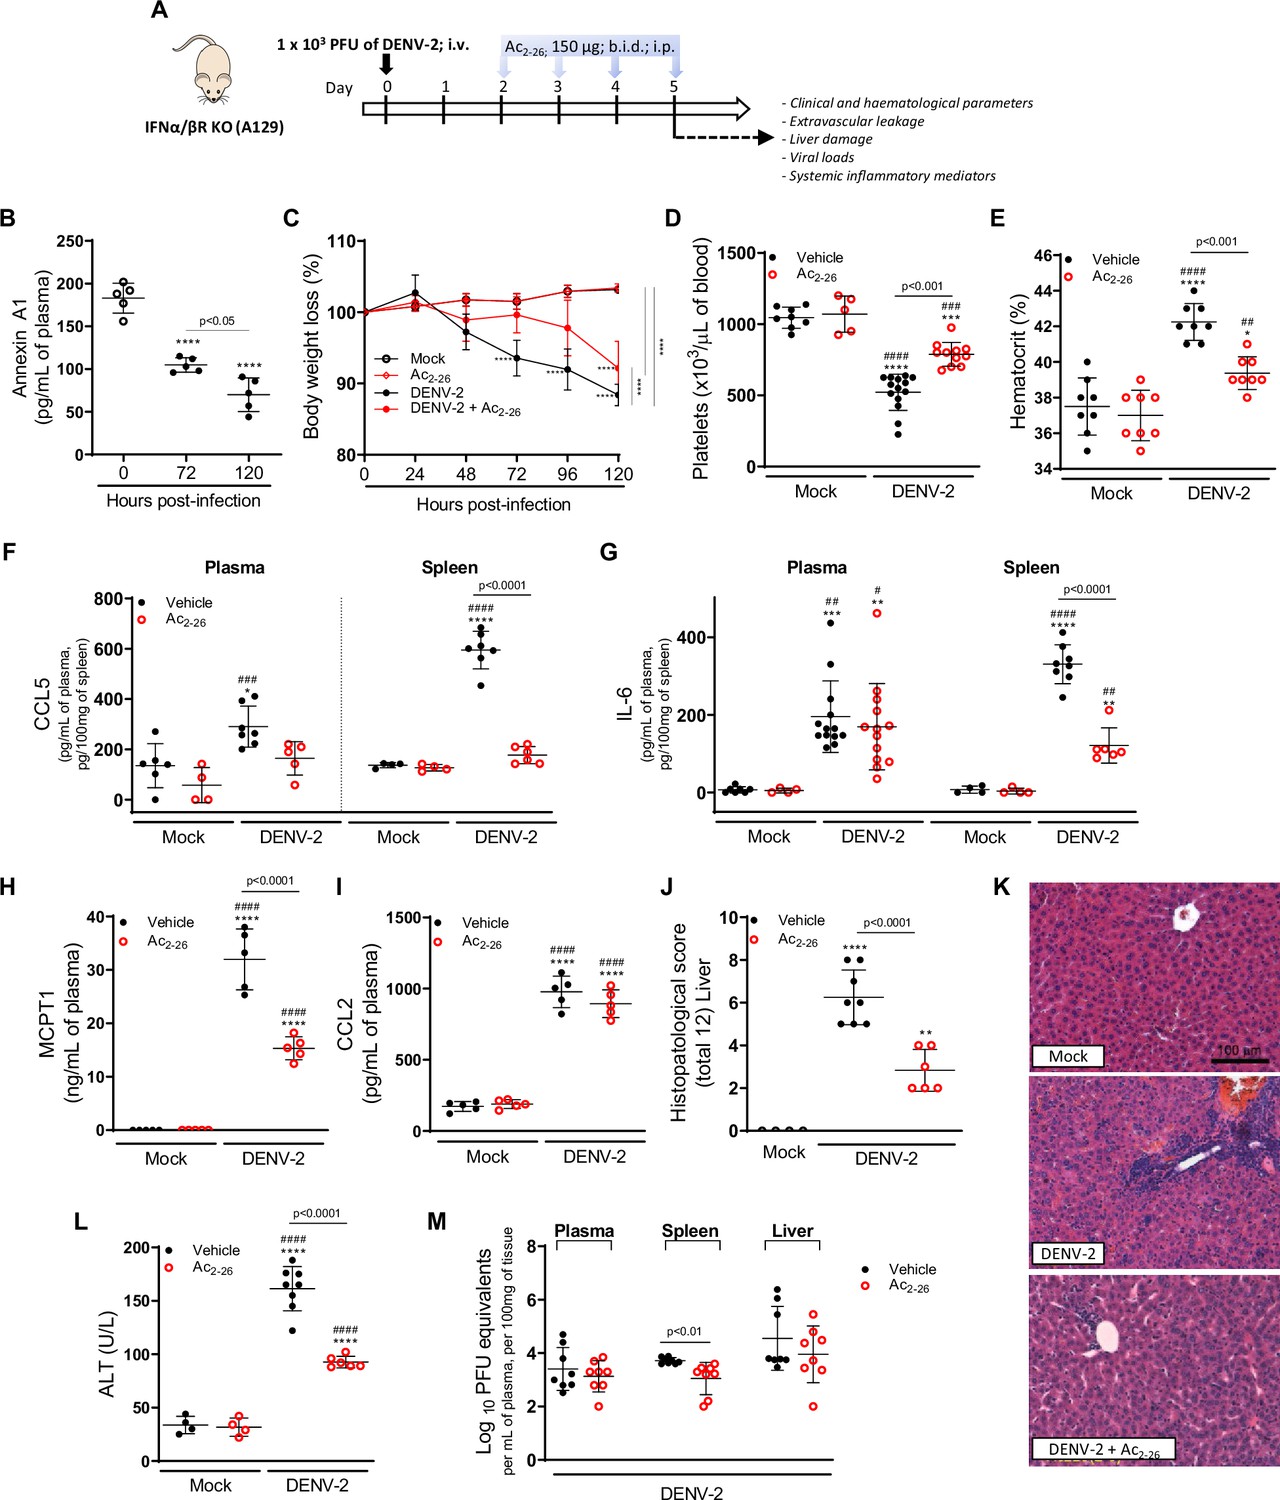
The protective effect of Ac2-26 administration in dengue virus (DENV)-infected A129 mice is viral load-independent.
(A) Experimental design. Eight-week-old A129 mice were mock-infected or inoculated with 1 × 10³ PFU of DENV-2 by the intravenous route. From day 2, mice, were treated or not twice a day with 150 μg of Ac2-26 by the intraperitoneal route. (B) Mice were culled in the indicated time points after infection, and plasma was collected for AnxA1 quantification by ELISA (n = 5). (C) Bodyweight loss was assessed in the indicated time points and expressed as a percentage of initial body weight. Mock (open white circles), Ac2-26 (open red circles), and DENV-2-infected mice treated with vehicle (black closed circles) or Ac2-26 (red closed circles); n = 4–8. Five days after infection, animals were culled, and blood and tissue collected for the following analysis: (D) platelet counts, shown as the number of platelets × 103 /μL of blood (n = 5–14); (E) haematocrit levels, shown as % volume occupied by red blood cells (n = 8); concentrations of (F) CCL5 and (G) IL-6 in plasma and spleen of mock and DENV-infected mice, treated or not with Ac2-26. Plasma Concentrations of (H) MCPT-1 and (I) CCL-2 in plasma of mock and DENV-infected mice, treated or not with Ac2-26. Cytokines and chemokines were assessed by ELISA and are shown as quantity per mL of plasma or per 100 mg of the spleen (CCL5, n = 4–7; IL-6, n = 4–13; MCPT-1, n = 5; CCL-2, n = 5). (J,K) Liver of control and DENV-2-infected mice, treated or not with the AnxA1 peptide, were collected, formalin-fixed, and processed into paraffin sections. (J) Histopathological scores and (K) representative images of liver sections stained with haematoxylin and eosin. Scale Bar, 100 μm. (L) Plasma alanine aminotransferase activity represented as units/L (H–J, n = 4–8). (M) Viral loads recovered from plasma, spleen, and liver of infected mice treated or not with Ac2-26, examined by plaque assay in Vero cells. Results are shown as the log of PFU/mL of plasma or as the log of PFU/mg of spleen and liver (n = 8). All results are expressed as mean (horizontal bars) ± SD. In C, differences over time and between treatments were compared by one-way ANOVA followed by Tukey’s multiple comparisons test: ****p<0.0001 versus mock-infected animals or comparing the different groups, as indicated in the graph. In B,D–L, data were analysed by one-way ANOVA followed by Tukey’s multiple comparisons test: *p<0.05, **p<0.01, ***p<0.001, and ****p<0.0001 versus mock-infected group; #p<0.05, ##p<0.01, ###p<0.001, and ####p<0.0001 versus mock-infected group treated with Ac2-26. In M, statistical analyses were performed by unpaired Student’s t-tests for each organ.
-
Figure 4—source data 1
Raw data for Figure 4B–J and L–M.
- https://cdn.elifesciences.org/articles/73853/elife-73853-fig4-data1-v2.xlsx
Figure 5
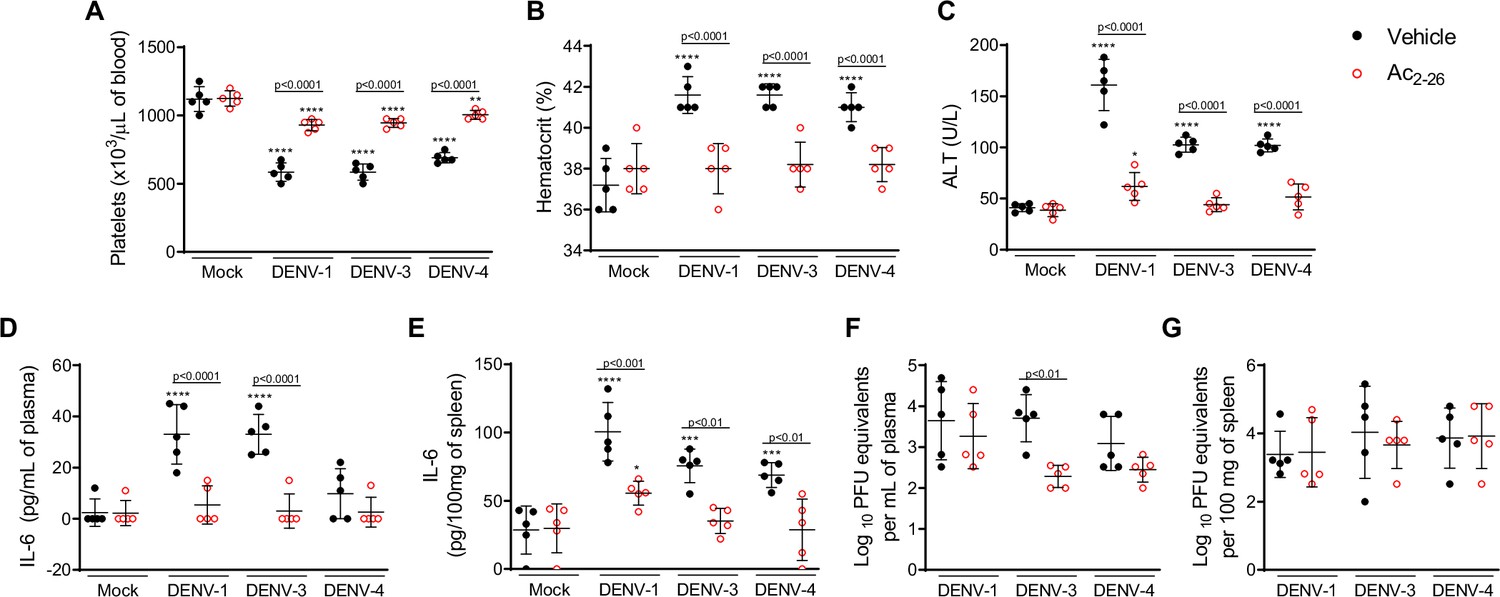
Treatment with Ac2-26 ameliorates disease induced by different dengue virus (DENV) serotypes, without significantly impacting viral loads.
Eight-week-old A129 mice were mock-infected or inoculated with 4 × 10⁴ PFU of DENV-1, 1 × 10³ PFU of DENV-3 or 1 × 10⁴ PFU of DENV-4 by the intravenous route (n = 5). From day 2, mice were treated with vehicle (black closed circles) or 150 μg of Ac2-26, intraperitoneal route twice a day (open red circles). Five days after infection, animals were culled, and blood and tissue were collected for the following analysis: (A) Platelet counts, shown as the number of platelets × 103 /μL of blood. (B) Haematocrit levels, shown as % volume occupied by red blood cells. (C) Plasma alanine aminotransferase activity represented as units/L. Concentrations of L-6 in (D) plasma and (E) spleen of mock- and DENV-infected mice, treated or not with Ac2-26, assessed by ELISA. Concentrations are shown as pg/mL of plasma or as pg/100 mg of the spleen. Viral loads recovered from (F) plasma and (G) spleen of mice infected with the three serotypes of DENV and treated or not with Ac2-26, evaluated by plaque assay in Vero cells. Results are shown as the log of PFU/mL of plasma or as the log of PFU/mg of spleen and liver. In A–E, data were analysed by two-way ANOVA followed by Dunnett’s (*p<0.05, **p<0.01, ***p<0.001, and ****p<0.0001 versus mock-infected group) or Šídák’s (statistical differences between infected mice treated with vehicle or Ac2-26, as indicated in the graphs) multiple comparison test. In F–G, statistical analysis was performed by two-way ANOVA followed by Šídák’s multiple comparison test, and differences between animals treated with vehicle or Ac2-26 are indicated in the graphs. Horizontal bars represent mean values.
-
Figure 5—source data 1
Raw data for Figure 5A–G.
- https://cdn.elifesciences.org/articles/73853/elife-73853-fig5-data1-v2.xlsx
Figure 6 with 1 supplement
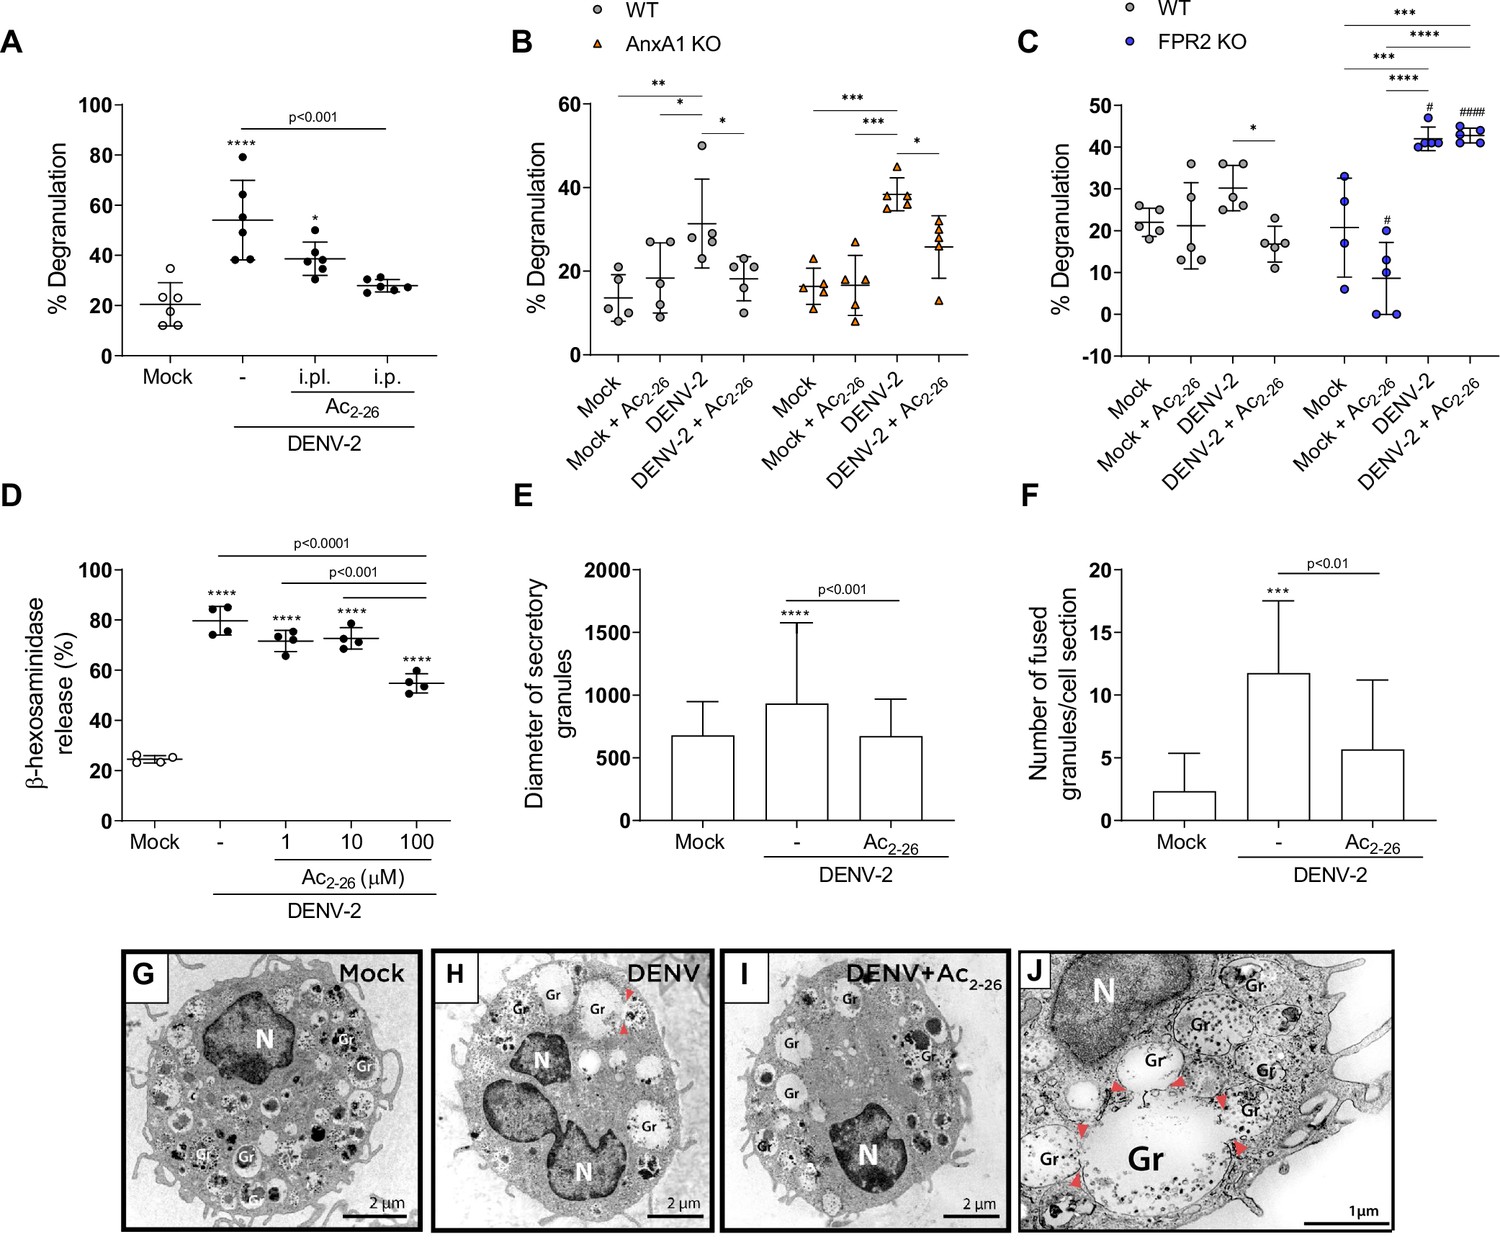
Ac2-26 diminishes mast cell degranulation induced by dengue virus (DENV) both in vivo and in vitro.
(A) WT BALB/c mice were treated with Ac2-26 or vehicle via footpad injections (i.pl.; 100 µg; 10 min prior to infection) or systemically (intraperitoneal (i.p.) route; 150 µg; 1 hr prior to infection) and infected with 1 × 10⁶ PFU of DENV-2 via footpad injections (n = 6). Three hours later, mice were euthanised and had their hind paws removed to analyse MC degranulation. (B) WT BALB/c mice and AnxA1 KO mice or (C) WT C57BL/6 and FPR2 KO mice were pre-treated with Ac2-26 (i.p; 150 µg) 1 hr before infection with 1 × 10⁶ PFU of DENV-2 via footpad injections (n = 5 for all groups, except for FPR2 KO mock, n = 4). Three hours later, mice were euthanised and had their hind paws removed to analyse MC degranulation. In A–C, mock-infected animals received an i.pl. injection of vehicle (sterile saline). (D) β-hexosaminidase activity of mouse bone marrow-derived mast cells (BMMCs), pretreated or not with increasing concentrations of Ac2-26 for 1 hr, and stimulated with DENV-2 (MOI of 1) for an extra 30 min (n = 4). The data show the percentage release of cellular β-hexosaminidase into the medium and represent two independent experiments. (E–J) Transmission electron microscopy of BMMC, pretreated or not with Ac2-26 100 μM for 1 hr and challenged with DENV-2 (MOI of 1) for an extra 30 min. Significant increases in (E) granule diameters and (F) number of fused granules occur after stimulation with DENV-2 compared to both mock-stimulated cells and DENV-stimulated cells treated with Ac2-26 peptide. In E, bars represent the mean diameter ± SD of 372, 360, and 384 secretory granules analysed in the mock, DENV-2 and DENV-2+Ac2-26 groups, respectively. In F, bars represent the mean number of fused granules ± SD analysed in 15 sections per group. (G) Mock-stimulated BMMC show maturing cytoplasmic granules accumulating electron-dense material. (H) Granule enlargement, emptying, and fusion are observed in response to DENV-2 infection. (I) Ac2-26 peptide treatment reduces morphological features of secretion evoked by DENV infection. Scale bar, 2 μm. (J) Granule fusions (arrowhead) in untreated DENV-infected BMMC are seen in higher magnification (scale bar, 1 μm). A,D,F, statistical analysis was performed by one-way ANOVA followed by Tukey’s multiple comparisons test: ***p<0.001 and ****p<0.0001 compared to mock-infected cells, or as depicted on the graphs. B,C, differences between genotypes were compared by two-way ANOVA followed by Sidak’s multiple comparison test. #p<0.05, ####p<0.001 compared to WT animals receiveing the same treatment/challenge. Differences between treatments were compared by two-way ANOVA followed by Turkey’s multiple comparison test as indicated in the graphs: *p<0.05, **p<0.01, ***p<0.001 and ****p<0.0001 .E, data analysed by Kruskal–Wallis followed by Dunn multiple comparison test. Gr, secretory granules; N, nucleus.
-
Figure 6—source data 1
Raw data for Figure 6A–F.
- https://cdn.elifesciences.org/articles/73853/elife-73853-fig6-data1-v2.xlsx
Figure 6—figure supplement 1
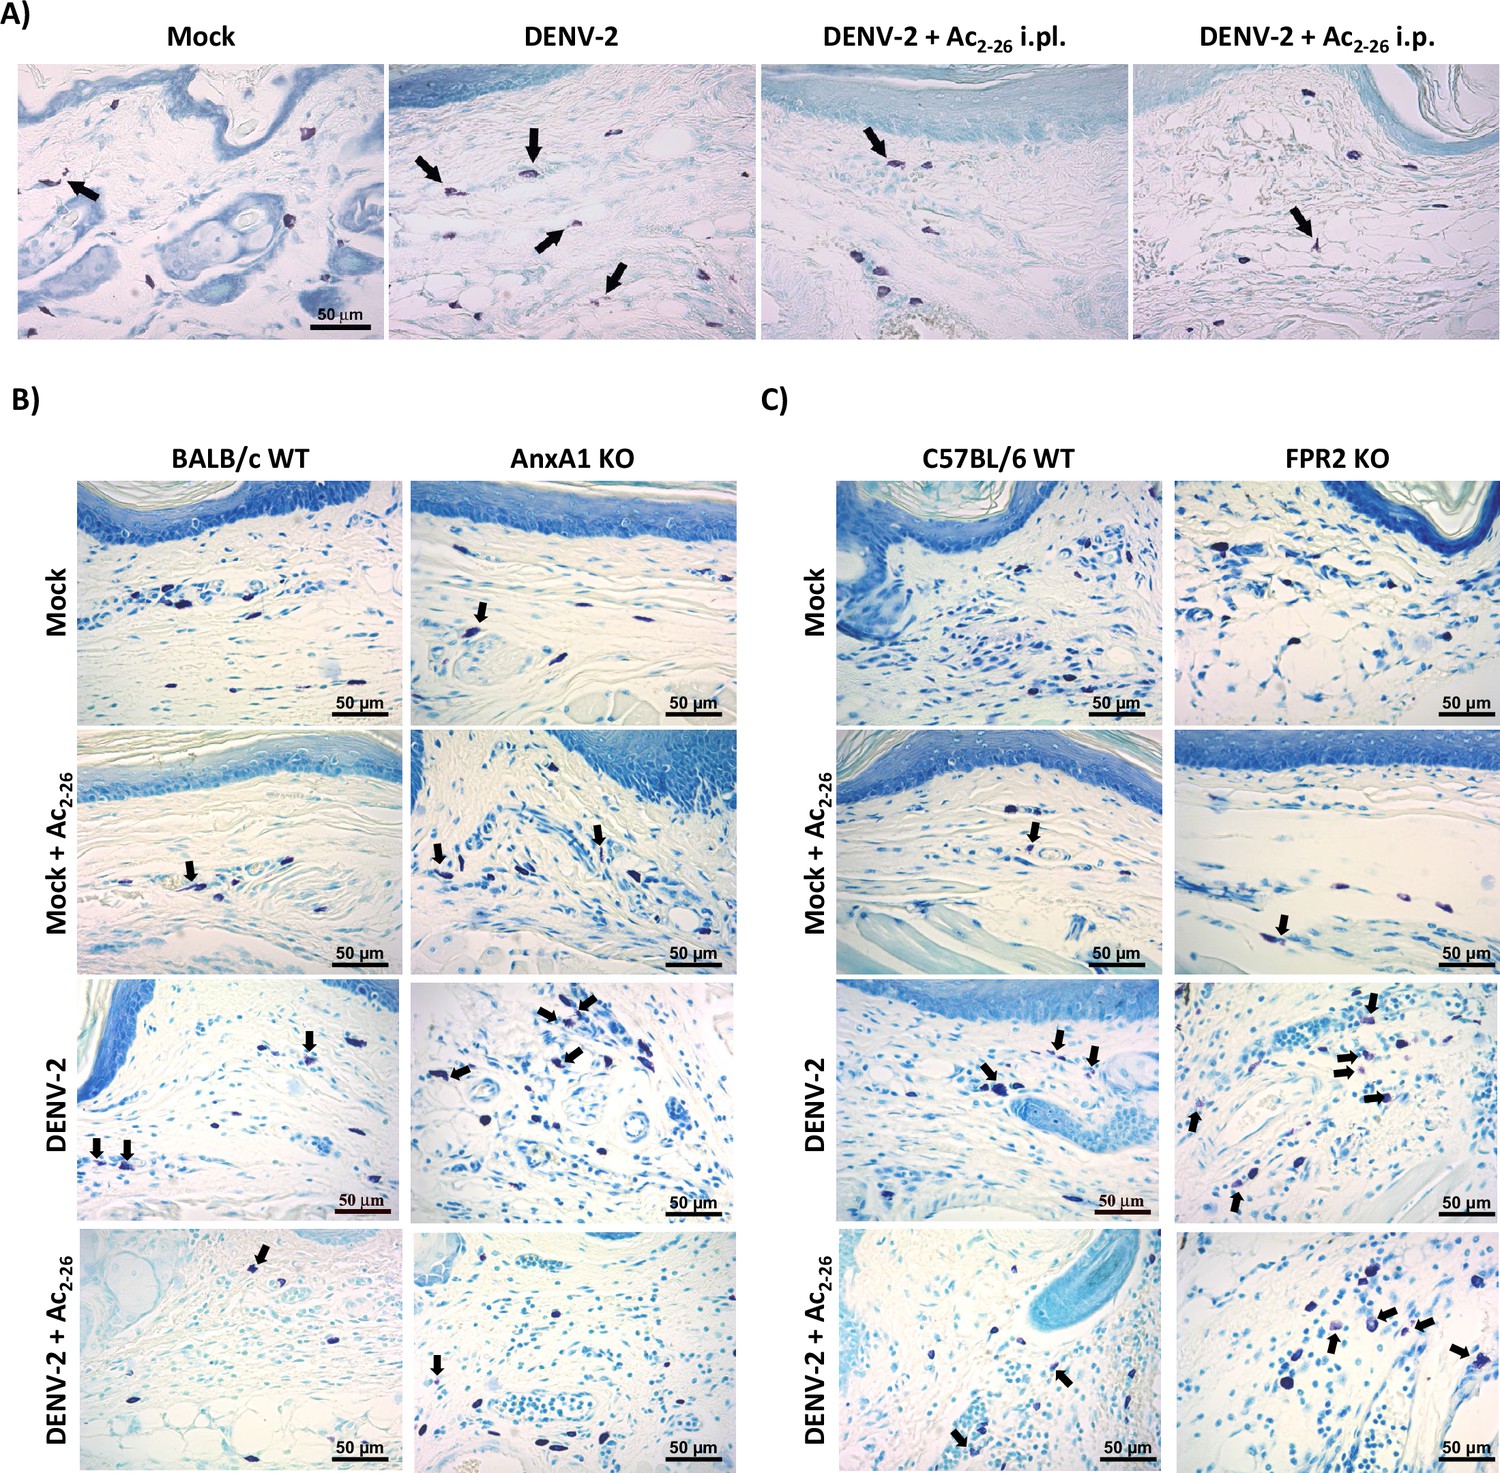
Effect of Ac2-26 treatment in mast cell degranulation induced by dengue virus (DENV-2).
(A) Representative images of footpad sections of BALB/c mice pre-treated with Ac2-26 via footpad (i.pl.) or intraperitoneal (i.p.) injections and infected with DENV-2 via footpad injections. (B,C) Representative images of footpad sections of (B) WT BALB/c mice and AnxA1 KO mice or (C) WT C57BL/6 and FPR2 KO mice pre-treated with Ac2-26 (i.p.; 150 µg) or vehicle for 1 hr and infected with 1 × 10⁶ PFU of DENV-2 via footpad injections. Mock-infected controls received an i.pl. injection of 20 µL of sterile saline. Animals were euthanised 3 hr post-infection and had their hind paws removed for the histological analysis of mast cell degranulation. Arrows indicate degranulated cells, visualised by toluidine blue staining.
Tables
Table 1
Demographics and laboratory characteristics of the study population from the control group, non-severe dengue (non-SD, outpatients), and severe dengue (SD, inpatients) groups during seasonal transmission 2013–2016.
| Characteristics and diagnosis of the study population | Control (n = 41) | Non-SD (n = 31) | SD (n = 29) |
|---|---|---|---|
| Age a | 30 (19–58) ** | 31 (17–65) * | 42 (19–76) |
| Gender (F) | 71% (29/41) | 55% (17/31) | 52% (15/29) |
| RT-PCR (n) | 0% (0/41) | 74% (23/31) | 38% (11/29) |
| ELISA IgM (n) | 0% (0/41) | 61% (19/31) | 100% (29/29) |
| Blood collection 1–5 days after symptom onset | - | 58% (18/31) | 45% (13/29) |
| Blood collection 6–12 days after symptom onset | - | 42% (13/31) | 55% (16/29) |
-
A geometric mean (min-max).
-
Blood collection: Fisher Test p>0.4.
-
Age: Kruskal–Wallis Test p<0.003; Gender: Fisher Test p>0.1.
Additional files
-
Supplementary file 1
Oligo primers and probes used in clinical samples.
Patients were included in this study if DENV infection was confirmed by dengue specific IgM capture ELISA and/or real-time reverse transcriptase-polymerase chain reaction (RT-PCR). RT-PCR was conducted in RNA purified from human plasma using the primers and probes depicted in this table.
- https://cdn.elifesciences.org/articles/73853/elife-73853-supp1-v2.docx
-
Transparent reporting form
- https://cdn.elifesciences.org/articles/73853/elife-73853-transrepform1-v2.docx
Download links
A two-part list of links to download the article, or parts of the article, in various formats.
Downloads (link to download the article as PDF)
Open citations (links to open the citations from this article in various online reference manager services)
Cite this article (links to download the citations from this article in formats compatible with various reference manager tools)
Targeting the Annexin A1-FPR2/ALX pathway for host-directed therapy in dengue disease
eLife 11:e73853.
https://doi.org/10.7554/eLife.73853


